Iron County, MO Map & Demographics
Iron County Map
Iron County Overview
$26,798
PER CAPITA INCOME
$69,508
AVG FAMILY INCOME
$53,401
AVG HOUSEHOLD INCOME
21.9%
WAGE / INCOME GAP [ % ]
78.1¢/ $1
WAGE / INCOME GAP [ $ ]
$9,757
FAMILY INCOME DEFICIT
0.43
INEQUALITY / GINI INDEX
9,538
TOTAL POPULATION
4,762
MALE POPULATION
4,776
FEMALE POPULATION
99.71
MALES / 100 FEMALES
100.29
FEMALES / 100 MALES
45.1
MEDIAN AGE
2.9
AVG FAMILY SIZE
2.4
AVG HOUSEHOLD SIZE
4,053
LABOR FORCE [ PEOPLE ]
52.4%
PERCENT IN LABOR FORCE
3.3%
UNEMPLOYMENT RATE
Iron County Area Codes
Income in Iron County
Income Overview in Iron County
Per Capita Income in Iron County is $26,798, while median incomes of families and households are $69,508 and $53,401 respectively.
| Characteristic | Number | Measure |
| Per Capita Income | 9,538 | $26,798 |
| Median Family Income | 2,611 | $69,508 |
| Mean Family Income | 2,611 | $76,909 |
| Median Household Income | 3,821 | $53,401 |
| Mean Household Income | 3,821 | $64,708 |
| Income Deficit | 2,611 | $9,757 |
| Wage / Income Gap (%) | 9,538 | 21.93% |
| Wage / Income Gap ($) | 9,538 | 78.07¢ per $1 |
| Gini / Inequality Index | 9,538 | 0.43 |
Earnings by Sex in Iron County
Average Earnings in Iron County are $31,205, $34,884 for men and $27,233 for women, a difference of 21.9%.
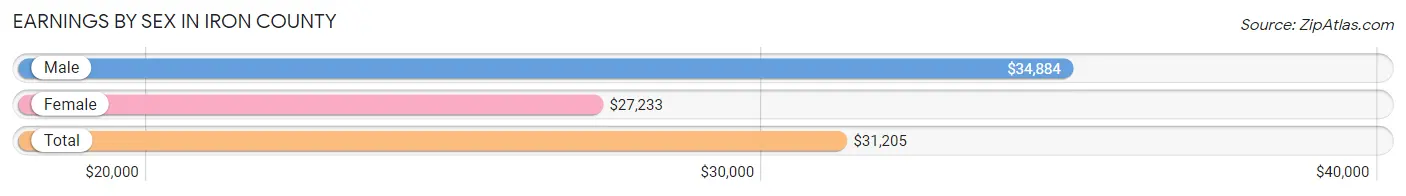
| Sex | Number | Average Earnings |
| Male | 2,417 (53.8%) | $34,884 |
| Female | 2,074 (46.2%) | $27,233 |
| Total | 4,491 (100.0%) | $31,205 |
Earnings by Sex by Income Bracket in Iron County
The most common earnings brackets in Iron County are $75,000 to $99,999 for men (271 | 11.2%) and $25,000 to $29,999 for women (234 | 11.3%).
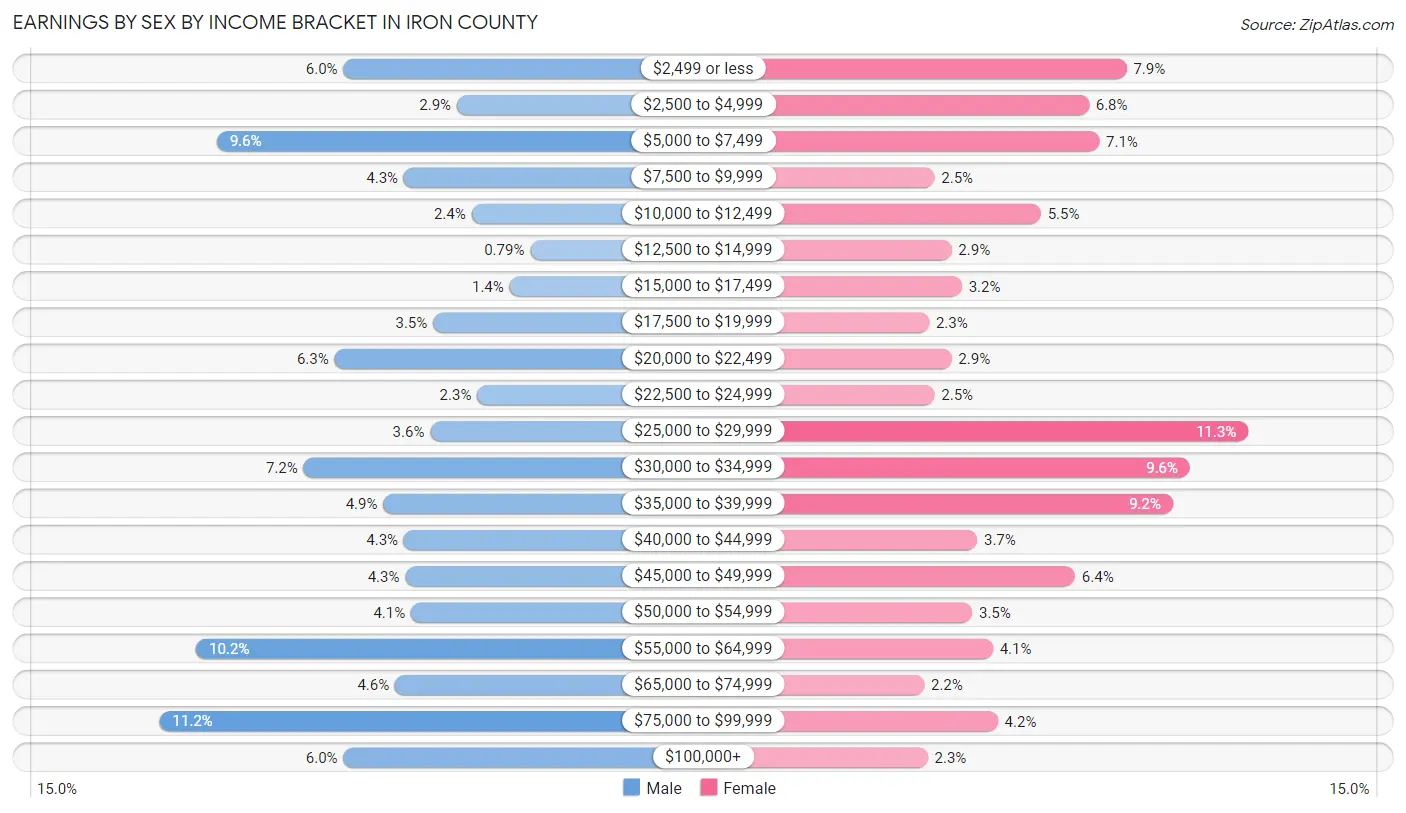
| Income | Male | Female |
| $2,499 or less | 146 (6.0%) | 163 (7.9%) |
| $2,500 to $4,999 | 69 (2.9%) | 141 (6.8%) |
| $5,000 to $7,499 | 232 (9.6%) | 147 (7.1%) |
| $7,500 to $9,999 | 105 (4.3%) | 51 (2.5%) |
| $10,000 to $12,499 | 59 (2.4%) | 113 (5.4%) |
| $12,500 to $14,999 | 19 (0.8%) | 61 (2.9%) |
| $15,000 to $17,499 | 33 (1.4%) | 67 (3.2%) |
| $17,500 to $19,999 | 85 (3.5%) | 48 (2.3%) |
| $20,000 to $22,499 | 152 (6.3%) | 61 (2.9%) |
| $22,500 to $24,999 | 55 (2.3%) | 51 (2.5%) |
| $25,000 to $29,999 | 87 (3.6%) | 234 (11.3%) |
| $30,000 to $34,999 | 173 (7.2%) | 200 (9.6%) |
| $35,000 to $39,999 | 119 (4.9%) | 190 (9.2%) |
| $40,000 to $44,999 | 105 (4.3%) | 76 (3.7%) |
| $45,000 to $49,999 | 104 (4.3%) | 133 (6.4%) |
| $50,000 to $54,999 | 100 (4.1%) | 73 (3.5%) |
| $55,000 to $64,999 | 246 (10.2%) | 85 (4.1%) |
| $65,000 to $74,999 | 111 (4.6%) | 45 (2.2%) |
| $75,000 to $99,999 | 271 (11.2%) | 88 (4.2%) |
| $100,000+ | 146 (6.0%) | 47 (2.3%) |
| Total | 2,417 (100.0%) | 2,074 (100.0%) |
Earnings by Sex by Educational Attainment in Iron County
Average earnings in Iron County are $39,645 for men and $30,583 for women, a difference of 22.9%. Men with an educational attainment of college or associate's degree enjoy the highest average annual earnings of $52,708, while those with high school diploma education earn the least with $34,614. Women with an educational attainment of graduate degree earn the most with the average annual earnings of $79,107, while those with high school diploma education have the smallest earnings of $26,063.
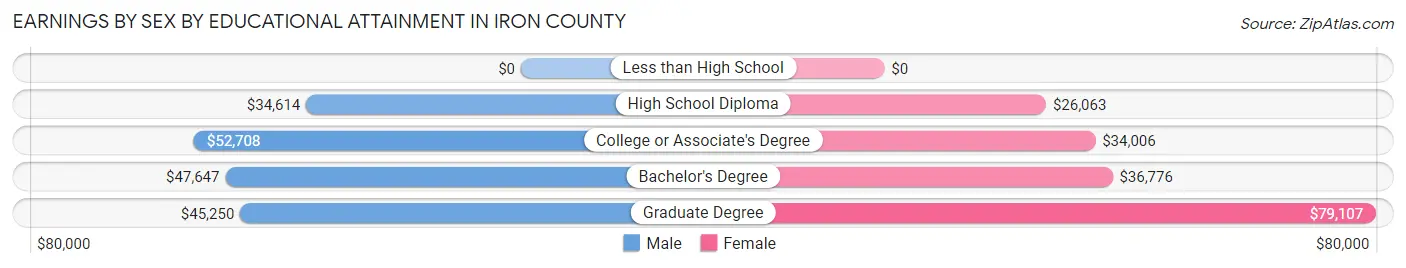
| Educational Attainment | Male Income | Female Income |
| Less than High School | - | - |
| High School Diploma | $34,614 | $26,063 |
| College or Associate's Degree | $52,708 | $34,006 |
| Bachelor's Degree | $47,647 | $36,776 |
| Graduate Degree | $45,250 | $79,107 |
| Total | $39,645 | $30,583 |
Family Income in Iron County
Family Income Brackets in Iron County
According to the Iron County family income data, there are 512 families falling into the $100,000 to $149,999 income range, which is the most common income bracket and makes up 19.6% of all families. Conversely, the $200,000+ income bracket is the least frequent group with only 84 families (3.2%) belonging to this category.
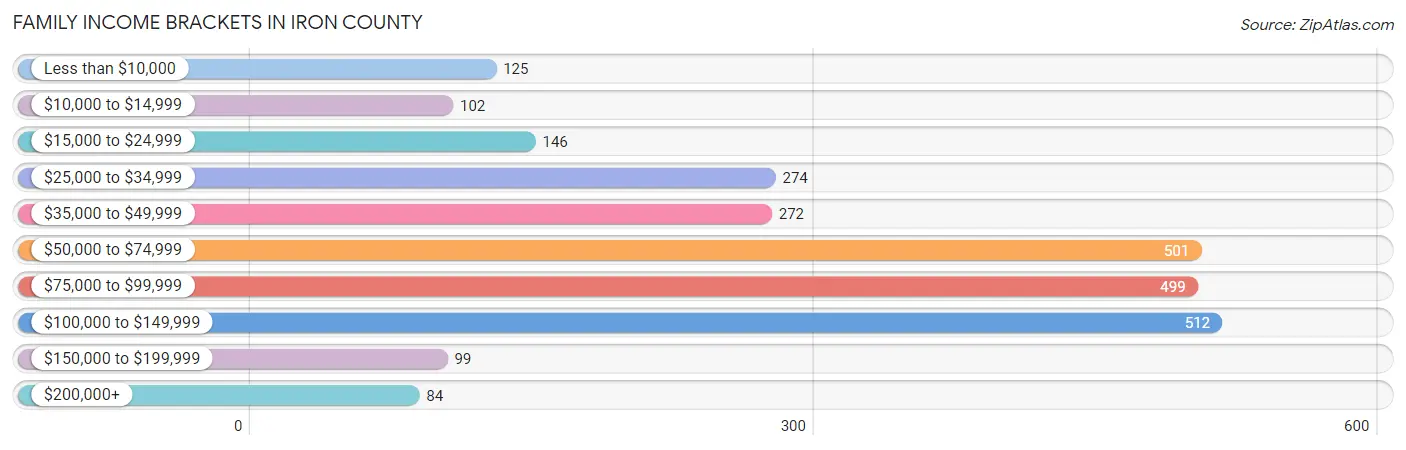
| Income Bracket | # Families | % Families |
| Less than $10,000 | 125 | 4.8% |
| $10,000 to $14,999 | 102 | 3.9% |
| $15,000 to $24,999 | 146 | 5.6% |
| $25,000 to $34,999 | 274 | 10.5% |
| $35,000 to $49,999 | 272 | 10.4% |
| $50,000 to $74,999 | 501 | 19.2% |
| $75,000 to $99,999 | 499 | 19.1% |
| $100,000 to $149,999 | 512 | 19.6% |
| $150,000 to $199,999 | 99 | 3.8% |
| $200,000+ | 84 | 3.2% |
Family Income by Famaliy Size in Iron County
5-person families (190 | 7.3%) account for the highest median family income in Iron County with $102,969 per family, while 2-person families (1,409 | 54.0%) have the highest median income of $33,554 per family member.
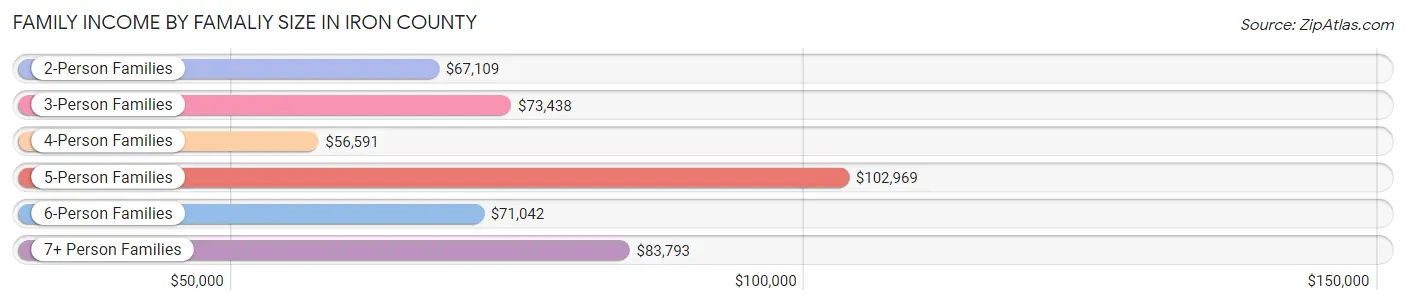
| Income Bracket | # Families | Median Income |
| 2-Person Families | 1,409 (54.0%) | $67,109 |
| 3-Person Families | 465 (17.8%) | $73,438 |
| 4-Person Families | 386 (14.8%) | $56,591 |
| 5-Person Families | 190 (7.3%) | $102,969 |
| 6-Person Families | 87 (3.3%) | $71,042 |
| 7+ Person Families | 74 (2.8%) | $83,793 |
| Total | 2,611 (100.0%) | $69,508 |
Family Income by Number of Earners in Iron County
The median family income in Iron County is $69,508, with families comprising 3+ earners (248) having the highest median family income of $99,048, while families with no earners (417) have the lowest median family income of $42,120, accounting for 9.5% and 16.0% of families, respectively.
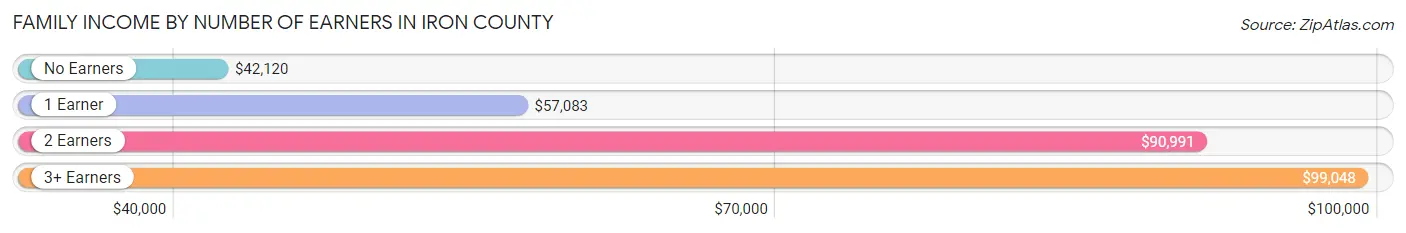
| Number of Earners | # Families | Median Income |
| No Earners | 417 (16.0%) | $42,120 |
| 1 Earner | 1,152 (44.1%) | $57,083 |
| 2 Earners | 794 (30.4%) | $90,991 |
| 3+ Earners | 248 (9.5%) | $99,048 |
| Total | 2,611 (100.0%) | $69,508 |
Household Income in Iron County
Household Income Brackets in Iron County
With 630 households falling in the category, the $75,000 to $99,999 income range is the most frequent in Iron County, accounting for 16.5% of all households. In contrast, only 92 households (2.4%) fall into the $200,000+ income bracket, making it the least populous group.
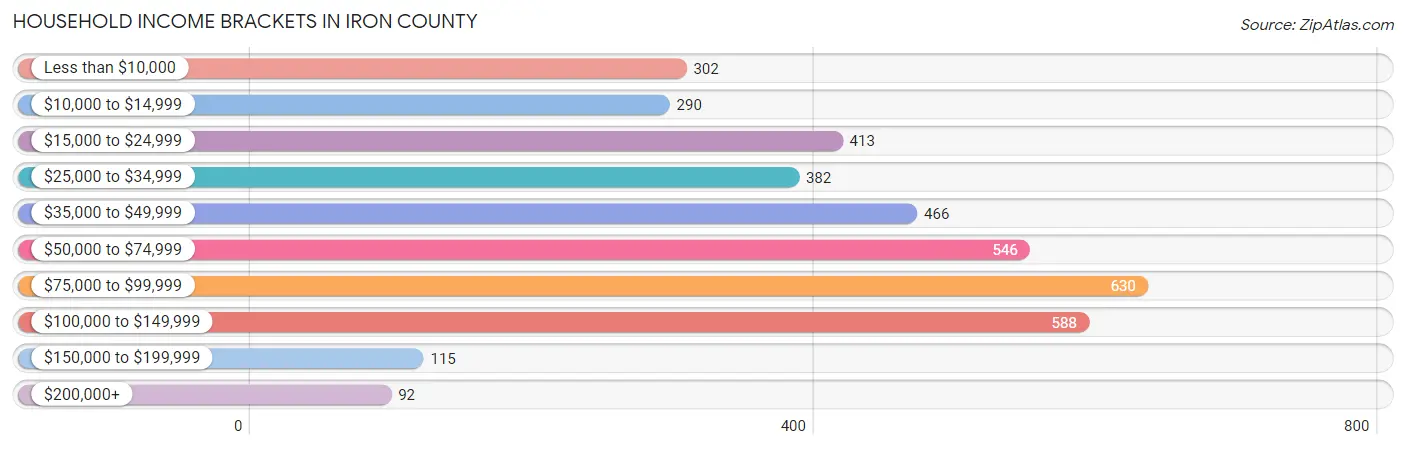
| Income Bracket | # Households | % Households |
| Less than $10,000 | 302 | 7.9% |
| $10,000 to $14,999 | 290 | 7.6% |
| $15,000 to $24,999 | 413 | 10.8% |
| $25,000 to $34,999 | 382 | 10.0% |
| $35,000 to $49,999 | 466 | 12.2% |
| $50,000 to $74,999 | 546 | 14.3% |
| $75,000 to $99,999 | 630 | 16.5% |
| $100,000 to $149,999 | 588 | 15.4% |
| $150,000 to $199,999 | 115 | 3.0% |
| $200,000+ | 92 | 2.4% |
Household Income by Householder Age in Iron County
The median household income in Iron County is $53,401, with the highest median household income of $66,442 found in the 25 to 44 years age bracket for the primary householder. A total of 1,058 households (27.7%) fall into this category. Meanwhile, the 15 to 24 years age bracket for the primary householder has the lowest median household income of $36,583, with 91 households (2.4%) in this group.
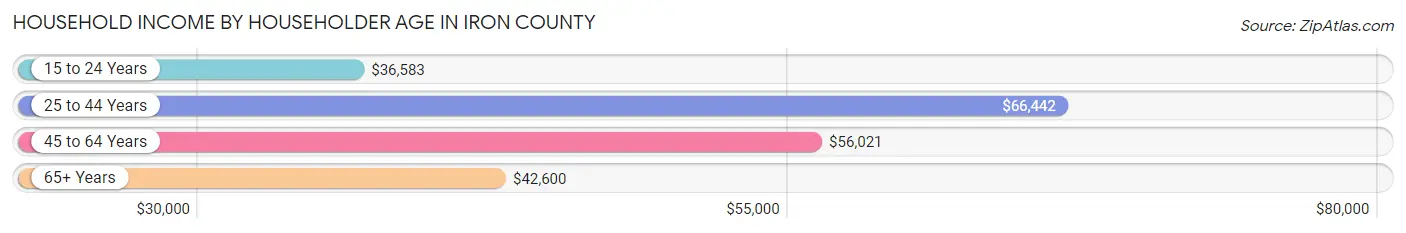
| Income Bracket | # Households | Median Income |
| 15 to 24 Years | 91 (2.4%) | $36,583 |
| 25 to 44 Years | 1,058 (27.7%) | $66,442 |
| 45 to 64 Years | 1,550 (40.6%) | $56,021 |
| 65+ Years | 1,122 (29.4%) | $42,600 |
| Total | 3,821 (100.0%) | $53,401 |
Poverty in Iron County
Income Below Poverty by Sex and Age in Iron County
With 17.8% poverty level for males and 21.3% for females among the residents of Iron County, 55 to 64 year old males and 6 to 11 year old females are the most vulnerable to poverty, with 235 males (31.4%) and 132 females (37.0%) in their respective age groups living below the poverty level.
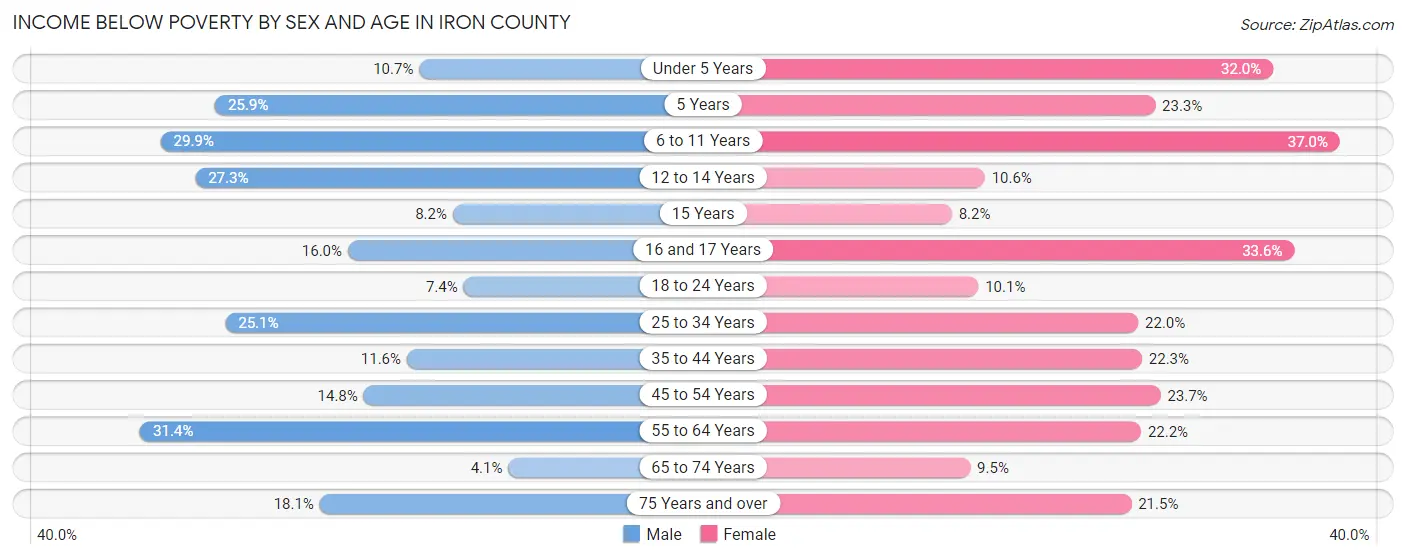
| Age Bracket | Male | Female |
| Under 5 Years | 29 (10.7%) | 73 (32.0%) |
| 5 Years | 15 (25.9%) | 10 (23.3%) |
| 6 to 11 Years | 93 (29.9%) | 132 (37.0%) |
| 12 to 14 Years | 47 (27.3%) | 14 (10.6%) |
| 15 Years | 11 (8.2%) | 4 (8.2%) |
| 16 and 17 Years | 8 (16.0%) | 44 (33.6%) |
| 18 to 24 Years | 26 (7.4%) | 32 (10.1%) |
| 25 to 34 Years | 122 (25.1%) | 108 (22.0%) |
| 35 to 44 Years | 61 (11.6%) | 129 (22.3%) |
| 45 to 54 Years | 93 (14.8%) | 132 (23.7%) |
| 55 to 64 Years | 235 (31.4%) | 163 (22.2%) |
| 65 to 74 Years | 23 (4.1%) | 59 (9.5%) |
| 75 Years and over | 51 (18.1%) | 78 (21.5%) |
| Total | 814 (17.8%) | 978 (21.3%) |
Income Above Poverty by Sex and Age in Iron County
According to the poverty statistics in Iron County, males aged 65 to 74 years and females aged 15 years are the age groups that are most secure financially, with 95.9% of males and 91.8% of females in these age groups living above the poverty line.
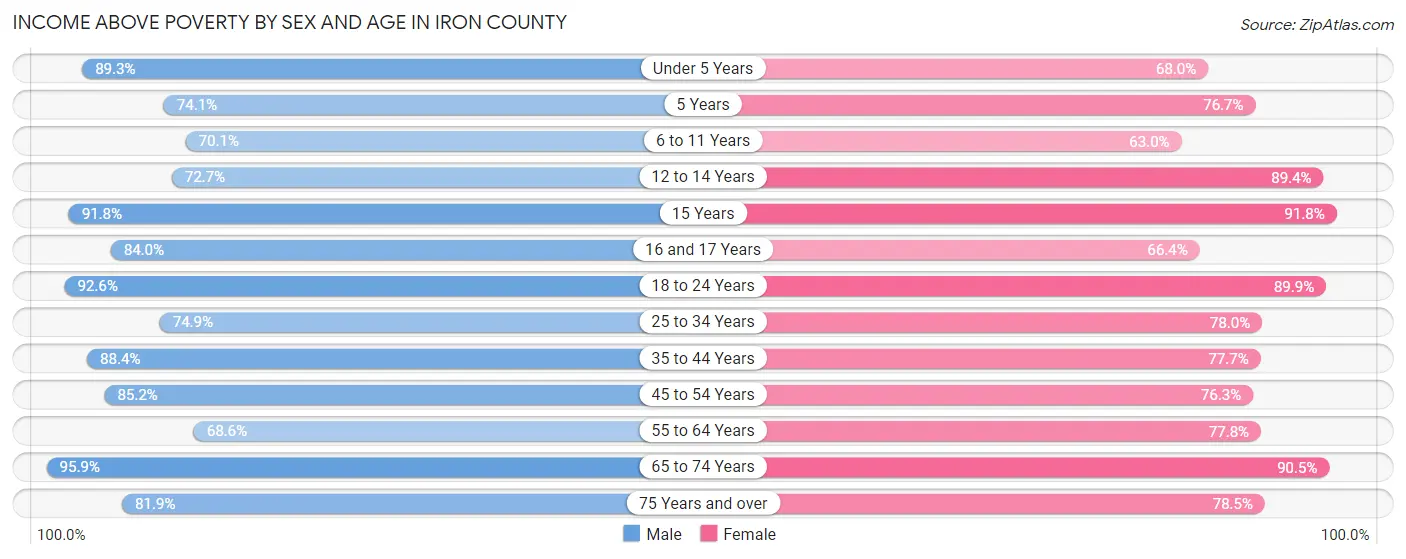
| Age Bracket | Male | Female |
| Under 5 Years | 242 (89.3%) | 155 (68.0%) |
| 5 Years | 43 (74.1%) | 33 (76.7%) |
| 6 to 11 Years | 218 (70.1%) | 225 (63.0%) |
| 12 to 14 Years | 125 (72.7%) | 118 (89.4%) |
| 15 Years | 123 (91.8%) | 45 (91.8%) |
| 16 and 17 Years | 42 (84.0%) | 87 (66.4%) |
| 18 to 24 Years | 325 (92.6%) | 284 (89.9%) |
| 25 to 34 Years | 364 (74.9%) | 383 (78.0%) |
| 35 to 44 Years | 464 (88.4%) | 450 (77.7%) |
| 45 to 54 Years | 534 (85.2%) | 426 (76.3%) |
| 55 to 64 Years | 513 (68.6%) | 571 (77.8%) |
| 65 to 74 Years | 539 (95.9%) | 560 (90.5%) |
| 75 Years and over | 231 (81.9%) | 285 (78.5%) |
| Total | 3,763 (82.2%) | 3,622 (78.7%) |
Income Below Poverty Among Married-Couple Families in Iron County
The poverty statistics for married-couple families in Iron County show that 9.9% or 186 of the total 1,887 families live below the poverty line. Families with 5 or more children have the highest poverty rate of 70.0%, comprising of 7 families. On the other hand, families with 3 or 4 children have the lowest poverty rate of 2.4%, which includes 5 families.
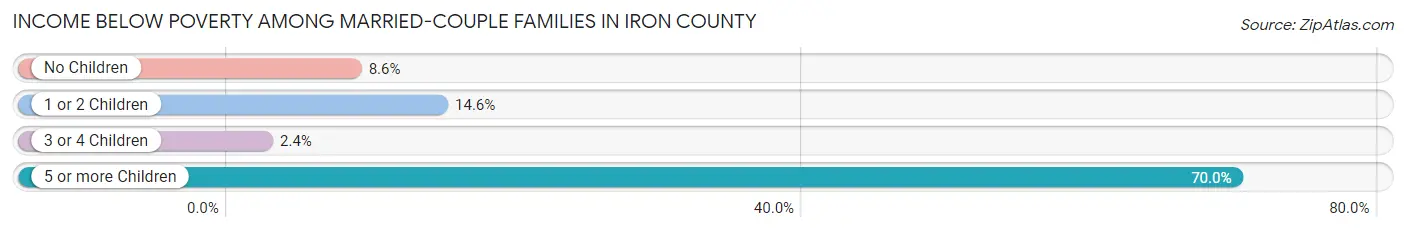
| Children | Above Poverty | Below Poverty |
| No Children | 1,072 (91.4%) | 101 (8.6%) |
| 1 or 2 Children | 426 (85.4%) | 73 (14.6%) |
| 3 or 4 Children | 200 (97.6%) | 5 (2.4%) |
| 5 or more Children | 3 (30.0%) | 7 (70.0%) |
| Total | 1,701 (90.1%) | 186 (9.9%) |
Income Below Poverty Among Single-Parent Households in Iron County
According to the poverty data in Iron County, 15.1% or 38 single-father households and 37.1% or 175 single-mother households are living below the poverty line. Among single-father households, those with 3 or 4 children have the highest poverty rate, with 20 households (50.0%) experiencing poverty. Likewise, among single-mother households, those with 5 or more children have the highest poverty rate, with 3 households (100.0%) falling below the poverty line.
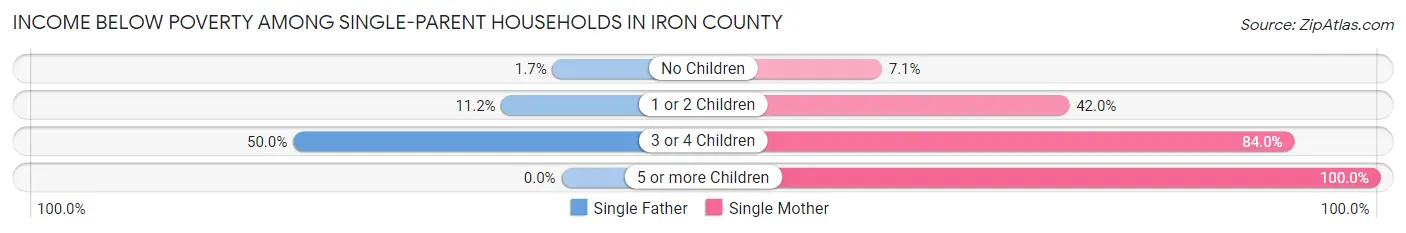
| Children | Single Father | Single Mother |
| No Children | 1 (1.7%) | 12 (7.1%) |
| 1 or 2 Children | 17 (11.2%) | 92 (42.0%) |
| 3 or 4 Children | 20 (50.0%) | 68 (84.0%) |
| 5 or more Children | 0 (0.0%) | 3 (100.0%) |
| Total | 38 (15.1%) | 175 (37.1%) |
Income Below Poverty Among Married-Couple vs Single-Parent Households in Iron County
The poverty data for Iron County shows that 186 of the married-couple family households (9.9%) and 213 of the single-parent households (29.4%) are living below the poverty level. Within the married-couple family households, those with 5 or more children have the highest poverty rate, with 7 households (70.0%) falling below the poverty line. Among the single-parent households, those with 5 or more children have the highest poverty rate, with 3 household (100.0%) living below poverty.
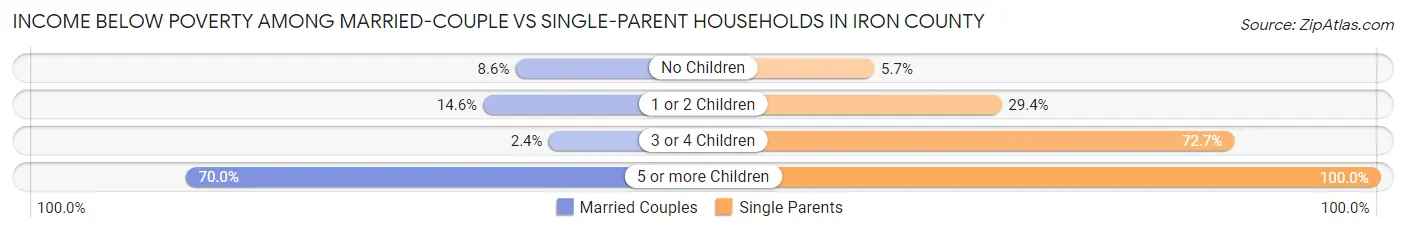
| Children | Married-Couple Families | Single-Parent Households |
| No Children | 101 (8.6%) | 13 (5.7%) |
| 1 or 2 Children | 73 (14.6%) | 109 (29.4%) |
| 3 or 4 Children | 5 (2.4%) | 88 (72.7%) |
| 5 or more Children | 7 (70.0%) | 3 (100.0%) |
| Total | 186 (9.9%) | 213 (29.4%) |
Race in Iron County
The most populous races in Iron County are White / Caucasian (8,827 | 92.5%), Two or more Races (499 | 5.2%), and Hispanic or Latino (191 | 2.0%).
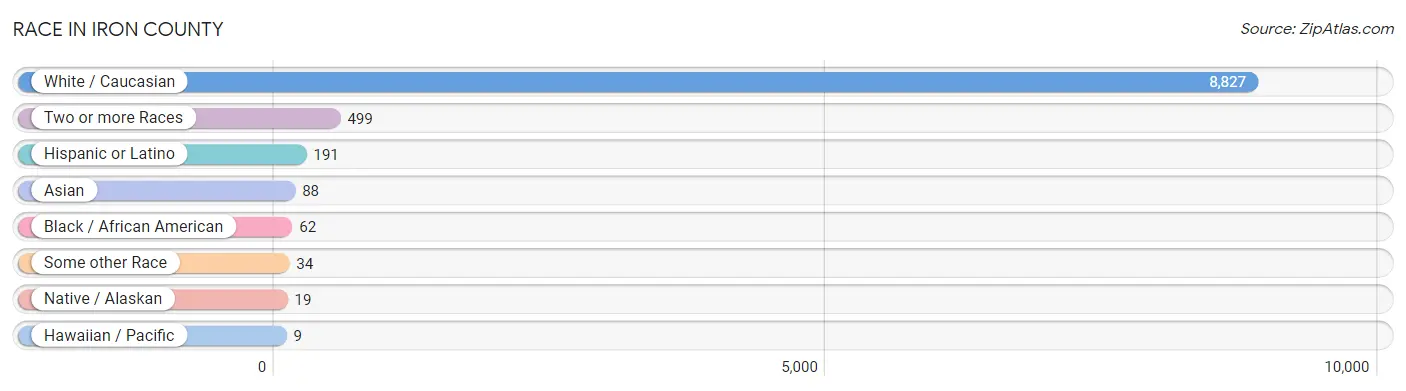
| Race | # Population | % Population |
| Asian | 88 | 0.9% |
| Black / African American | 62 | 0.6% |
| Hawaiian / Pacific | 9 | 0.1% |
| Hispanic or Latino | 191 | 2.0% |
| Native / Alaskan | 19 | 0.2% |
| White / Caucasian | 8,827 | 92.5% |
| Two or more Races | 499 | 5.2% |
| Some other Race | 34 | 0.4% |
| Total | 9,538 | 100.0% |
Ancestry in Iron County
The most populous ancestries reported in Iron County are German (1,473 | 15.4%), American (1,187 | 12.4%), Irish (1,062 | 11.1%), English (825 | 8.6%), and French (266 | 2.8%), together accounting for 50.5% of all Iron County residents.
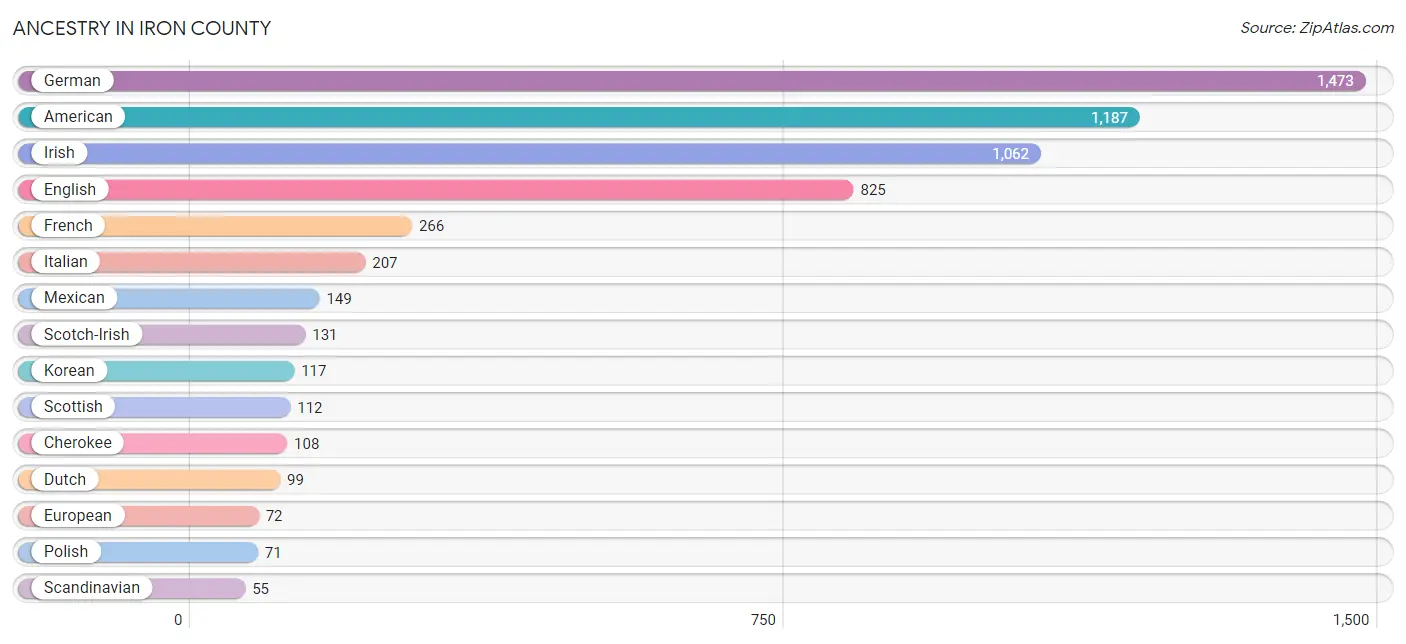
| Ancestry | # Population | % Population |
| American | 1,187 | 12.4% |
| Apache | 1 | 0.0% |
| Austrian | 5 | 0.1% |
| Belgian | 5 | 0.1% |
| Blackfeet | 2 | 0.0% |
| British | 7 | 0.1% |
| Burmese | 4 | 0.0% |
| Canadian | 15 | 0.2% |
| Celtic | 6 | 0.1% |
| Cherokee | 108 | 1.1% |
| Choctaw | 10 | 0.1% |
| Colombian | 28 | 0.3% |
| Czech | 20 | 0.2% |
| Czechoslovakian | 40 | 0.4% |
| Danish | 5 | 0.1% |
| Dutch | 99 | 1.0% |
| Eastern European | 7 | 0.1% |
| English | 825 | 8.6% |
| European | 72 | 0.7% |
| Finnish | 5 | 0.1% |
| French | 266 | 2.8% |
| French Canadian | 8 | 0.1% |
| German | 1,473 | 15.4% |
| Greek | 21 | 0.2% |
| Hopi | 3 | 0.0% |
| Indian (Asian) | 3 | 0.0% |
| Irish | 1,062 | 11.1% |
| Iroquois | 1 | 0.0% |
| Italian | 207 | 2.2% |
| Korean | 117 | 1.2% |
| Mexican | 149 | 1.6% |
| Native Hawaiian | 3 | 0.0% |
| Northern European | 23 | 0.2% |
| Norwegian | 23 | 0.2% |
| Pennsylvania German | 18 | 0.2% |
| Polish | 71 | 0.7% |
| Portuguese | 4 | 0.0% |
| Pueblo | 5 | 0.1% |
| Puerto Rican | 5 | 0.1% |
| Russian | 7 | 0.1% |
| Scandinavian | 55 | 0.6% |
| Scotch-Irish | 131 | 1.4% |
| Scottish | 112 | 1.2% |
| Sioux | 2 | 0.0% |
| Slovak | 9 | 0.1% |
| South American | 28 | 0.3% |
| Sri Lankan | 7 | 0.1% |
| Swedish | 35 | 0.4% |
| Swiss | 16 | 0.2% |
| Turkish | 11 | 0.1% |
| Ukrainian | 9 | 0.1% |
| Welsh | 34 | 0.4% | View All 52 Rows |
Immigrants in Iron County
The most numerous immigrant groups reported in Iron County came from Asia (79 | 0.8%), South Eastern Asia (75 | 0.8%), Thailand (48 | 0.5%), Latin America (38 | 0.4%), and Colombia (28 | 0.3%), together accounting for 2.8% of all Iron County residents.
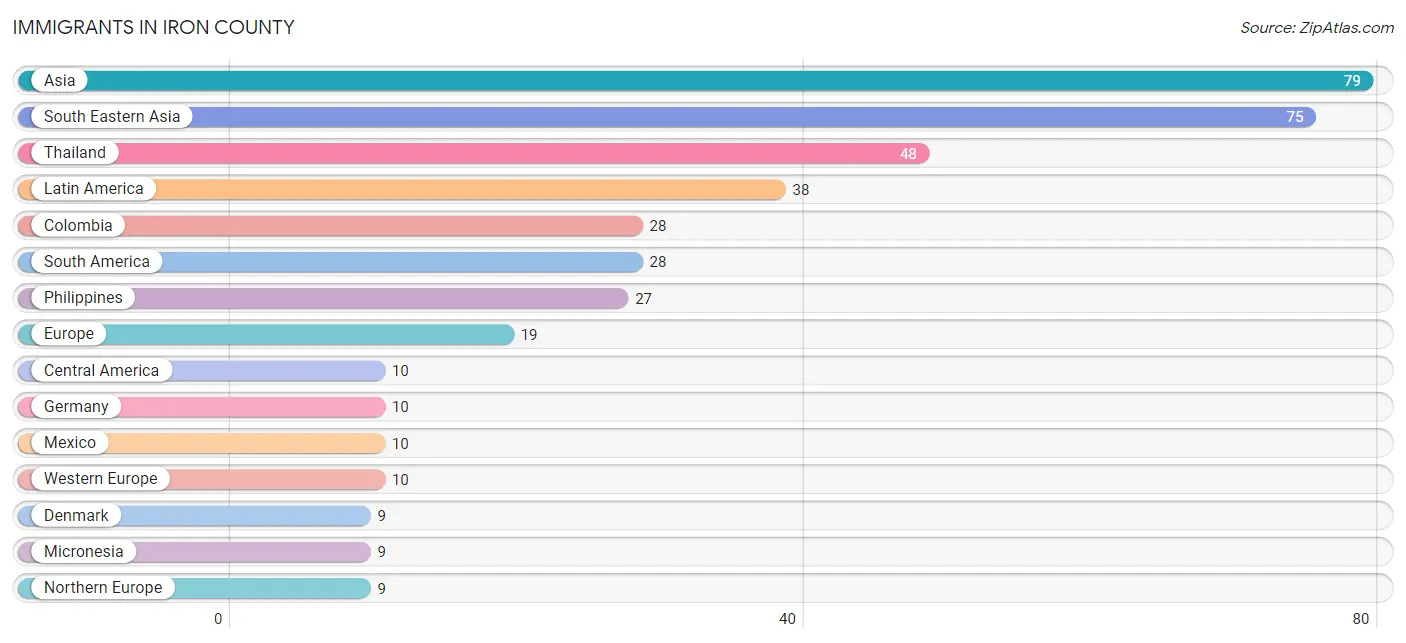
| Immigration Origin | # Population | % Population |
| Asia | 79 | 0.8% |
| Central America | 10 | 0.1% |
| Colombia | 28 | 0.3% |
| Denmark | 9 | 0.1% |
| Eastern Asia | 4 | 0.0% |
| Europe | 19 | 0.2% |
| Germany | 10 | 0.1% |
| Korea | 4 | 0.0% |
| Latin America | 38 | 0.4% |
| Mexico | 10 | 0.1% |
| Micronesia | 9 | 0.1% |
| Northern Europe | 9 | 0.1% |
| Oceania | 9 | 0.1% |
| Philippines | 27 | 0.3% |
| South America | 28 | 0.3% |
| South Eastern Asia | 75 | 0.8% |
| Thailand | 48 | 0.5% |
| Western Europe | 10 | 0.1% | View All 18 Rows |
Sex and Age in Iron County
Sex and Age in Iron County
The most populous age groups in Iron County are 55 to 59 Years (429 | 9.0%) for men and 55 to 59 Years (453 | 9.5%) for women.
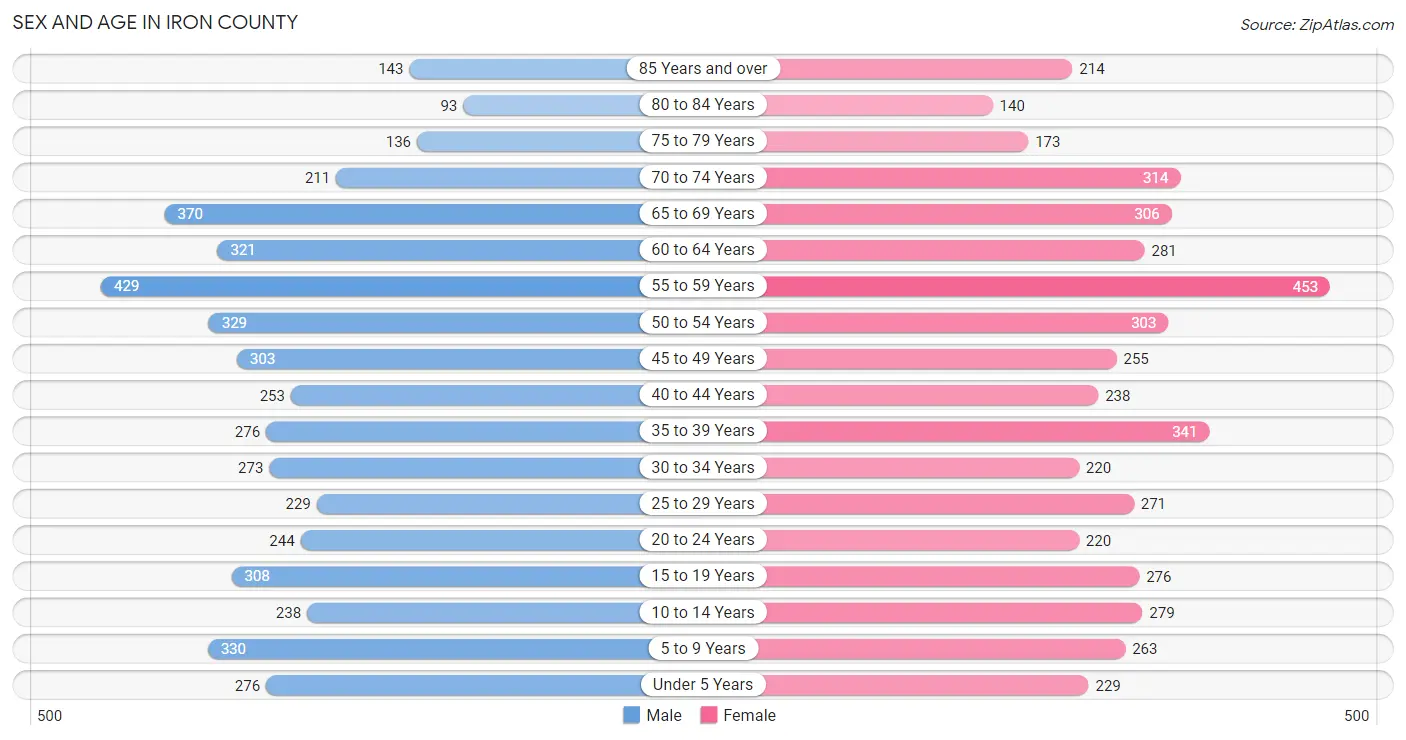
| Age Bracket | Male | Female |
| Under 5 Years | 276 (5.8%) | 229 (4.8%) |
| 5 to 9 Years | 330 (6.9%) | 263 (5.5%) |
| 10 to 14 Years | 238 (5.0%) | 279 (5.8%) |
| 15 to 19 Years | 308 (6.5%) | 276 (5.8%) |
| 20 to 24 Years | 244 (5.1%) | 220 (4.6%) |
| 25 to 29 Years | 229 (4.8%) | 271 (5.7%) |
| 30 to 34 Years | 273 (5.7%) | 220 (4.6%) |
| 35 to 39 Years | 276 (5.8%) | 341 (7.1%) |
| 40 to 44 Years | 253 (5.3%) | 238 (5.0%) |
| 45 to 49 Years | 303 (6.4%) | 255 (5.3%) |
| 50 to 54 Years | 329 (6.9%) | 303 (6.3%) |
| 55 to 59 Years | 429 (9.0%) | 453 (9.5%) |
| 60 to 64 Years | 321 (6.7%) | 281 (5.9%) |
| 65 to 69 Years | 370 (7.8%) | 306 (6.4%) |
| 70 to 74 Years | 211 (4.4%) | 314 (6.6%) |
| 75 to 79 Years | 136 (2.9%) | 173 (3.6%) |
| 80 to 84 Years | 93 (1.9%) | 140 (2.9%) |
| 85 Years and over | 143 (3.0%) | 214 (4.5%) |
| Total | 4,762 (100.0%) | 4,776 (100.0%) |
Families and Households in Iron County
Median Family Size in Iron County
The median family size in Iron County is 2.88 persons per family, with married-couple families (1,887 | 72.3%) accounting for the largest median family size of 2.95 persons per family. On the other hand, single male/father families (252 | 9.7%) represent the smallest median family size with 2.66 persons per family.
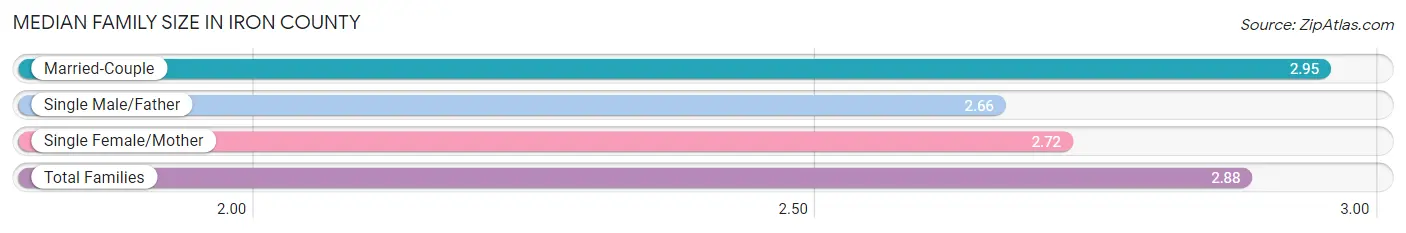
| Family Type | # Families | Family Size |
| Married-Couple | 1,887 (72.3%) | 2.95 |
| Single Male/Father | 252 (9.7%) | 2.66 |
| Single Female/Mother | 472 (18.1%) | 2.72 |
| Total Families | 2,611 (100.0%) | 2.88 |
Median Household Size in Iron County
The median household size in Iron County is 2.40 persons per household, with single male/father households (252 | 6.6%) accounting for the largest median household size of 3.1 persons per household. non-family households (1,210 | 31.7%) represent the smallest median household size with 1.18 persons per household.
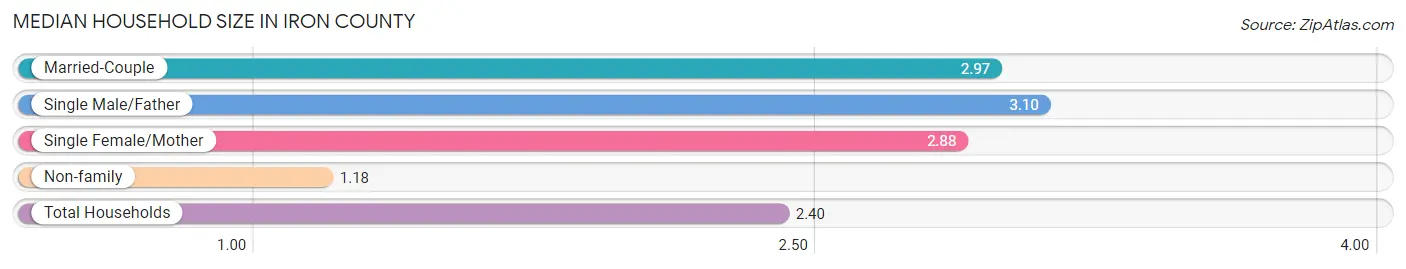
| Household Type | # Households | Household Size |
| Married-Couple | 1,887 (49.4%) | 2.97 |
| Single Male/Father | 252 (6.6%) | 3.10 |
| Single Female/Mother | 472 (12.3%) | 2.88 |
| Non-family | 1,210 (31.7%) | 1.18 |
| Total Households | 3,821 (100.0%) | 2.40 |
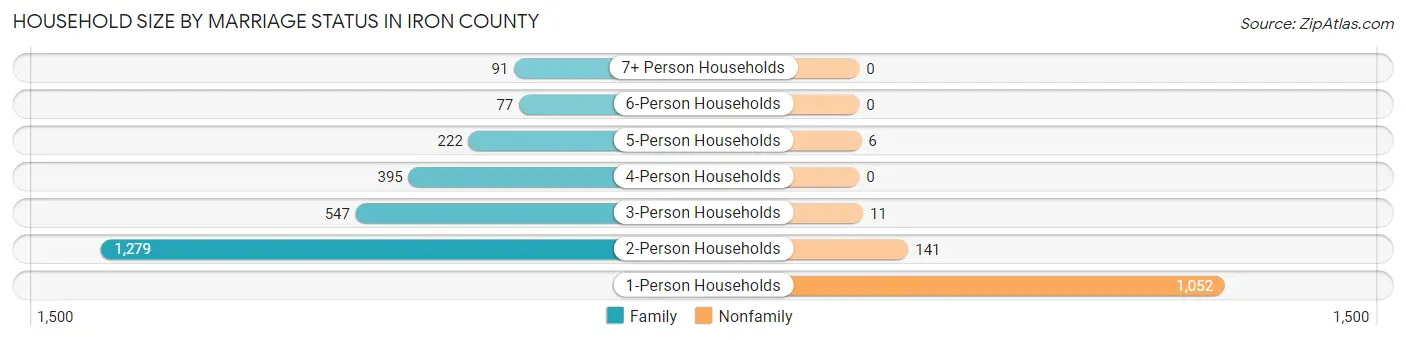
Household Size by Marriage Status in Iron County
Out of a total of 3,821 households in Iron County, 2,611 (68.3%) are family households, while 1,210 (31.7%) are nonfamily households. The most numerous type of family households are 2-person households, comprising 1,279, and the most common type of nonfamily households are 1-person households, comprising 1,052.
| Household Size | Family Households | Nonfamily Households |
| 1-Person Households | - | 1,052 (27.5%) |
| 2-Person Households | 1,279 (33.5%) | 141 (3.7%) |
| 3-Person Households | 547 (14.3%) | 11 (0.3%) |
| 4-Person Households | 395 (10.3%) | 0 (0.0%) |
| 5-Person Households | 222 (5.8%) | 6 (0.2%) |
| 6-Person Households | 77 (2.0%) | 0 (0.0%) |
| 7+ Person Households | 91 (2.4%) | 0 (0.0%) |
| Total | 2,611 (68.3%) | 1,210 (31.7%) |
Female Fertility in Iron County
Fertility by Age in Iron County
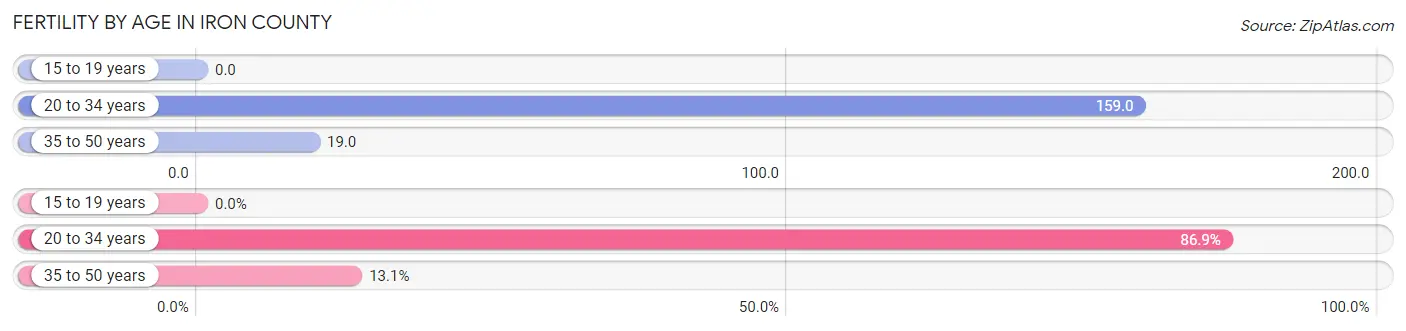
Average fertility rate in Iron County is 70.0 births per 1,000 women. Women in the age bracket of 20 to 34 years have the highest fertility rate with 159.0 births per 1,000 women. Women in the age bracket of 20 to 34 years acount for 86.9% of all women with births.
| Age Bracket | Women with Births | Births / 1,000 Women |
| 15 to 19 years | 0 (0.0%) | 0.0 |
| 20 to 34 years | 113 (86.9%) | 159.0 |
| 35 to 50 years | 17 (13.1%) | 19.0 |
| Total | 130 (100.0%) | 70.0 |
Fertility by Age by Marriage Status in Iron County
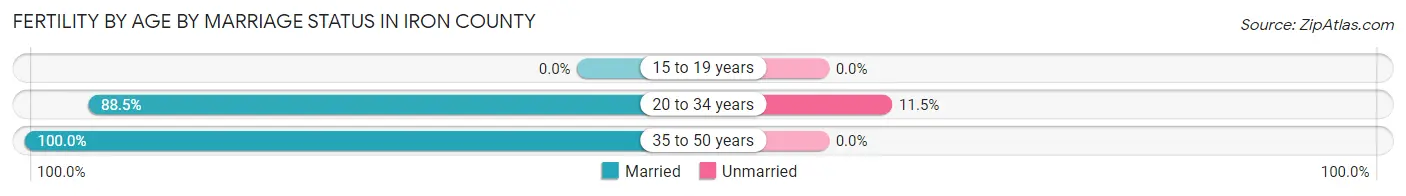
90.0% of women with births (130) in Iron County are married. The highest percentage of unmarried women with births falls into 20 to 34 years age bracket with 11.5% of them unmarried at the time of birth, while the lowest percentage of unmarried women with births belong to 35 to 50 years age bracket with 0.0% of them unmarried.
| Age Bracket | Married | Unmarried |
| 15 to 19 years | 0 (0.0%) | 0 (0.0%) |
| 20 to 34 years | 100 (88.5%) | 13 (11.5%) |
| 35 to 50 years | 17 (100.0%) | 0 (0.0%) |
| Total | 117 (90.0%) | 13 (10.0%) |
Fertility by Education in Iron County
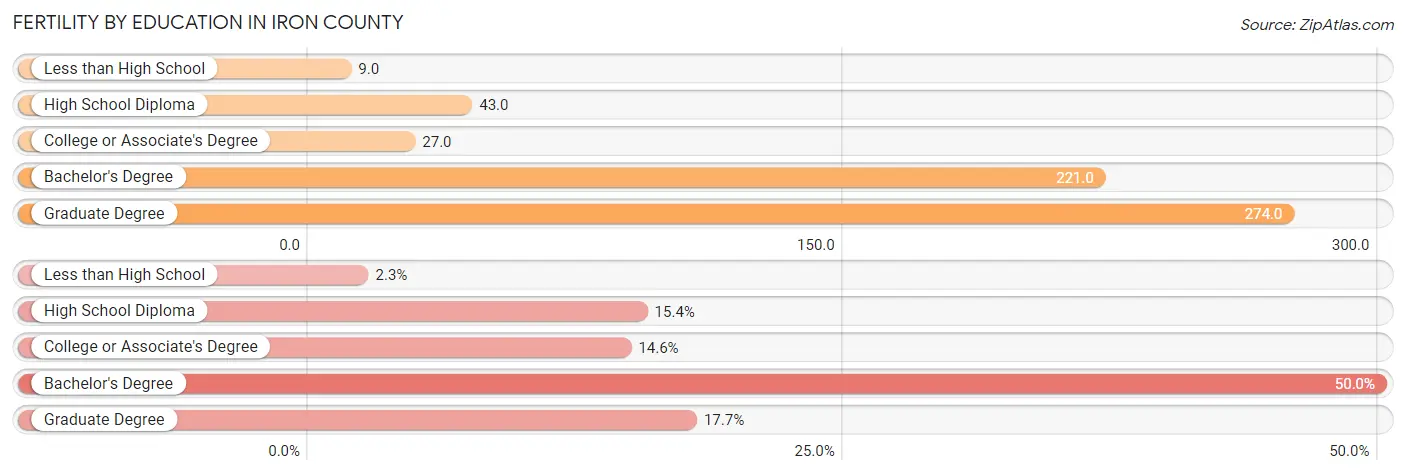
Average fertility rate in Iron County is 70.0 births per 1,000 women. Women with the education attainment of graduate degree have the highest fertility rate of 274.0 births per 1,000 women, while women with the education attainment of less than high school have the lowest fertility at 9.0 births per 1,000 women. Women with the education attainment of bachelor's degree represent 50.0% of all women with births.
| Educational Attainment | Women with Births | Births / 1,000 Women |
| Less than High School | 3 (2.3%) | 9.0 |
| High School Diploma | 20 (15.4%) | 43.0 |
| College or Associate's Degree | 19 (14.6%) | 27.0 |
| Bachelor's Degree | 65 (50.0%) | 221.0 |
| Graduate Degree | 23 (17.7%) | 274.0 |
| Total | 130 (100.0%) | 70.0 |
Fertility by Education by Marriage Status in Iron County
10.0% of women with births in Iron County are unmarried. Women with the educational attainment of less than high school are most likely to be married with 100.0% of them married at childbirth, while women with the educational attainment of high school diploma are least likely to be married with 50.0% of them unmarried at childbirth.
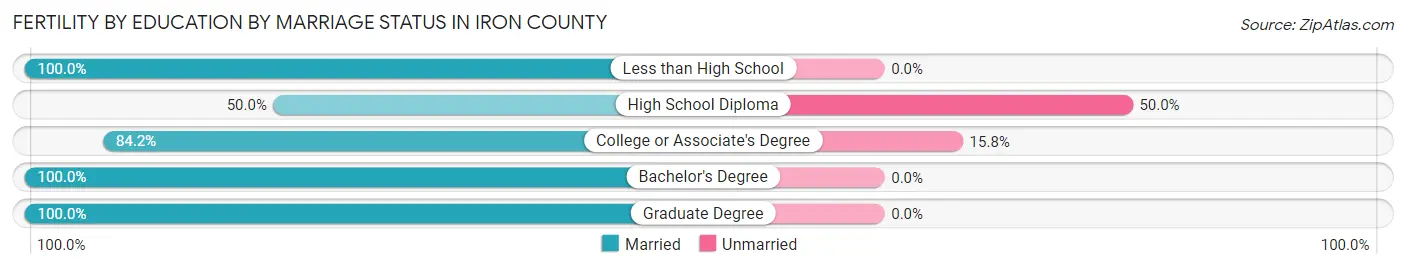
| Educational Attainment | Married | Unmarried |
| Less than High School | 3 (100.0%) | 0 (0.0%) |
| High School Diploma | 10 (50.0%) | 10 (50.0%) |
| College or Associate's Degree | 16 (84.2%) | 3 (15.8%) |
| Bachelor's Degree | 65 (100.0%) | 0 (0.0%) |
| Graduate Degree | 23 (100.0%) | 0 (0.0%) |
| Total | 117 (90.0%) | 13 (10.0%) |
Employment Characteristics in Iron County
Employment by Class of Employer in Iron County
Among the 3,879 employed individuals in Iron County, private company employees (2,283 | 58.9%), self-employed (not incorporated) (355 | 9.1%), and not-for-profit organizations (326 | 8.4%) make up the most common classes of employment.
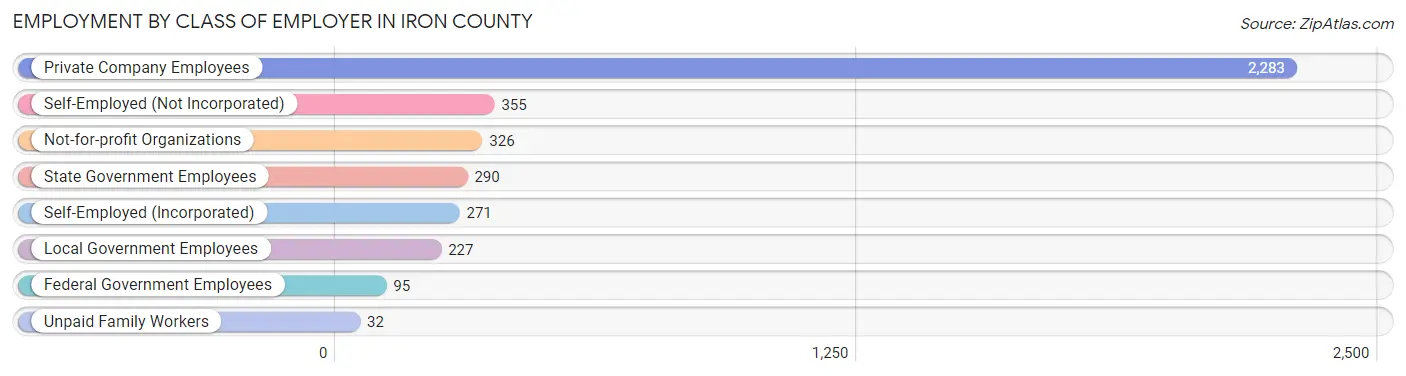
| Employer Class | # Employees | % Employees |
| Private Company Employees | 2,283 | 58.9% |
| Self-Employed (Incorporated) | 271 | 7.0% |
| Self-Employed (Not Incorporated) | 355 | 9.1% |
| Not-for-profit Organizations | 326 | 8.4% |
| Local Government Employees | 227 | 5.9% |
| State Government Employees | 290 | 7.5% |
| Federal Government Employees | 95 | 2.5% |
| Unpaid Family Workers | 32 | 0.8% |
| Total | 3,879 | 100.0% |
Employment Status by Age in Iron County
According to the labor force statistics for Iron County, out of the total population over 16 years of age (7,735), 52.4% or 4,053 individuals are in the labor force, with 3.3% or 134 of them unemployed. The age group with the highest labor force participation rate is 25 to 29 years, with 82.4% or 412 individuals in the labor force. Within the labor force, the 55 to 59 years age range has the highest percentage of unemployed individuals, with 10.5% or 50 of them being unemployed.
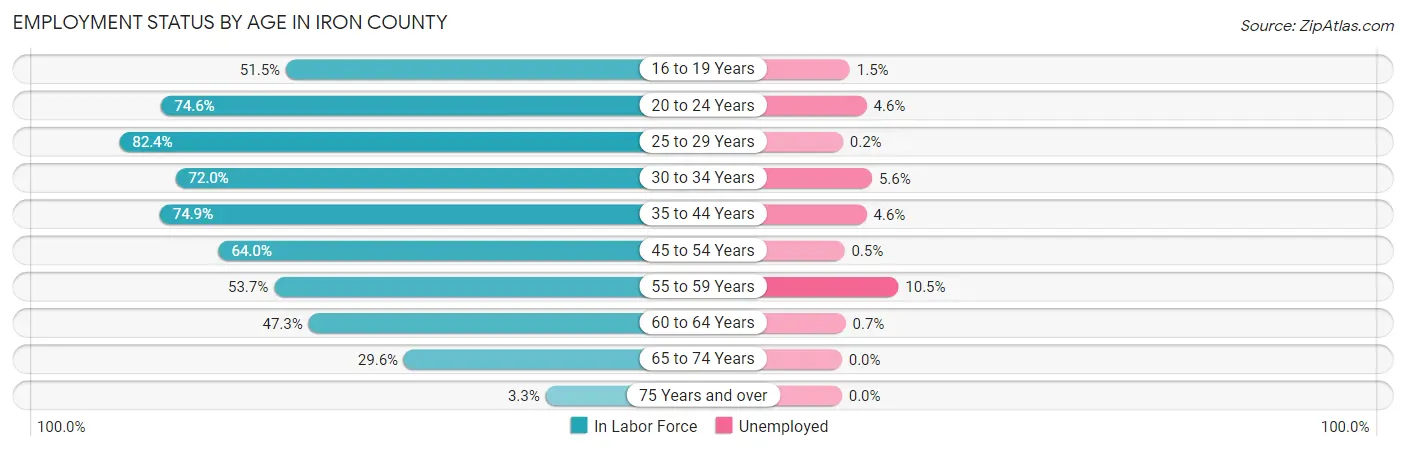
| Age Bracket | In Labor Force | Unemployed |
| 16 to 19 Years | 204 (51.5%) | 3 (1.5%) |
| 20 to 24 Years | 346 (74.6%) | 16 (4.6%) |
| 25 to 29 Years | 412 (82.4%) | 1 (0.2%) |
| 30 to 34 Years | 355 (72.0%) | 20 (5.6%) |
| 35 to 44 Years | 830 (74.9%) | 38 (4.6%) |
| 45 to 54 Years | 762 (64.0%) | 4 (0.5%) |
| 55 to 59 Years | 474 (53.7%) | 50 (10.5%) |
| 60 to 64 Years | 285 (47.3%) | 2 (0.7%) |
| 65 to 74 Years | 355 (29.6%) | 0 (0.0%) |
| 75 Years and over | 30 (3.3%) | 0 (0.0%) |
| Total | 4,053 (52.4%) | 134 (3.3%) |
Employment Status by Educational Attainment in Iron County
According to labor force statistics for Iron County, 65.3% of individuals (3,118) out of the total population between 25 and 64 years of age (4,775) are in the labor force, with 3.7% or 115 of them being unemployed. The group with the highest labor force participation rate are those with the educational attainment of college / associate degree, with 73.4% or 1,110 individuals in the labor force. Within the labor force, individuals with less than high school education have the highest percentage of unemployment, with 26.3% or 52 of them being unemployed.
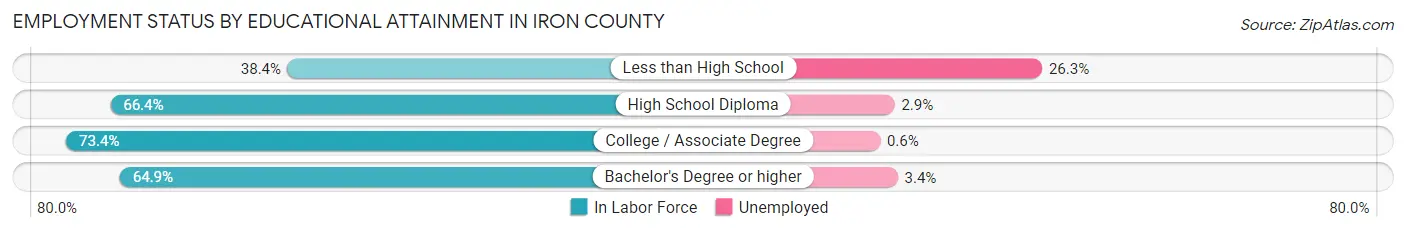
| Educational Attainment | In Labor Force | Unemployed |
| Less than High School | 198 (38.4%) | 136 (26.3%) |
| High School Diploma | 1,226 (66.4%) | 54 (2.9%) |
| College / Associate Degree | 1,110 (73.4%) | 9 (0.6%) |
| Bachelor's Degree or higher | 584 (64.9%) | 31 (3.4%) |
| Total | 3,118 (65.3%) | 177 (3.7%) |
Employment Occupations by Sex in Iron County
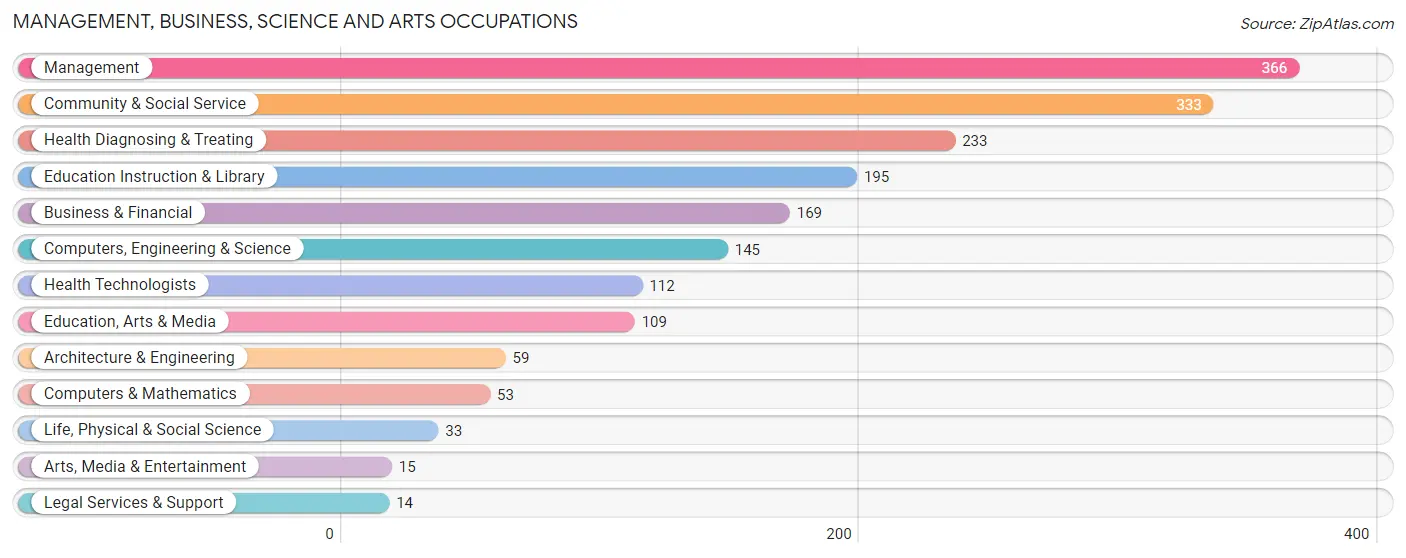
Management, Business, Science and Arts Occupations
The most common Management, Business, Science and Arts occupations in Iron County are Management (366 | 9.3%), Community & Social Service (333 | 8.5%), Health Diagnosing & Treating (233 | 5.9%), Education Instruction & Library (195 | 5.0%), and Business & Financial (169 | 4.3%).
Management, Business, Science and Arts Occupations by Sex
Within the Management, Business, Science and Arts occupations in Iron County, the most male-oriented occupations are Architecture & Engineering (96.6%), Legal Services & Support (71.4%), and Computers, Engineering & Science (61.4%), while the most female-oriented occupations are Health Technologists (96.4%), Health Diagnosing & Treating (91.4%), and Education Instruction & Library (76.4%).
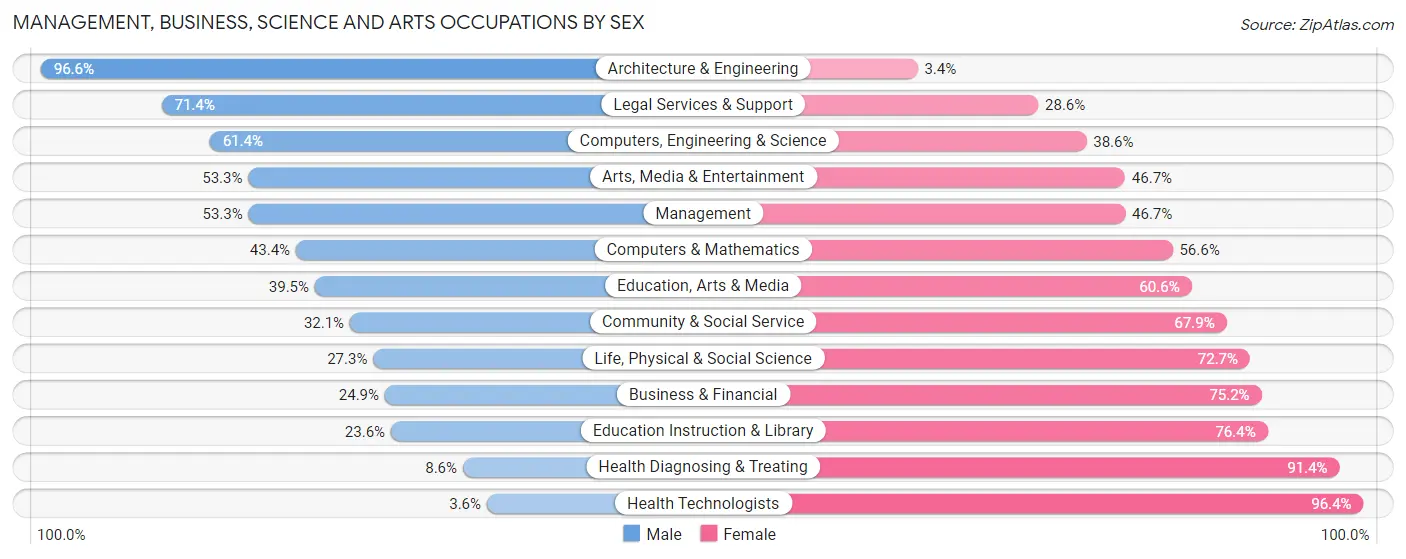
| Occupation | Male | Female |
| Management | 195 (53.3%) | 171 (46.7%) |
| Business & Financial | 42 (24.8%) | 127 (75.1%) |
| Computers, Engineering & Science | 89 (61.4%) | 56 (38.6%) |
| Computers & Mathematics | 23 (43.4%) | 30 (56.6%) |
| Architecture & Engineering | 57 (96.6%) | 2 (3.4%) |
| Life, Physical & Social Science | 9 (27.3%) | 24 (72.7%) |
| Community & Social Service | 107 (32.1%) | 226 (67.9%) |
| Education, Arts & Media | 43 (39.5%) | 66 (60.6%) |
| Legal Services & Support | 10 (71.4%) | 4 (28.6%) |
| Education Instruction & Library | 46 (23.6%) | 149 (76.4%) |
| Arts, Media & Entertainment | 8 (53.3%) | 7 (46.7%) |
| Health Diagnosing & Treating | 20 (8.6%) | 213 (91.4%) |
| Health Technologists | 4 (3.6%) | 108 (96.4%) |
| Total (Category) | 453 (36.4%) | 793 (63.6%) |
| Total (Overall) | 2,037 (52.0%) | 1,882 (48.0%) |
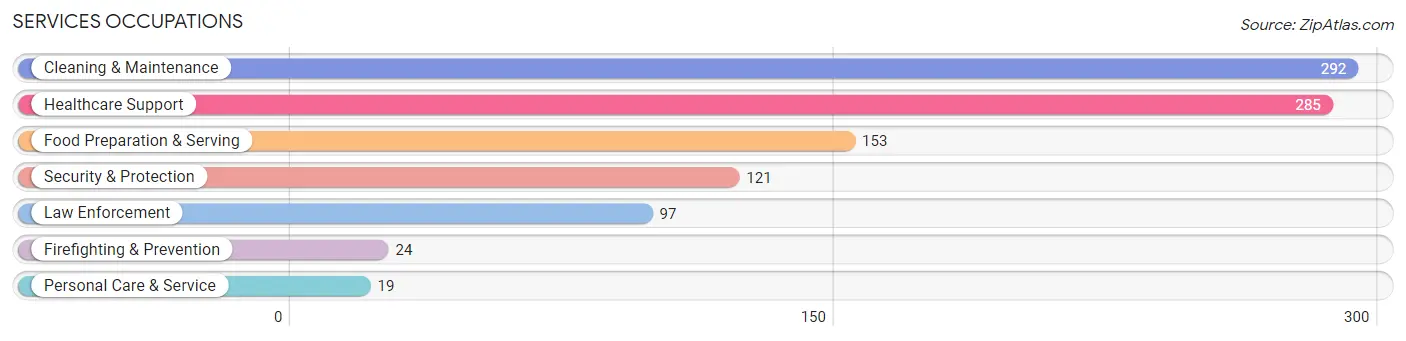
Services Occupations
The most common Services occupations in Iron County are Cleaning & Maintenance (292 | 7.4%), Healthcare Support (285 | 7.3%), Food Preparation & Serving (153 | 3.9%), Security & Protection (121 | 3.1%), and Law Enforcement (97 | 2.5%).
Services Occupations by Sex
Within the Services occupations in Iron County, the most male-oriented occupations are Firefighting & Prevention (95.8%), Security & Protection (86.8%), and Law Enforcement (84.5%), while the most female-oriented occupations are Healthcare Support (96.8%), Personal Care & Service (84.2%), and Food Preparation & Serving (75.8%).
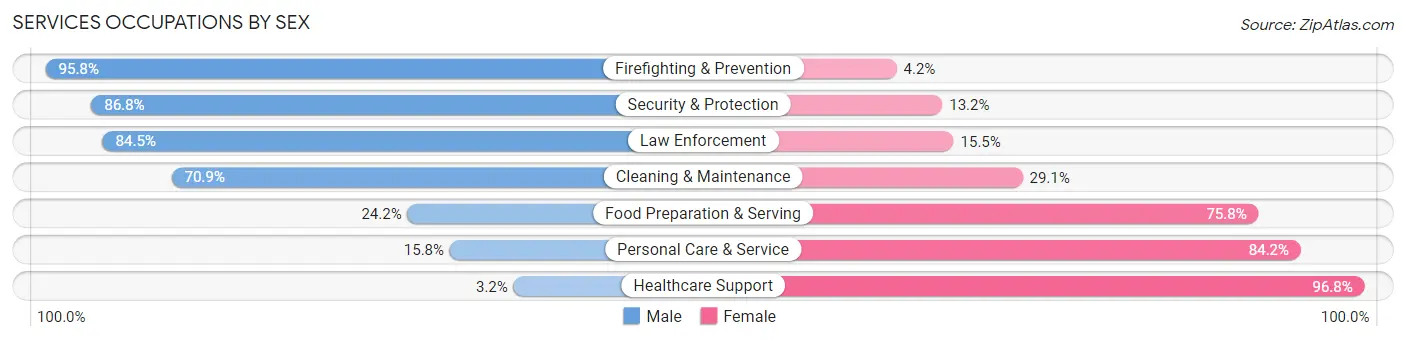
| Occupation | Male | Female |
| Healthcare Support | 9 (3.2%) | 276 (96.8%) |
| Security & Protection | 105 (86.8%) | 16 (13.2%) |
| Firefighting & Prevention | 23 (95.8%) | 1 (4.2%) |
| Law Enforcement | 82 (84.5%) | 15 (15.5%) |
| Food Preparation & Serving | 37 (24.2%) | 116 (75.8%) |
| Cleaning & Maintenance | 207 (70.9%) | 85 (29.1%) |
| Personal Care & Service | 3 (15.8%) | 16 (84.2%) |
| Total (Category) | 361 (41.5%) | 509 (58.5%) |
| Total (Overall) | 2,037 (52.0%) | 1,882 (48.0%) |
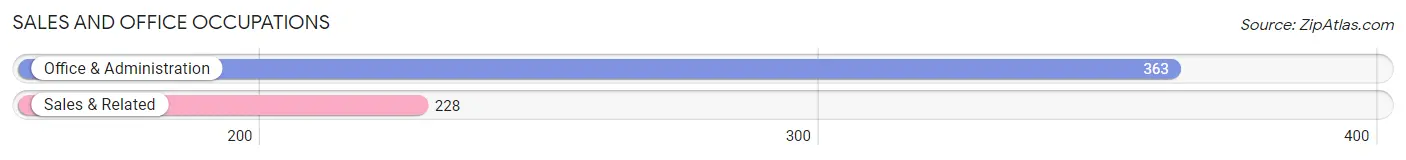
Sales and Office Occupations
The most common Sales and Office occupations in Iron County are Office & Administration (363 | 9.3%), and Sales & Related (228 | 5.8%).
Sales and Office Occupations by Sex
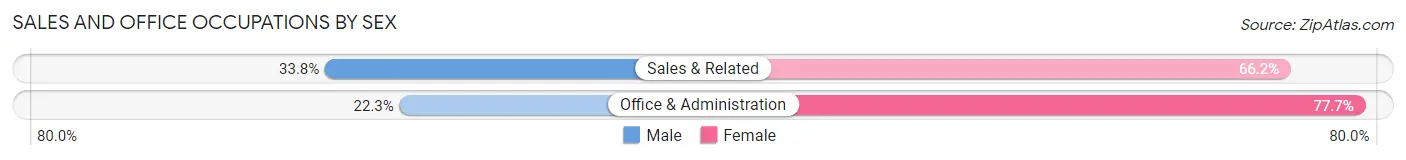
| Occupation | Male | Female |
| Sales & Related | 77 (33.8%) | 151 (66.2%) |
| Office & Administration | 81 (22.3%) | 282 (77.7%) |
| Total (Category) | 158 (26.7%) | 433 (73.3%) |
| Total (Overall) | 2,037 (52.0%) | 1,882 (48.0%) |
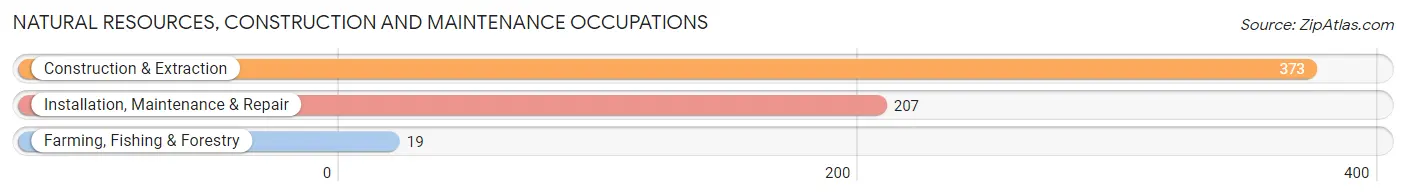
Natural Resources, Construction and Maintenance Occupations
The most common Natural Resources, Construction and Maintenance occupations in Iron County are Construction & Extraction (373 | 9.5%), Installation, Maintenance & Repair (207 | 5.3%), and Farming, Fishing & Forestry (19 | 0.5%).
Natural Resources, Construction and Maintenance Occupations by Sex
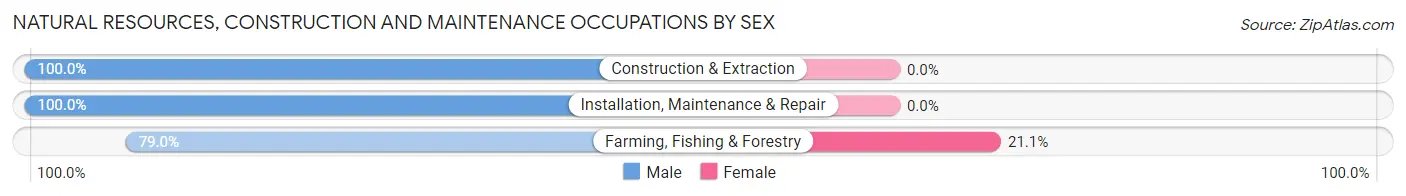
| Occupation | Male | Female |
| Farming, Fishing & Forestry | 15 (78.9%) | 4 (21.0%) |
| Construction & Extraction | 373 (100.0%) | 0 (0.0%) |
| Installation, Maintenance & Repair | 207 (100.0%) | 0 (0.0%) |
| Total (Category) | 595 (99.3%) | 4 (0.7%) |
| Total (Overall) | 2,037 (52.0%) | 1,882 (48.0%) |
Production, Transportation and Moving Occupations
The most common Production, Transportation and Moving occupations in Iron County are Production (219 | 5.6%), Material Moving (204 | 5.2%), and Transportation (190 | 4.9%).
Production, Transportation and Moving Occupations by Sex
| Occupation | Male | Female |
| Production | 156 (71.2%) | 63 (28.8%) |
| Transportation | 168 (88.4%) | 22 (11.6%) |
| Material Moving | 146 (71.6%) | 58 (28.4%) |
| Total (Category) | 470 (76.7%) | 143 (23.3%) |
| Total (Overall) | 2,037 (52.0%) | 1,882 (48.0%) |
Employment Industries by Sex in Iron County
Employment Industries in Iron County
The major employment industries in Iron County include Health Care & Social Assistance (740 | 18.9%), Construction (361 | 9.2%), Manufacturing (353 | 9.0%), Retail Trade (337 | 8.6%), and Accommodation & Food Services (313 | 8.0%).
Employment Industries by Sex in Iron County
The Iron County industries that see more men than women are Construction (100.0%), Wholesale Trade (100.0%), and Arts, Entertainment & Recreation (100.0%), whereas the industries that tend to have a higher number of women are Utilities (100.0%), Real Estate, Rental & Leasing (92.0%), and Information (90.0%).
| Industry | Male | Female |
| Agriculture, Fishing & Hunting | 59 (93.6%) | 4 (6.4%) |
| Mining, Quarrying, & Extraction | 211 (87.9%) | 29 (12.1%) |
| Construction | 361 (100.0%) | 0 (0.0%) |
| Manufacturing | 246 (69.7%) | 107 (30.3%) |
| Wholesale Trade | 17 (100.0%) | 0 (0.0%) |
| Retail Trade | 131 (38.9%) | 206 (61.1%) |
| Transportation & Warehousing | 194 (69.8%) | 84 (30.2%) |
| Utilities | 0 (0.0%) | 14 (100.0%) |
| Information | 3 (10.0%) | 27 (90.0%) |
| Finance & Insurance | 36 (35.3%) | 66 (64.7%) |
| Real Estate, Rental & Leasing | 6 (8.0%) | 69 (92.0%) |
| Professional & Scientific | 58 (54.7%) | 48 (45.3%) |
| Enterprise Management | 29 (85.3%) | 5 (14.7%) |
| Administrative & Support | 126 (68.5%) | 58 (31.5%) |
| Educational Services | 104 (37.0%) | 177 (63.0%) |
| Health Care & Social Assistance | 102 (13.8%) | 638 (86.2%) |
| Arts, Entertainment & Recreation | 21 (100.0%) | 0 (0.0%) |
| Accommodation & Food Services | 60 (19.2%) | 253 (80.8%) |
| Public Administration | 123 (66.1%) | 63 (33.9%) |
| Total | 2,037 (52.0%) | 1,882 (48.0%) |
Education in Iron County
School Enrollment in Iron County
The most common levels of schooling among the 1,932 students in Iron County are high school (488 | 25.3%), elementary school (425 | 22.0%), and middle school (358 | 18.5%).
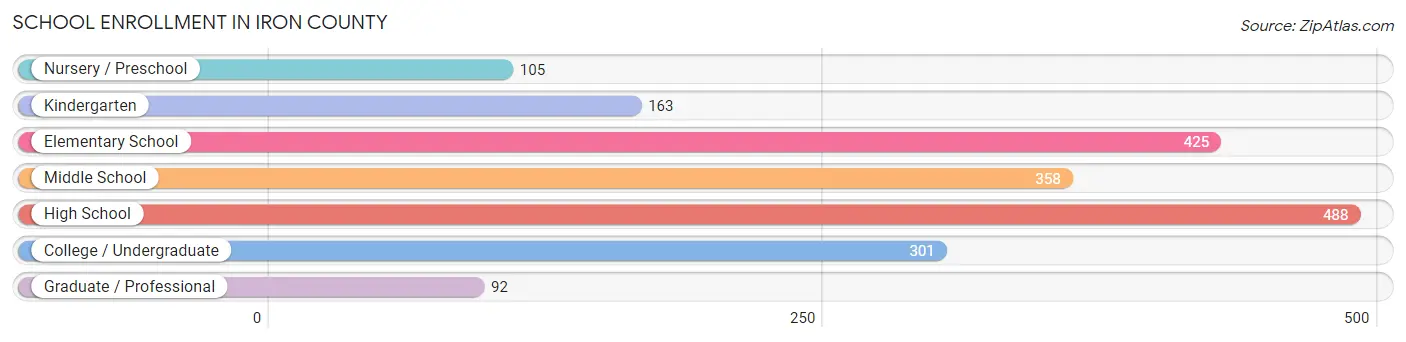
| School Level | # Students | % Students |
| Nursery / Preschool | 105 | 5.4% |
| Kindergarten | 163 | 8.4% |
| Elementary School | 425 | 22.0% |
| Middle School | 358 | 18.5% |
| High School | 488 | 25.3% |
| College / Undergraduate | 301 | 15.6% |
| Graduate / Professional | 92 | 4.8% |
| Total | 1,932 | 100.0% |
School Enrollment by Age by Funding Source in Iron County
Out of a total of 1,932 students who are enrolled in schools in Iron County, 129 (6.7%) attend a private institution, while the remaining 1,803 (93.3%) are enrolled in public schools. The age group of 25 to 34 year olds has the highest likelihood of being enrolled in private schools, with 23 (25.6% in the age bracket) enrolled. Conversely, the age group of 18 to 19 year olds has the lowest likelihood of being enrolled in a private school, with 130 (100.0% in the age bracket) attending a public institution.
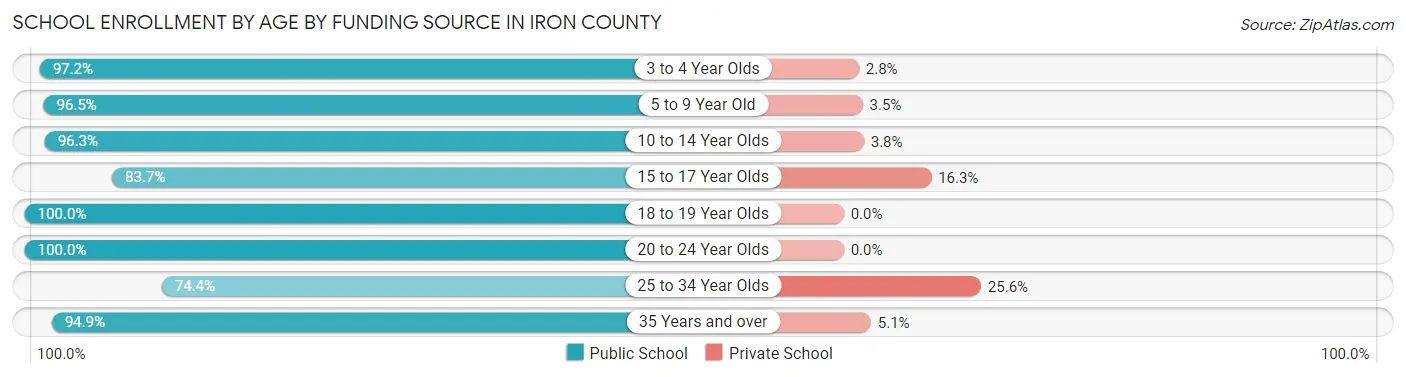
| Age Bracket | Public School | Private School |
| 3 to 4 Year Olds | 69 (97.2%) | 2 (2.8%) |
| 5 to 9 Year Old | 493 (96.5%) | 18 (3.5%) |
| 10 to 14 Year Olds | 488 (96.3%) | 19 (3.7%) |
| 15 to 17 Year Olds | 303 (83.7%) | 59 (16.3%) |
| 18 to 19 Year Olds | 130 (100.0%) | 0 (0.0%) |
| 20 to 24 Year Olds | 103 (100.0%) | 0 (0.0%) |
| 25 to 34 Year Olds | 67 (74.4%) | 23 (25.6%) |
| 35 Years and over | 150 (94.9%) | 8 (5.1%) |
| Total | 1,803 (93.3%) | 129 (6.7%) |
Educational Attainment by Field of Study in Iron County
Education (413 | 30.2%), business (154 | 11.3%), bio, nature & agricultural (132 | 9.7%), psychology (127 | 9.3%), and science & technology (126 | 9.2%) are the most common fields of study among 1,368 individuals in Iron County who have obtained a bachelor's degree or higher.
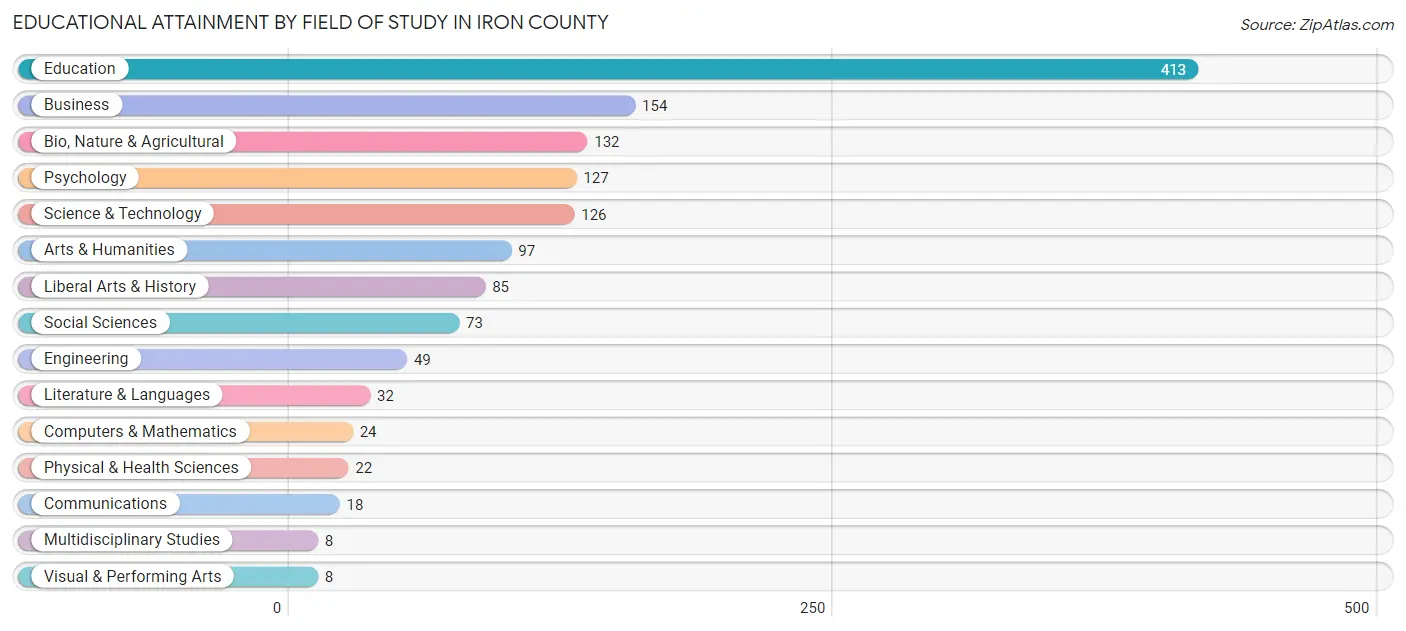
| Field of Study | # Graduates | % Graduates |
| Computers & Mathematics | 24 | 1.8% |
| Bio, Nature & Agricultural | 132 | 9.7% |
| Physical & Health Sciences | 22 | 1.6% |
| Psychology | 127 | 9.3% |
| Social Sciences | 73 | 5.3% |
| Engineering | 49 | 3.6% |
| Multidisciplinary Studies | 8 | 0.6% |
| Science & Technology | 126 | 9.2% |
| Business | 154 | 11.3% |
| Education | 413 | 30.2% |
| Literature & Languages | 32 | 2.3% |
| Liberal Arts & History | 85 | 6.2% |
| Visual & Performing Arts | 8 | 0.6% |
| Communications | 18 | 1.3% |
| Arts & Humanities | 97 | 7.1% |
| Total | 1,368 | 100.0% |
Transportation & Commute in Iron County
Vehicle Availability by Sex in Iron County
The most prevalent vehicle ownership categories in Iron County are males with 2 vehicles (682, accounting for 34.0%) and females with 2 vehicles (661, making up 36.4%).
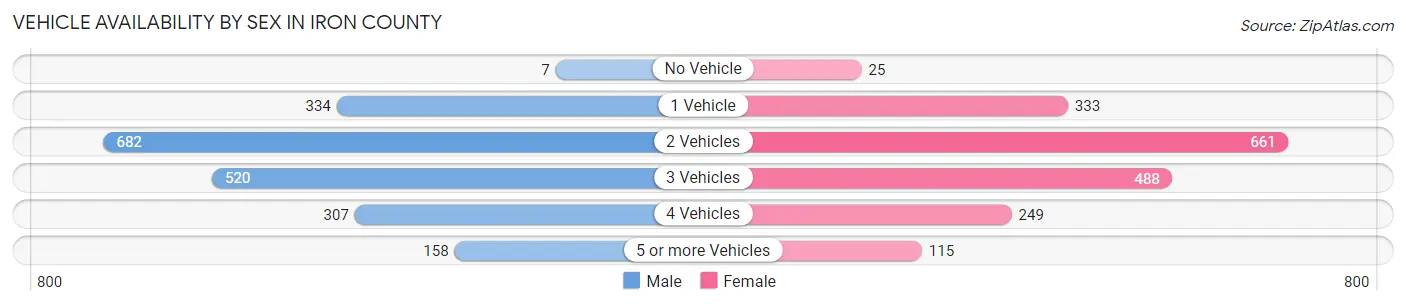
| Vehicles Available | Male | Female |
| No Vehicle | 7 (0.4%) | 25 (1.3%) |
| 1 Vehicle | 334 (16.6%) | 333 (17.8%) |
| 2 Vehicles | 682 (34.0%) | 661 (35.3%) |
| 3 Vehicles | 520 (25.9%) | 488 (26.1%) |
| 4 Vehicles | 307 (15.3%) | 249 (13.3%) |
| 5 or more Vehicles | 158 (7.9%) | 115 (6.1%) |
| Total | 2,008 (100.0%) | 1,871 (100.0%) |
Commute Time in Iron County
The most frequently occuring commute durations in Iron County are 30 to 34 minutes (581 commuters, 15.8%), 5 to 9 minutes (466 commuters, 12.6%), and 20 to 24 minutes (387 commuters, 10.5%).
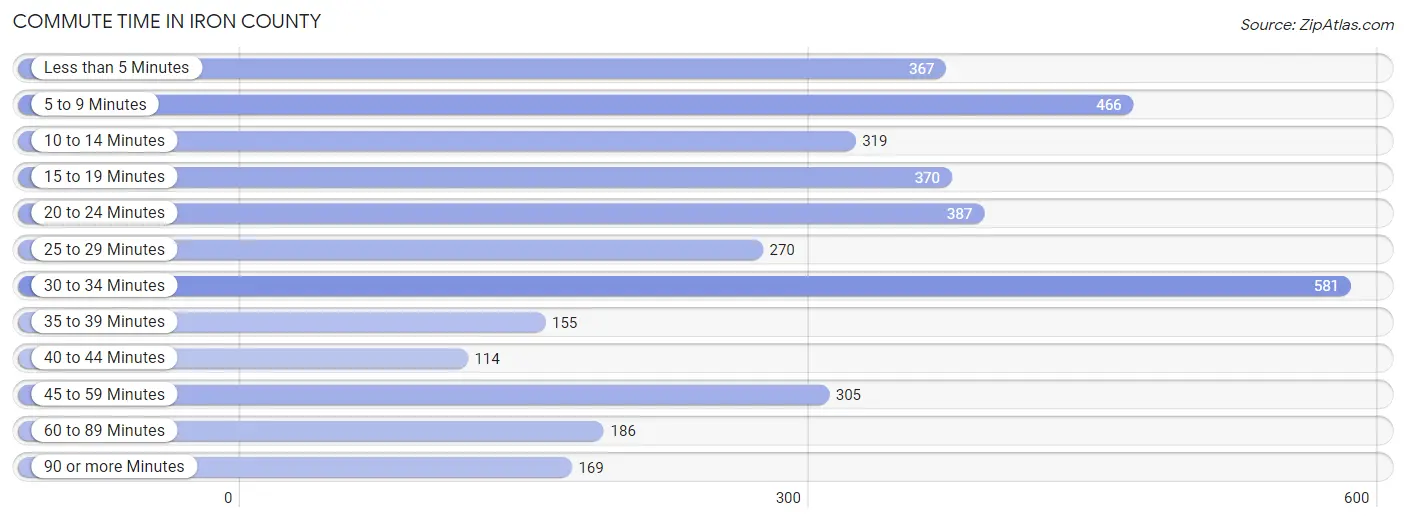
| Commute Time | # Commuters | % Commuters |
| Less than 5 Minutes | 367 | 10.0% |
| 5 to 9 Minutes | 466 | 12.6% |
| 10 to 14 Minutes | 319 | 8.6% |
| 15 to 19 Minutes | 370 | 10.0% |
| 20 to 24 Minutes | 387 | 10.5% |
| 25 to 29 Minutes | 270 | 7.3% |
| 30 to 34 Minutes | 581 | 15.8% |
| 35 to 39 Minutes | 155 | 4.2% |
| 40 to 44 Minutes | 114 | 3.1% |
| 45 to 59 Minutes | 305 | 8.3% |
| 60 to 89 Minutes | 186 | 5.0% |
| 90 or more Minutes | 169 | 4.6% |
Commute Time by Sex in Iron County
The most common commute times in Iron County are 30 to 34 minutes (279 commuters, 14.5%) for males and 30 to 34 minutes (302 commuters, 17.1%) for females.
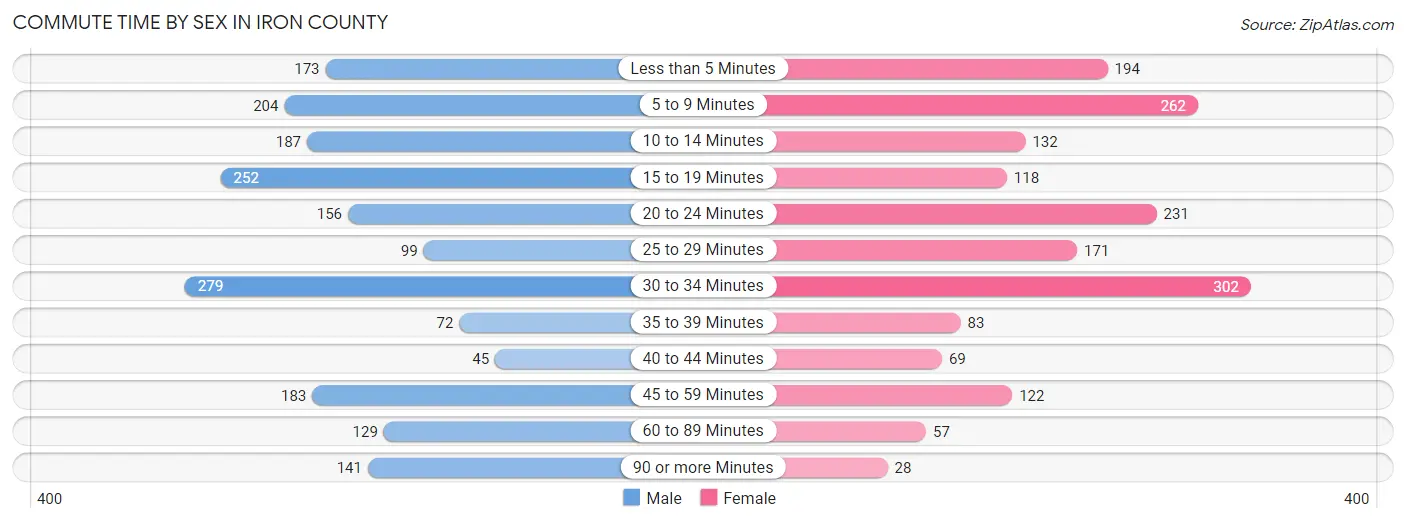
| Commute Time | Male | Female |
| Less than 5 Minutes | 173 (9.0%) | 194 (11.0%) |
| 5 to 9 Minutes | 204 (10.6%) | 262 (14.8%) |
| 10 to 14 Minutes | 187 (9.7%) | 132 (7.5%) |
| 15 to 19 Minutes | 252 (13.1%) | 118 (6.7%) |
| 20 to 24 Minutes | 156 (8.1%) | 231 (13.1%) |
| 25 to 29 Minutes | 99 (5.2%) | 171 (9.7%) |
| 30 to 34 Minutes | 279 (14.5%) | 302 (17.1%) |
| 35 to 39 Minutes | 72 (3.7%) | 83 (4.7%) |
| 40 to 44 Minutes | 45 (2.3%) | 69 (3.9%) |
| 45 to 59 Minutes | 183 (9.5%) | 122 (6.9%) |
| 60 to 89 Minutes | 129 (6.7%) | 57 (3.2%) |
| 90 or more Minutes | 141 (7.3%) | 28 (1.6%) |
Time of Departure to Work by Sex in Iron County
The most frequent times of departure to work in Iron County are 7:00 AM to 7:29 AM (307, 16.0%) for males and 7:00 AM to 7:29 AM (402, 22.7%) for females.
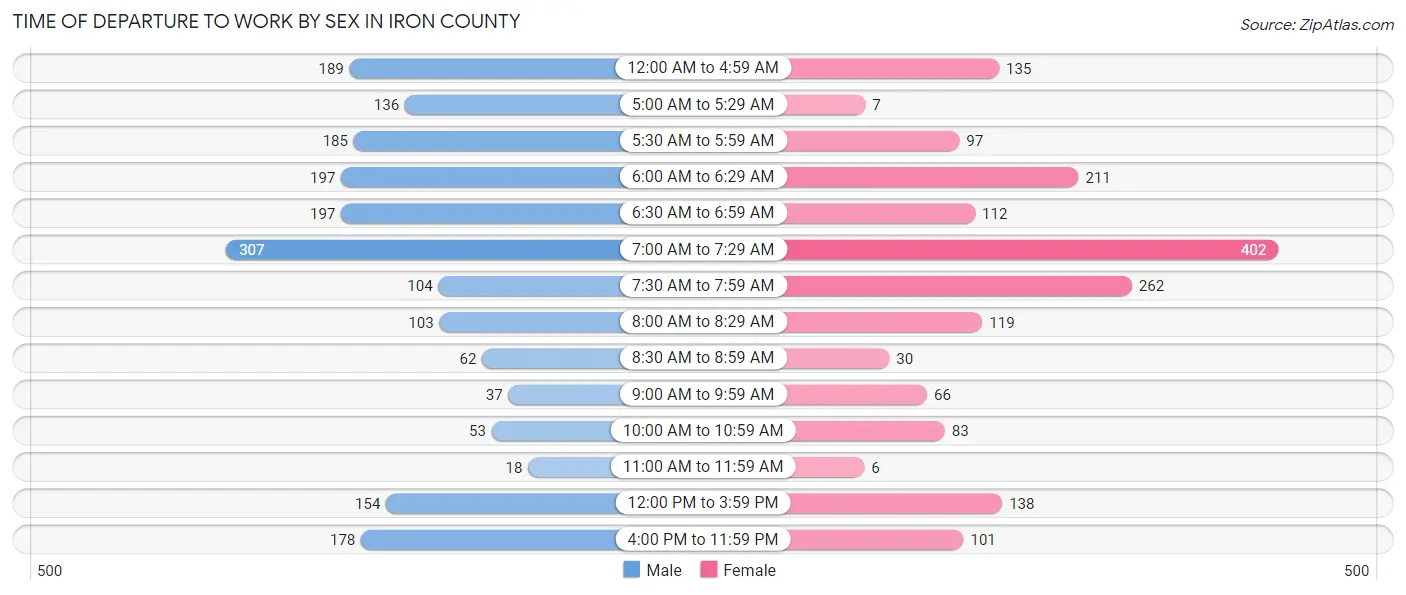
| Time of Departure | Male | Female |
| 12:00 AM to 4:59 AM | 189 (9.8%) | 135 (7.6%) |
| 5:00 AM to 5:29 AM | 136 (7.1%) | 7 (0.4%) |
| 5:30 AM to 5:59 AM | 185 (9.6%) | 97 (5.5%) |
| 6:00 AM to 6:29 AM | 197 (10.3%) | 211 (11.9%) |
| 6:30 AM to 6:59 AM | 197 (10.3%) | 112 (6.3%) |
| 7:00 AM to 7:29 AM | 307 (16.0%) | 402 (22.7%) |
| 7:30 AM to 7:59 AM | 104 (5.4%) | 262 (14.8%) |
| 8:00 AM to 8:29 AM | 103 (5.4%) | 119 (6.7%) |
| 8:30 AM to 8:59 AM | 62 (3.2%) | 30 (1.7%) |
| 9:00 AM to 9:59 AM | 37 (1.9%) | 66 (3.7%) |
| 10:00 AM to 10:59 AM | 53 (2.8%) | 83 (4.7%) |
| 11:00 AM to 11:59 AM | 18 (0.9%) | 6 (0.3%) |
| 12:00 PM to 3:59 PM | 154 (8.0%) | 138 (7.8%) |
| 4:00 PM to 11:59 PM | 178 (9.3%) | 101 (5.7%) |
| Total | 1,920 (100.0%) | 1,769 (100.0%) |
Housing Occupancy in Iron County
Occupancy by Ownership in Iron County
Of the total 3,821 dwellings in Iron County, owner-occupied units account for 2,984 (78.1%), while renter-occupied units make up 837 (21.9%).
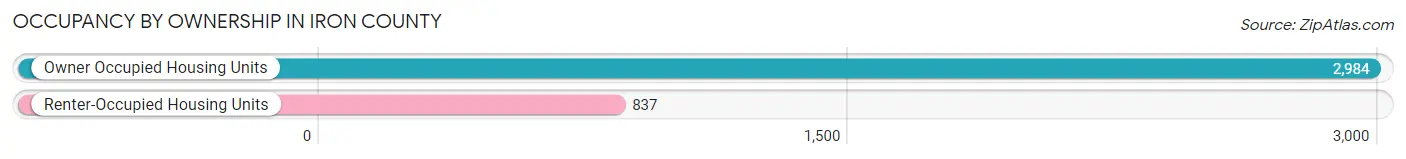
| Occupancy | # Housing Units | % Housing Units |
| Owner Occupied Housing Units | 2,984 | 78.1% |
| Renter-Occupied Housing Units | 837 | 21.9% |
| Total Occupied Housing Units | 3,821 | 100.0% |
Occupancy by Household Size in Iron County
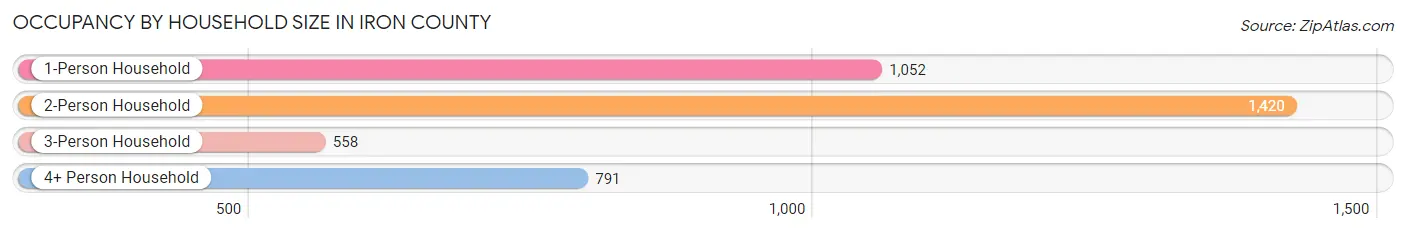
| Household Size | # Housing Units | % Housing Units |
| 1-Person Household | 1,052 | 27.5% |
| 2-Person Household | 1,420 | 37.2% |
| 3-Person Household | 558 | 14.6% |
| 4+ Person Household | 791 | 20.7% |
| Total Housing Units | 3,821 | 100.0% |
Occupancy by Ownership by Household Size in Iron County
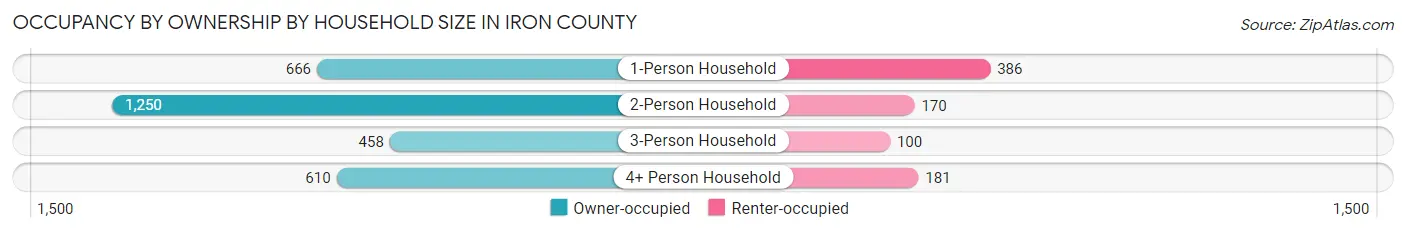
| Household Size | Owner-occupied | Renter-occupied |
| 1-Person Household | 666 (63.3%) | 386 (36.7%) |
| 2-Person Household | 1,250 (88.0%) | 170 (12.0%) |
| 3-Person Household | 458 (82.1%) | 100 (17.9%) |
| 4+ Person Household | 610 (77.1%) | 181 (22.9%) |
| Total Housing Units | 2,984 (78.1%) | 837 (21.9%) |
Occupancy by Educational Attainment in Iron County
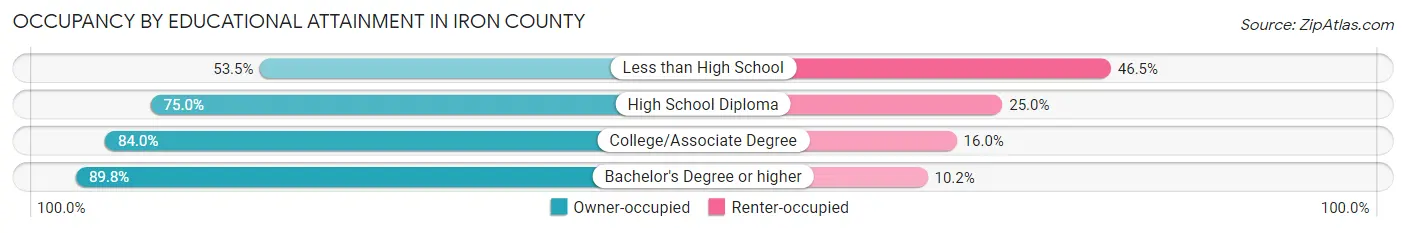
| Household Size | Owner-occupied | Renter-occupied |
| Less than High School | 239 (53.5%) | 208 (46.5%) |
| High School Diploma | 1,080 (75.0%) | 360 (25.0%) |
| College/Associate Degree | 1,048 (84.0%) | 199 (16.0%) |
| Bachelor's Degree or higher | 617 (89.8%) | 70 (10.2%) |
Occupancy by Age of Householder in Iron County
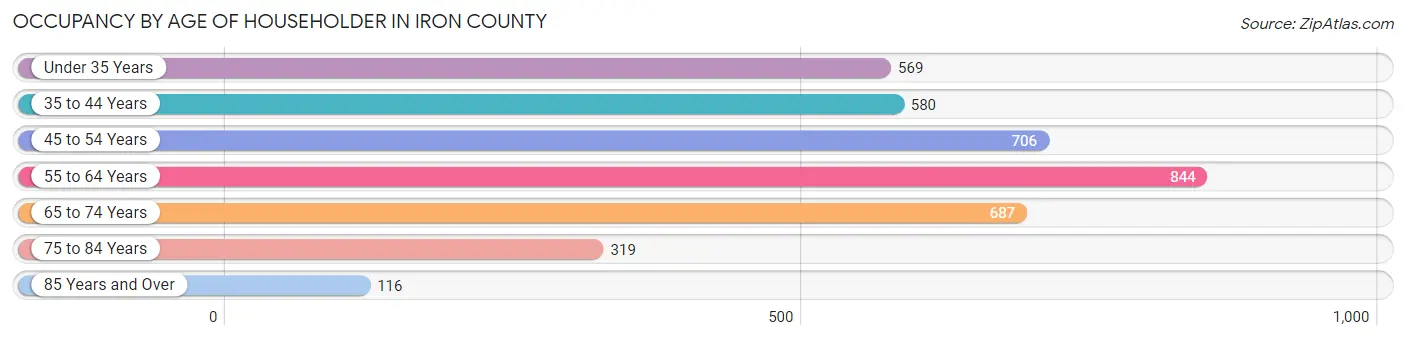
| Age Bracket | # Households | % Households |
| Under 35 Years | 569 | 14.9% |
| 35 to 44 Years | 580 | 15.2% |
| 45 to 54 Years | 706 | 18.5% |
| 55 to 64 Years | 844 | 22.1% |
| 65 to 74 Years | 687 | 18.0% |
| 75 to 84 Years | 319 | 8.4% |
| 85 Years and Over | 116 | 3.0% |
| Total | 3,821 | 100.0% |
Housing Finances in Iron County
Median Income by Occupancy in Iron County
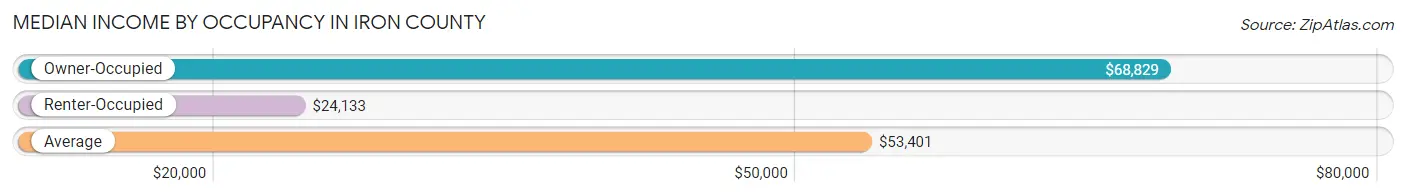
| Occupancy Type | # Households | Median Income |
| Owner-Occupied | 2,984 (78.1%) | $68,829 |
| Renter-Occupied | 837 (21.9%) | $24,133 |
| Average | 3,821 (100.0%) | $53,401 |
Occupancy by Householder Income Bracket in Iron County
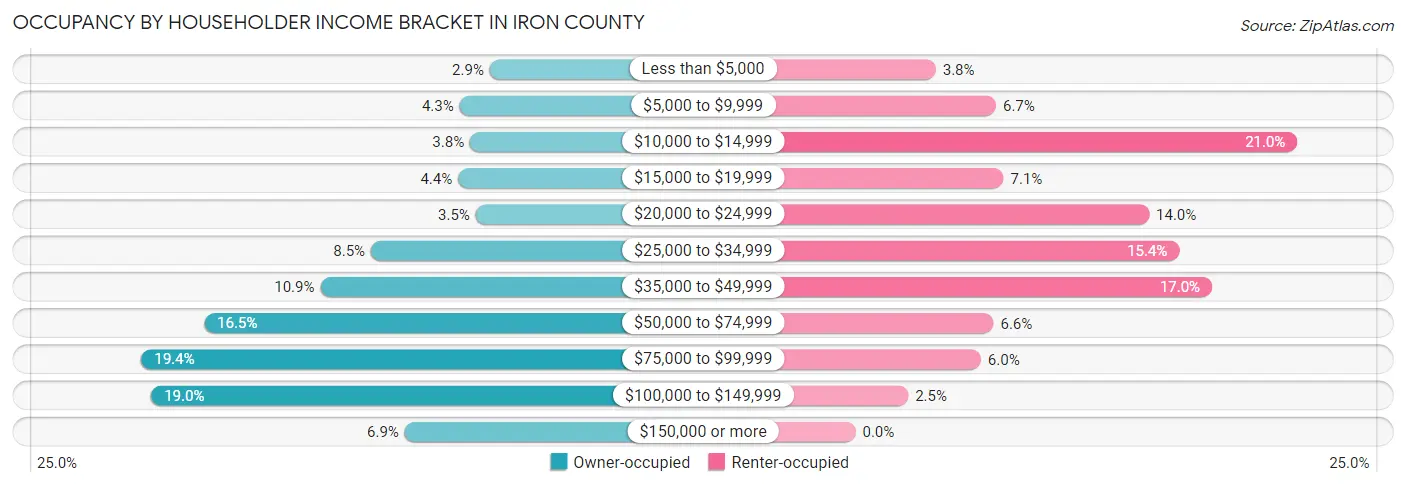
| Income Bracket | Owner-occupied | Renter-occupied |
| Less than $5,000 | 85 (2.9%) | 32 (3.8%) |
| $5,000 to $9,999 | 128 (4.3%) | 56 (6.7%) |
| $10,000 to $14,999 | 113 (3.8%) | 176 (21.0%) |
| $15,000 to $19,999 | 130 (4.4%) | 59 (7.0%) |
| $20,000 to $24,999 | 105 (3.5%) | 117 (14.0%) |
| $25,000 to $34,999 | 254 (8.5%) | 129 (15.4%) |
| $35,000 to $49,999 | 326 (10.9%) | 142 (17.0%) |
| $50,000 to $74,999 | 491 (16.5%) | 55 (6.6%) |
| $75,000 to $99,999 | 580 (19.4%) | 50 (6.0%) |
| $100,000 to $149,999 | 566 (19.0%) | 21 (2.5%) |
| $150,000 or more | 206 (6.9%) | 0 (0.0%) |
| Total | 2,984 (100.0%) | 837 (100.0%) |
Monthly Housing Cost Tiers in Iron County
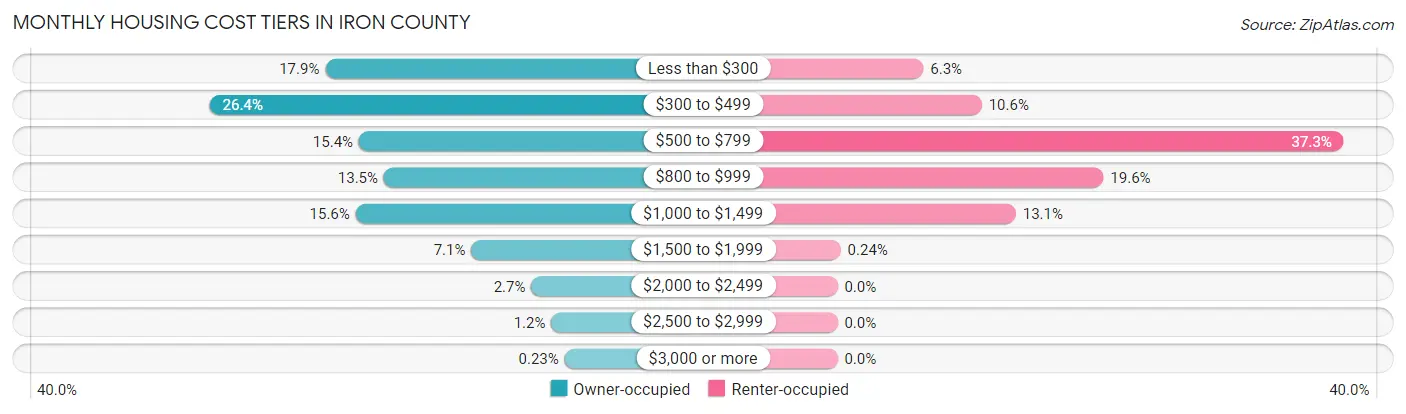
| Monthly Cost | Owner-occupied | Renter-occupied |
| Less than $300 | 533 (17.9%) | 53 (6.3%) |
| $300 to $499 | 787 (26.4%) | 89 (10.6%) |
| $500 to $799 | 459 (15.4%) | 312 (37.3%) |
| $800 to $999 | 404 (13.5%) | 164 (19.6%) |
| $1,000 to $1,499 | 466 (15.6%) | 110 (13.1%) |
| $1,500 to $1,999 | 212 (7.1%) | 2 (0.2%) |
| $2,000 to $2,499 | 80 (2.7%) | 0 (0.0%) |
| $2,500 to $2,999 | 36 (1.2%) | 0 (0.0%) |
| $3,000 or more | 7 (0.2%) | 0 (0.0%) |
| Total | 2,984 (100.0%) | 837 (100.0%) |
Physical Housing Characteristics in Iron County
Housing Structures in Iron County
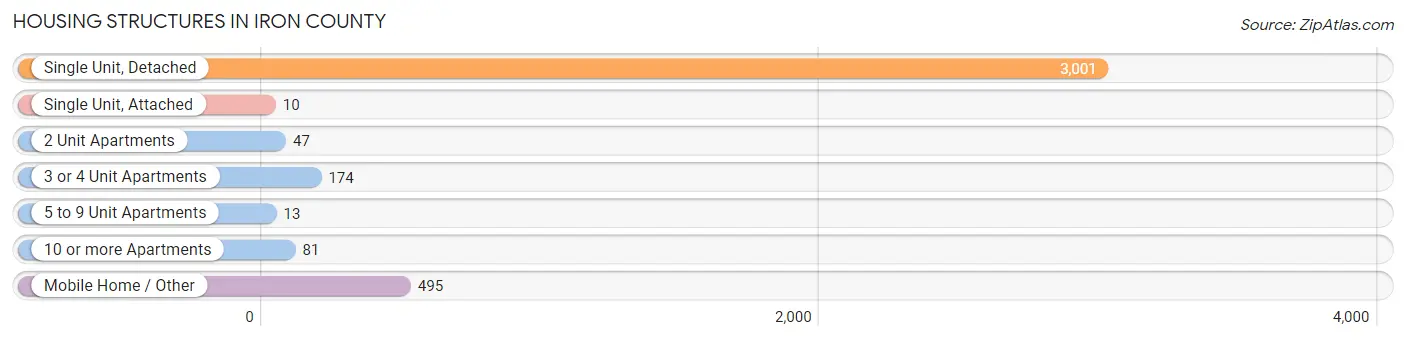
| Structure Type | # Housing Units | % Housing Units |
| Single Unit, Detached | 3,001 | 78.5% |
| Single Unit, Attached | 10 | 0.3% |
| 2 Unit Apartments | 47 | 1.2% |
| 3 or 4 Unit Apartments | 174 | 4.5% |
| 5 to 9 Unit Apartments | 13 | 0.3% |
| 10 or more Apartments | 81 | 2.1% |
| Mobile Home / Other | 495 | 13.0% |
| Total | 3,821 | 100.0% |
Housing Structures by Occupancy in Iron County
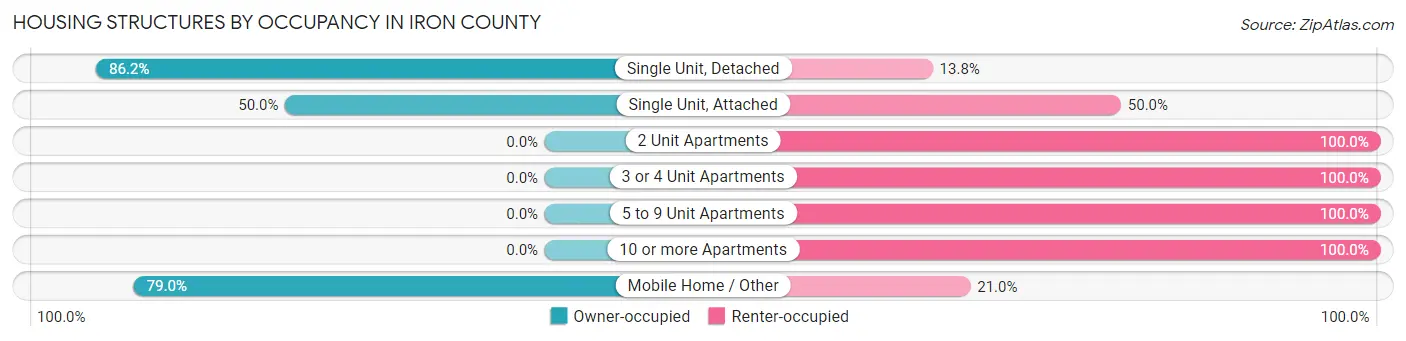
| Structure Type | Owner-occupied | Renter-occupied |
| Single Unit, Detached | 2,588 (86.2%) | 413 (13.8%) |
| Single Unit, Attached | 5 (50.0%) | 5 (50.0%) |
| 2 Unit Apartments | 0 (0.0%) | 47 (100.0%) |
| 3 or 4 Unit Apartments | 0 (0.0%) | 174 (100.0%) |
| 5 to 9 Unit Apartments | 0 (0.0%) | 13 (100.0%) |
| 10 or more Apartments | 0 (0.0%) | 81 (100.0%) |
| Mobile Home / Other | 391 (79.0%) | 104 (21.0%) |
| Total | 2,984 (78.1%) | 837 (21.9%) |
Housing Structures by Number of Rooms in Iron County
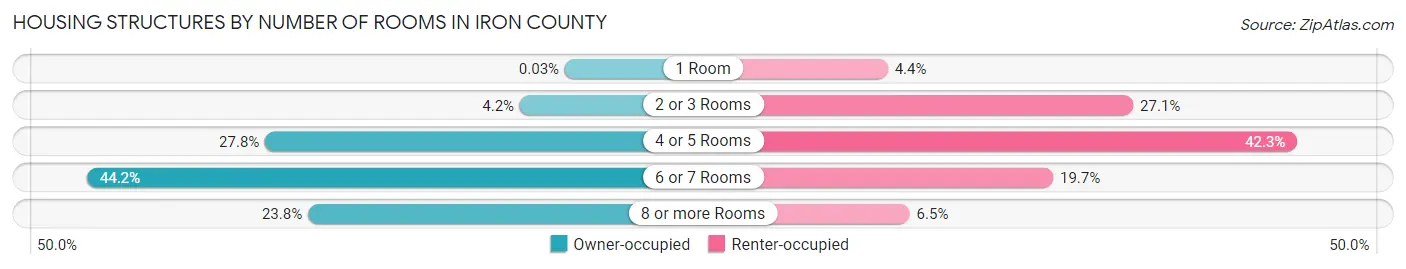
| Number of Rooms | Owner-occupied | Renter-occupied |
| 1 Room | 1 (0.0%) | 37 (4.4%) |
| 2 or 3 Rooms | 125 (4.2%) | 227 (27.1%) |
| 4 or 5 Rooms | 828 (27.8%) | 354 (42.3%) |
| 6 or 7 Rooms | 1,320 (44.2%) | 165 (19.7%) |
| 8 or more Rooms | 710 (23.8%) | 54 (6.5%) |
| Total | 2,984 (100.0%) | 837 (100.0%) |
Housing Structure by Heating Type in Iron County
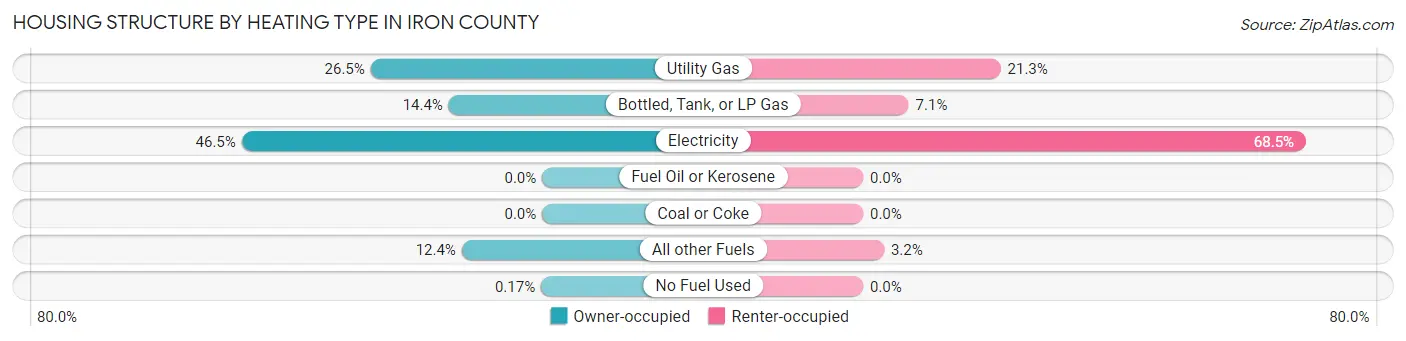
| Heating Type | Owner-occupied | Renter-occupied |
| Utility Gas | 791 (26.5%) | 178 (21.3%) |
| Bottled, Tank, or LP Gas | 431 (14.4%) | 59 (7.0%) |
| Electricity | 1,386 (46.5%) | 573 (68.5%) |
| Fuel Oil or Kerosene | 0 (0.0%) | 0 (0.0%) |
| Coal or Coke | 0 (0.0%) | 0 (0.0%) |
| All other Fuels | 371 (12.4%) | 27 (3.2%) |
| No Fuel Used | 5 (0.2%) | 0 (0.0%) |
| Total | 2,984 (100.0%) | 837 (100.0%) |
Household Vehicle Usage in Iron County
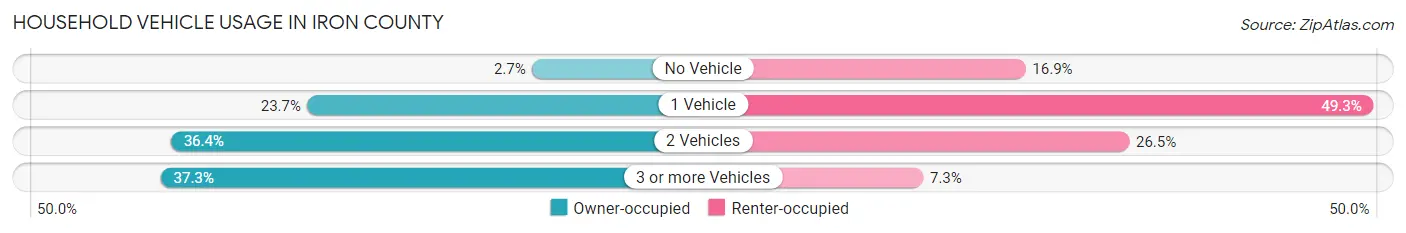
| Vehicles per Household | Owner-occupied | Renter-occupied |
| No Vehicle | 80 (2.7%) | 141 (16.9%) |
| 1 Vehicle | 706 (23.7%) | 413 (49.3%) |
| 2 Vehicles | 1,085 (36.4%) | 222 (26.5%) |
| 3 or more Vehicles | 1,113 (37.3%) | 61 (7.3%) |
| Total | 2,984 (100.0%) | 837 (100.0%) |
Real Estate & Mortgages in Iron County
Real Estate and Mortgage Overview in Iron County
| Characteristic | Without Mortgage | With Mortgage |
| Housing Units | 1,469 | 1,515 |
| Median Property Value | $96,200 | $119,500 |
| Median Household Income | $47,475 | $140 |
| Monthly Housing Costs | $344 | $6 |
| Real Estate Taxes | $615 | $24 |
Property Value by Mortgage Status in Iron County
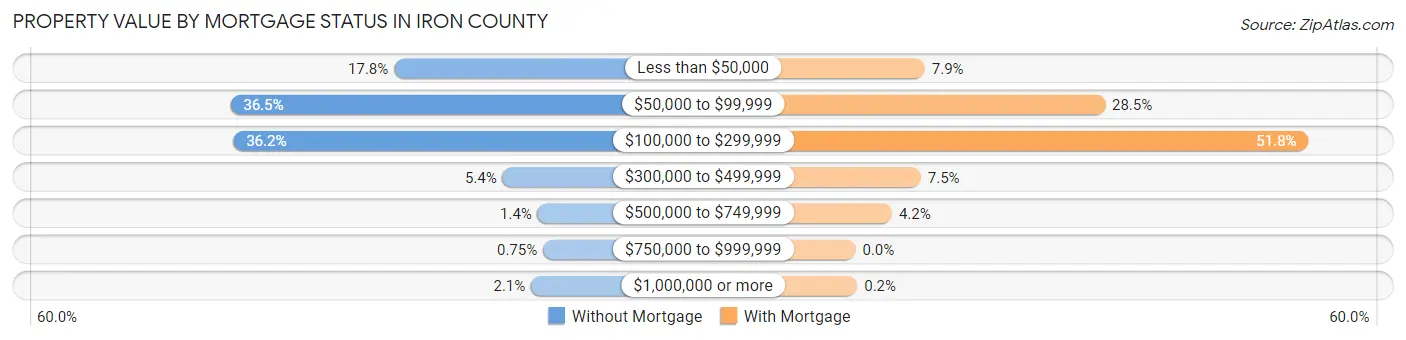
| Property Value | Without Mortgage | With Mortgage |
| Less than $50,000 | 261 (17.8%) | 120 (7.9%) |
| $50,000 to $99,999 | 536 (36.5%) | 432 (28.5%) |
| $100,000 to $299,999 | 531 (36.1%) | 784 (51.7%) |
| $300,000 to $499,999 | 79 (5.4%) | 113 (7.5%) |
| $500,000 to $749,999 | 20 (1.4%) | 63 (4.2%) |
| $750,000 to $999,999 | 11 (0.7%) | 0 (0.0%) |
| $1,000,000 or more | 31 (2.1%) | 3 (0.2%) |
| Total | 1,469 (100.0%) | 1,515 (100.0%) |
Household Income by Mortgage Status in Iron County
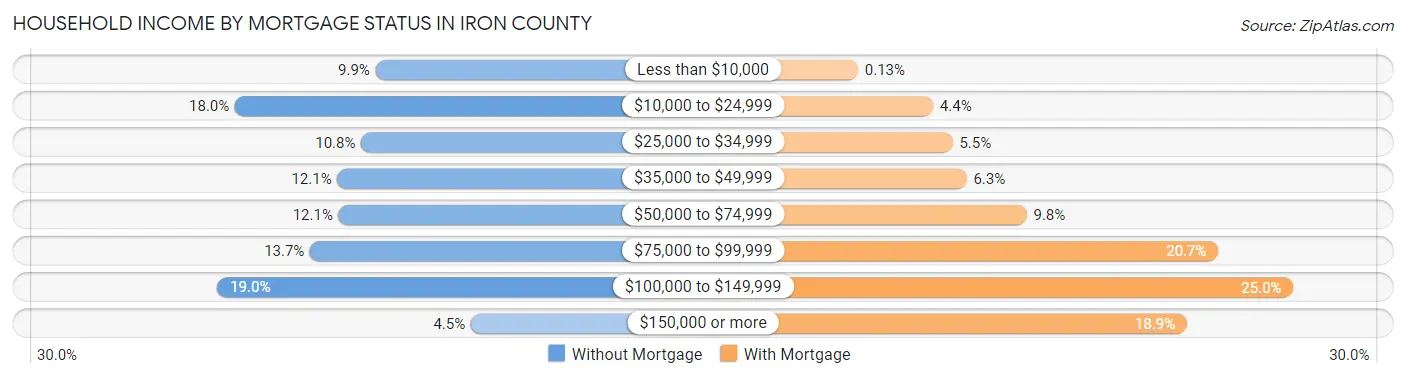
| Household Income | Without Mortgage | With Mortgage |
| Less than $10,000 | 146 (9.9%) | 2 (0.1%) |
| $10,000 to $24,999 | 264 (18.0%) | 67 (4.4%) |
| $25,000 to $34,999 | 158 (10.8%) | 84 (5.5%) |
| $35,000 to $49,999 | 178 (12.1%) | 96 (6.3%) |
| $50,000 to $74,999 | 177 (12.0%) | 148 (9.8%) |
| $75,000 to $99,999 | 201 (13.7%) | 314 (20.7%) |
| $100,000 to $149,999 | 279 (19.0%) | 379 (25.0%) |
| $150,000 or more | 66 (4.5%) | 287 (18.9%) |
| Total | 1,469 (100.0%) | 1,515 (100.0%) |
Property Value to Household Income Ratio in Iron County
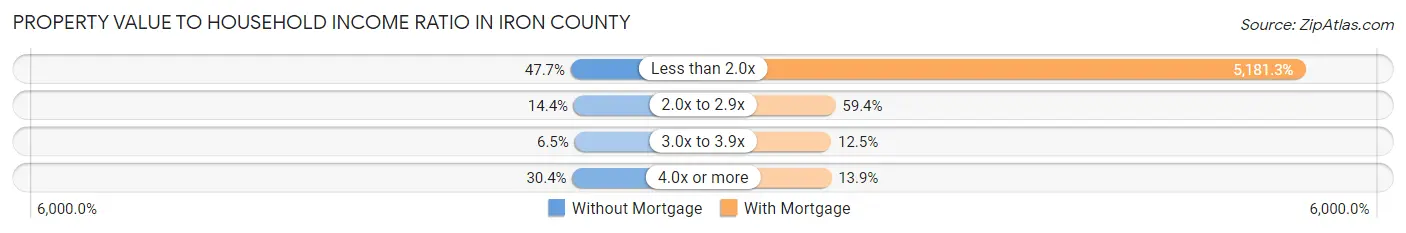
| Value-to-Income Ratio | Without Mortgage | With Mortgage |
| Less than 2.0x | 700 (47.6%) | 78,497 (5,181.3%) |
| 2.0x to 2.9x | 212 (14.4%) | 900 (59.4%) |
| 3.0x to 3.9x | 96 (6.5%) | 189 (12.5%) |
| 4.0x or more | 447 (30.4%) | 210 (13.9%) |
| Total | 1,469 (100.0%) | 1,515 (100.0%) |
Real Estate Taxes by Mortgage Status in Iron County
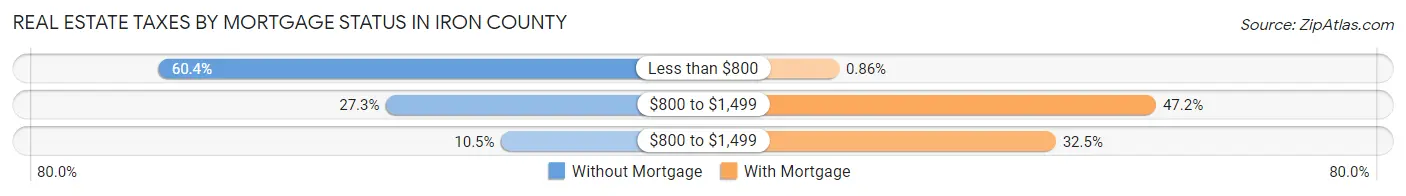
| Property Taxes | Without Mortgage | With Mortgage |
| Less than $800 | 887 (60.4%) | 13 (0.9%) |
| $800 to $1,499 | 401 (27.3%) | 715 (47.2%) |
| $800 to $1,499 | 154 (10.5%) | 493 (32.5%) |
| Total | 1,469 (100.0%) | 1,515 (100.0%) |
Health & Disability in Iron County
Health Insurance Coverage by Age in Iron County
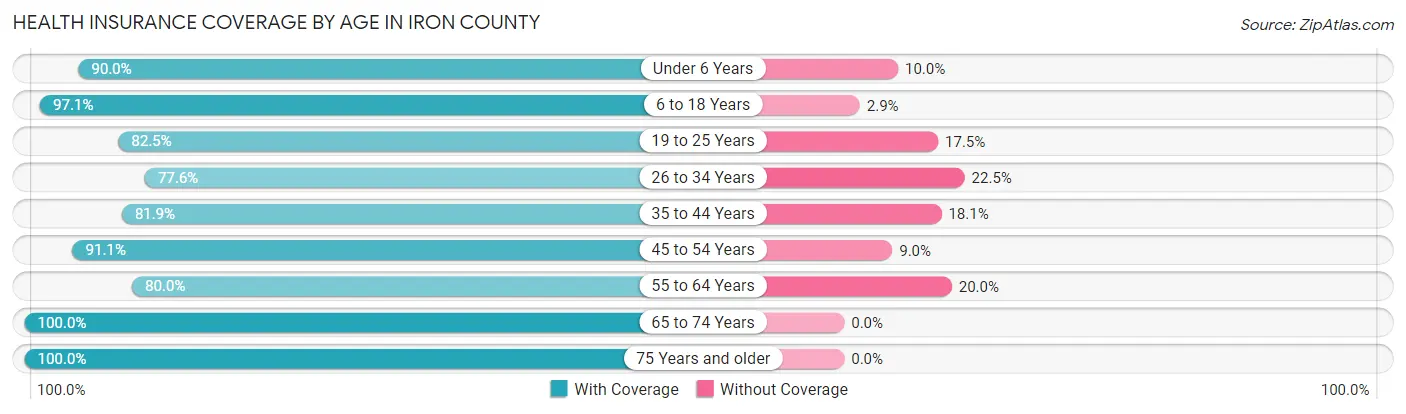
| Age Bracket | With Coverage | Without Coverage |
| Under 6 Years | 547 (90.0%) | 61 (10.0%) |
| 6 to 18 Years | 1,441 (97.1%) | 43 (2.9%) |
| 19 to 25 Years | 604 (82.5%) | 128 (17.5%) |
| 26 to 34 Years | 615 (77.5%) | 178 (22.5%) |
| 35 to 44 Years | 904 (81.9%) | 200 (18.1%) |
| 45 to 54 Years | 1,079 (91.0%) | 106 (8.9%) |
| 55 to 64 Years | 1,185 (80.0%) | 297 (20.0%) |
| 65 to 74 Years | 1,181 (100.0%) | 0 (0.0%) |
| 75 Years and older | 645 (100.0%) | 0 (0.0%) |
| Total | 8,201 (89.0%) | 1,013 (11.0%) |
Health Insurance Coverage by Citizenship Status in Iron County
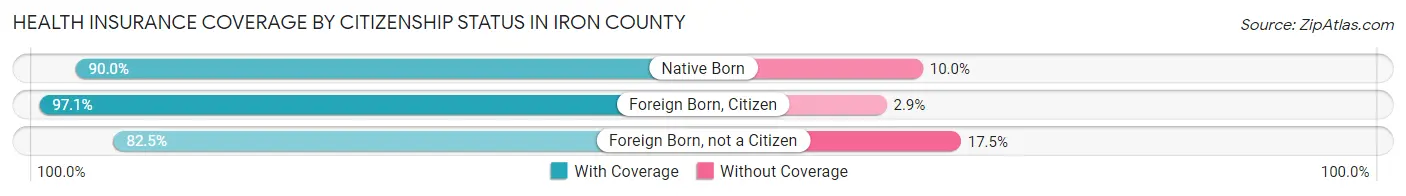
| Citizenship Status | With Coverage | Without Coverage |
| Native Born | 547 (90.0%) | 61 (10.0%) |
| Foreign Born, Citizen | 1,441 (97.1%) | 43 (2.9%) |
| Foreign Born, not a Citizen | 604 (82.5%) | 128 (17.5%) |
Health Insurance Coverage by Household Income in Iron County
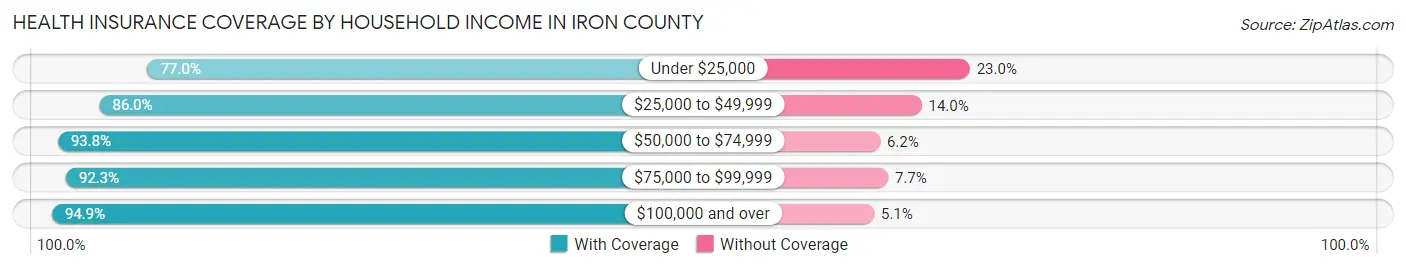
| Household Income | With Coverage | Without Coverage |
| Under $25,000 | 1,390 (77.0%) | 416 (23.0%) |
| $25,000 to $49,999 | 1,565 (86.0%) | 255 (14.0%) |
| $50,000 to $74,999 | 1,359 (93.8%) | 90 (6.2%) |
| $75,000 to $99,999 | 1,505 (92.3%) | 126 (7.7%) |
| $100,000 and over | 2,345 (94.9%) | 126 (5.1%) |
Public vs Private Health Insurance Coverage by Age in Iron County
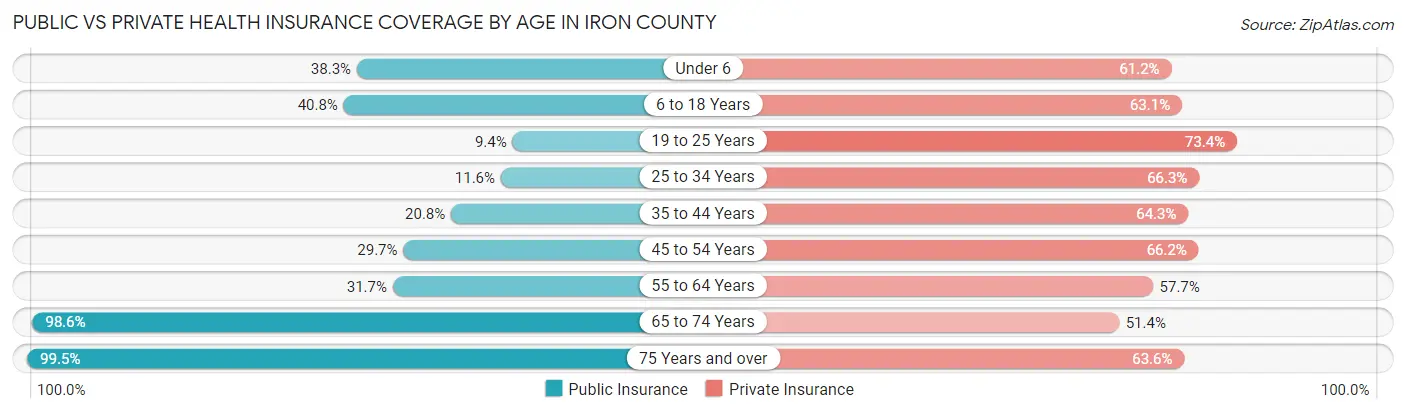
| Age Bracket | Public Insurance | Private Insurance |
| Under 6 | 233 (38.3%) | 372 (61.2%) |
| 6 to 18 Years | 605 (40.8%) | 937 (63.1%) |
| 19 to 25 Years | 69 (9.4%) | 537 (73.4%) |
| 25 to 34 Years | 92 (11.6%) | 526 (66.3%) |
| 35 to 44 Years | 230 (20.8%) | 710 (64.3%) |
| 45 to 54 Years | 352 (29.7%) | 785 (66.2%) |
| 55 to 64 Years | 469 (31.7%) | 855 (57.7%) |
| 65 to 74 Years | 1,164 (98.6%) | 607 (51.4%) |
| 75 Years and over | 642 (99.5%) | 410 (63.6%) |
| Total | 3,856 (41.8%) | 5,739 (62.3%) |
Disability Status by Sex by Age in Iron County
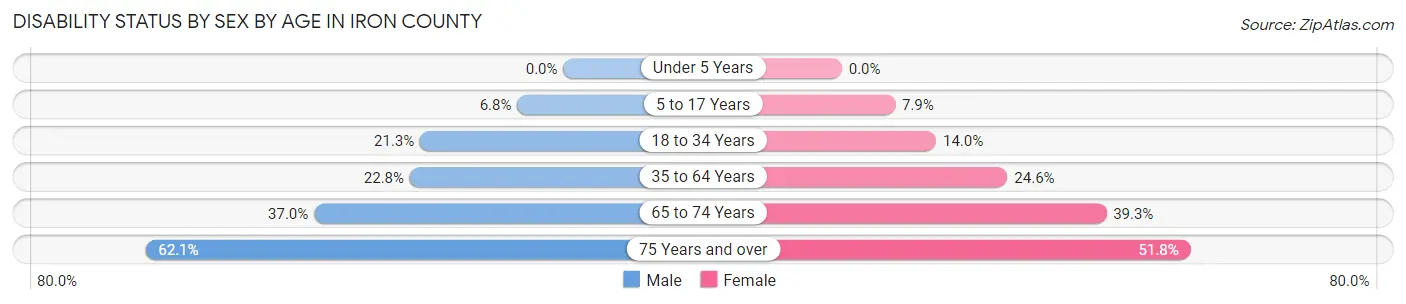
| Age Bracket | Male | Female |
| Under 5 Years | 0 (0.0%) | 0 (0.0%) |
| 5 to 17 Years | 51 (6.8%) | 57 (7.9%) |
| 18 to 34 Years | 178 (21.3%) | 113 (14.0%) |
| 35 to 64 Years | 433 (22.8%) | 460 (24.6%) |
| 65 to 74 Years | 208 (37.0%) | 243 (39.3%) |
| 75 Years and over | 175 (62.1%) | 188 (51.8%) |
Disability Class by Sex by Age in Iron County
Disability Class: Hearing Difficulty
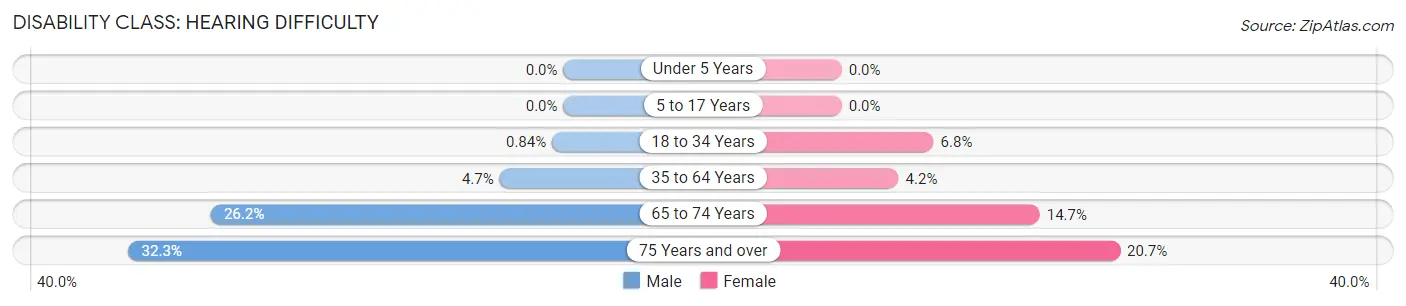
| Age Bracket | Male | Female |
| Under 5 Years | 0 (0.0%) | 0 (0.0%) |
| 5 to 17 Years | 0 (0.0%) | 0 (0.0%) |
| 18 to 34 Years | 7 (0.8%) | 55 (6.8%) |
| 35 to 64 Years | 90 (4.7%) | 79 (4.2%) |
| 65 to 74 Years | 147 (26.2%) | 91 (14.7%) |
| 75 Years and over | 91 (32.3%) | 75 (20.7%) |
Disability Class: Vision Difficulty
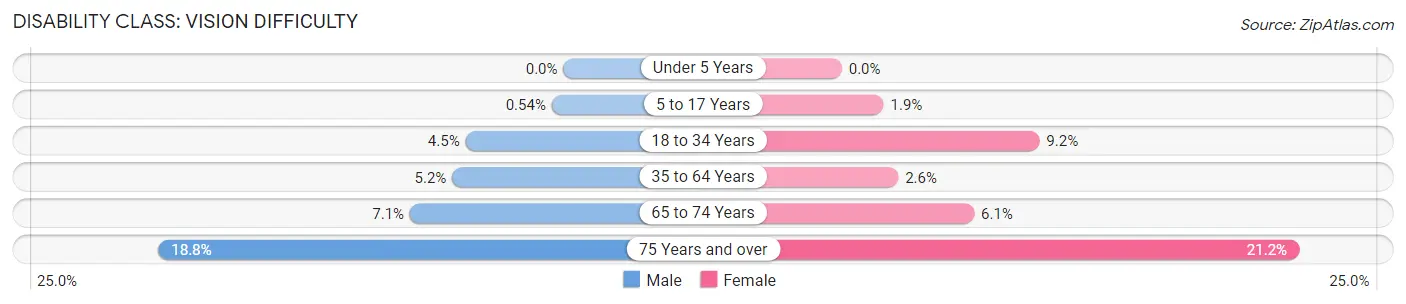
| Age Bracket | Male | Female |
| Under 5 Years | 0 (0.0%) | 0 (0.0%) |
| 5 to 17 Years | 4 (0.5%) | 14 (1.9%) |
| 18 to 34 Years | 38 (4.5%) | 74 (9.2%) |
| 35 to 64 Years | 98 (5.2%) | 49 (2.6%) |
| 65 to 74 Years | 40 (7.1%) | 38 (6.1%) |
| 75 Years and over | 53 (18.8%) | 77 (21.2%) |
Disability Class: Cognitive Difficulty
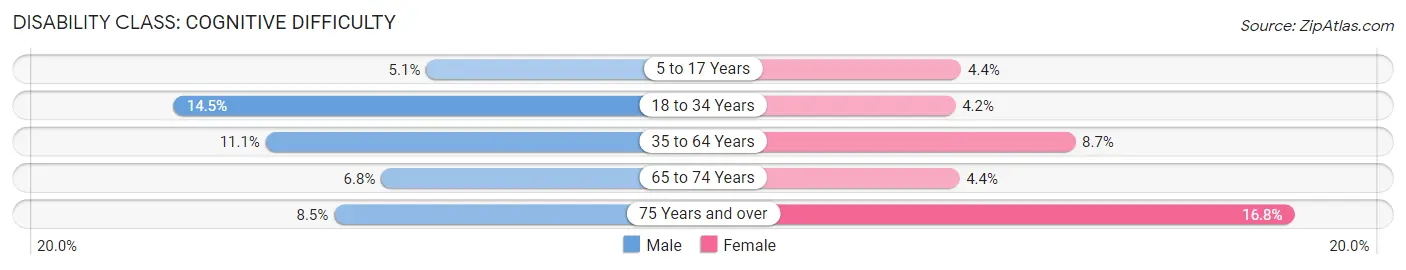
| Age Bracket | Male | Female |
| 5 to 17 Years | 38 (5.1%) | 32 (4.4%) |
| 18 to 34 Years | 121 (14.5%) | 34 (4.2%) |
| 35 to 64 Years | 210 (11.1%) | 162 (8.7%) |
| 65 to 74 Years | 38 (6.8%) | 27 (4.4%) |
| 75 Years and over | 24 (8.5%) | 61 (16.8%) |
Disability Class: Ambulatory Difficulty
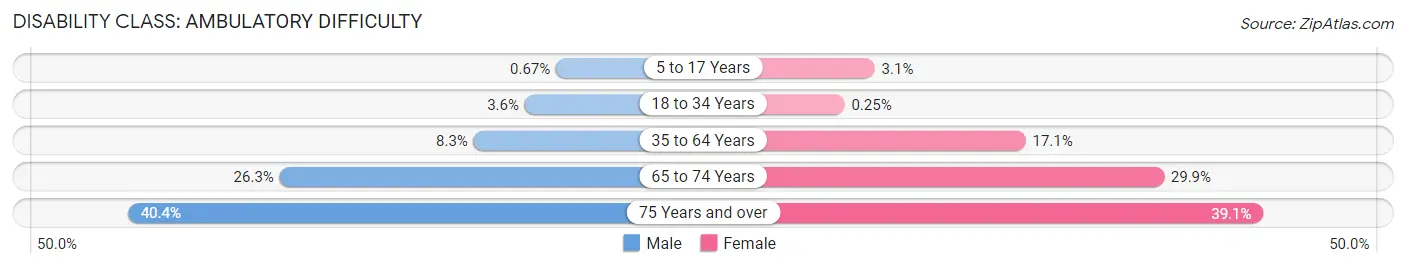
| Age Bracket | Male | Female |
| 5 to 17 Years | 5 (0.7%) | 22 (3.0%) |
| 18 to 34 Years | 30 (3.6%) | 2 (0.3%) |
| 35 to 64 Years | 158 (8.3%) | 319 (17.1%) |
| 65 to 74 Years | 148 (26.3%) | 185 (29.9%) |
| 75 Years and over | 114 (40.4%) | 142 (39.1%) |
Disability Class: Self-Care Difficulty
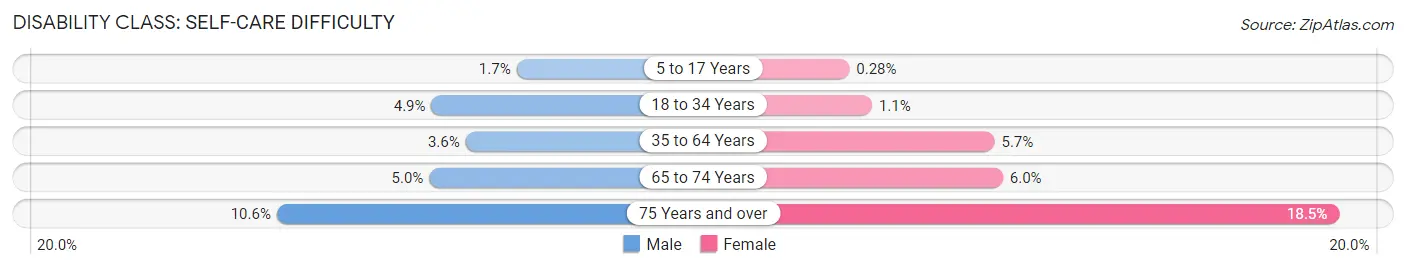
| Age Bracket | Male | Female |
| 5 to 17 Years | 13 (1.7%) | 2 (0.3%) |
| 18 to 34 Years | 41 (4.9%) | 9 (1.1%) |
| 35 to 64 Years | 69 (3.6%) | 106 (5.7%) |
| 65 to 74 Years | 28 (5.0%) | 37 (6.0%) |
| 75 Years and over | 30 (10.6%) | 67 (18.5%) |
Technology Access in Iron County
Computing Device Access in Iron County
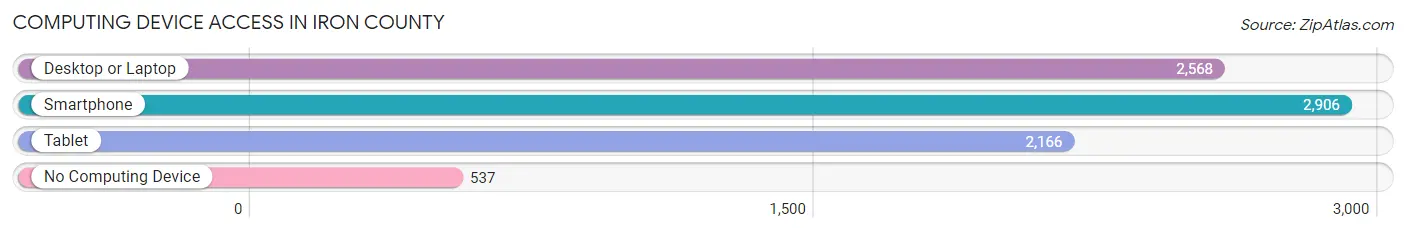
| Device Type | # Households | % Households |
| Desktop or Laptop | 2,568 | 67.2% |
| Smartphone | 2,906 | 76.0% |
| Tablet | 2,166 | 56.7% |
| No Computing Device | 537 | 14.1% |
| Total | 3,821 | 100.0% |
Internet Access in Iron County
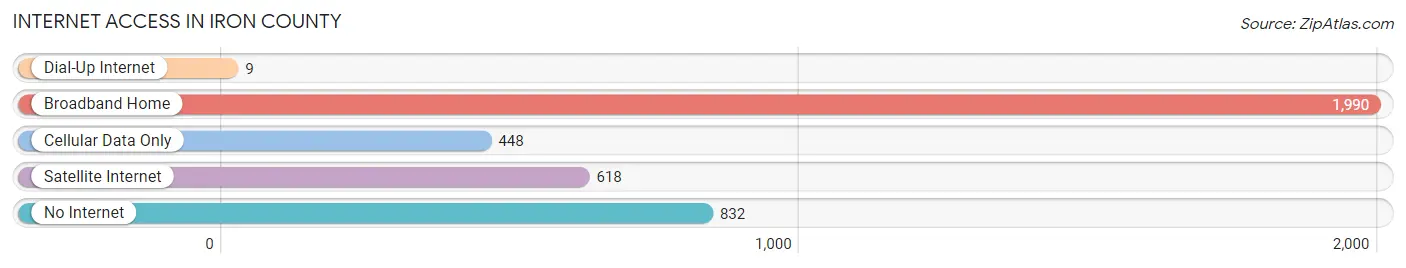
| Internet Type | # Households | % Households |
| Dial-Up Internet | 9 | 0.2% |
| Broadband Home | 1,990 | 52.1% |
| Cellular Data Only | 448 | 11.7% |
| Satellite Internet | 618 | 16.2% |
| No Internet | 832 | 21.8% |
| Total | 3,821 | 100.0% |
Iron County Summary
Iron County is located in the southeastern corner of Missouri, and is bordered by Madison County to the north, Reynolds County to the east, Wayne County to the south, and St. Francois County to the west. The county seat is Ironton, and the county was officially organized in 1857. Iron County is part of the Arcadia Valley Region, and is home to the Mark Twain National Forest.
Geography
Iron County covers an area of 545 square miles, and is located in the Ozark Mountains. The county is mostly hilly and forested, with the highest point being Pilot Knob at 1,541 feet. The county is drained by the St. Francis River, which flows through the county from north to south. Other major waterways include the Big River, which flows through the western part of the county, and the Black River, which flows through the eastern part of the county.
The county is home to several state parks, including Johnson's Shut-Ins State Park, which is located in the northern part of the county, and Elephant Rocks State Park, which is located in the southern part of the county. The county is also home to several wildlife management areas, including the Big River Wildlife Management Area, which is located in the western part of the county, and the Black River Wildlife Management Area, which is located in the eastern part of the county.
Demographics
As of the 2010 census, Iron County had a population of 10,630. The racial makeup of the county was 95.3% White, 2.3% Black or African American, 0.3% Native American, 0.2% Asian, 0.1% Pacific Islander, 0.4% from other races, and 1.4% from two or more races. 1.7% of the population were Hispanic or Latino of any race.
The median income for a household in the county was $35,945, and the median income for a family was $41,945. The per capita income for the county was $17,845. About 16.2% of the population were below the poverty line.
Economy
The economy of Iron County is largely based on agriculture and tourism. The county is home to several farms, which produce a variety of crops, including corn, soybeans, wheat, hay, and livestock. The county is also home to several tourist attractions, including Johnson's Shut-Ins State Park, Elephant Rocks State Park, and the Mark Twain National Forest.
The county is also home to several manufacturing companies, including the Iron County Manufacturing Company, which produces a variety of products, including furniture, cabinets, and other wood products. The county is also home to several mining companies, which produce a variety of minerals, including iron ore, lead, zinc, and copper.
Conclusion
Iron County is a rural county located in the southeastern corner of Missouri. The county is home to several state parks, wildlife management areas, and tourist attractions, and is largely supported by agriculture and tourism. The county is also home to several manufacturing and mining companies, which provide employment opportunities for the residents of the county.
Common Questions
What is Per Capita Income in Iron County?
Per Capita income in Iron County is $26,798.
What is the Median Family Income in Iron County?
Median Family Income in Iron County is $69,508.
What is the Median Household income in Iron County?
Median Household Income in Iron County is $53,401.
What is Income or Wage Gap in Iron County?
Income or Wage Gap in Iron County is 21.9%.
Women in Iron County earn 78.1 cents for every dollar earned by a man.
What is Family Income Deficit in Iron County?
Family Income Deficit in Iron County is $9,757.
Families that are below poverty line in Iron County earn $9,757 less on average than the poverty threshold level.
What is Inequality or Gini Index in Iron County?
Inequality or Gini Index in Iron County is 0.43.
What is the Total Population of Iron County?
Total Population of Iron County is 9,538.
What is the Total Male Population of Iron County?
Total Male Population of Iron County is 4,762.
What is the Total Female Population of Iron County?
Total Female Population of Iron County is 4,776.
What is the Ratio of Males per 100 Females in Iron County?
There are 99.71 Males per 100 Females in Iron County.
What is the Ratio of Females per 100 Males in Iron County?
There are 100.29 Females per 100 Males in Iron County.
What is the Median Population Age in Iron County?
Median Population Age in Iron County is 45.1 Years.
What is the Average Family Size in Iron County
Average Family Size in Iron County is 2.9 People.
What is the Average Household Size in Iron County
Average Household Size in Iron County is 2.4 People.
How Large is the Labor Force in Iron County?
There are 4,053 People in the Labor Forcein in Iron County.
What is the Percentage of People in the Labor Force in Iron County?
52.4% of People are in the Labor Force in Iron County.
What is the Unemployment Rate in Iron County?
Unemployment Rate in Iron County is 3.3%.