Hickory County, MO Map & Demographics
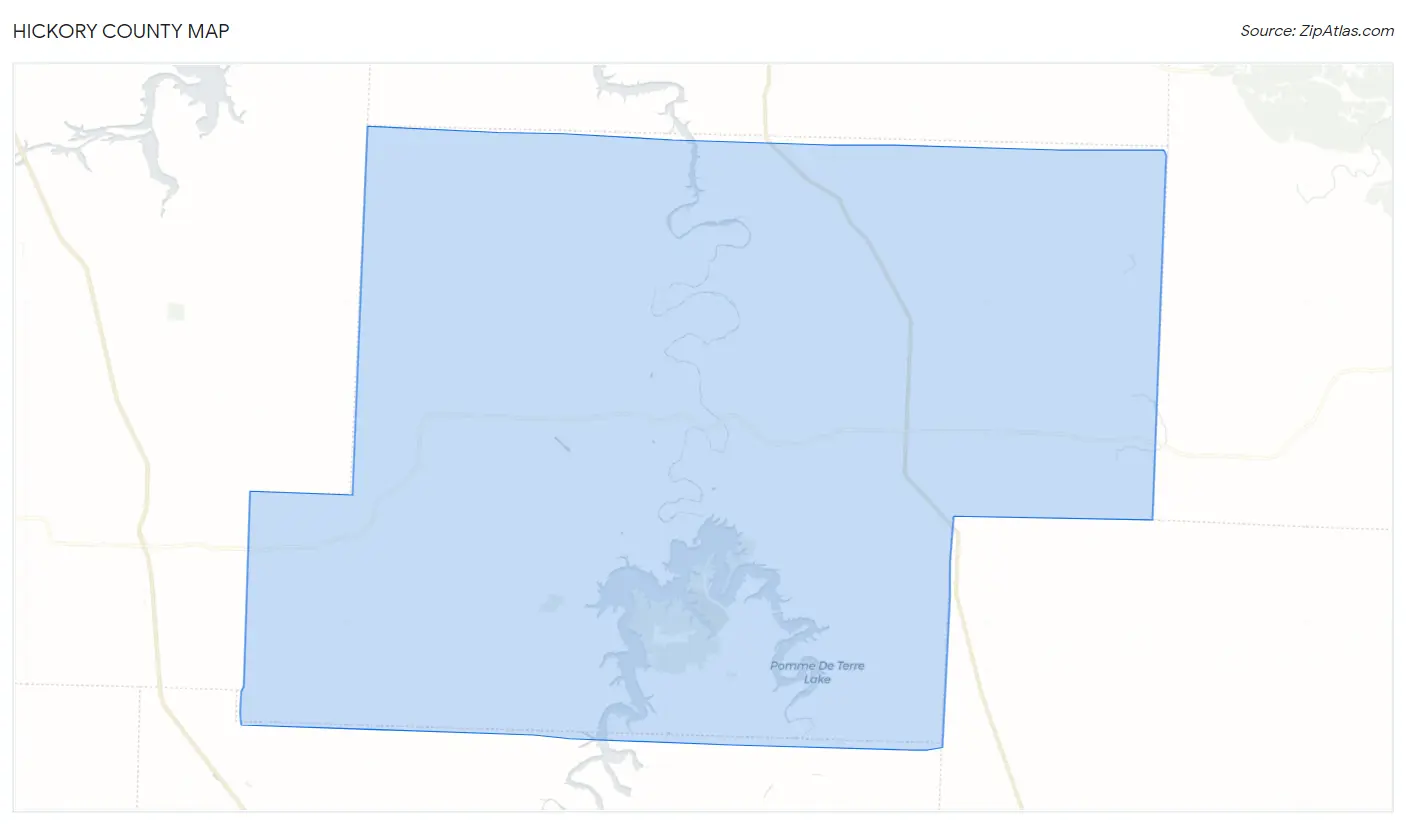
Hickory County Map
Hickory County Overview
$21,476
PER CAPITA INCOME
$52,151
AVG FAMILY INCOME
$33,302
AVG HOUSEHOLD INCOME
27.3%
WAGE / INCOME GAP [ % ]
72.7¢/ $1
WAGE / INCOME GAP [ $ ]
0.45
INEQUALITY / GINI INDEX
8,452
TOTAL POPULATION
4,307
MALE POPULATION
4,145
FEMALE POPULATION
103.91
MALES / 100 FEMALES
96.24
FEMALES / 100 MALES
55.7
MEDIAN AGE
3.4
AVG FAMILY SIZE
2.4
AVG HOUSEHOLD SIZE
2,811
LABOR FORCE [ PEOPLE ]
39.1%
PERCENT IN LABOR FORCE
8.8%
UNEMPLOYMENT RATE
Income in Hickory County
Income Overview in Hickory County
Per Capita Income in Hickory County is $21,476, while median incomes of families and households are $52,151 and $33,302 respectively.
| Characteristic | Number | Measure |
| Per Capita Income | 8,452 | $21,476 |
| Median Family Income | 1,864 | $52,151 |
| Mean Family Income | 1,864 | $61,594 |
| Median Household Income | 3,504 | $33,302 |
| Mean Household Income | 3,504 | $45,556 |
| Income Deficit | 1,864 | $0 |
| Wage / Income Gap (%) | 8,452 | 27.34% |
| Wage / Income Gap ($) | 8,452 | 72.66¢ per $1 |
| Gini / Inequality Index | 8,452 | 0.45 |
Earnings by Sex in Hickory County
Average Earnings in Hickory County are $26,226, $28,715 for men and $20,864 for women, a difference of 27.3%.
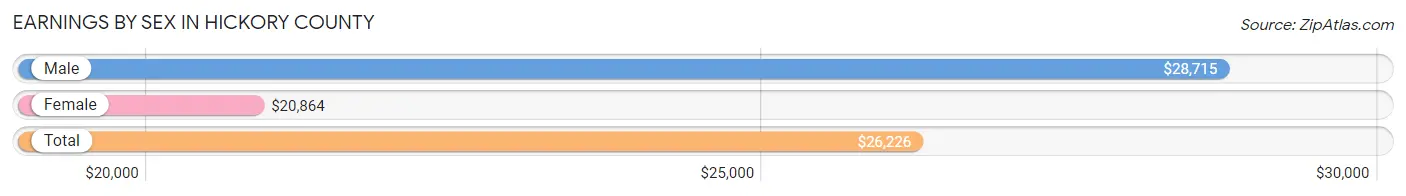
| Sex | Number | Average Earnings |
| Male | 1,685 (53.9%) | $28,715 |
| Female | 1,441 (46.1%) | $20,864 |
| Total | 3,126 (100.0%) | $26,226 |
Earnings by Sex by Income Bracket in Hickory County
The most common earnings brackets in Hickory County are $25,000 to $29,999 for men (307 | 18.2%) and $25,000 to $29,999 for women (218 | 15.1%).
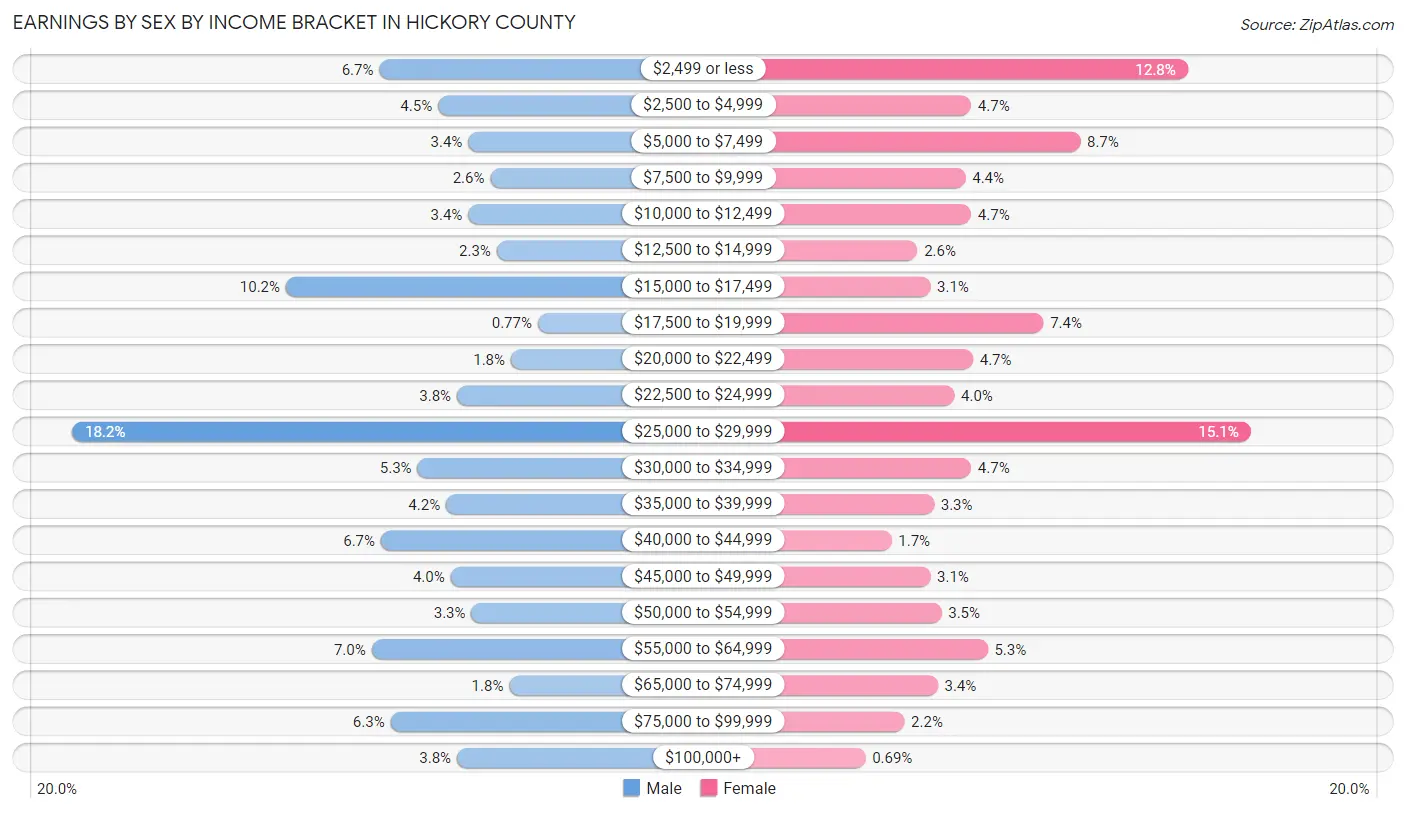
| Income | Male | Female |
| $2,499 or less | 113 (6.7%) | 184 (12.8%) |
| $2,500 to $4,999 | 76 (4.5%) | 67 (4.6%) |
| $5,000 to $7,499 | 57 (3.4%) | 126 (8.7%) |
| $7,500 to $9,999 | 43 (2.5%) | 64 (4.4%) |
| $10,000 to $12,499 | 57 (3.4%) | 67 (4.6%) |
| $12,500 to $14,999 | 39 (2.3%) | 38 (2.6%) |
| $15,000 to $17,499 | 172 (10.2%) | 45 (3.1%) |
| $17,500 to $19,999 | 13 (0.8%) | 106 (7.4%) |
| $20,000 to $22,499 | 30 (1.8%) | 68 (4.7%) |
| $22,500 to $24,999 | 64 (3.8%) | 58 (4.0%) |
| $25,000 to $29,999 | 307 (18.2%) | 218 (15.1%) |
| $30,000 to $34,999 | 89 (5.3%) | 67 (4.6%) |
| $35,000 to $39,999 | 71 (4.2%) | 47 (3.3%) |
| $40,000 to $44,999 | 112 (6.7%) | 24 (1.7%) |
| $45,000 to $49,999 | 68 (4.0%) | 45 (3.1%) |
| $50,000 to $54,999 | 55 (3.3%) | 51 (3.5%) |
| $55,000 to $64,999 | 118 (7.0%) | 76 (5.3%) |
| $65,000 to $74,999 | 31 (1.8%) | 49 (3.4%) |
| $75,000 to $99,999 | 106 (6.3%) | 31 (2.1%) |
| $100,000+ | 64 (3.8%) | 10 (0.7%) |
| Total | 1,685 (100.0%) | 1,441 (100.0%) |
Earnings by Sex by Educational Attainment in Hickory County
Average earnings in Hickory County are $29,185 for men and $22,482 for women, a difference of 23.0%. Men with an educational attainment of bachelor's degree enjoy the highest average annual earnings of $55,208, while those with less than high school education earn the least with $24,286. Women with an educational attainment of graduate degree earn the most with the average annual earnings of $59,449, while those with less than high school education have the smallest earnings of $17,583.
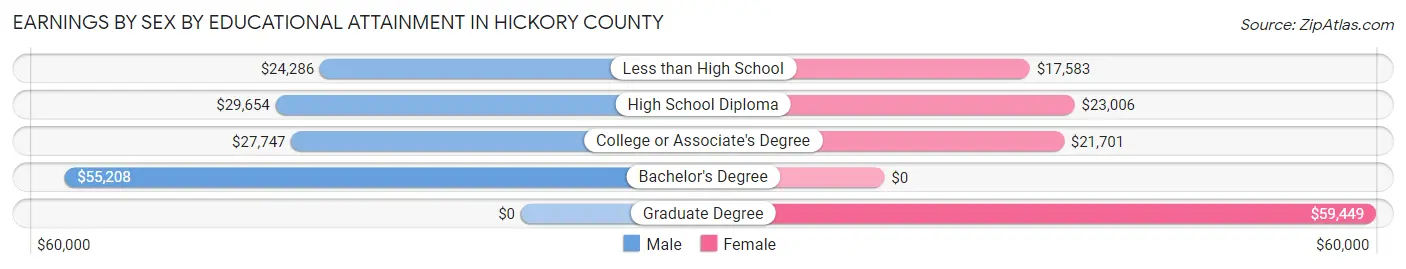
| Educational Attainment | Male Income | Female Income |
| Less than High School | $24,286 | $17,583 |
| High School Diploma | $29,654 | $23,006 |
| College or Associate's Degree | $27,747 | $21,701 |
| Bachelor's Degree | $55,208 | $0 |
| Graduate Degree | - | - |
| Total | $29,185 | $22,482 |
Family Income in Hickory County
Family Income Brackets in Hickory County
According to the Hickory County family income data, there are 492 families falling into the $50,000 to $74,999 income range, which is the most common income bracket and makes up 26.4% of all families. Conversely, the $10,000 to $14,999 income bracket is the least frequent group with only 15 families (0.8%) belonging to this category.
| Income Bracket | # Families | % Families |
| Less than $10,000 | 145 | 7.8% |
| $10,000 to $14,999 | 15 | 0.8% |
| $15,000 to $24,999 | 240 | 12.9% |
| $25,000 to $34,999 | 293 | 15.7% |
| $35,000 to $49,999 | 201 | 10.8% |
| $50,000 to $74,999 | 492 | 26.4% |
| $75,000 to $99,999 | 170 | 9.1% |
| $100,000 to $149,999 | 218 | 11.7% |
| $150,000 to $199,999 | 47 | 2.5% |
| $200,000+ | 41 | 2.2% |
Family Income by Famaliy Size in Hickory County
5-person families (148 | 7.9%) account for the highest median family income in Hickory County with $113,077 per family, while 5-person families (148 | 7.9%) have the highest median income of $22,615 per family member.
| Income Bracket | # Families | Median Income |
| 2-Person Families | 1,284 (68.9%) | $41,750 |
| 3-Person Families | 241 (12.9%) | $50,982 |
| 4-Person Families | 118 (6.3%) | $55,833 |
| 5-Person Families | 148 (7.9%) | $113,077 |
| 6-Person Families | 30 (1.6%) | $56,458 |
| 7+ Person Families | 43 (2.3%) | $87,750 |
| Total | 1,864 (100.0%) | $52,151 |
Family Income by Number of Earners in Hickory County
The median family income in Hickory County is $52,151, with families comprising 3+ earners (113) having the highest median family income of $128,860, while families with no earners (742) have the lowest median family income of $31,223, accounting for 6.1% and 39.8% of families, respectively.
| Number of Earners | # Families | Median Income |
| No Earners | 742 (39.8%) | $31,223 |
| 1 Earner | 467 (25.1%) | $47,361 |
| 2 Earners | 542 (29.1%) | $71,964 |
| 3+ Earners | 113 (6.1%) | $128,860 |
| Total | 1,864 (100.0%) | $52,151 |
Household Income in Hickory County
Household Income Brackets in Hickory County
With 617 households falling in the category, the $15,000 to $24,999 income range is the most frequent in Hickory County, accounting for 17.6% of all households. In contrast, only 42 households (1.2%) fall into the $200,000+ income bracket, making it the least populous group.
| Income Bracket | # Households | % Households |
| Less than $10,000 | 463 | 13.2% |
| $10,000 to $14,999 | 207 | 5.9% |
| $15,000 to $24,999 | 617 | 17.6% |
| $25,000 to $34,999 | 557 | 15.9% |
| $35,000 to $49,999 | 512 | 14.6% |
| $50,000 to $74,999 | 610 | 17.4% |
| $75,000 to $99,999 | 231 | 6.6% |
| $100,000 to $149,999 | 224 | 6.4% |
| $150,000 to $199,999 | 46 | 1.3% |
| $200,000+ | 42 | 1.2% |
Household Income by Householder Age in Hickory County
The median household income in Hickory County is $33,302, with the highest median household income of $42,917 found in the 25 to 44 years age bracket for the primary householder. A total of 384 households (11.0%) fall into this category. Meanwhile, the 45 to 64 years age bracket for the primary householder has the lowest median household income of $30,815, with 1,306 households (37.3%) in this group.
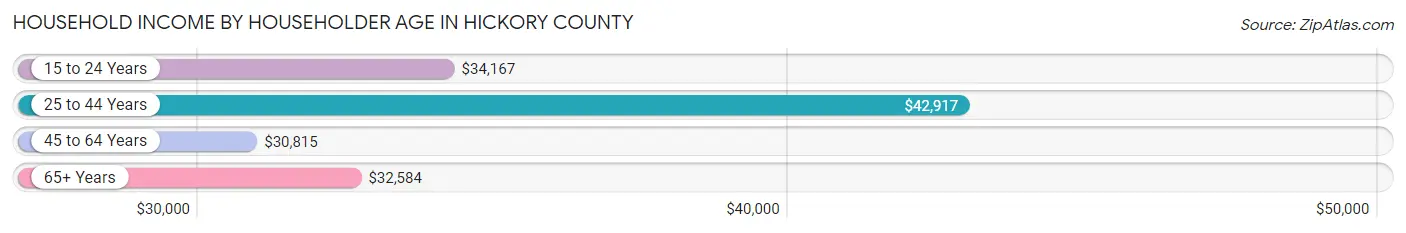
| Income Bracket | # Households | Median Income |
| 15 to 24 Years | 20 (0.6%) | $34,167 |
| 25 to 44 Years | 384 (11.0%) | $42,917 |
| 45 to 64 Years | 1,306 (37.3%) | $30,815 |
| 65+ Years | 1,794 (51.2%) | $32,584 |
| Total | 3,504 (100.0%) | $33,302 |
Poverty in Hickory County
Income Below Poverty by Sex and Age in Hickory County
With 15.2% poverty level for males and 20.1% for females among the residents of Hickory County, 5 year old males and 35 to 44 year old females are the most vulnerable to poverty, with 6 males (100.0%) and 145 females (36.5%) in their respective age groups living below the poverty level.
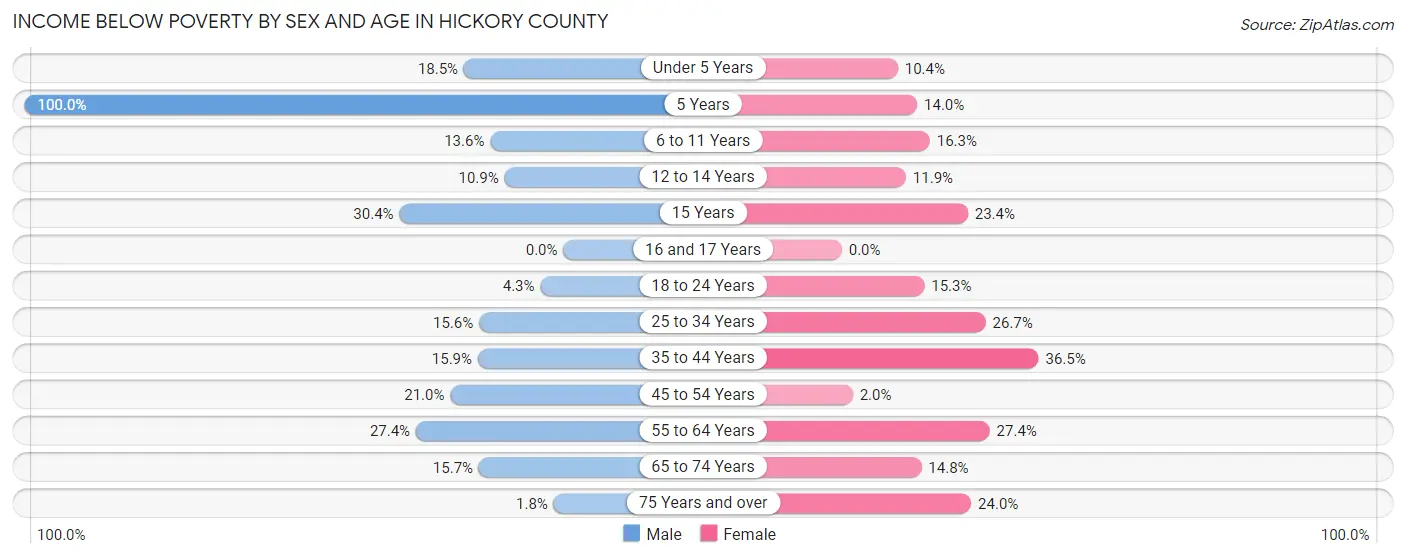
| Age Bracket | Male | Female |
| Under 5 Years | 31 (18.4%) | 16 (10.4%) |
| 5 Years | 6 (100.0%) | 13 (14.0%) |
| 6 to 11 Years | 35 (13.6%) | 33 (16.3%) |
| 12 to 14 Years | 18 (10.9%) | 10 (11.9%) |
| 15 Years | 14 (30.4%) | 18 (23.4%) |
| 16 and 17 Years | 0 (0.0%) | 0 (0.0%) |
| 18 to 24 Years | 11 (4.3%) | 45 (15.3%) |
| 25 to 34 Years | 48 (15.6%) | 67 (26.7%) |
| 35 to 44 Years | 63 (15.9%) | 145 (36.5%) |
| 45 to 54 Years | 89 (21.0%) | 8 (2.0%) |
| 55 to 64 Years | 197 (27.4%) | 197 (27.4%) |
| 65 to 74 Years | 123 (15.7%) | 116 (14.8%) |
| 75 Years and over | 10 (1.8%) | 151 (24.0%) |
| Total | 645 (15.2%) | 819 (20.1%) |
Income Above Poverty by Sex and Age in Hickory County
According to the poverty statistics in Hickory County, males aged 16 and 17 years and females aged 16 and 17 years are the age groups that are most secure financially, with 100.0% of males and 100.0% of females in these age groups living above the poverty line.
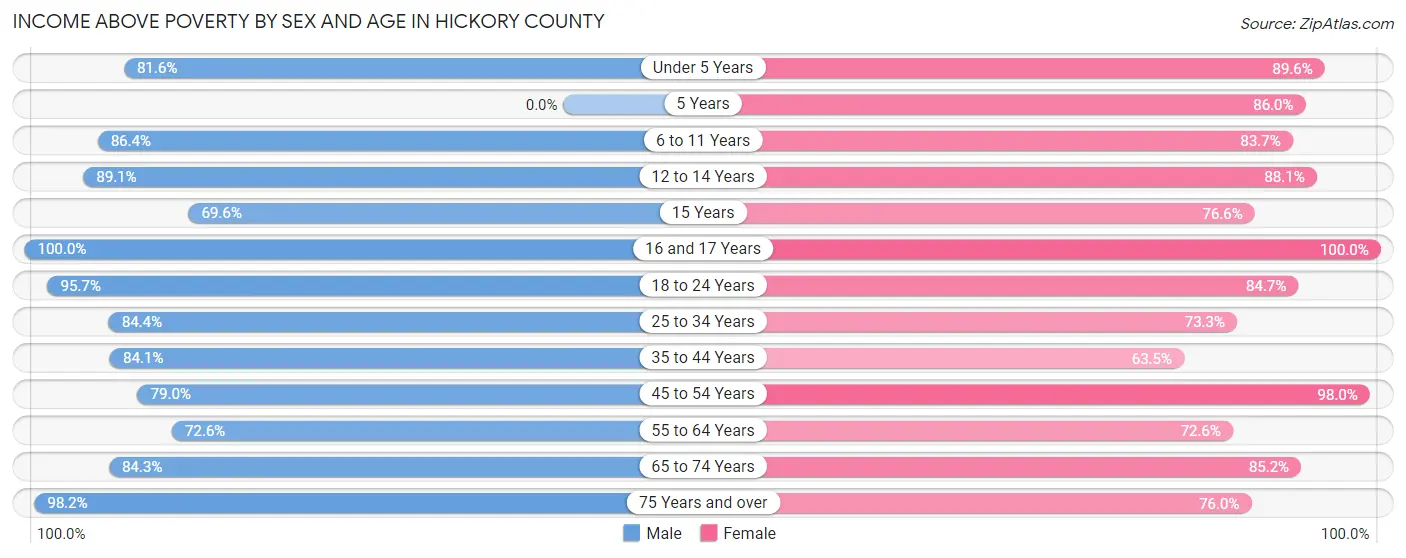
| Age Bracket | Male | Female |
| Under 5 Years | 137 (81.6%) | 138 (89.6%) |
| 5 Years | 0 (0.0%) | 80 (86.0%) |
| 6 to 11 Years | 223 (86.4%) | 169 (83.7%) |
| 12 to 14 Years | 147 (89.1%) | 74 (88.1%) |
| 15 Years | 32 (69.6%) | 59 (76.6%) |
| 16 and 17 Years | 159 (100.0%) | 4 (100.0%) |
| 18 to 24 Years | 247 (95.7%) | 249 (84.7%) |
| 25 to 34 Years | 259 (84.4%) | 184 (73.3%) |
| 35 to 44 Years | 334 (84.1%) | 252 (63.5%) |
| 45 to 54 Years | 335 (79.0%) | 386 (98.0%) |
| 55 to 64 Years | 523 (72.6%) | 521 (72.6%) |
| 65 to 74 Years | 662 (84.3%) | 669 (85.2%) |
| 75 Years and over | 547 (98.2%) | 478 (76.0%) |
| Total | 3,605 (84.8%) | 3,263 (79.9%) |
Income Below Poverty Among Married-Couple Families in Hickory County
The poverty statistics for married-couple families in Hickory County show that 11.6% or 187 of the total 1,619 families live below the poverty line. Families with no children have the highest poverty rate of 11.9%, comprising of 150 families. On the other hand, families with 5 or more children have the lowest poverty rate of 0.0%, which includes 0 families.
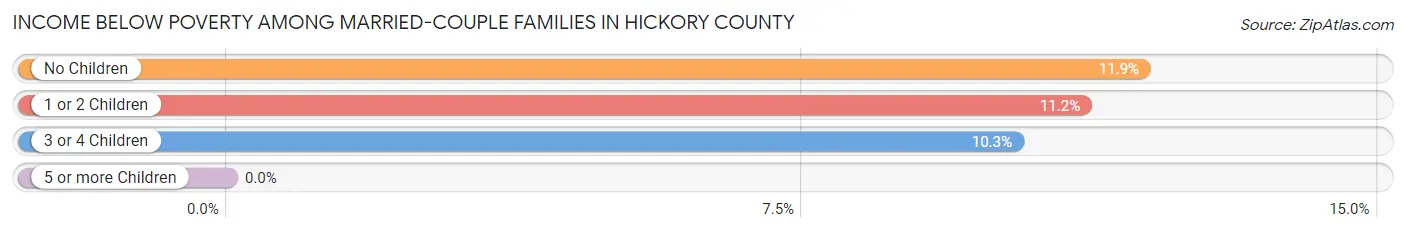
| Children | Above Poverty | Below Poverty |
| No Children | 1,108 (88.1%) | 150 (11.9%) |
| 1 or 2 Children | 231 (88.8%) | 29 (11.2%) |
| 3 or 4 Children | 70 (89.7%) | 8 (10.3%) |
| 5 or more Children | 23 (100.0%) | 0 (0.0%) |
| Total | 1,432 (88.4%) | 187 (11.6%) |
Income Below Poverty Among Single-Parent Households in Hickory County
According to the poverty data in Hickory County, 3.6% or 4 single-father households and 30.1% or 40 single-mother households are living below the poverty line. Among single-father households, those with 5 or more children have the highest poverty rate, with 1 households (100.0%) experiencing poverty. Likewise, among single-mother households, those with 3 or 4 children have the highest poverty rate, with 11 households (100.0%) falling below the poverty line.
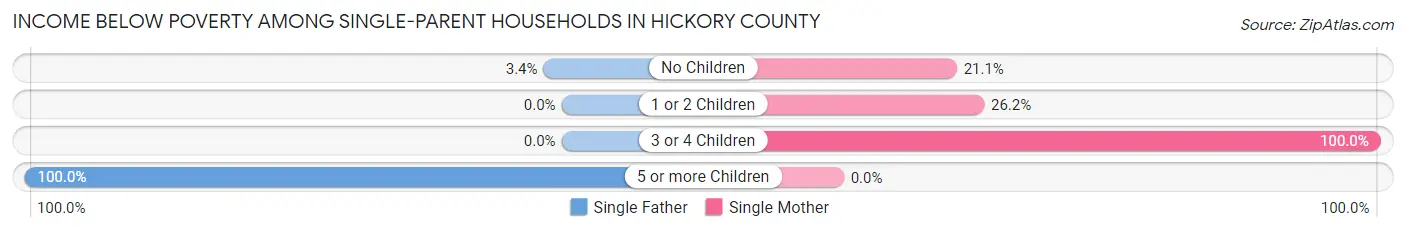
| Children | Single Father | Single Mother |
| No Children | 3 (3.4%) | 12 (21.0%) |
| 1 or 2 Children | 0 (0.0%) | 17 (26.2%) |
| 3 or 4 Children | 0 (0.0%) | 11 (100.0%) |
| 5 or more Children | 1 (100.0%) | 0 (0.0%) |
| Total | 4 (3.6%) | 40 (30.1%) |
Income Below Poverty Among Married-Couple vs Single-Parent Households in Hickory County
The poverty data for Hickory County shows that 187 of the married-couple family households (11.6%) and 44 of the single-parent households (18.0%) are living below the poverty level. Within the married-couple family households, those with no children have the highest poverty rate, with 150 households (11.9%) falling below the poverty line. Among the single-parent households, those with 3 or 4 children have the highest poverty rate, with 11 household (100.0%) living below poverty.
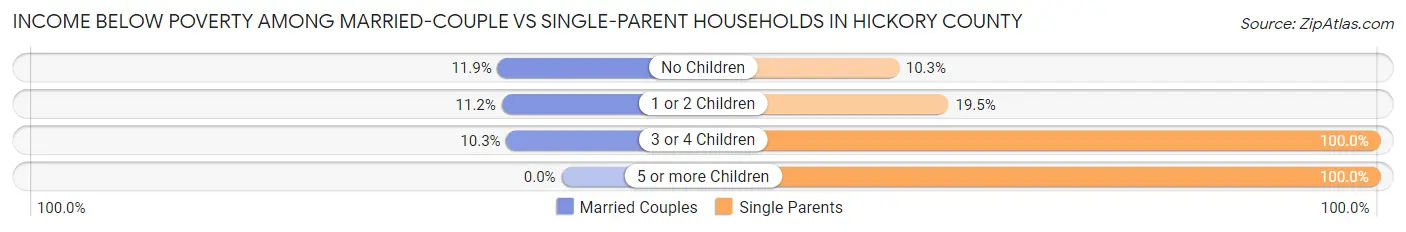
| Children | Married-Couple Families | Single-Parent Households |
| No Children | 150 (11.9%) | 15 (10.3%) |
| 1 or 2 Children | 29 (11.2%) | 17 (19.5%) |
| 3 or 4 Children | 8 (10.3%) | 11 (100.0%) |
| 5 or more Children | 0 (0.0%) | 1 (100.0%) |
| Total | 187 (11.6%) | 44 (18.0%) |
Race in Hickory County
The most populous races in Hickory County are White / Caucasian (8,071 | 95.5%), Two or more Races (289 | 3.4%), and Hispanic or Latino (180 | 2.1%).
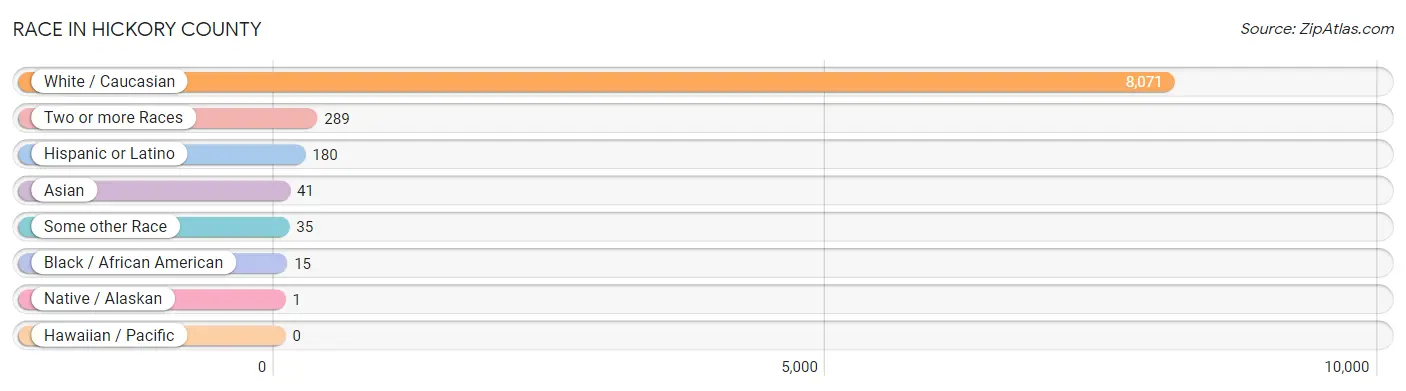
| Race | # Population | % Population |
| Asian | 41 | 0.5% |
| Black / African American | 15 | 0.2% |
| Hawaiian / Pacific | 0 | 0.0% |
| Hispanic or Latino | 180 | 2.1% |
| Native / Alaskan | 1 | 0.0% |
| White / Caucasian | 8,071 | 95.5% |
| Two or more Races | 289 | 3.4% |
| Some other Race | 35 | 0.4% |
| Total | 8,452 | 100.0% |
Ancestry in Hickory County
The most populous ancestries reported in Hickory County are German (1,545 | 18.3%), English (1,482 | 17.5%), Irish (1,167 | 13.8%), American (821 | 9.7%), and European (810 | 9.6%), together accounting for 68.9% of all Hickory County residents.
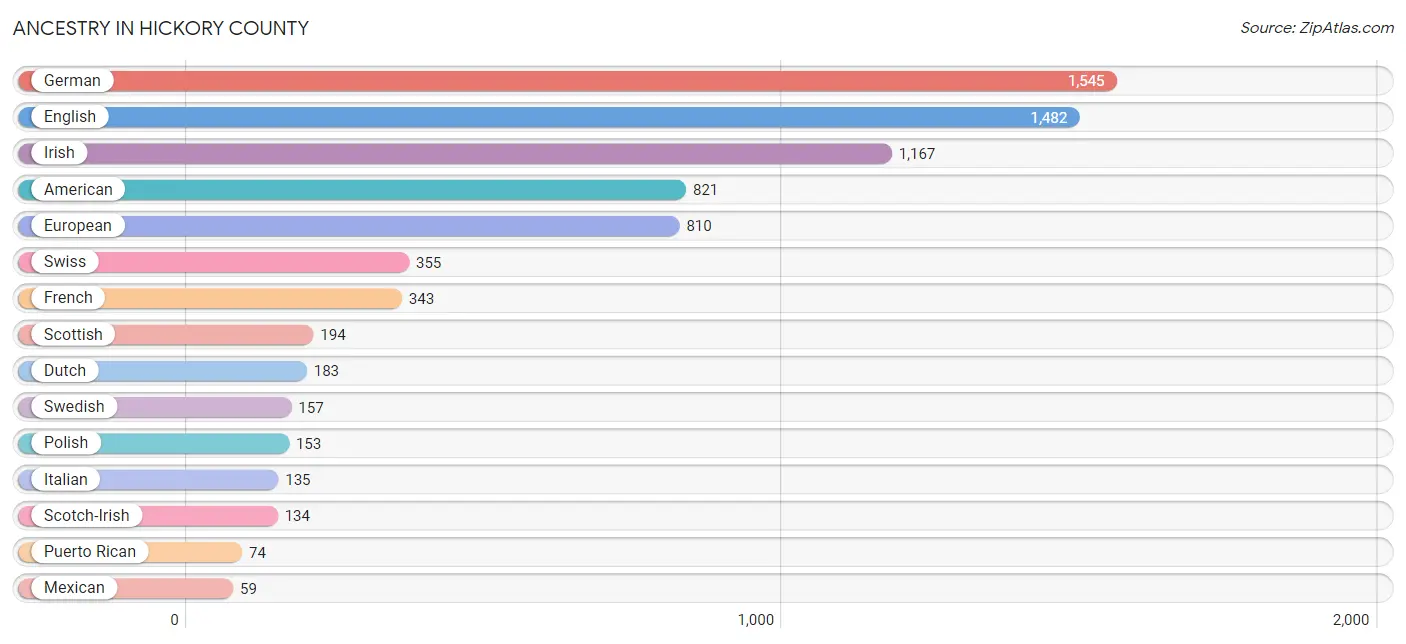
| Ancestry | # Population | % Population |
| American | 821 | 9.7% |
| Belgian | 1 | 0.0% |
| Blackfeet | 12 | 0.1% |
| British | 16 | 0.2% |
| Burmese | 15 | 0.2% |
| Cherokee | 51 | 0.6% |
| Creek | 12 | 0.1% |
| Cuban | 8 | 0.1% |
| Danish | 19 | 0.2% |
| Dominican | 37 | 0.4% |
| Dutch | 183 | 2.2% |
| English | 1,482 | 17.5% |
| European | 810 | 9.6% |
| Finnish | 20 | 0.2% |
| French | 343 | 4.1% |
| French Canadian | 2 | 0.0% |
| German | 1,545 | 18.3% |
| Icelander | 22 | 0.3% |
| Indian (Asian) | 15 | 0.2% |
| Irish | 1,167 | 13.8% |
| Italian | 135 | 1.6% |
| Korean | 43 | 0.5% |
| Lithuanian | 6 | 0.1% |
| Mexican | 59 | 0.7% |
| Norwegian | 58 | 0.7% |
| Pennsylvania German | 30 | 0.4% |
| Polish | 153 | 1.8% |
| Puerto Rican | 74 | 0.9% |
| Russian | 10 | 0.1% |
| Scotch-Irish | 134 | 1.6% |
| Scottish | 194 | 2.3% |
| Spaniard | 2 | 0.0% |
| Swedish | 157 | 1.9% |
| Swiss | 355 | 4.2% |
| Thai | 17 | 0.2% |
| Welsh | 10 | 0.1% | View All 36 Rows |
Immigrants in Hickory County
The most numerous immigrant groups reported in Hickory County came from Europe (59 | 0.7%), Western Europe (57 | 0.7%), Germany (54 | 0.6%), Asia (15 | 0.2%), and China (15 | 0.2%), together accounting for 2.4% of all Hickory County residents.
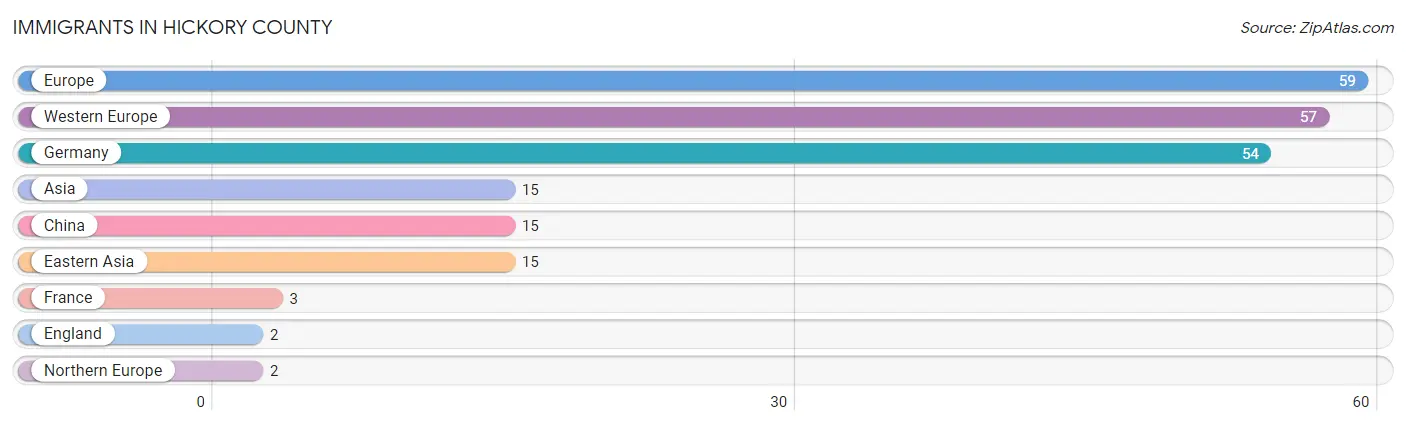
| Immigration Origin | # Population | % Population |
| Asia | 15 | 0.2% |
| China | 15 | 0.2% |
| Eastern Asia | 15 | 0.2% |
| England | 2 | 0.0% |
| Europe | 59 | 0.7% |
| France | 3 | 0.0% |
| Germany | 54 | 0.6% |
| Northern Europe | 2 | 0.0% |
| Western Europe | 57 | 0.7% | View All 9 Rows |
Sex and Age in Hickory County
Sex and Age in Hickory County
The most populous age groups in Hickory County are 60 to 64 Years (531 | 12.3%) for men and 65 to 69 Years (514 | 12.4%) for women.
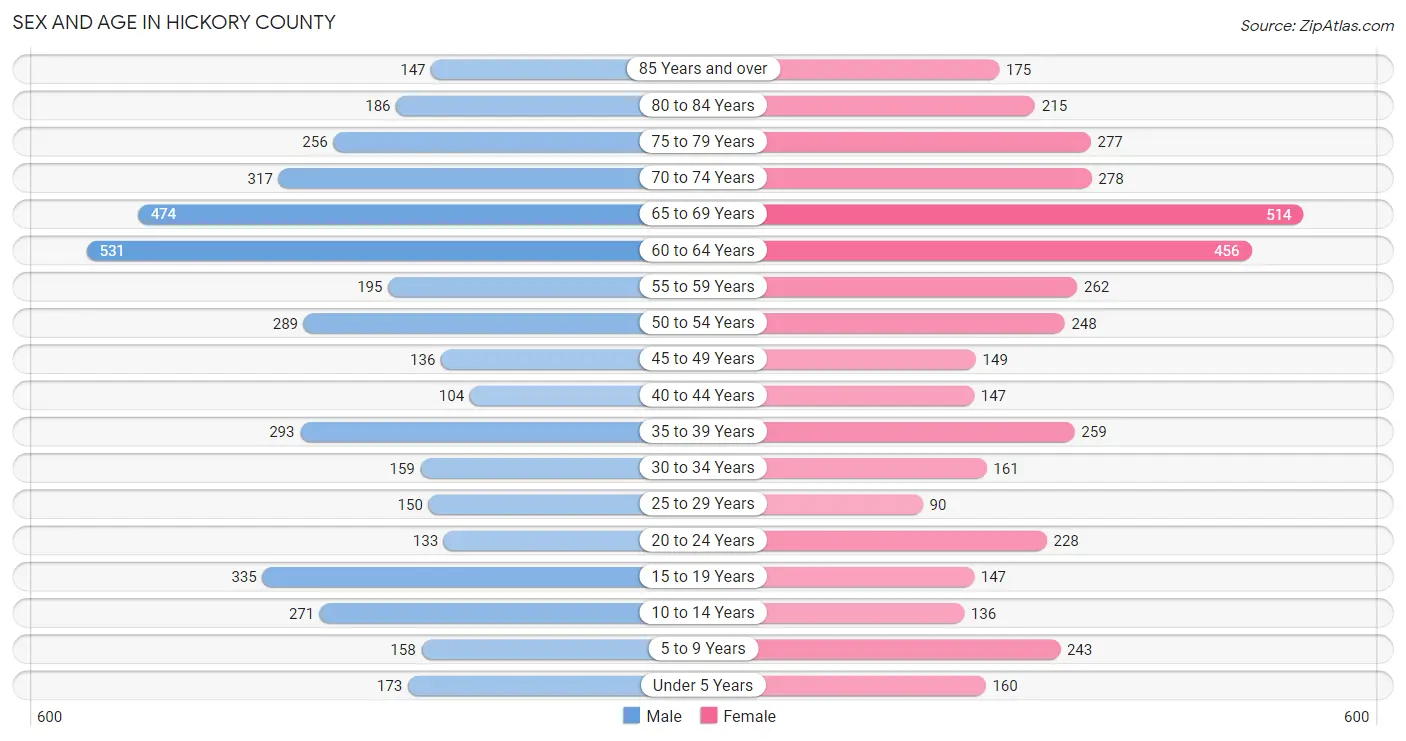
| Age Bracket | Male | Female |
| Under 5 Years | 173 (4.0%) | 160 (3.9%) |
| 5 to 9 Years | 158 (3.7%) | 243 (5.9%) |
| 10 to 14 Years | 271 (6.3%) | 136 (3.3%) |
| 15 to 19 Years | 335 (7.8%) | 147 (3.5%) |
| 20 to 24 Years | 133 (3.1%) | 228 (5.5%) |
| 25 to 29 Years | 150 (3.5%) | 90 (2.2%) |
| 30 to 34 Years | 159 (3.7%) | 161 (3.9%) |
| 35 to 39 Years | 293 (6.8%) | 259 (6.2%) |
| 40 to 44 Years | 104 (2.4%) | 147 (3.5%) |
| 45 to 49 Years | 136 (3.2%) | 149 (3.6%) |
| 50 to 54 Years | 289 (6.7%) | 248 (6.0%) |
| 55 to 59 Years | 195 (4.5%) | 262 (6.3%) |
| 60 to 64 Years | 531 (12.3%) | 456 (11.0%) |
| 65 to 69 Years | 474 (11.0%) | 514 (12.4%) |
| 70 to 74 Years | 317 (7.4%) | 278 (6.7%) |
| 75 to 79 Years | 256 (5.9%) | 277 (6.7%) |
| 80 to 84 Years | 186 (4.3%) | 215 (5.2%) |
| 85 Years and over | 147 (3.4%) | 175 (4.2%) |
| Total | 4,307 (100.0%) | 4,145 (100.0%) |
Families and Households in Hickory County
Median Family Size in Hickory County
The median family size in Hickory County is 3.44 persons per family, with single male/father families (112 | 6.0%) accounting for the largest median family size of 5.63 persons per family. On the other hand, married-couple families (1,619 | 86.9%) represent the smallest median family size with 3.23 persons per family.
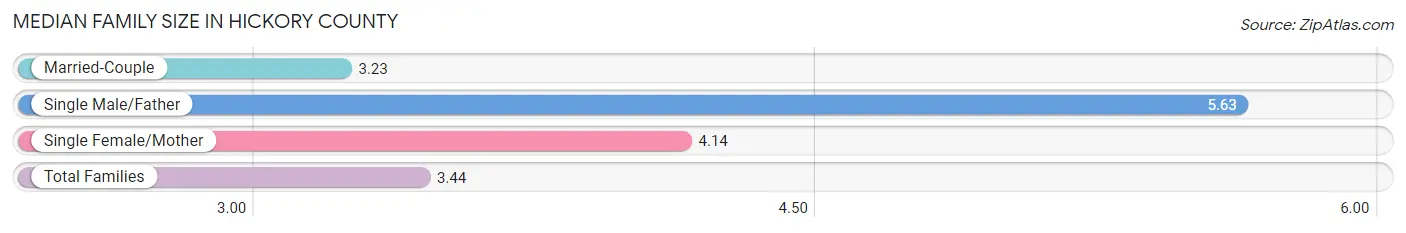
| Family Type | # Families | Family Size |
| Married-Couple | 1,619 (86.9%) | 3.23 |
| Single Male/Father | 112 (6.0%) | 5.63 |
| Single Female/Mother | 133 (7.1%) | 4.14 |
| Total Families | 1,864 (100.0%) | 3.44 |
Median Household Size in Hickory County
The median household size in Hickory County is 2.38 persons per household, with single male/father households (112 | 3.2%) accounting for the largest median household size of 6.09 persons per household. non-family households (1,640 | 46.8%) represent the smallest median household size with 1.12 persons per household.
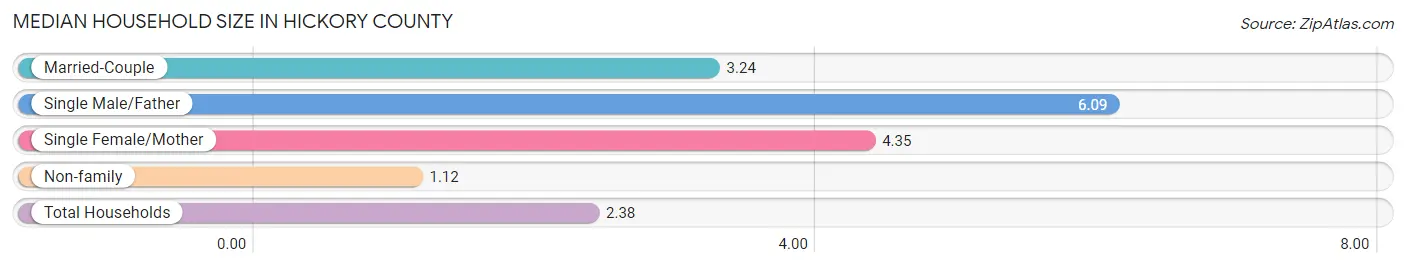
| Household Type | # Households | Household Size |
| Married-Couple | 1,619 (46.2%) | 3.24 |
| Single Male/Father | 112 (3.2%) | 6.09 |
| Single Female/Mother | 133 (3.8%) | 4.35 |
| Non-family | 1,640 (46.8%) | 1.12 |
| Total Households | 3,504 (100.0%) | 2.38 |
Household Size by Marriage Status in Hickory County
Out of a total of 3,504 households in Hickory County, 1,864 (53.2%) are family households, while 1,640 (46.8%) are nonfamily households. The most numerous type of family households are 2-person households, comprising 1,267, and the most common type of nonfamily households are 1-person households, comprising 1,456.
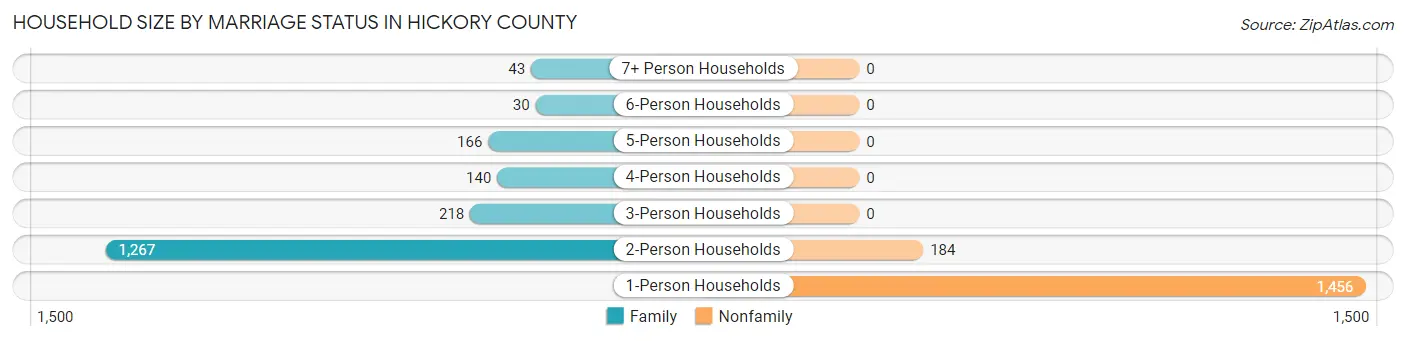
| Household Size | Family Households | Nonfamily Households |
| 1-Person Households | - | 1,456 (41.5%) |
| 2-Person Households | 1,267 (36.2%) | 184 (5.2%) |
| 3-Person Households | 218 (6.2%) | 0 (0.0%) |
| 4-Person Households | 140 (4.0%) | 0 (0.0%) |
| 5-Person Households | 166 (4.7%) | 0 (0.0%) |
| 6-Person Households | 30 (0.9%) | 0 (0.0%) |
| 7+ Person Households | 43 (1.2%) | 0 (0.0%) |
| Total | 1,864 (53.2%) | 1,640 (46.8%) |
Female Fertility in Hickory County
Fertility by Age in Hickory County
Average fertility rate in Hickory County is 55.0 births per 1,000 women. Women in the age bracket of 20 to 34 years have the highest fertility rate with 125.0 births per 1,000 women. Women in the age bracket of 20 to 34 years acount for 87.0% of all women with births.
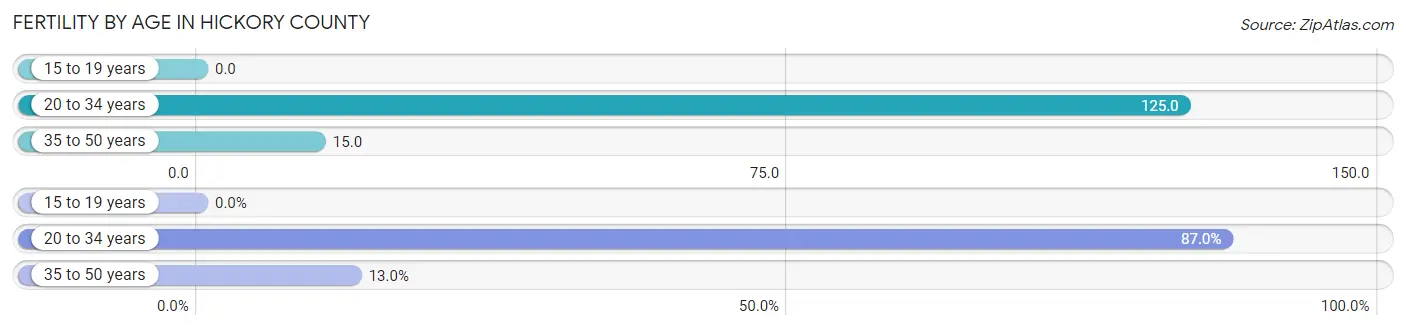
| Age Bracket | Women with Births | Births / 1,000 Women |
| 15 to 19 years | 0 (0.0%) | 0.0 |
| 20 to 34 years | 60 (87.0%) | 125.0 |
| 35 to 50 years | 9 (13.0%) | 15.0 |
| Total | 69 (100.0%) | 55.0 |
Fertility by Age by Marriage Status in Hickory County
75.4% of women with births (69) in Hickory County are married. The highest percentage of unmarried women with births falls into 20 to 34 years age bracket with 28.3% of them unmarried at the time of birth, while the lowest percentage of unmarried women with births belong to 35 to 50 years age bracket with 0.0% of them unmarried.
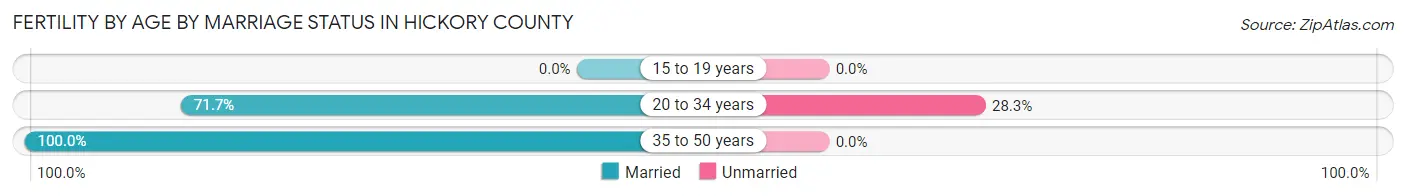
| Age Bracket | Married | Unmarried |
| 15 to 19 years | 0 (0.0%) | 0 (0.0%) |
| 20 to 34 years | 43 (71.7%) | 17 (28.3%) |
| 35 to 50 years | 9 (100.0%) | 0 (0.0%) |
| Total | 52 (75.4%) | 17 (24.6%) |
Fertility by Education in Hickory County
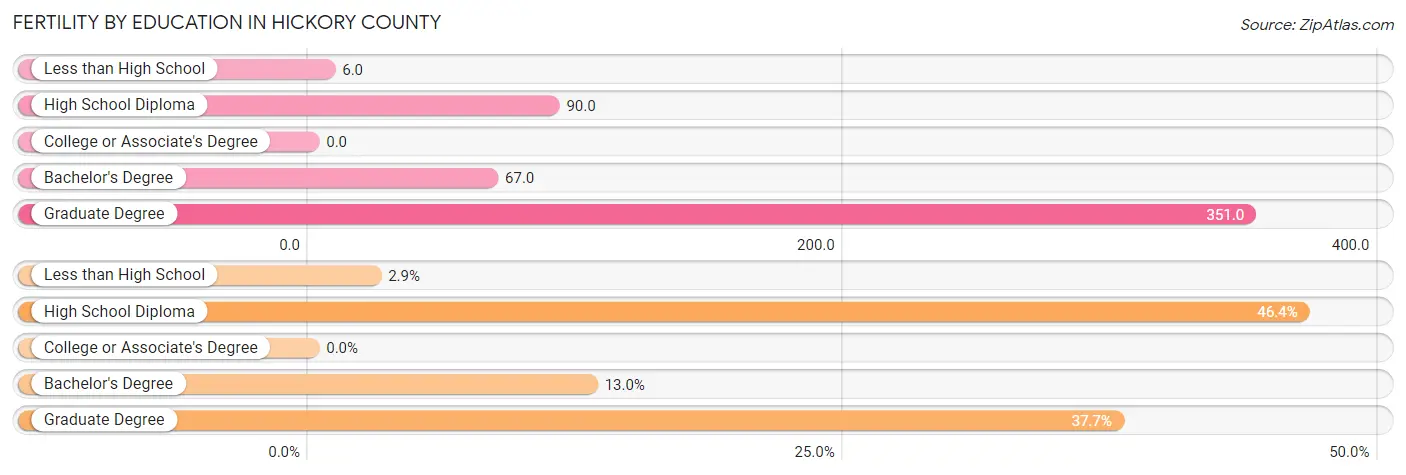
| Educational Attainment | Women with Births | Births / 1,000 Women |
| Less than High School | 2 (2.9%) | 6.0 |
| High School Diploma | 32 (46.4%) | 90.0 |
| College or Associate's Degree | 0 (0.0%) | 0.0 |
| Bachelor's Degree | 9 (13.0%) | 67.0 |
| Graduate Degree | 26 (37.7%) | 351.0 |
| Total | 69 (100.0%) | 55.0 |
Fertility by Education by Marriage Status in Hickory County
24.6% of women with births in Hickory County are unmarried. Women with the educational attainment of bachelor's degree are most likely to be married with 100.0% of them married at childbirth, while women with the educational attainment of less than high school are least likely to be married with 100.0% of them unmarried at childbirth.
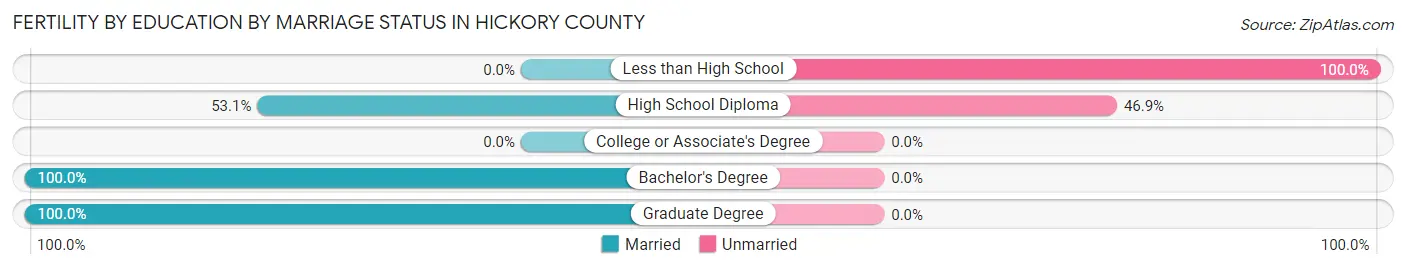
| Educational Attainment | Married | Unmarried |
| Less than High School | 0 (0.0%) | 2 (100.0%) |
| High School Diploma | 17 (53.1%) | 15 (46.9%) |
| College or Associate's Degree | 0 (0.0%) | 0 (0.0%) |
| Bachelor's Degree | 9 (100.0%) | 0 (0.0%) |
| Graduate Degree | 26 (100.0%) | 0 (0.0%) |
| Total | 52 (75.4%) | 17 (24.6%) |
Employment Characteristics in Hickory County
Employment by Class of Employer in Hickory County
Among the 2,478 employed individuals in Hickory County, private company employees (1,614 | 65.1%), not-for-profit organizations (263 | 10.6%), and self-employed (not incorporated) (202 | 8.2%) make up the most common classes of employment.
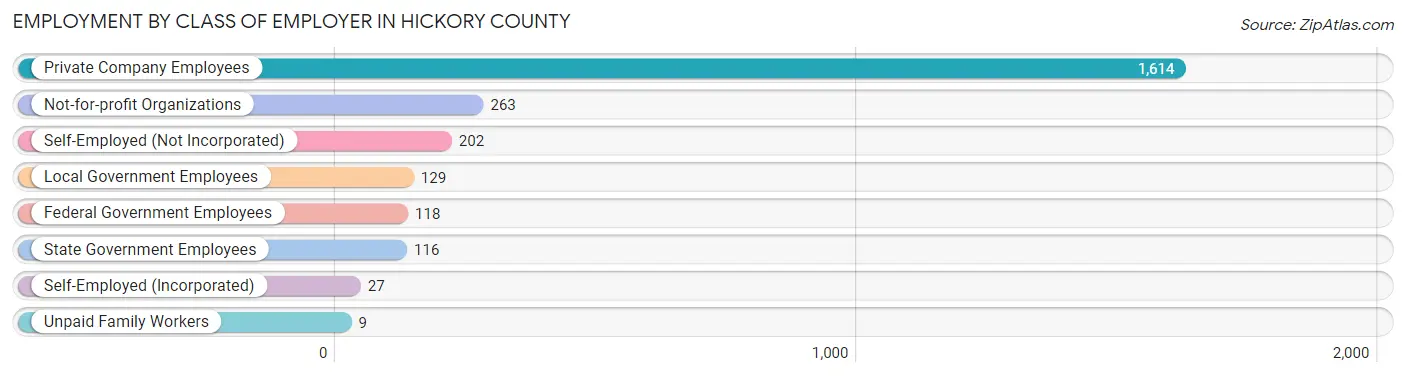
| Employer Class | # Employees | % Employees |
| Private Company Employees | 1,614 | 65.1% |
| Self-Employed (Incorporated) | 27 | 1.1% |
| Self-Employed (Not Incorporated) | 202 | 8.2% |
| Not-for-profit Organizations | 263 | 10.6% |
| Local Government Employees | 129 | 5.2% |
| State Government Employees | 116 | 4.7% |
| Federal Government Employees | 118 | 4.8% |
| Unpaid Family Workers | 9 | 0.4% |
| Total | 2,478 | 100.0% |
Employment Status by Age in Hickory County
According to the labor force statistics for Hickory County, out of the total population over 16 years of age (7,188), 39.1% or 2,811 individuals are in the labor force, with 8.8% or 247 of them unemployed. The age group with the highest labor force participation rate is 30 to 34 years, with 72.5% or 232 individuals in the labor force. Within the labor force, the 20 to 24 years age range has the highest percentage of unemployed individuals, with 25.6% or 52 of them being unemployed.
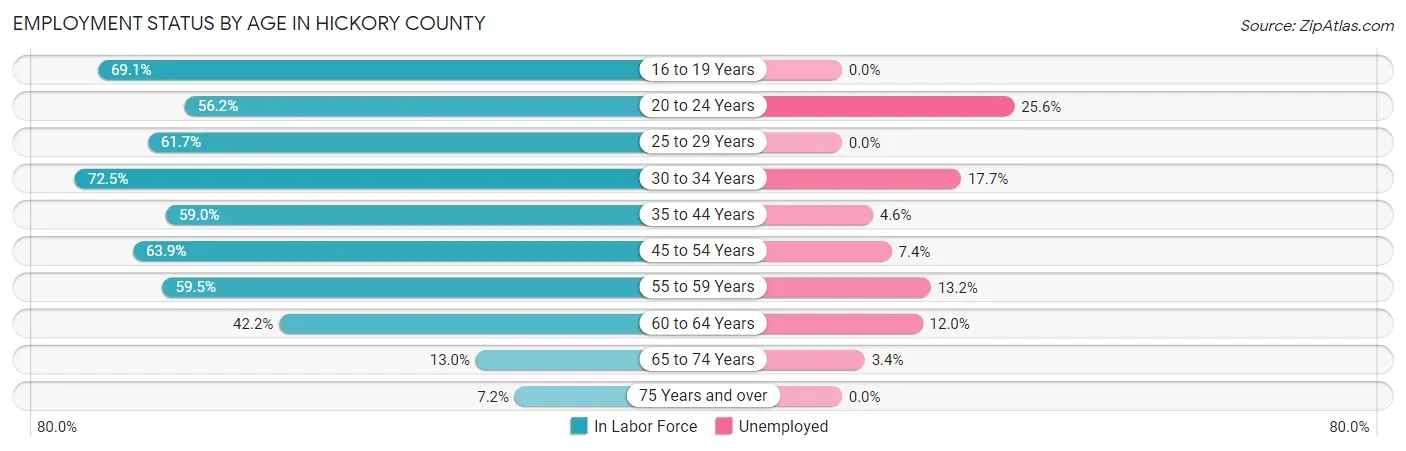
| Age Bracket | In Labor Force | Unemployed |
| 16 to 19 Years | 248 (69.1%) | 0 (0.0%) |
| 20 to 24 Years | 203 (56.2%) | 52 (25.6%) |
| 25 to 29 Years | 148 (61.7%) | 0 (0.0%) |
| 30 to 34 Years | 232 (72.5%) | 41 (17.7%) |
| 35 to 44 Years | 474 (59.0%) | 22 (4.6%) |
| 45 to 54 Years | 525 (63.9%) | 39 (7.4%) |
| 55 to 59 Years | 272 (59.5%) | 36 (13.2%) |
| 60 to 64 Years | 417 (42.2%) | 50 (12.0%) |
| 65 to 74 Years | 206 (13.0%) | 7 (3.4%) |
| 75 Years and over | 90 (7.2%) | 0 (0.0%) |
| Total | 2,811 (39.1%) | 247 (8.8%) |
Employment Status by Educational Attainment in Hickory County
According to labor force statistics for Hickory County, 57.0% of individuals (2,069) out of the total population between 25 and 64 years of age (3,629) are in the labor force, with 9.1% or 188 of them being unemployed. The group with the highest labor force participation rate are those with the educational attainment of college / associate degree, with 61.8% or 752 individuals in the labor force. Within the labor force, individuals with less than high school education have the highest percentage of unemployment, with 32.3% or 41 of them being unemployed.
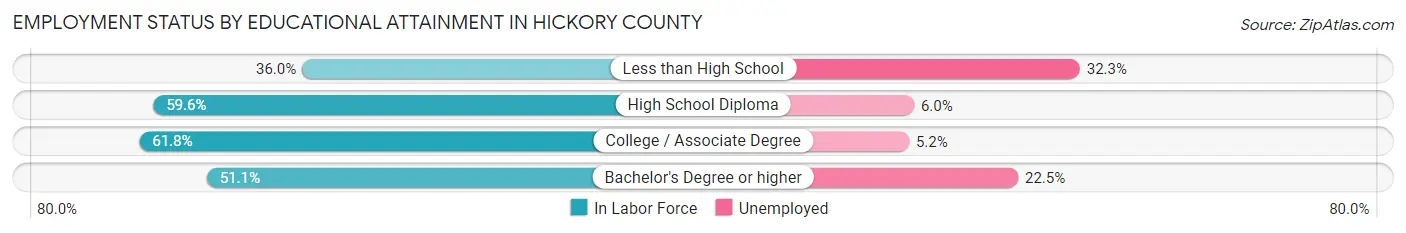
| Educational Attainment | In Labor Force | Unemployed |
| Less than High School | 127 (36.0%) | 114 (32.3%) |
| High School Diploma | 957 (59.6%) | 96 (6.0%) |
| College / Associate Degree | 752 (61.8%) | 63 (5.2%) |
| Bachelor's Degree or higher | 232 (51.1%) | 102 (22.5%) |
| Total | 2,069 (57.0%) | 330 (9.1%) |
Employment Occupations by Sex in Hickory County
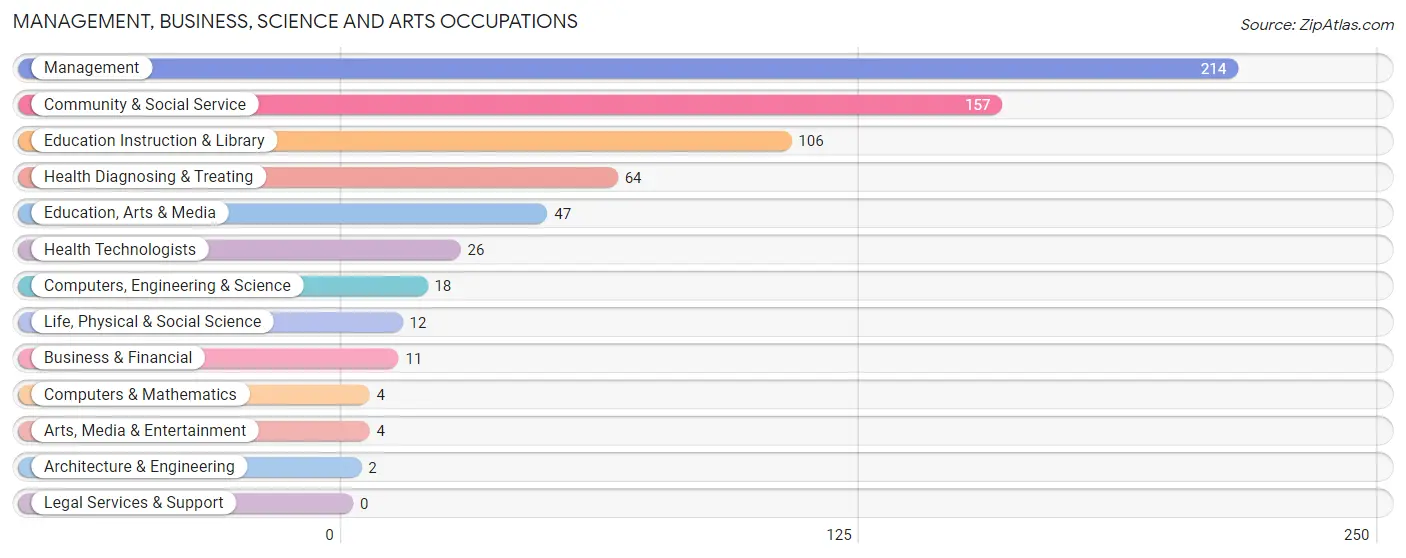
Management, Business, Science and Arts Occupations
The most common Management, Business, Science and Arts occupations in Hickory County are Management (214 | 8.4%), Community & Social Service (157 | 6.2%), Education Instruction & Library (106 | 4.2%), Health Diagnosing & Treating (64 | 2.5%), and Education, Arts & Media (47 | 1.8%).
Management, Business, Science and Arts Occupations by Sex
Within the Management, Business, Science and Arts occupations in Hickory County, the most male-oriented occupations are Computers & Mathematics (100.0%), Life, Physical & Social Science (100.0%), and Computers, Engineering & Science (88.9%), while the most female-oriented occupations are Architecture & Engineering (100.0%), Health Technologists (100.0%), and Education Instruction & Library (82.1%).
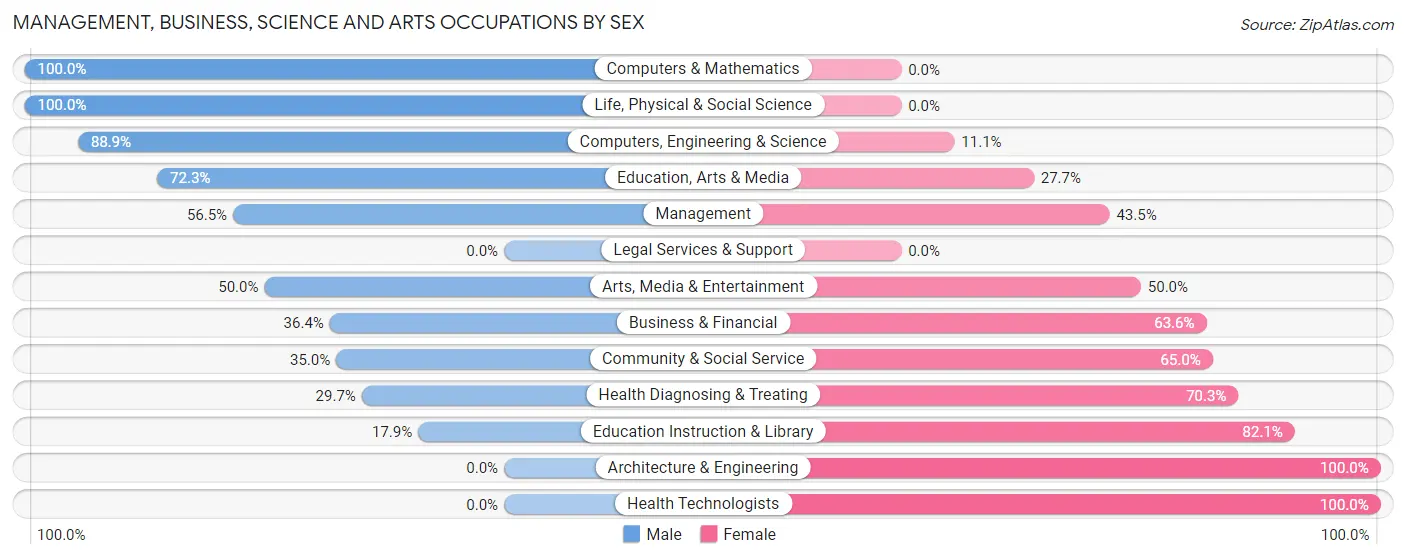
| Occupation | Male | Female |
| Management | 121 (56.5%) | 93 (43.5%) |
| Business & Financial | 4 (36.4%) | 7 (63.6%) |
| Computers, Engineering & Science | 16 (88.9%) | 2 (11.1%) |
| Computers & Mathematics | 4 (100.0%) | 0 (0.0%) |
| Architecture & Engineering | 0 (0.0%) | 2 (100.0%) |
| Life, Physical & Social Science | 12 (100.0%) | 0 (0.0%) |
| Community & Social Service | 55 (35.0%) | 102 (65.0%) |
| Education, Arts & Media | 34 (72.3%) | 13 (27.7%) |
| Legal Services & Support | 0 (0.0%) | 0 (0.0%) |
| Education Instruction & Library | 19 (17.9%) | 87 (82.1%) |
| Arts, Media & Entertainment | 2 (50.0%) | 2 (50.0%) |
| Health Diagnosing & Treating | 19 (29.7%) | 45 (70.3%) |
| Health Technologists | 0 (0.0%) | 26 (100.0%) |
| Total (Category) | 215 (46.3%) | 249 (53.7%) |
| Total (Overall) | 1,421 (55.7%) | 1,129 (44.3%) |
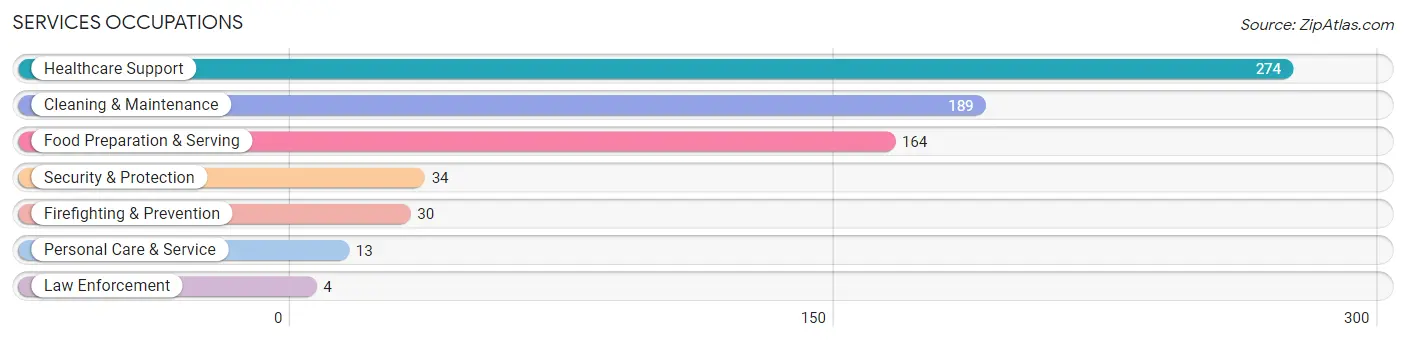
Services Occupations
The most common Services occupations in Hickory County are Healthcare Support (274 | 10.7%), Cleaning & Maintenance (189 | 7.4%), Food Preparation & Serving (164 | 6.4%), Security & Protection (34 | 1.3%), and Firefighting & Prevention (30 | 1.2%).
Services Occupations by Sex
Within the Services occupations in Hickory County, the most male-oriented occupations are Law Enforcement (100.0%), Cleaning & Maintenance (48.1%), and Food Preparation & Serving (42.1%), while the most female-oriented occupations are Healthcare Support (100.0%), Firefighting & Prevention (100.0%), and Personal Care & Service (100.0%).
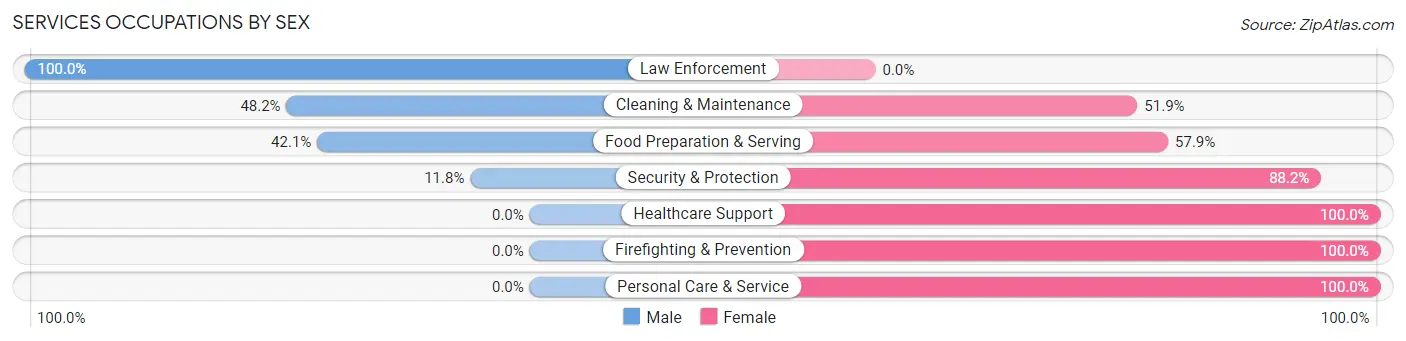
| Occupation | Male | Female |
| Healthcare Support | 0 (0.0%) | 274 (100.0%) |
| Security & Protection | 4 (11.8%) | 30 (88.2%) |
| Firefighting & Prevention | 0 (0.0%) | 30 (100.0%) |
| Law Enforcement | 4 (100.0%) | 0 (0.0%) |
| Food Preparation & Serving | 69 (42.1%) | 95 (57.9%) |
| Cleaning & Maintenance | 91 (48.1%) | 98 (51.8%) |
| Personal Care & Service | 0 (0.0%) | 13 (100.0%) |
| Total (Category) | 164 (24.3%) | 510 (75.7%) |
| Total (Overall) | 1,421 (55.7%) | 1,129 (44.3%) |
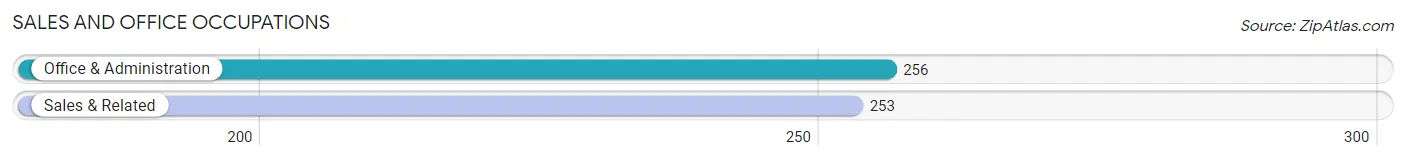
Sales and Office Occupations
The most common Sales and Office occupations in Hickory County are Office & Administration (256 | 10.0%), and Sales & Related (253 | 9.9%).
Sales and Office Occupations by Sex
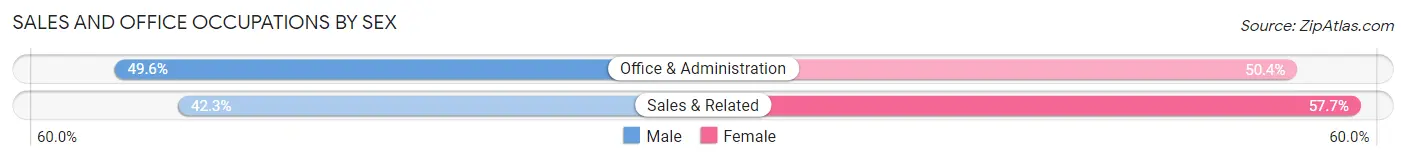
| Occupation | Male | Female |
| Sales & Related | 107 (42.3%) | 146 (57.7%) |
| Office & Administration | 127 (49.6%) | 129 (50.4%) |
| Total (Category) | 234 (46.0%) | 275 (54.0%) |
| Total (Overall) | 1,421 (55.7%) | 1,129 (44.3%) |
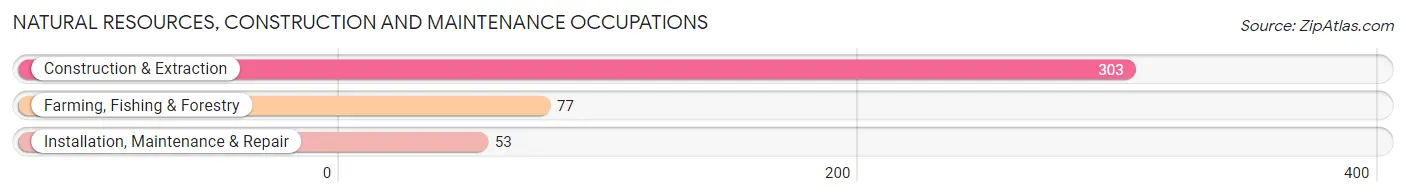
Natural Resources, Construction and Maintenance Occupations
The most common Natural Resources, Construction and Maintenance occupations in Hickory County are Construction & Extraction (303 | 11.9%), Farming, Fishing & Forestry (77 | 3.0%), and Installation, Maintenance & Repair (53 | 2.1%).
Natural Resources, Construction and Maintenance Occupations by Sex
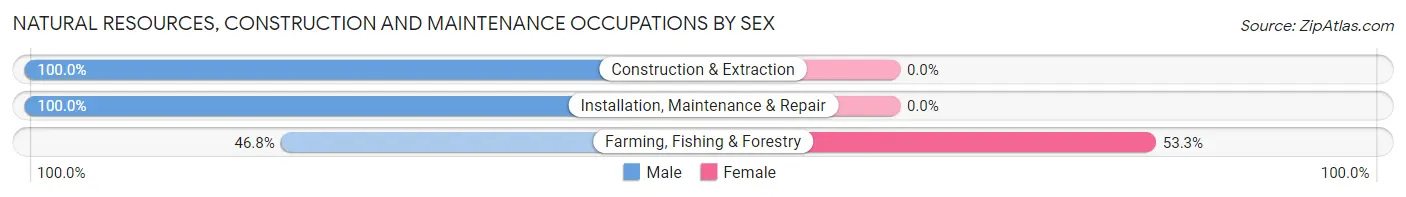
| Occupation | Male | Female |
| Farming, Fishing & Forestry | 36 (46.8%) | 41 (53.2%) |
| Construction & Extraction | 303 (100.0%) | 0 (0.0%) |
| Installation, Maintenance & Repair | 53 (100.0%) | 0 (0.0%) |
| Total (Category) | 392 (90.5%) | 41 (9.5%) |
| Total (Overall) | 1,421 (55.7%) | 1,129 (44.3%) |
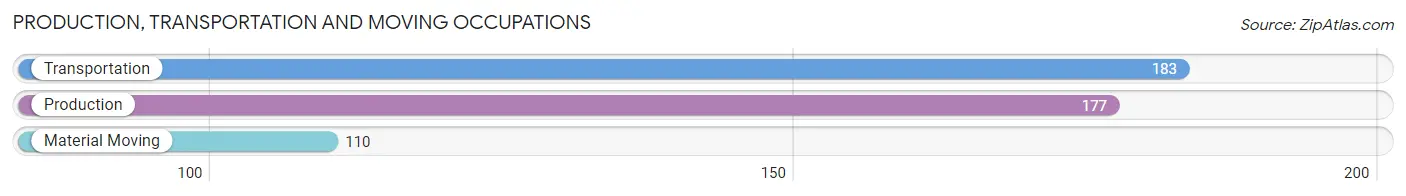
Production, Transportation and Moving Occupations
The most common Production, Transportation and Moving occupations in Hickory County are Transportation (183 | 7.2%), Production (177 | 6.9%), and Material Moving (110 | 4.3%).
Production, Transportation and Moving Occupations by Sex
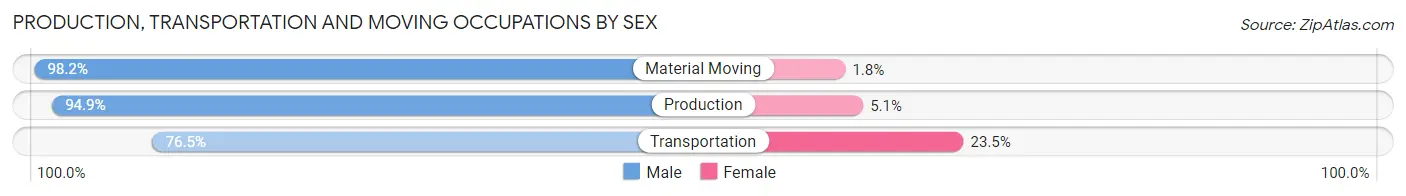
| Occupation | Male | Female |
| Production | 168 (94.9%) | 9 (5.1%) |
| Transportation | 140 (76.5%) | 43 (23.5%) |
| Material Moving | 108 (98.2%) | 2 (1.8%) |
| Total (Category) | 416 (88.5%) | 54 (11.5%) |
| Total (Overall) | 1,421 (55.7%) | 1,129 (44.3%) |
Employment Industries by Sex in Hickory County
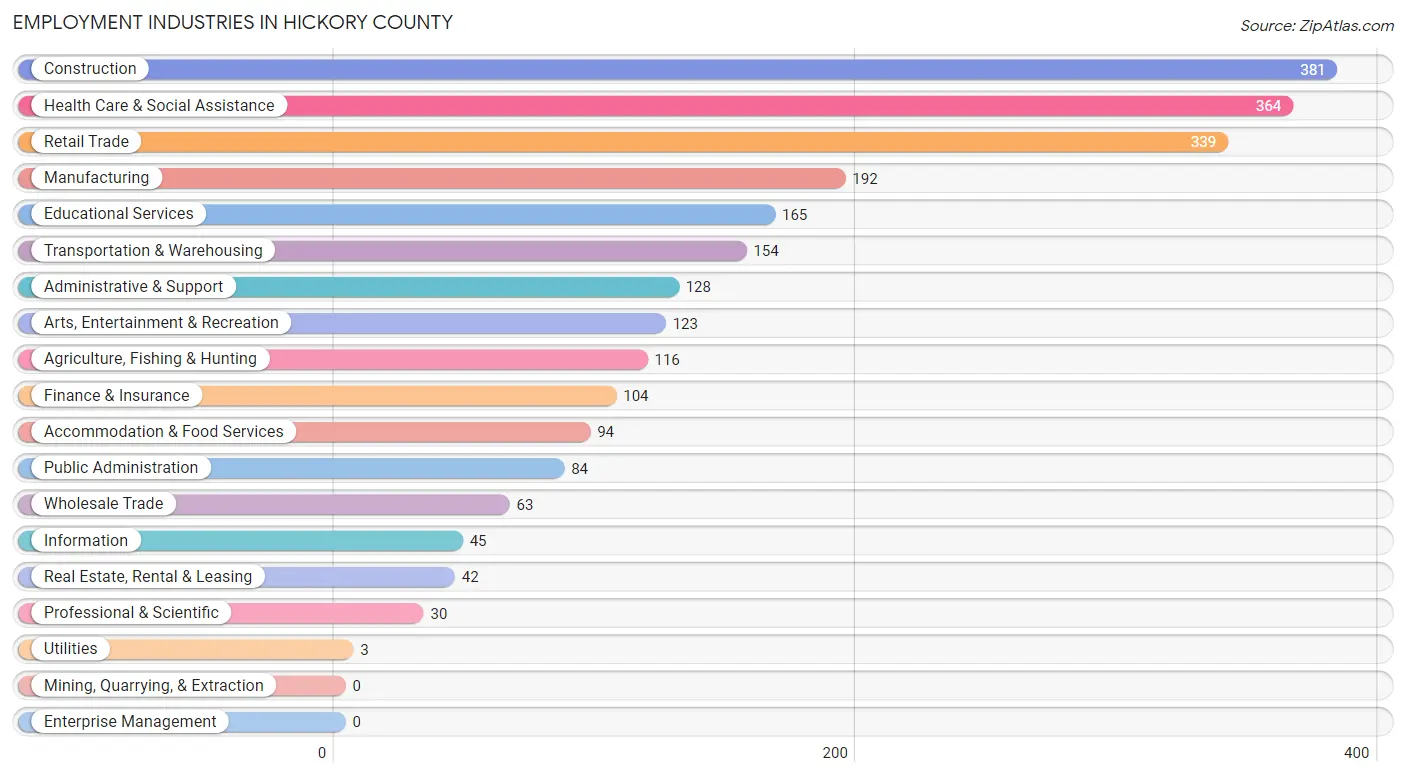
Employment Industries in Hickory County
The major employment industries in Hickory County include Construction (381 | 14.9%), Health Care & Social Assistance (364 | 14.3%), Retail Trade (339 | 13.3%), Manufacturing (192 | 7.5%), and Educational Services (165 | 6.5%).
Employment Industries by Sex in Hickory County
The Hickory County industries that see more men than women are Utilities (100.0%), Construction (97.6%), and Real Estate, Rental & Leasing (95.2%), whereas the industries that tend to have a higher number of women are Finance & Insurance (87.5%), Health Care & Social Assistance (85.7%), and Public Administration (84.5%).
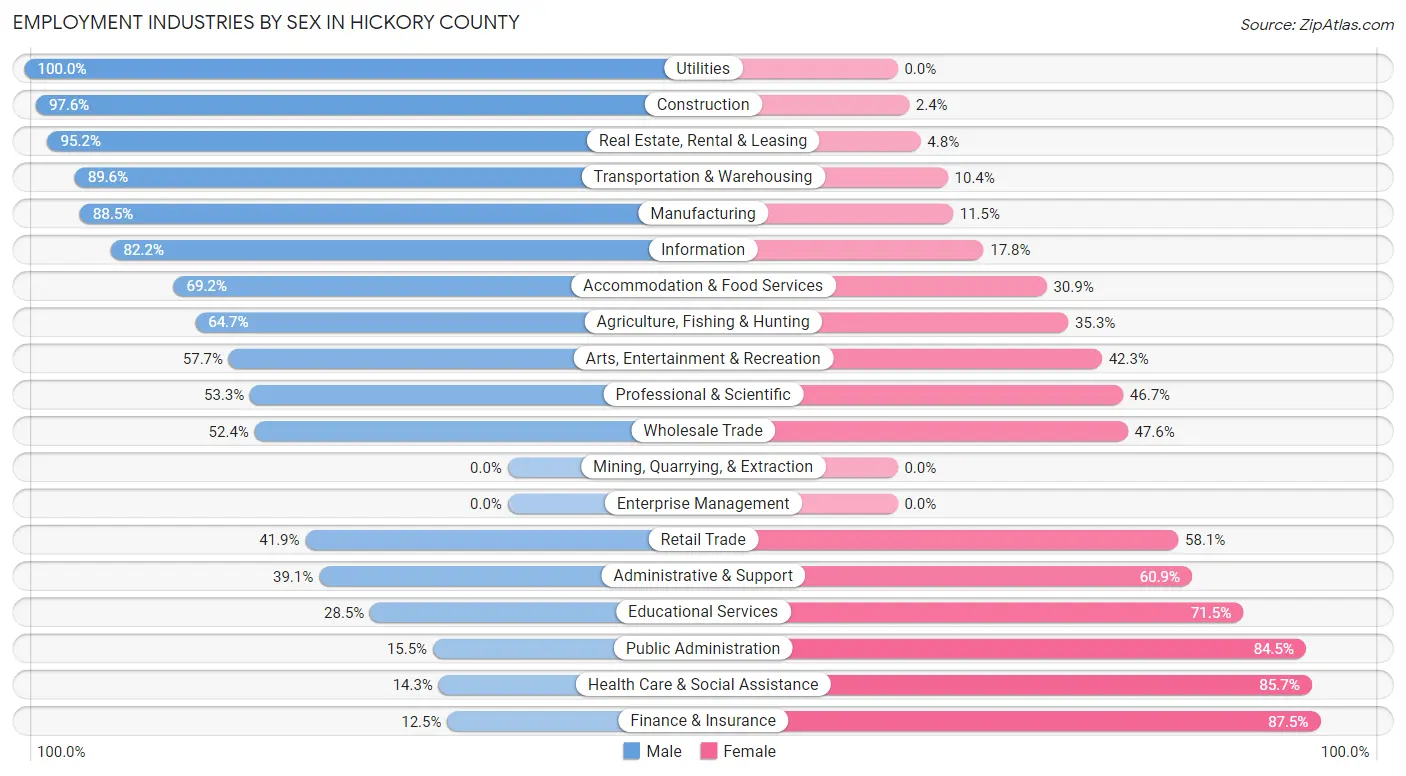
| Industry | Male | Female |
| Agriculture, Fishing & Hunting | 75 (64.7%) | 41 (35.3%) |
| Mining, Quarrying, & Extraction | 0 (0.0%) | 0 (0.0%) |
| Construction | 372 (97.6%) | 9 (2.4%) |
| Manufacturing | 170 (88.5%) | 22 (11.5%) |
| Wholesale Trade | 33 (52.4%) | 30 (47.6%) |
| Retail Trade | 142 (41.9%) | 197 (58.1%) |
| Transportation & Warehousing | 138 (89.6%) | 16 (10.4%) |
| Utilities | 3 (100.0%) | 0 (0.0%) |
| Information | 37 (82.2%) | 8 (17.8%) |
| Finance & Insurance | 13 (12.5%) | 91 (87.5%) |
| Real Estate, Rental & Leasing | 40 (95.2%) | 2 (4.8%) |
| Professional & Scientific | 16 (53.3%) | 14 (46.7%) |
| Enterprise Management | 0 (0.0%) | 0 (0.0%) |
| Administrative & Support | 50 (39.1%) | 78 (60.9%) |
| Educational Services | 47 (28.5%) | 118 (71.5%) |
| Health Care & Social Assistance | 52 (14.3%) | 312 (85.7%) |
| Arts, Entertainment & Recreation | 71 (57.7%) | 52 (42.3%) |
| Accommodation & Food Services | 65 (69.2%) | 29 (30.8%) |
| Public Administration | 13 (15.5%) | 71 (84.5%) |
| Total | 1,421 (55.7%) | 1,129 (44.3%) |
Education in Hickory County
School Enrollment in Hickory County
The most common levels of schooling among the 1,229 students in Hickory County are middle school (385 | 31.3%), high school (285 | 23.2%), and elementary school (245 | 19.9%).
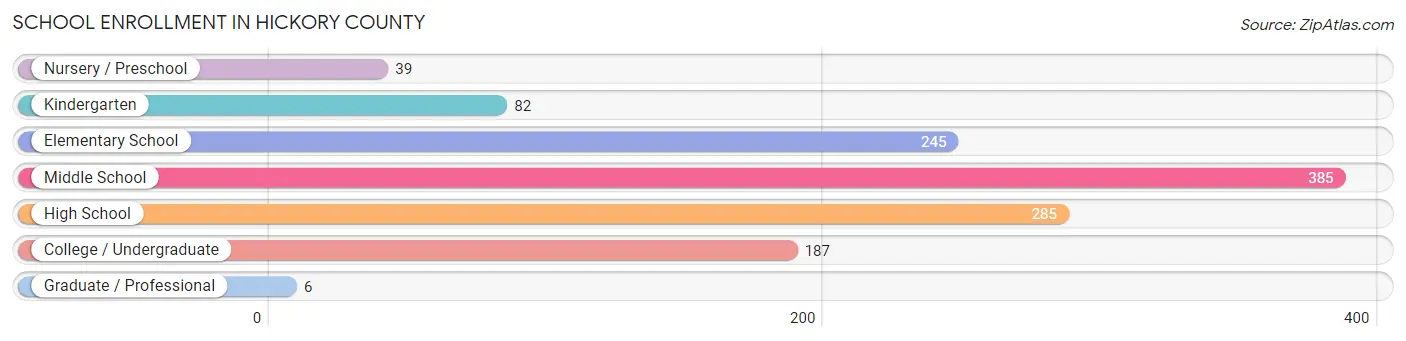
| School Level | # Students | % Students |
| Nursery / Preschool | 39 | 3.2% |
| Kindergarten | 82 | 6.7% |
| Elementary School | 245 | 19.9% |
| Middle School | 385 | 31.3% |
| High School | 285 | 23.2% |
| College / Undergraduate | 187 | 15.2% |
| Graduate / Professional | 6 | 0.5% |
| Total | 1,229 | 100.0% |
School Enrollment by Age by Funding Source in Hickory County
Out of a total of 1,229 students who are enrolled in schools in Hickory County, 179 (14.6%) attend a private institution, while the remaining 1,050 (85.4%) are enrolled in public schools. The age group of 10 to 14 year olds has the highest likelihood of being enrolled in private schools, with 71 (19.8% in the age bracket) enrolled. Conversely, the age group of 3 to 4 year olds has the lowest likelihood of being enrolled in a private school, with 33 (100.0% in the age bracket) attending a public institution.
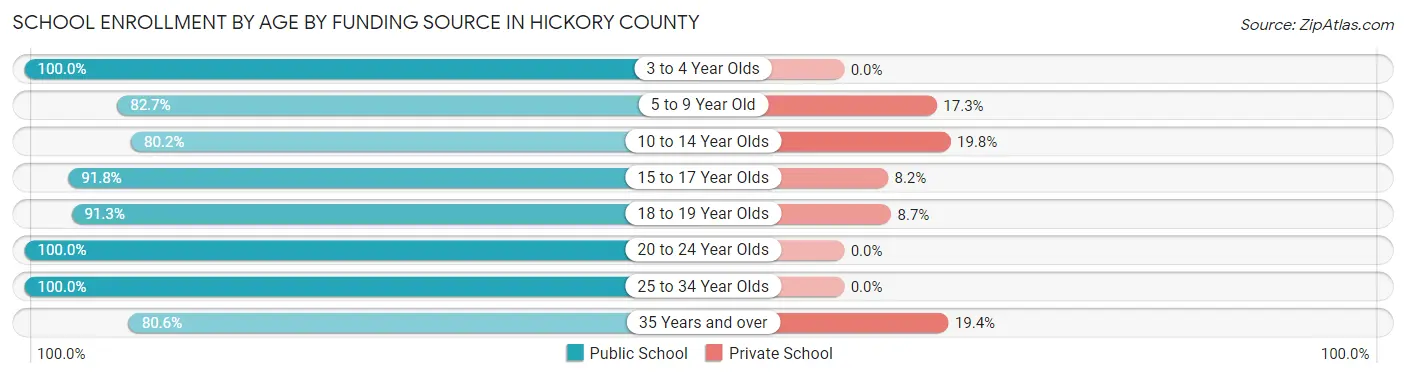
| Age Bracket | Public School | Private School |
| 3 to 4 Year Olds | 33 (100.0%) | 0 (0.0%) |
| 5 to 9 Year Old | 297 (82.7%) | 62 (17.3%) |
| 10 to 14 Year Olds | 287 (80.2%) | 71 (19.8%) |
| 15 to 17 Year Olds | 191 (91.8%) | 17 (8.2%) |
| 18 to 19 Year Olds | 94 (91.3%) | 9 (8.7%) |
| 20 to 24 Year Olds | 47 (100.0%) | 0 (0.0%) |
| 25 to 34 Year Olds | 18 (100.0%) | 0 (0.0%) |
| 35 Years and over | 83 (80.6%) | 20 (19.4%) |
| Total | 1,050 (85.4%) | 179 (14.6%) |
Educational Attainment by Field of Study in Hickory County
Education (233 | 31.5%), science & technology (105 | 14.2%), social sciences (84 | 11.4%), arts & humanities (77 | 10.4%), and business (59 | 8.0%) are the most common fields of study among 739 individuals in Hickory County who have obtained a bachelor's degree or higher.
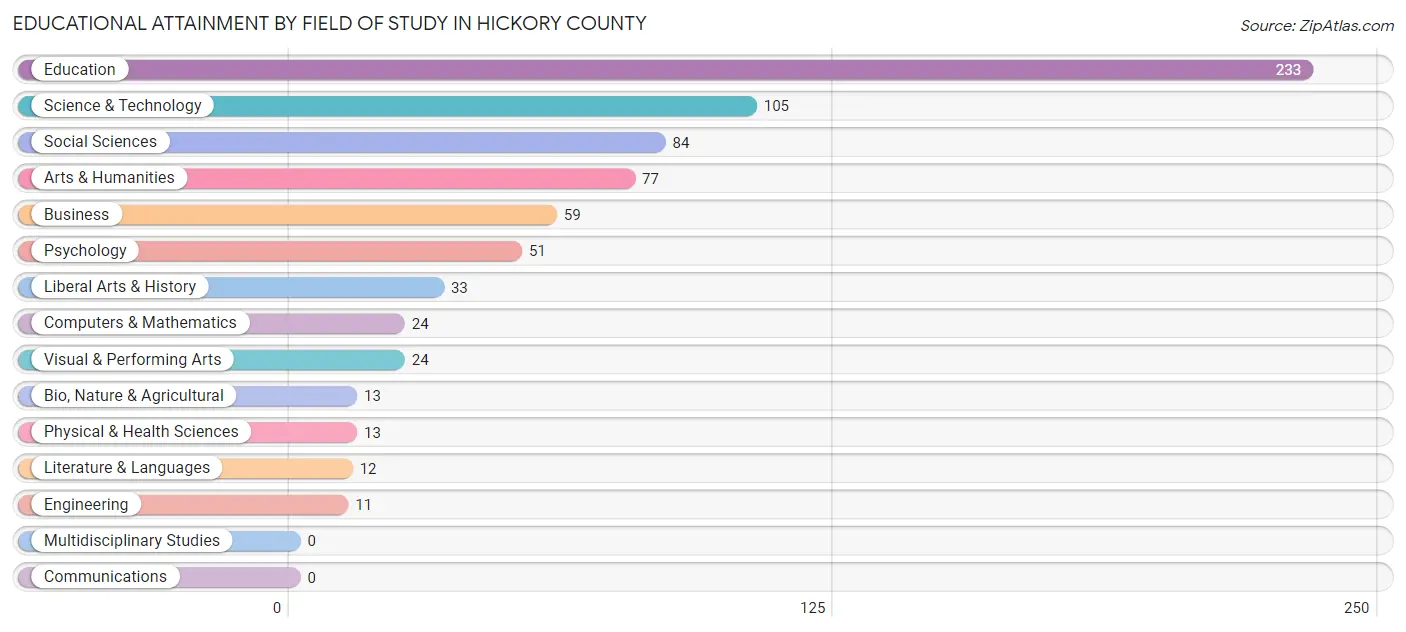
| Field of Study | # Graduates | % Graduates |
| Computers & Mathematics | 24 | 3.3% |
| Bio, Nature & Agricultural | 13 | 1.8% |
| Physical & Health Sciences | 13 | 1.8% |
| Psychology | 51 | 6.9% |
| Social Sciences | 84 | 11.4% |
| Engineering | 11 | 1.5% |
| Multidisciplinary Studies | 0 | 0.0% |
| Science & Technology | 105 | 14.2% |
| Business | 59 | 8.0% |
| Education | 233 | 31.5% |
| Literature & Languages | 12 | 1.6% |
| Liberal Arts & History | 33 | 4.5% |
| Visual & Performing Arts | 24 | 3.3% |
| Communications | 0 | 0.0% |
| Arts & Humanities | 77 | 10.4% |
| Total | 739 | 100.0% |
Transportation & Commute in Hickory County
Vehicle Availability by Sex in Hickory County
The most prevalent vehicle ownership categories in Hickory County are males with 3 vehicles (501, accounting for 37.1%) and females with 3 vehicles (280, making up 44.4%).
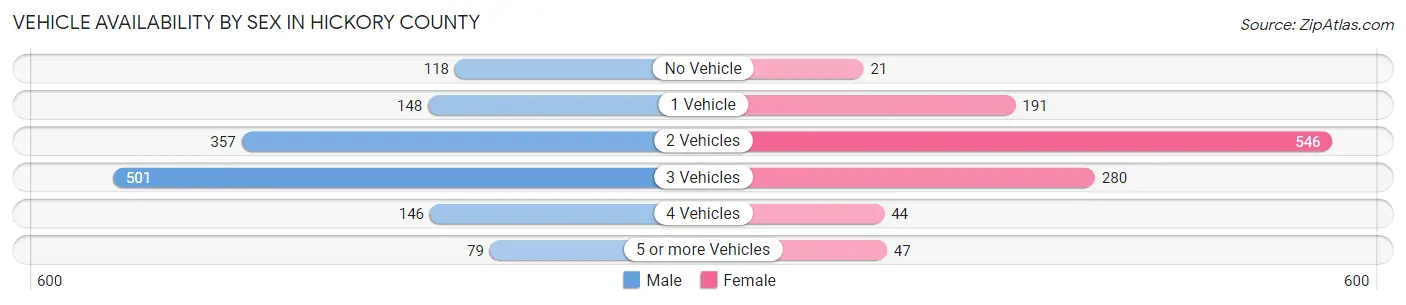
| Vehicles Available | Male | Female |
| No Vehicle | 118 (8.7%) | 21 (1.9%) |
| 1 Vehicle | 148 (11.0%) | 191 (16.9%) |
| 2 Vehicles | 357 (26.5%) | 546 (48.4%) |
| 3 Vehicles | 501 (37.1%) | 280 (24.8%) |
| 4 Vehicles | 146 (10.8%) | 44 (3.9%) |
| 5 or more Vehicles | 79 (5.9%) | 47 (4.2%) |
| Total | 1,349 (100.0%) | 1,129 (100.0%) |
Commute Time in Hickory County
The most frequently occuring commute durations in Hickory County are 60 to 89 minutes (503 commuters, 21.4%), 5 to 9 minutes (422 commuters, 18.0%), and 10 to 14 minutes (297 commuters, 12.7%).
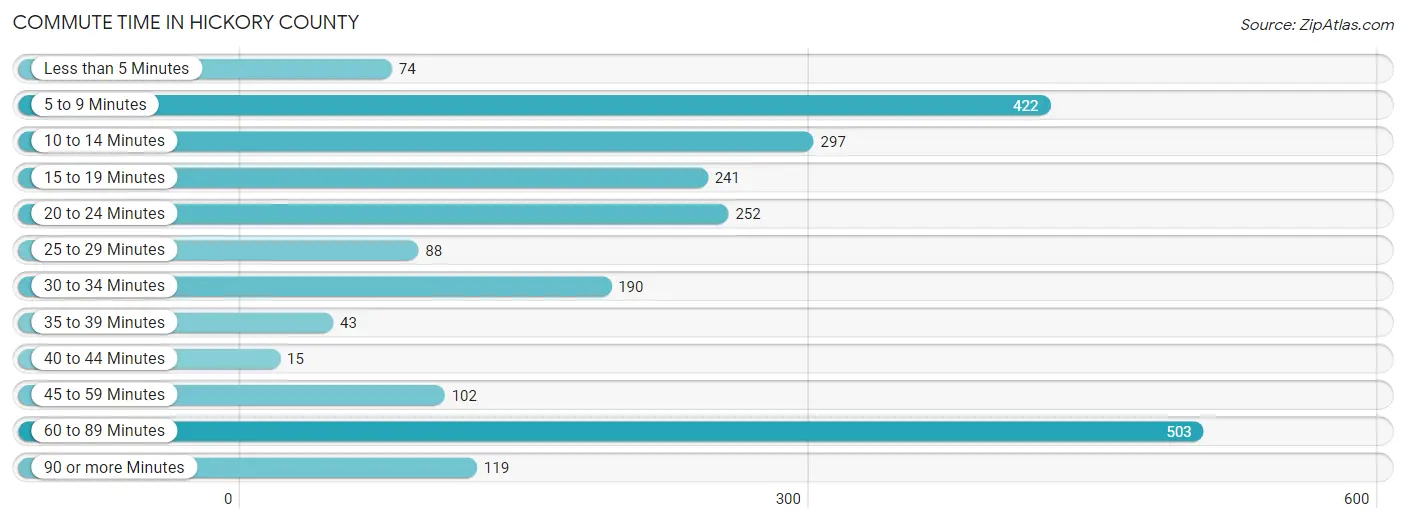
| Commute Time | # Commuters | % Commuters |
| Less than 5 Minutes | 74 | 3.2% |
| 5 to 9 Minutes | 422 | 18.0% |
| 10 to 14 Minutes | 297 | 12.7% |
| 15 to 19 Minutes | 241 | 10.3% |
| 20 to 24 Minutes | 252 | 10.7% |
| 25 to 29 Minutes | 88 | 3.7% |
| 30 to 34 Minutes | 190 | 8.1% |
| 35 to 39 Minutes | 43 | 1.8% |
| 40 to 44 Minutes | 15 | 0.6% |
| 45 to 59 Minutes | 102 | 4.3% |
| 60 to 89 Minutes | 503 | 21.4% |
| 90 or more Minutes | 119 | 5.1% |
Commute Time by Sex in Hickory County
The most common commute times in Hickory County are 60 to 89 minutes (340 commuters, 27.1%) for males and 5 to 9 minutes (220 commuters, 20.2%) for females.
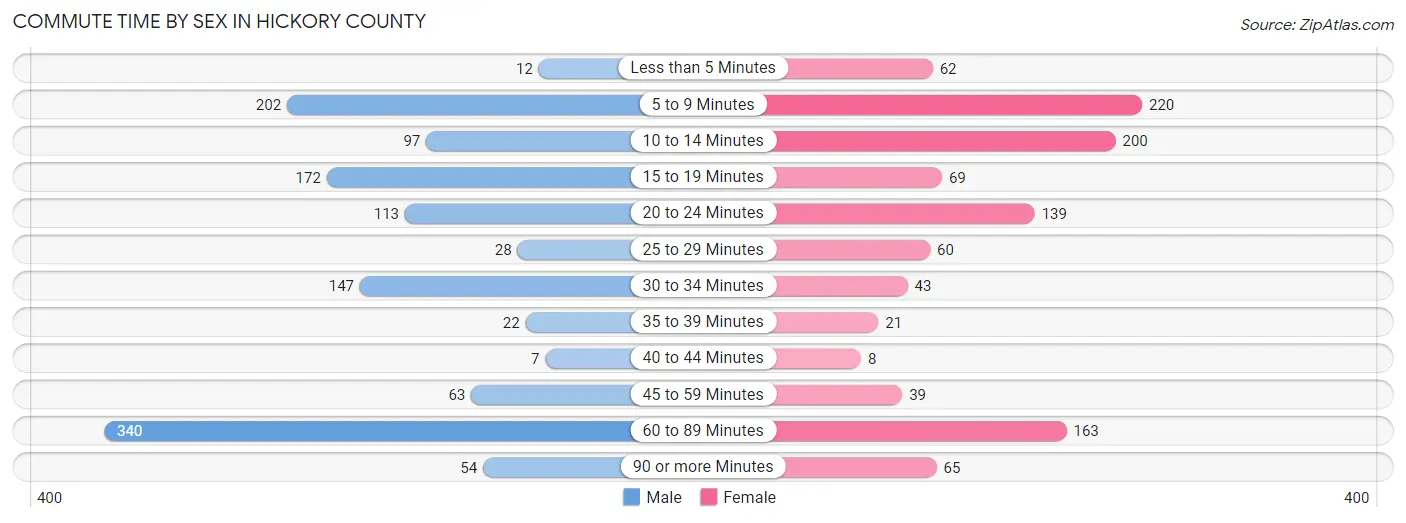
| Commute Time | Male | Female |
| Less than 5 Minutes | 12 (0.9%) | 62 (5.7%) |
| 5 to 9 Minutes | 202 (16.1%) | 220 (20.2%) |
| 10 to 14 Minutes | 97 (7.7%) | 200 (18.4%) |
| 15 to 19 Minutes | 172 (13.7%) | 69 (6.3%) |
| 20 to 24 Minutes | 113 (9.0%) | 139 (12.8%) |
| 25 to 29 Minutes | 28 (2.2%) | 60 (5.5%) |
| 30 to 34 Minutes | 147 (11.7%) | 43 (4.0%) |
| 35 to 39 Minutes | 22 (1.8%) | 21 (1.9%) |
| 40 to 44 Minutes | 7 (0.6%) | 8 (0.7%) |
| 45 to 59 Minutes | 63 (5.0%) | 39 (3.6%) |
| 60 to 89 Minutes | 340 (27.1%) | 163 (15.0%) |
| 90 or more Minutes | 54 (4.3%) | 65 (6.0%) |
Time of Departure to Work by Sex in Hickory County
The most frequent times of departure to work in Hickory County are 7:00 AM to 7:29 AM (208, 16.6%) for males and 7:30 AM to 7:59 AM (234, 21.5%) for females.
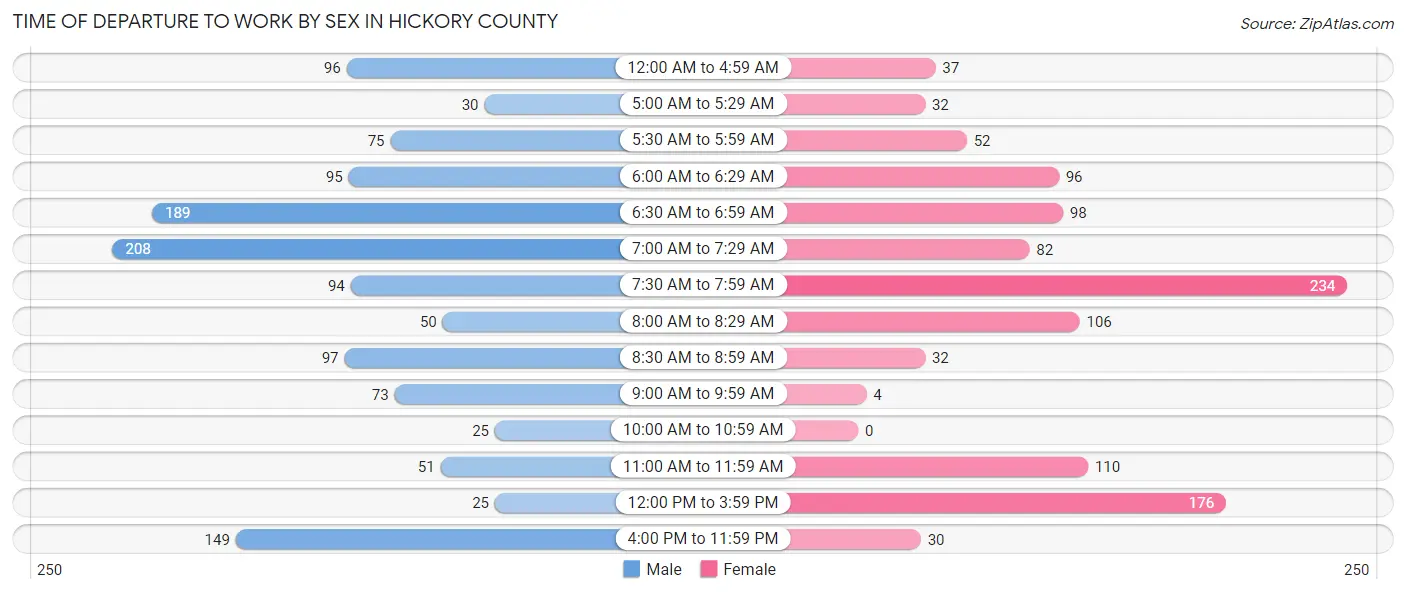
| Time of Departure | Male | Female |
| 12:00 AM to 4:59 AM | 96 (7.6%) | 37 (3.4%) |
| 5:00 AM to 5:29 AM | 30 (2.4%) | 32 (2.9%) |
| 5:30 AM to 5:59 AM | 75 (6.0%) | 52 (4.8%) |
| 6:00 AM to 6:29 AM | 95 (7.6%) | 96 (8.8%) |
| 6:30 AM to 6:59 AM | 189 (15.0%) | 98 (9.0%) |
| 7:00 AM to 7:29 AM | 208 (16.6%) | 82 (7.5%) |
| 7:30 AM to 7:59 AM | 94 (7.5%) | 234 (21.5%) |
| 8:00 AM to 8:29 AM | 50 (4.0%) | 106 (9.7%) |
| 8:30 AM to 8:59 AM | 97 (7.7%) | 32 (2.9%) |
| 9:00 AM to 9:59 AM | 73 (5.8%) | 4 (0.4%) |
| 10:00 AM to 10:59 AM | 25 (2.0%) | 0 (0.0%) |
| 11:00 AM to 11:59 AM | 51 (4.1%) | 110 (10.1%) |
| 12:00 PM to 3:59 PM | 25 (2.0%) | 176 (16.2%) |
| 4:00 PM to 11:59 PM | 149 (11.8%) | 30 (2.8%) |
| Total | 1,257 (100.0%) | 1,089 (100.0%) |
Housing Occupancy in Hickory County
Occupancy by Ownership in Hickory County
Of the total 3,504 dwellings in Hickory County, owner-occupied units account for 2,889 (82.5%), while renter-occupied units make up 615 (17.5%).
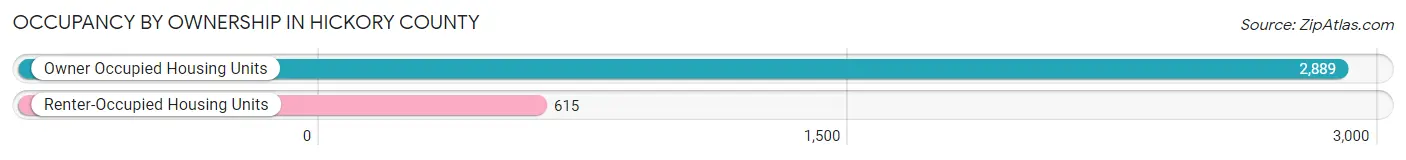
| Occupancy | # Housing Units | % Housing Units |
| Owner Occupied Housing Units | 2,889 | 82.5% |
| Renter-Occupied Housing Units | 615 | 17.5% |
| Total Occupied Housing Units | 3,504 | 100.0% |
Occupancy by Household Size in Hickory County
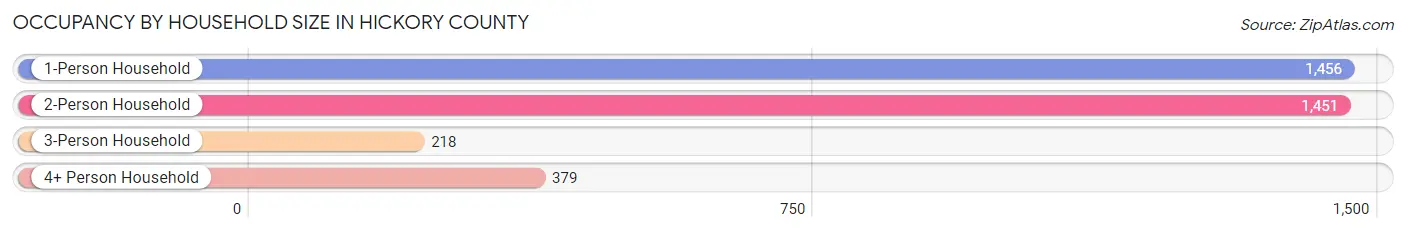
| Household Size | # Housing Units | % Housing Units |
| 1-Person Household | 1,456 | 41.5% |
| 2-Person Household | 1,451 | 41.4% |
| 3-Person Household | 218 | 6.2% |
| 4+ Person Household | 379 | 10.8% |
| Total Housing Units | 3,504 | 100.0% |
Occupancy by Ownership by Household Size in Hickory County
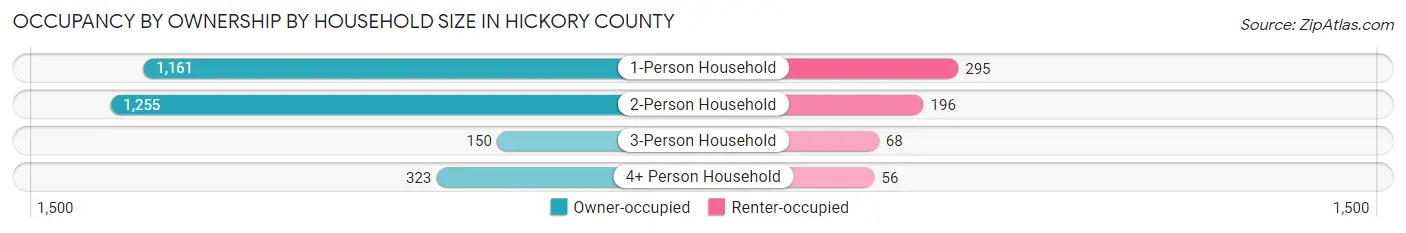
| Household Size | Owner-occupied | Renter-occupied |
| 1-Person Household | 1,161 (79.7%) | 295 (20.3%) |
| 2-Person Household | 1,255 (86.5%) | 196 (13.5%) |
| 3-Person Household | 150 (68.8%) | 68 (31.2%) |
| 4+ Person Household | 323 (85.2%) | 56 (14.8%) |
| Total Housing Units | 2,889 (82.5%) | 615 (17.5%) |
Occupancy by Educational Attainment in Hickory County
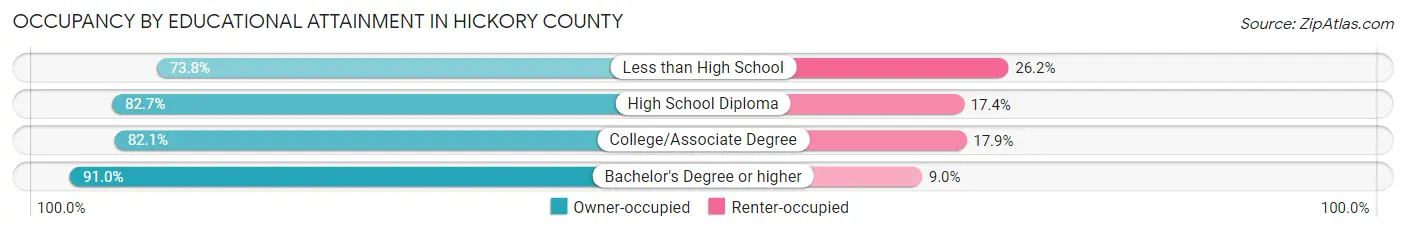
| Household Size | Owner-occupied | Renter-occupied |
| Less than High School | 262 (73.8%) | 93 (26.2%) |
| High School Diploma | 1,362 (82.7%) | 286 (17.3%) |
| College/Associate Degree | 933 (82.1%) | 203 (17.9%) |
| Bachelor's Degree or higher | 332 (91.0%) | 33 (9.0%) |
Occupancy by Age of Householder in Hickory County
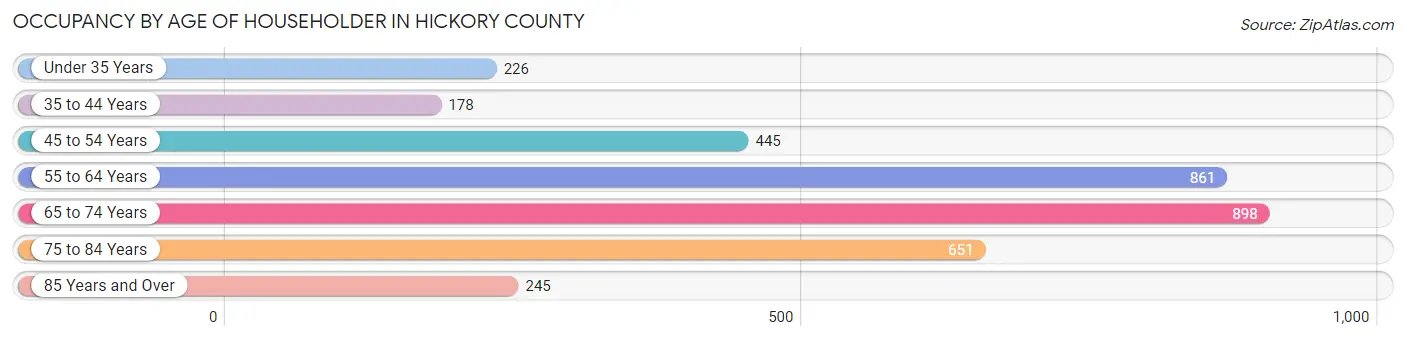
| Age Bracket | # Households | % Households |
| Under 35 Years | 226 | 6.5% |
| 35 to 44 Years | 178 | 5.1% |
| 45 to 54 Years | 445 | 12.7% |
| 55 to 64 Years | 861 | 24.6% |
| 65 to 74 Years | 898 | 25.6% |
| 75 to 84 Years | 651 | 18.6% |
| 85 Years and Over | 245 | 7.0% |
| Total | 3,504 | 100.0% |
Housing Finances in Hickory County
Median Income by Occupancy in Hickory County
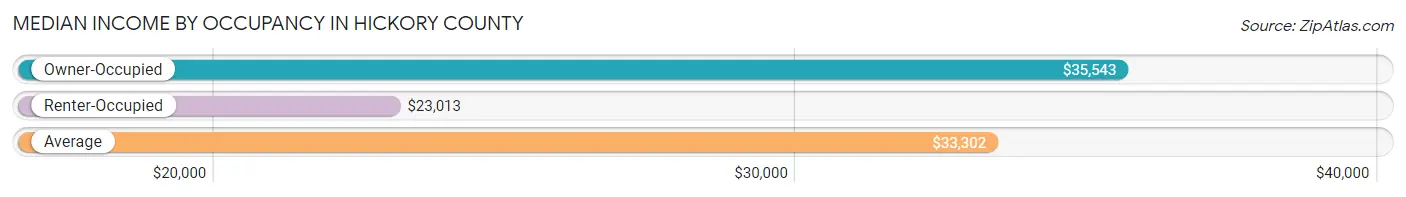
| Occupancy Type | # Households | Median Income |
| Owner-Occupied | 2,889 (82.5%) | $35,543 |
| Renter-Occupied | 615 (17.5%) | $23,013 |
| Average | 3,504 (100.0%) | $33,302 |
Occupancy by Householder Income Bracket in Hickory County
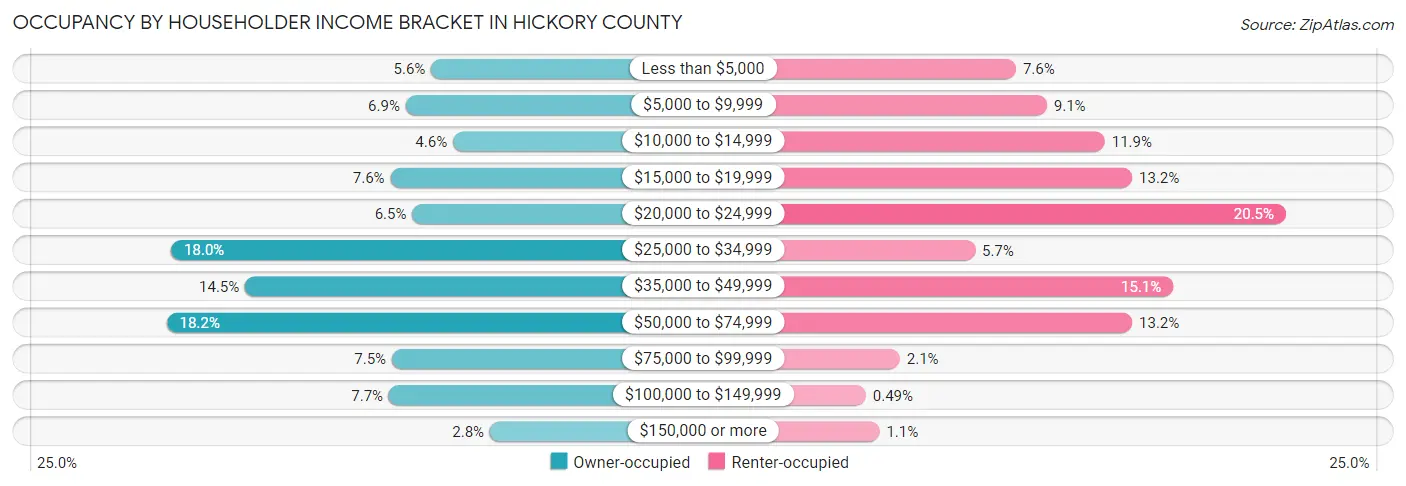
| Income Bracket | Owner-occupied | Renter-occupied |
| Less than $5,000 | 163 (5.6%) | 47 (7.6%) |
| $5,000 to $9,999 | 198 (6.9%) | 56 (9.1%) |
| $10,000 to $14,999 | 133 (4.6%) | 73 (11.9%) |
| $15,000 to $19,999 | 219 (7.6%) | 81 (13.2%) |
| $20,000 to $24,999 | 189 (6.5%) | 126 (20.5%) |
| $25,000 to $34,999 | 521 (18.0%) | 35 (5.7%) |
| $35,000 to $49,999 | 419 (14.5%) | 93 (15.1%) |
| $50,000 to $74,999 | 527 (18.2%) | 81 (13.2%) |
| $75,000 to $99,999 | 217 (7.5%) | 13 (2.1%) |
| $100,000 to $149,999 | 221 (7.6%) | 3 (0.5%) |
| $150,000 or more | 82 (2.8%) | 7 (1.1%) |
| Total | 2,889 (100.0%) | 615 (100.0%) |
Monthly Housing Cost Tiers in Hickory County
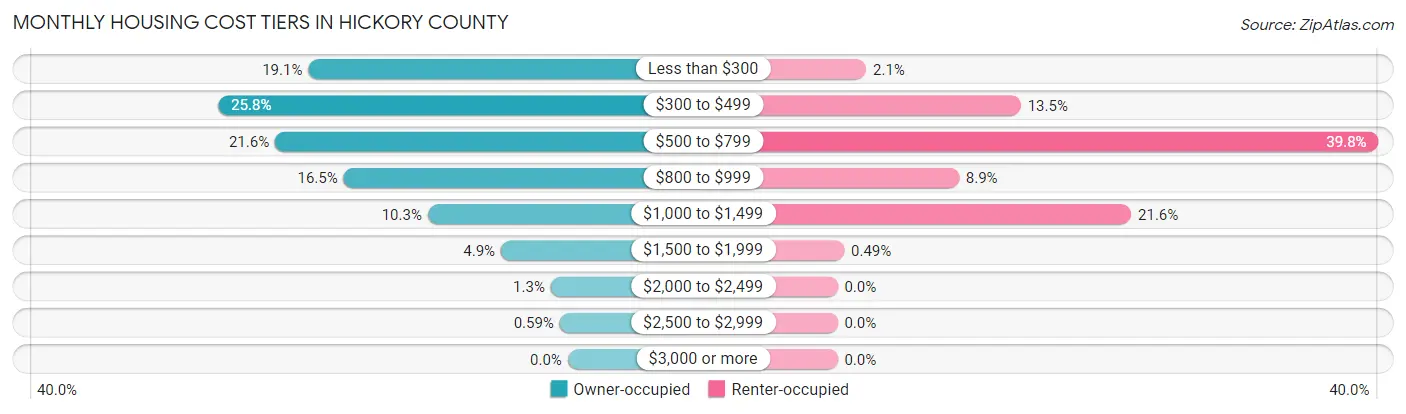
| Monthly Cost | Owner-occupied | Renter-occupied |
| Less than $300 | 552 (19.1%) | 13 (2.1%) |
| $300 to $499 | 744 (25.8%) | 83 (13.5%) |
| $500 to $799 | 623 (21.6%) | 245 (39.8%) |
| $800 to $999 | 477 (16.5%) | 55 (8.9%) |
| $1,000 to $1,499 | 298 (10.3%) | 133 (21.6%) |
| $1,500 to $1,999 | 142 (4.9%) | 3 (0.5%) |
| $2,000 to $2,499 | 36 (1.3%) | 0 (0.0%) |
| $2,500 to $2,999 | 17 (0.6%) | 0 (0.0%) |
| $3,000 or more | 0 (0.0%) | 0 (0.0%) |
| Total | 2,889 (100.0%) | 615 (100.0%) |
Physical Housing Characteristics in Hickory County
Housing Structures in Hickory County
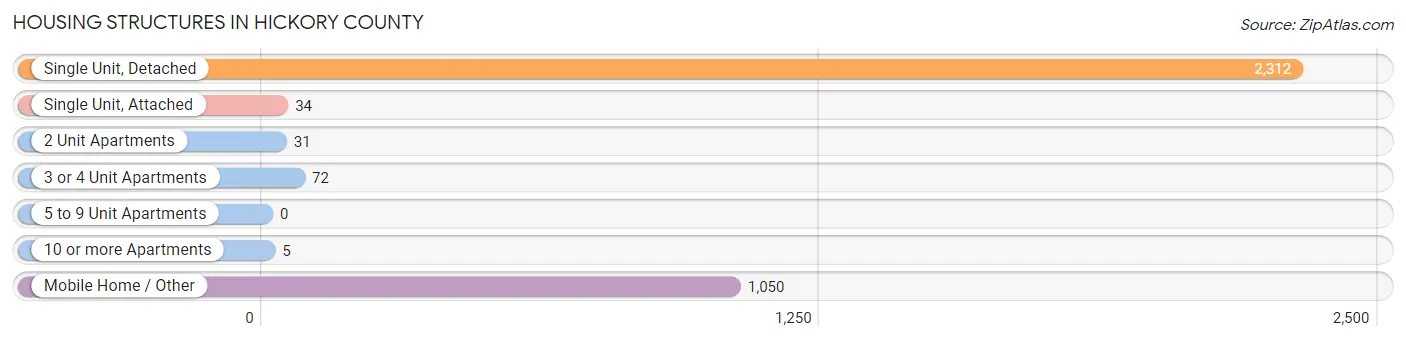
| Structure Type | # Housing Units | % Housing Units |
| Single Unit, Detached | 2,312 | 66.0% |
| Single Unit, Attached | 34 | 1.0% |
| 2 Unit Apartments | 31 | 0.9% |
| 3 or 4 Unit Apartments | 72 | 2.1% |
| 5 to 9 Unit Apartments | 0 | 0.0% |
| 10 or more Apartments | 5 | 0.1% |
| Mobile Home / Other | 1,050 | 30.0% |
| Total | 3,504 | 100.0% |
Housing Structures by Occupancy in Hickory County
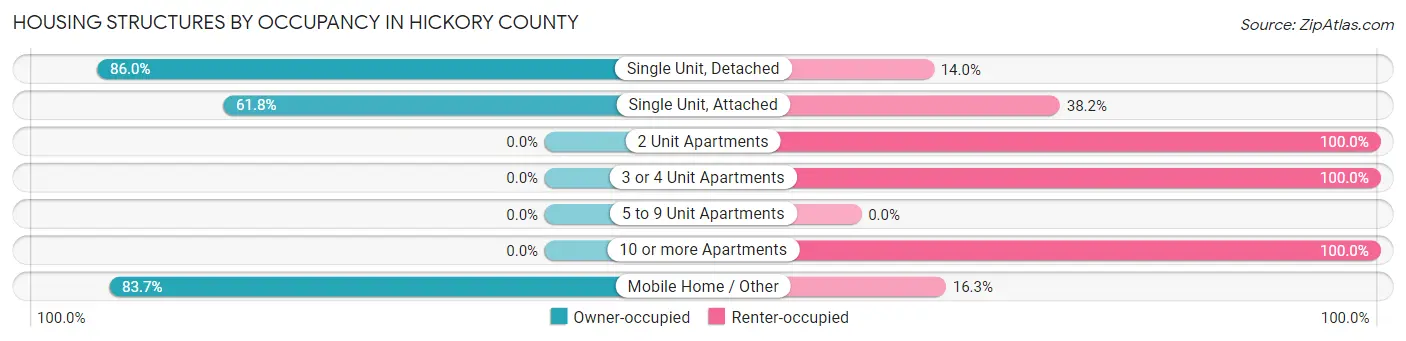
| Structure Type | Owner-occupied | Renter-occupied |
| Single Unit, Detached | 1,989 (86.0%) | 323 (14.0%) |
| Single Unit, Attached | 21 (61.8%) | 13 (38.2%) |
| 2 Unit Apartments | 0 (0.0%) | 31 (100.0%) |
| 3 or 4 Unit Apartments | 0 (0.0%) | 72 (100.0%) |
| 5 to 9 Unit Apartments | 0 (0.0%) | 0 (0.0%) |
| 10 or more Apartments | 0 (0.0%) | 5 (100.0%) |
| Mobile Home / Other | 879 (83.7%) | 171 (16.3%) |
| Total | 2,889 (82.5%) | 615 (17.5%) |
Housing Structures by Number of Rooms in Hickory County
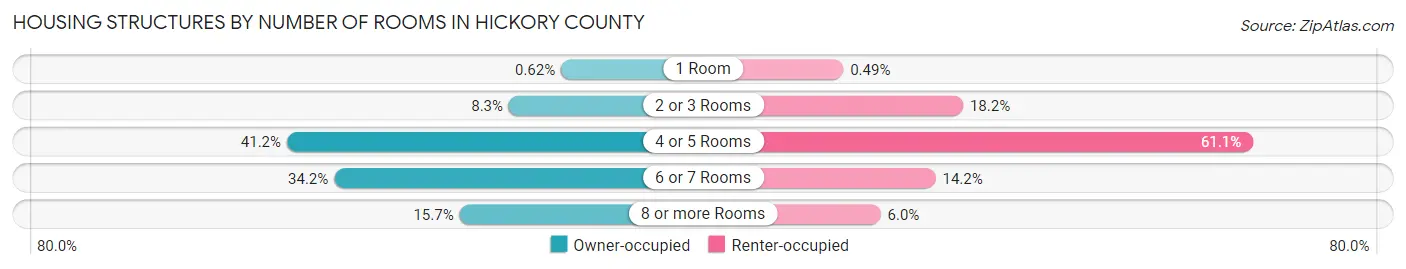
| Number of Rooms | Owner-occupied | Renter-occupied |
| 1 Room | 18 (0.6%) | 3 (0.5%) |
| 2 or 3 Rooms | 241 (8.3%) | 112 (18.2%) |
| 4 or 5 Rooms | 1,190 (41.2%) | 376 (61.1%) |
| 6 or 7 Rooms | 988 (34.2%) | 87 (14.1%) |
| 8 or more Rooms | 452 (15.7%) | 37 (6.0%) |
| Total | 2,889 (100.0%) | 615 (100.0%) |
Housing Structure by Heating Type in Hickory County
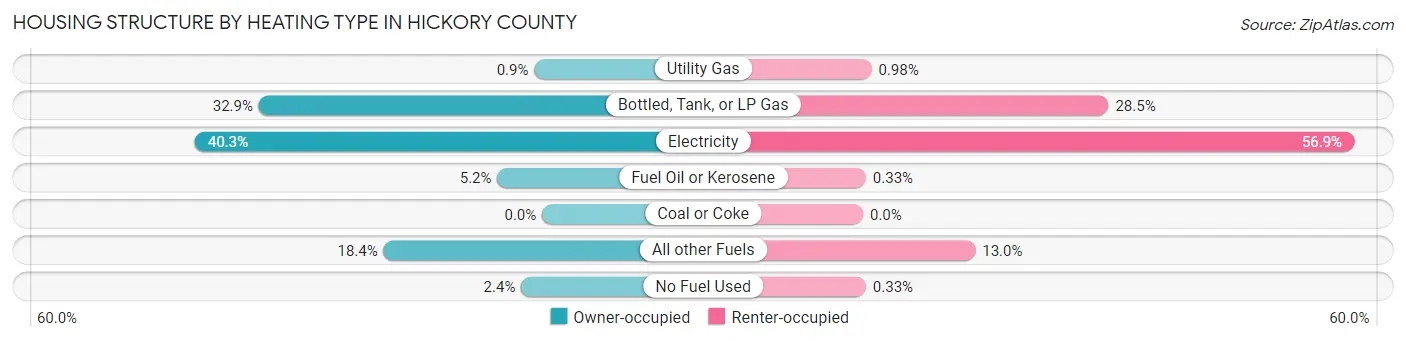
| Heating Type | Owner-occupied | Renter-occupied |
| Utility Gas | 26 (0.9%) | 6 (1.0%) |
| Bottled, Tank, or LP Gas | 949 (32.9%) | 175 (28.5%) |
| Electricity | 1,163 (40.3%) | 350 (56.9%) |
| Fuel Oil or Kerosene | 150 (5.2%) | 2 (0.3%) |
| Coal or Coke | 0 (0.0%) | 0 (0.0%) |
| All other Fuels | 531 (18.4%) | 80 (13.0%) |
| No Fuel Used | 70 (2.4%) | 2 (0.3%) |
| Total | 2,889 (100.0%) | 615 (100.0%) |
Household Vehicle Usage in Hickory County
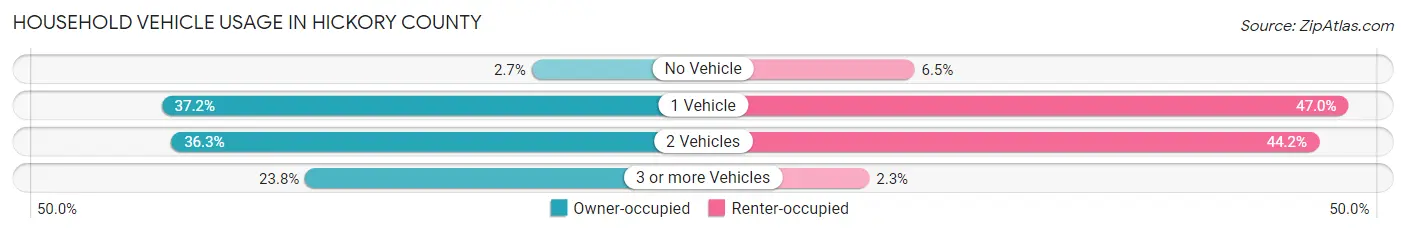
| Vehicles per Household | Owner-occupied | Renter-occupied |
| No Vehicle | 77 (2.7%) | 40 (6.5%) |
| 1 Vehicle | 1,075 (37.2%) | 289 (47.0%) |
| 2 Vehicles | 1,049 (36.3%) | 272 (44.2%) |
| 3 or more Vehicles | 688 (23.8%) | 14 (2.3%) |
| Total | 2,889 (100.0%) | 615 (100.0%) |
Real Estate & Mortgages in Hickory County
Real Estate and Mortgage Overview in Hickory County
| Characteristic | Without Mortgage | With Mortgage |
| Housing Units | 1,599 | 1,290 |
| Median Property Value | $104,800 | $117,300 |
| Median Household Income | $33,549 | $54 |
| Monthly Housing Costs | $350 | $0 |
| Real Estate Taxes | $485 | $26 |
Property Value by Mortgage Status in Hickory County
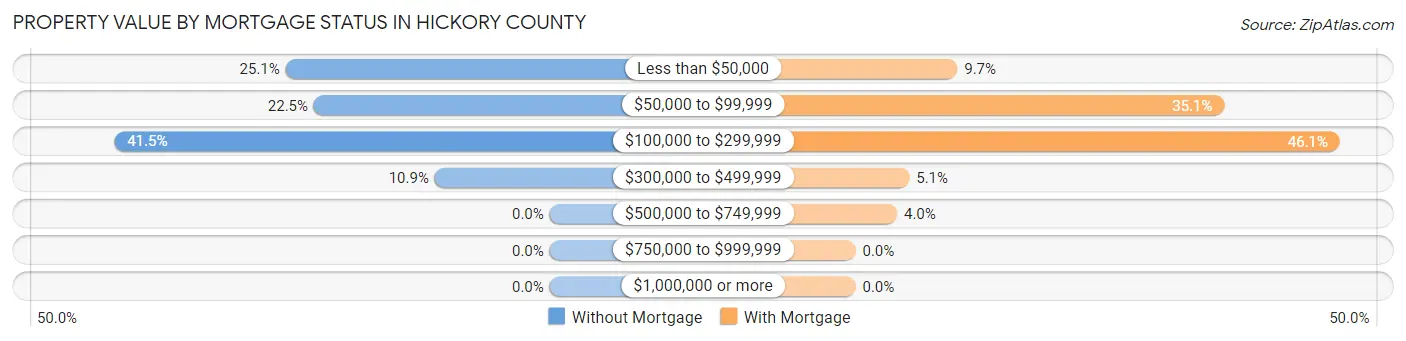
| Property Value | Without Mortgage | With Mortgage |
| Less than $50,000 | 402 (25.1%) | 125 (9.7%) |
| $50,000 to $99,999 | 359 (22.5%) | 453 (35.1%) |
| $100,000 to $299,999 | 663 (41.5%) | 595 (46.1%) |
| $300,000 to $499,999 | 175 (10.9%) | 66 (5.1%) |
| $500,000 to $749,999 | 0 (0.0%) | 51 (4.0%) |
| $750,000 to $999,999 | 0 (0.0%) | 0 (0.0%) |
| $1,000,000 or more | 0 (0.0%) | 0 (0.0%) |
| Total | 1,599 (100.0%) | 1,290 (100.0%) |
Household Income by Mortgage Status in Hickory County
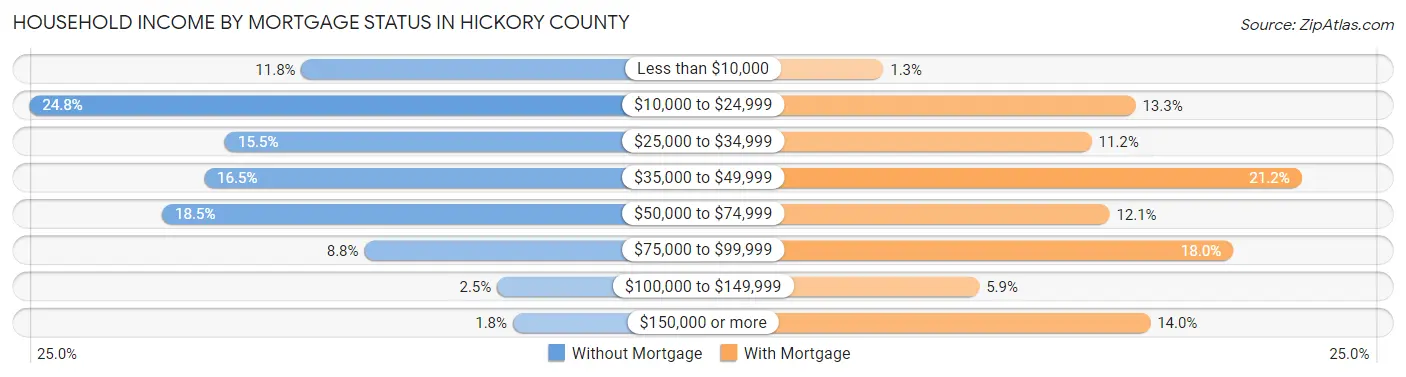
| Household Income | Without Mortgage | With Mortgage |
| Less than $10,000 | 189 (11.8%) | 17 (1.3%) |
| $10,000 to $24,999 | 396 (24.8%) | 172 (13.3%) |
| $25,000 to $34,999 | 247 (15.4%) | 145 (11.2%) |
| $35,000 to $49,999 | 263 (16.5%) | 274 (21.2%) |
| $50,000 to $74,999 | 295 (18.4%) | 156 (12.1%) |
| $75,000 to $99,999 | 141 (8.8%) | 232 (18.0%) |
| $100,000 to $149,999 | 40 (2.5%) | 76 (5.9%) |
| $150,000 or more | 28 (1.8%) | 181 (14.0%) |
| Total | 1,599 (100.0%) | 1,290 (100.0%) |
Property Value to Household Income Ratio in Hickory County
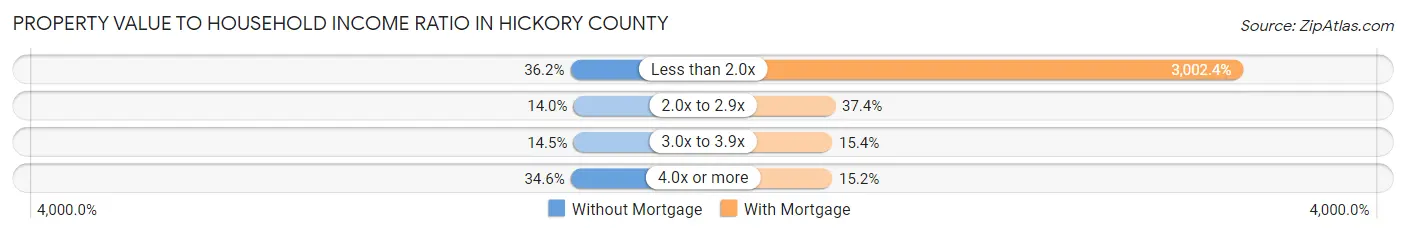
| Value-to-Income Ratio | Without Mortgage | With Mortgage |
| Less than 2.0x | 578 (36.1%) | 38,731 (3,002.4%) |
| 2.0x to 2.9x | 223 (14.0%) | 482 (37.4%) |
| 3.0x to 3.9x | 231 (14.4%) | 199 (15.4%) |
| 4.0x or more | 553 (34.6%) | 196 (15.2%) |
| Total | 1,599 (100.0%) | 1,290 (100.0%) |
Real Estate Taxes by Mortgage Status in Hickory County
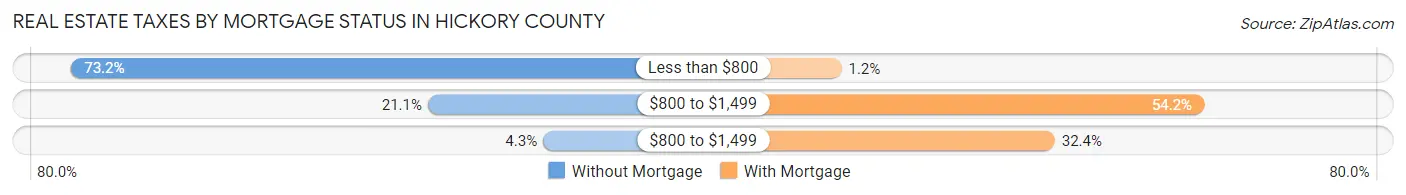
| Property Taxes | Without Mortgage | With Mortgage |
| Less than $800 | 1,170 (73.2%) | 16 (1.2%) |
| $800 to $1,499 | 337 (21.1%) | 699 (54.2%) |
| $800 to $1,499 | 68 (4.3%) | 418 (32.4%) |
| Total | 1,599 (100.0%) | 1,290 (100.0%) |
Health & Disability in Hickory County
Health Insurance Coverage by Age in Hickory County
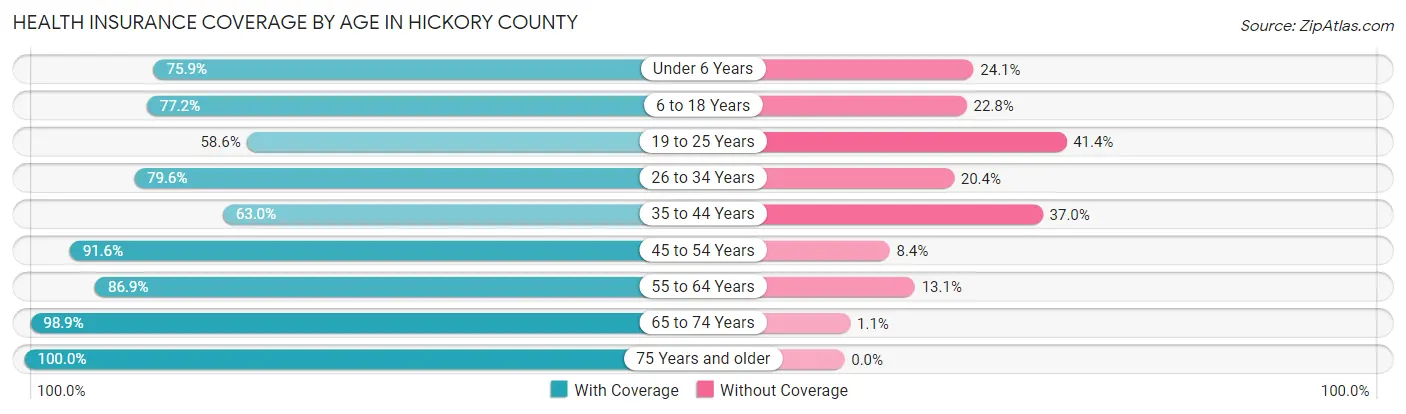
| Age Bracket | With Coverage | Without Coverage |
| Under 6 Years | 328 (75.9%) | 104 (24.1%) |
| 6 to 18 Years | 881 (77.2%) | 260 (22.8%) |
| 19 to 25 Years | 255 (58.6%) | 180 (41.4%) |
| 26 to 34 Years | 421 (79.6%) | 108 (20.4%) |
| 35 to 44 Years | 489 (63.0%) | 287 (37.0%) |
| 45 to 54 Years | 749 (91.6%) | 69 (8.4%) |
| 55 to 64 Years | 1,249 (86.9%) | 189 (13.1%) |
| 65 to 74 Years | 1,553 (98.9%) | 17 (1.1%) |
| 75 Years and older | 1,186 (100.0%) | 0 (0.0%) |
| Total | 7,111 (85.4%) | 1,214 (14.6%) |
Health Insurance Coverage by Citizenship Status in Hickory County
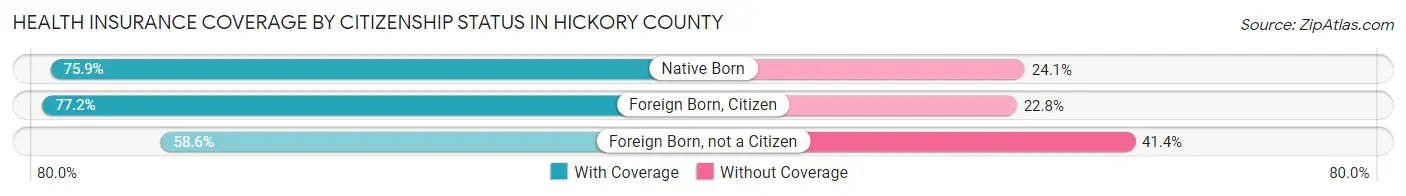
| Citizenship Status | With Coverage | Without Coverage |
| Native Born | 328 (75.9%) | 104 (24.1%) |
| Foreign Born, Citizen | 881 (77.2%) | 260 (22.8%) |
| Foreign Born, not a Citizen | 255 (58.6%) | 180 (41.4%) |
Health Insurance Coverage by Household Income in Hickory County
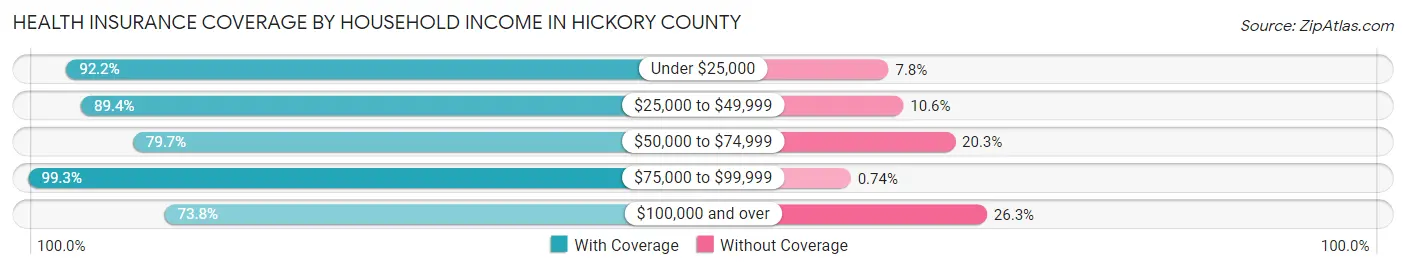
| Household Income | With Coverage | Without Coverage |
| Under $25,000 | 1,804 (92.2%) | 153 (7.8%) |
| $25,000 to $49,999 | 1,797 (89.4%) | 213 (10.6%) |
| $50,000 to $74,999 | 1,638 (79.7%) | 417 (20.3%) |
| $75,000 to $99,999 | 675 (99.3%) | 5 (0.7%) |
| $100,000 and over | 1,197 (73.8%) | 426 (26.3%) |
Public vs Private Health Insurance Coverage by Age in Hickory County
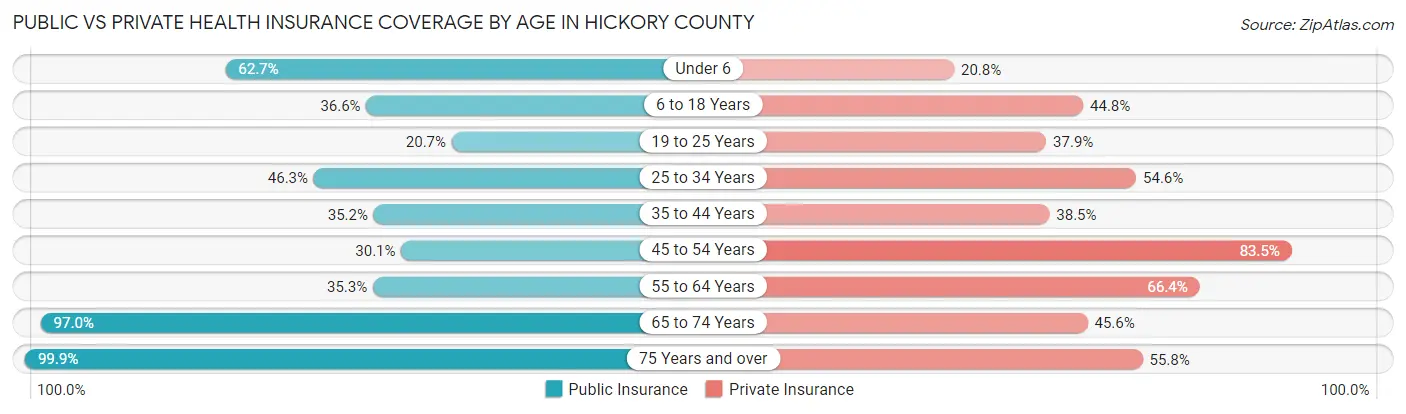
| Age Bracket | Public Insurance | Private Insurance |
| Under 6 | 271 (62.7%) | 90 (20.8%) |
| 6 to 18 Years | 417 (36.5%) | 511 (44.8%) |
| 19 to 25 Years | 90 (20.7%) | 165 (37.9%) |
| 25 to 34 Years | 245 (46.3%) | 289 (54.6%) |
| 35 to 44 Years | 273 (35.2%) | 299 (38.5%) |
| 45 to 54 Years | 246 (30.1%) | 683 (83.5%) |
| 55 to 64 Years | 508 (35.3%) | 955 (66.4%) |
| 65 to 74 Years | 1,523 (97.0%) | 716 (45.6%) |
| 75 Years and over | 1,185 (99.9%) | 662 (55.8%) |
| Total | 4,758 (57.2%) | 4,370 (52.5%) |
Disability Status by Sex by Age in Hickory County
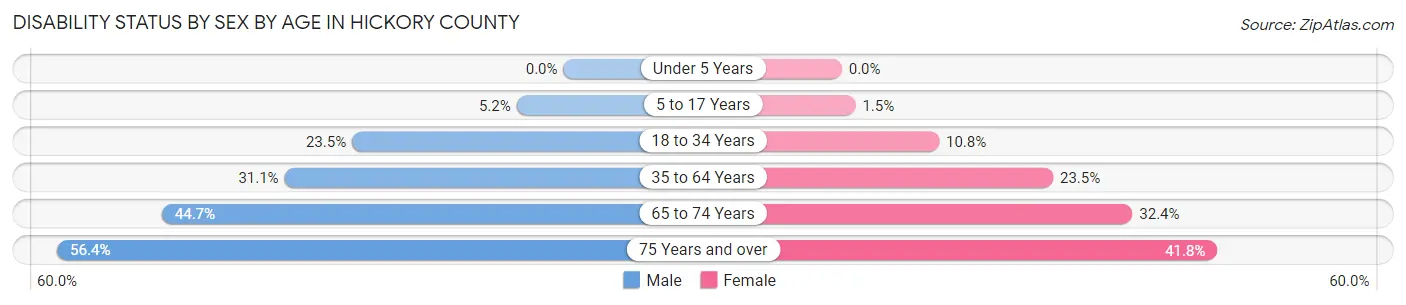
| Age Bracket | Male | Female |
| Under 5 Years | 0 (0.0%) | 0 (0.0%) |
| 5 to 17 Years | 33 (5.2%) | 7 (1.5%) |
| 18 to 34 Years | 133 (23.5%) | 59 (10.8%) |
| 35 to 64 Years | 473 (31.1%) | 355 (23.5%) |
| 65 to 74 Years | 351 (44.7%) | 254 (32.4%) |
| 75 Years and over | 314 (56.4%) | 263 (41.8%) |
Disability Class by Sex by Age in Hickory County
Disability Class: Hearing Difficulty
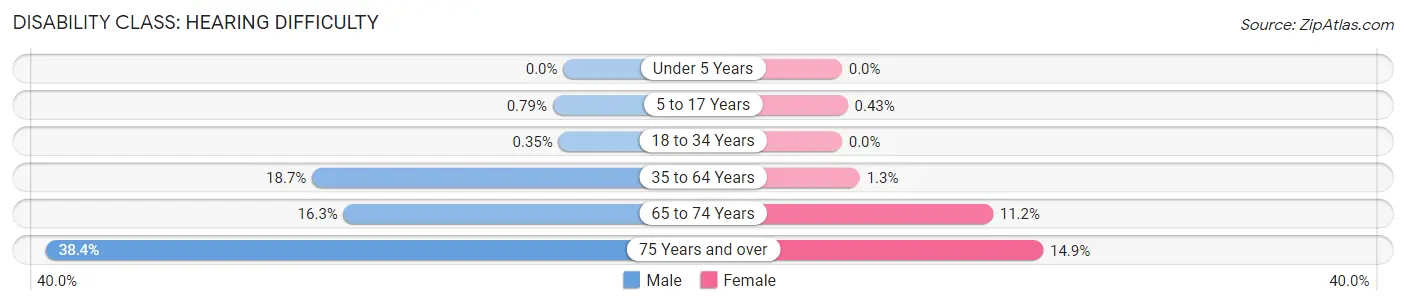
| Age Bracket | Male | Female |
| Under 5 Years | 0 (0.0%) | 0 (0.0%) |
| 5 to 17 Years | 5 (0.8%) | 2 (0.4%) |
| 18 to 34 Years | 2 (0.4%) | 0 (0.0%) |
| 35 to 64 Years | 284 (18.6%) | 20 (1.3%) |
| 65 to 74 Years | 128 (16.3%) | 88 (11.2%) |
| 75 Years and over | 214 (38.4%) | 94 (14.9%) |
Disability Class: Vision Difficulty
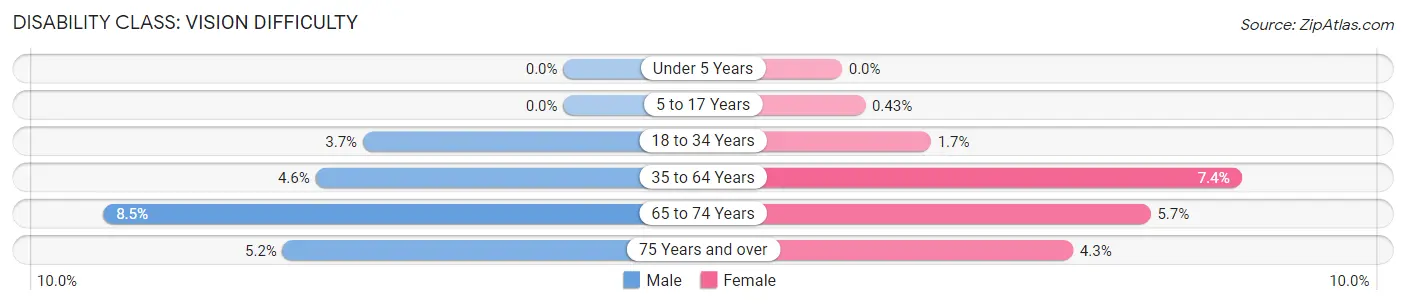
| Age Bracket | Male | Female |
| Under 5 Years | 0 (0.0%) | 0 (0.0%) |
| 5 to 17 Years | 0 (0.0%) | 2 (0.4%) |
| 18 to 34 Years | 21 (3.7%) | 9 (1.7%) |
| 35 to 64 Years | 70 (4.6%) | 112 (7.4%) |
| 65 to 74 Years | 67 (8.5%) | 45 (5.7%) |
| 75 Years and over | 29 (5.2%) | 27 (4.3%) |
Disability Class: Cognitive Difficulty
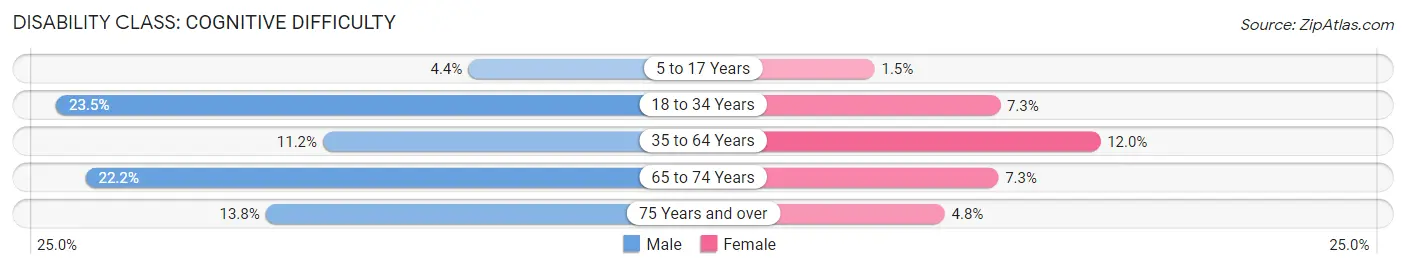
| Age Bracket | Male | Female |
| 5 to 17 Years | 28 (4.4%) | 7 (1.5%) |
| 18 to 34 Years | 133 (23.5%) | 40 (7.3%) |
| 35 to 64 Years | 170 (11.2%) | 181 (12.0%) |
| 65 to 74 Years | 174 (22.2%) | 57 (7.3%) |
| 75 Years and over | 77 (13.8%) | 30 (4.8%) |
Disability Class: Ambulatory Difficulty
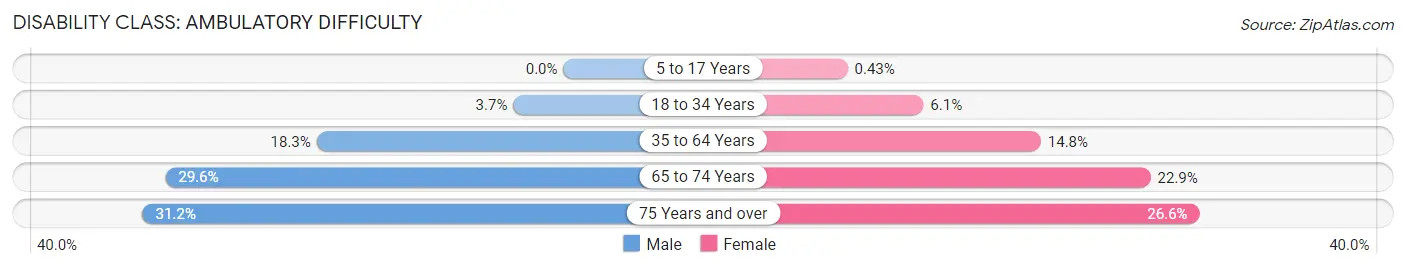
| Age Bracket | Male | Female |
| 5 to 17 Years | 0 (0.0%) | 2 (0.4%) |
| 18 to 34 Years | 21 (3.7%) | 33 (6.1%) |
| 35 to 64 Years | 279 (18.3%) | 223 (14.8%) |
| 65 to 74 Years | 232 (29.5%) | 180 (22.9%) |
| 75 Years and over | 174 (31.2%) | 167 (26.6%) |
Disability Class: Self-Care Difficulty
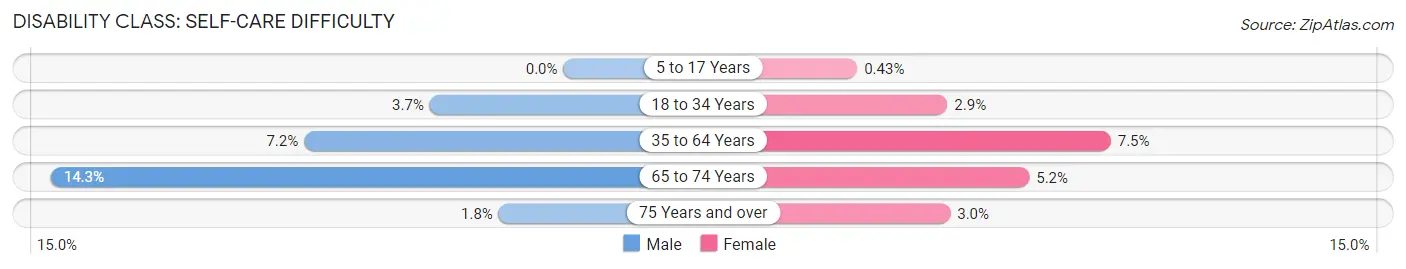
| Age Bracket | Male | Female |
| 5 to 17 Years | 0 (0.0%) | 2 (0.4%) |
| 18 to 34 Years | 21 (3.7%) | 16 (2.9%) |
| 35 to 64 Years | 110 (7.2%) | 113 (7.5%) |
| 65 to 74 Years | 112 (14.3%) | 41 (5.2%) |
| 75 Years and over | 10 (1.8%) | 19 (3.0%) |
Technology Access in Hickory County
Computing Device Access in Hickory County
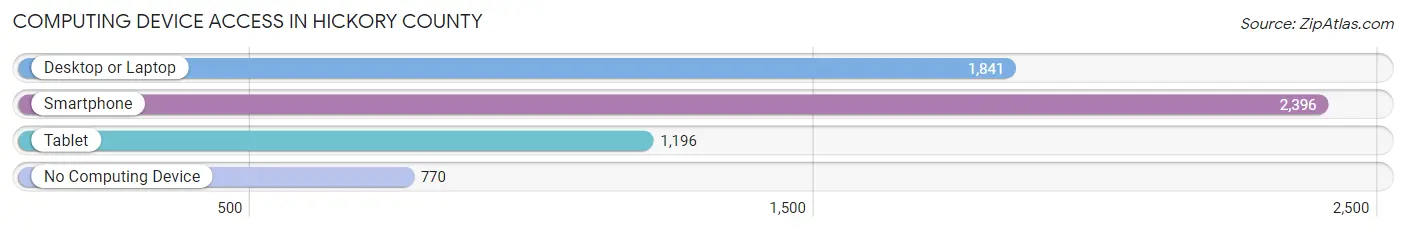
| Device Type | # Households | % Households |
| Desktop or Laptop | 1,841 | 52.5% |
| Smartphone | 2,396 | 68.4% |
| Tablet | 1,196 | 34.1% |
| No Computing Device | 770 | 22.0% |
| Total | 3,504 | 100.0% |
Internet Access in Hickory County
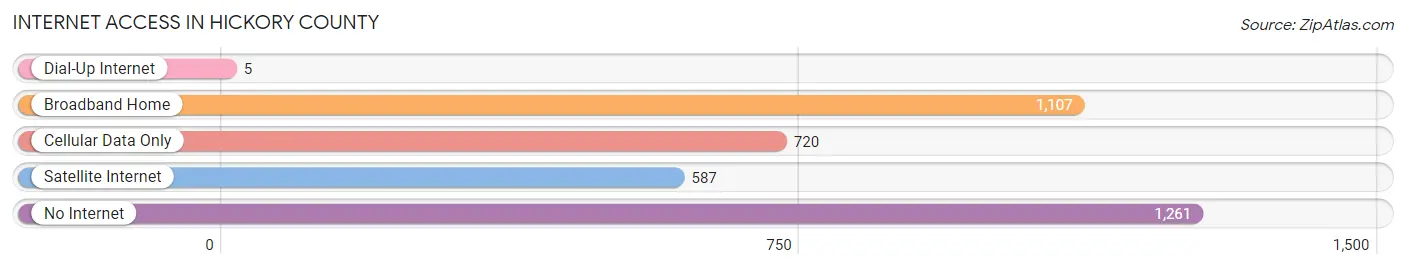
| Internet Type | # Households | % Households |
| Dial-Up Internet | 5 | 0.1% |
| Broadband Home | 1,107 | 31.6% |
| Cellular Data Only | 720 | 20.5% |
| Satellite Internet | 587 | 16.8% |
| No Internet | 1,261 | 36.0% |
| Total | 3,504 | 100.0% |
Hickory County Summary
Hickory County is located in the Ozark region of Missouri and is part of the Ozark Plateau. It is bordered by Dallas County to the north, Polk County to the east, St. Clair County to the south, and Benton County to the west. The county seat is Hermitage, and the largest city is Wheatland. The county was organized in 1845 and named after President Andrew Jackson, who was known as “Old Hickory”.
Geography
Hickory County is located in the Ozark region of Missouri and is part of the Ozark Plateau. It is bordered by Dallas County to the north, Polk County to the east, St. Clair County to the south, and Benton County to the west. The county has a total area of 545 square miles, of which 544 square miles is land and 1 square mile is water. The highest point in the county is located at the intersection of Highway 54 and Highway 83, at an elevation of 1,072 feet.
The county is mostly rural, with rolling hills and valleys. The landscape is dominated by forests, with oak, hickory, and pine trees being the most common. The county is also home to several creeks and rivers, including the Sac River, which runs through the county from north to south.
Economy
The economy of Hickory County is largely based on agriculture. The county is home to several large farms, which produce a variety of crops, including corn, soybeans, wheat, hay, and oats. Livestock production is also important, with cattle, hogs, and poultry being the most common.
The county is also home to several manufacturing companies, including a furniture factory, a plastics factory, and a metal fabrication plant. Tourism is also an important part of the economy, with several state parks and recreational areas located in the county.
Demographics
As of the 2010 census, the population of Hickory County was 9,627, with a population density of 18 people per square mile. The racial makeup of the county was 97.3% White, 0.7% African American, 0.3% Native American, 0.2% Asian, 0.1% Pacific Islander, 0.3% from other races, and 1.2% from two or more races. Hispanic or Latino of any race were 1.3% of the population.
The median income for a household in the county was $37,945, and the median income for a family was $45,938. The per capita income for the county was $18,945. About 11.2% of families and 14.2% of the population were below the poverty line, including 19.2% of those under age 18 and 10.2% of those age 65 or over.
Conclusion
Hickory County is a rural county located in the Ozark region of Missouri. It is bordered by Dallas County to the north, Polk County to the east, St. Clair County to the south, and Benton County to the west. The county is mostly rural, with rolling hills and valleys, and is home to several large farms and manufacturing companies. The population of Hickory County is 9,627, with a median income of $37,945. The economy of the county is largely based on agriculture and manufacturing, with tourism also playing an important role.
Common Questions
What is Per Capita Income in Hickory County?
Per Capita income in Hickory County is $21,476.
What is the Median Family Income in Hickory County?
Median Family Income in Hickory County is $52,151.
What is the Median Household income in Hickory County?
Median Household Income in Hickory County is $33,302.
What is Income or Wage Gap in Hickory County?
Income or Wage Gap in Hickory County is 27.3%.
Women in Hickory County earn 72.7 cents for every dollar earned by a man.
What is Inequality or Gini Index in Hickory County?
Inequality or Gini Index in Hickory County is 0.45.
What is the Total Population of Hickory County?
Total Population of Hickory County is 8,452.
What is the Total Male Population of Hickory County?
Total Male Population of Hickory County is 4,307.
What is the Total Female Population of Hickory County?
Total Female Population of Hickory County is 4,145.
What is the Ratio of Males per 100 Females in Hickory County?
There are 103.91 Males per 100 Females in Hickory County.
What is the Ratio of Females per 100 Males in Hickory County?
There are 96.24 Females per 100 Males in Hickory County.
What is the Median Population Age in Hickory County?
Median Population Age in Hickory County is 55.7 Years.
What is the Average Family Size in Hickory County
Average Family Size in Hickory County is 3.4 People.
What is the Average Household Size in Hickory County
Average Household Size in Hickory County is 2.4 People.
How Large is the Labor Force in Hickory County?
There are 2,811 People in the Labor Forcein in Hickory County.
What is the Percentage of People in the Labor Force in Hickory County?
39.1% of People are in the Labor Force in Hickory County.
What is the Unemployment Rate in Hickory County?
Unemployment Rate in Hickory County is 8.8%.