Gasconade County, MO Map & Demographics
Gasconade County Map
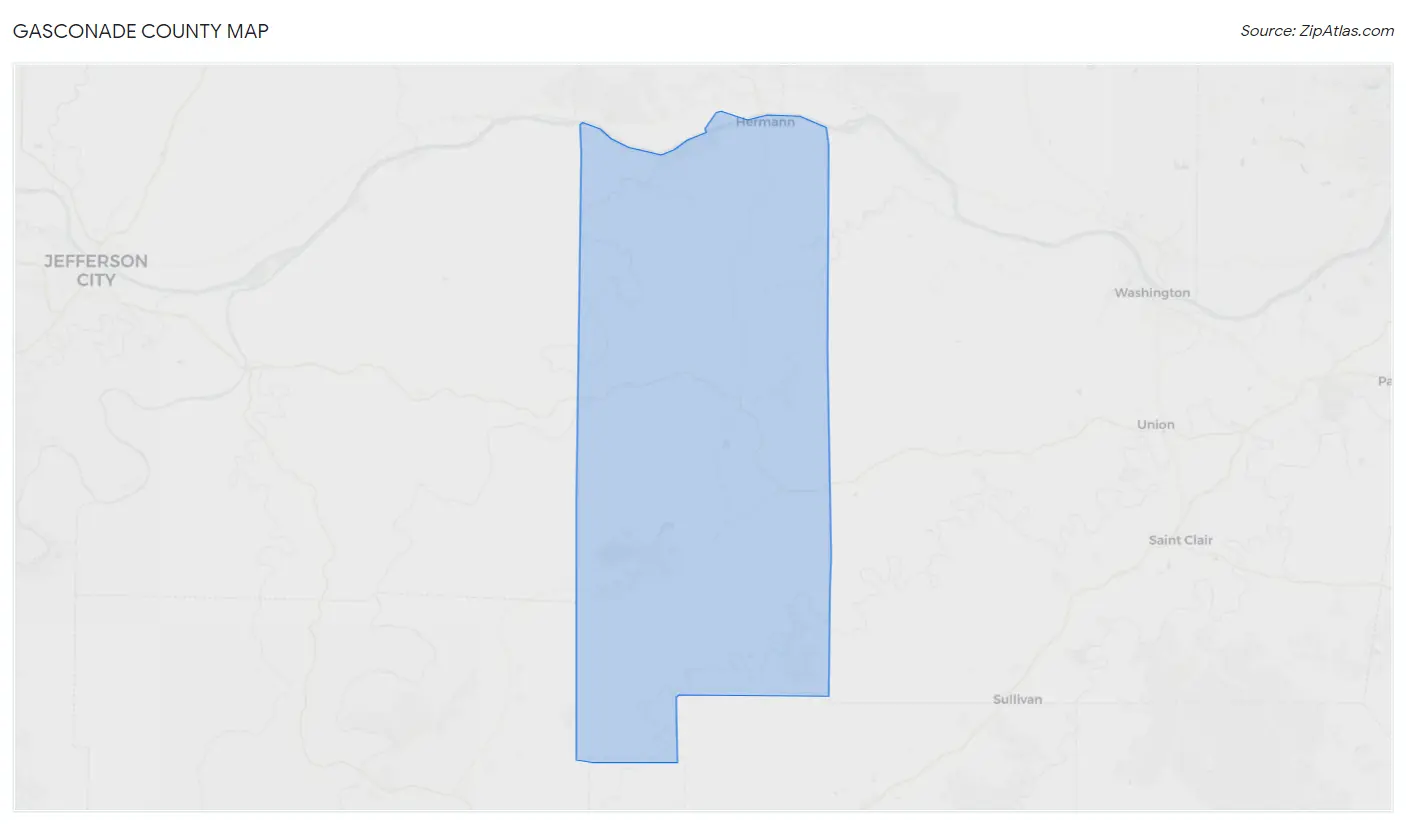
Gasconade County Overview
$34,414
PER CAPITA INCOME
$77,652
AVG FAMILY INCOME
$62,638
AVG HOUSEHOLD INCOME
28.3%
WAGE / INCOME GAP [ % ]
71.7¢/ $1
WAGE / INCOME GAP [ $ ]
$12,880
FAMILY INCOME DEFICIT
0.46
INEQUALITY / GINI INDEX
14,801
TOTAL POPULATION
7,522
MALE POPULATION
7,279
FEMALE POPULATION
103.34
MALES / 100 FEMALES
96.77
FEMALES / 100 MALES
46.3
MEDIAN AGE
3.0
AVG FAMILY SIZE
2.4
AVG HOUSEHOLD SIZE
7,333
LABOR FORCE [ PEOPLE ]
60.6%
PERCENT IN LABOR FORCE
2.1%
UNEMPLOYMENT RATE
Gasconade County Area Codes
Income in Gasconade County
Income Overview in Gasconade County
Per Capita Income in Gasconade County is $34,414, while median incomes of families and households are $77,652 and $62,638 respectively.
| Characteristic | Number | Measure |
| Per Capita Income | 14,801 | $34,414 |
| Median Family Income | 3,930 | $77,652 |
| Mean Family Income | 3,930 | $97,358 |
| Median Household Income | 5,970 | $62,638 |
| Mean Household Income | 5,970 | $83,256 |
| Income Deficit | 3,930 | $12,880 |
| Wage / Income Gap (%) | 14,801 | 28.29% |
| Wage / Income Gap ($) | 14,801 | 71.71¢ per $1 |
| Gini / Inequality Index | 14,801 | 0.46 |
Earnings by Sex in Gasconade County
Average Earnings in Gasconade County are $34,688, $41,329 for men and $29,639 for women, a difference of 28.3%.
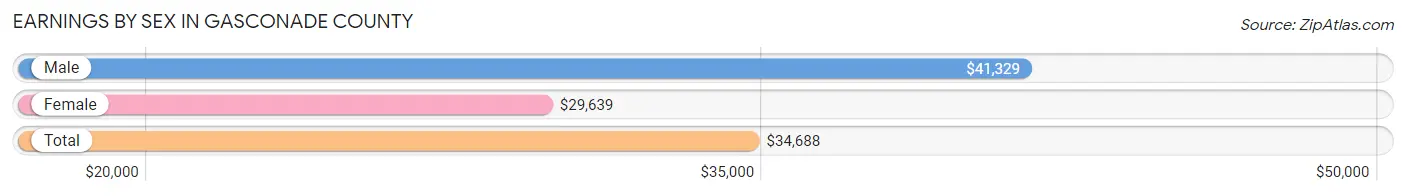
| Sex | Number | Average Earnings |
| Male | 4,136 (53.3%) | $41,329 |
| Female | 3,625 (46.7%) | $29,639 |
| Total | 7,761 (100.0%) | $34,688 |
Earnings by Sex by Income Bracket in Gasconade County
The most common earnings brackets in Gasconade County are $75,000 to $99,999 for men (502 | 12.1%) and $35,000 to $39,999 for women (337 | 9.3%).
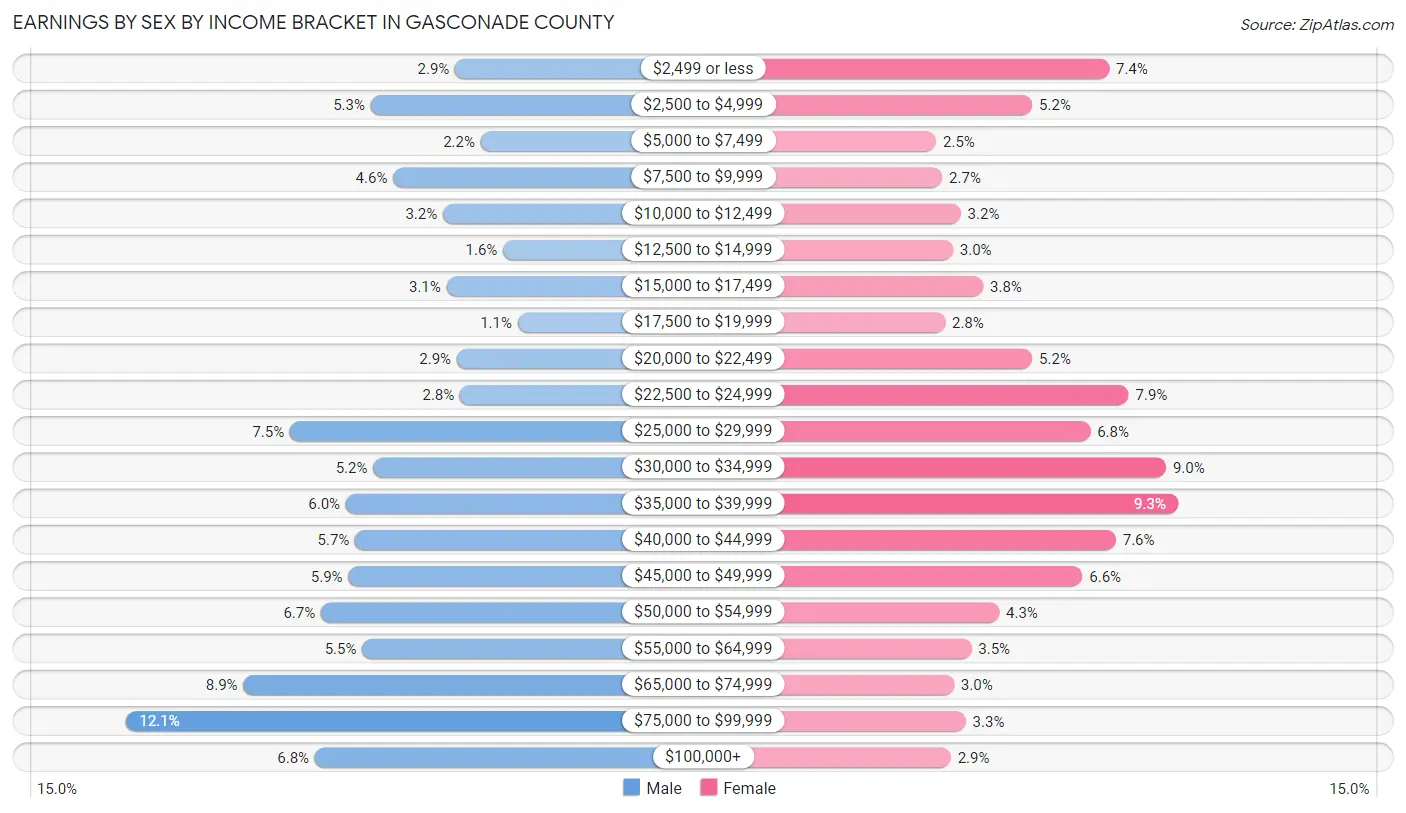
| Income | Male | Female |
| $2,499 or less | 120 (2.9%) | 267 (7.4%) |
| $2,500 to $4,999 | 218 (5.3%) | 189 (5.2%) |
| $5,000 to $7,499 | 90 (2.2%) | 91 (2.5%) |
| $7,500 to $9,999 | 192 (4.6%) | 97 (2.7%) |
| $10,000 to $12,499 | 134 (3.2%) | 116 (3.2%) |
| $12,500 to $14,999 | 64 (1.5%) | 108 (3.0%) |
| $15,000 to $17,499 | 130 (3.1%) | 139 (3.8%) |
| $17,500 to $19,999 | 47 (1.1%) | 100 (2.8%) |
| $20,000 to $22,499 | 118 (2.9%) | 189 (5.2%) |
| $22,500 to $24,999 | 114 (2.8%) | 287 (7.9%) |
| $25,000 to $29,999 | 312 (7.5%) | 248 (6.8%) |
| $30,000 to $34,999 | 215 (5.2%) | 325 (9.0%) |
| $35,000 to $39,999 | 247 (6.0%) | 337 (9.3%) |
| $40,000 to $44,999 | 236 (5.7%) | 274 (7.6%) |
| $45,000 to $49,999 | 244 (5.9%) | 240 (6.6%) |
| $50,000 to $54,999 | 276 (6.7%) | 155 (4.3%) |
| $55,000 to $64,999 | 228 (5.5%) | 127 (3.5%) |
| $65,000 to $74,999 | 366 (8.8%) | 109 (3.0%) |
| $75,000 to $99,999 | 502 (12.1%) | 121 (3.3%) |
| $100,000+ | 283 (6.8%) | 106 (2.9%) |
| Total | 4,136 (100.0%) | 3,625 (100.0%) |
Earnings by Sex by Educational Attainment in Gasconade County
Average earnings in Gasconade County are $44,663 for men and $30,676 for women, a difference of 31.3%. Men with an educational attainment of graduate degree enjoy the highest average annual earnings of $72,560, while those with less than high school education earn the least with $37,100. Women with an educational attainment of graduate degree earn the most with the average annual earnings of $49,053, while those with high school diploma education have the smallest earnings of $24,500.
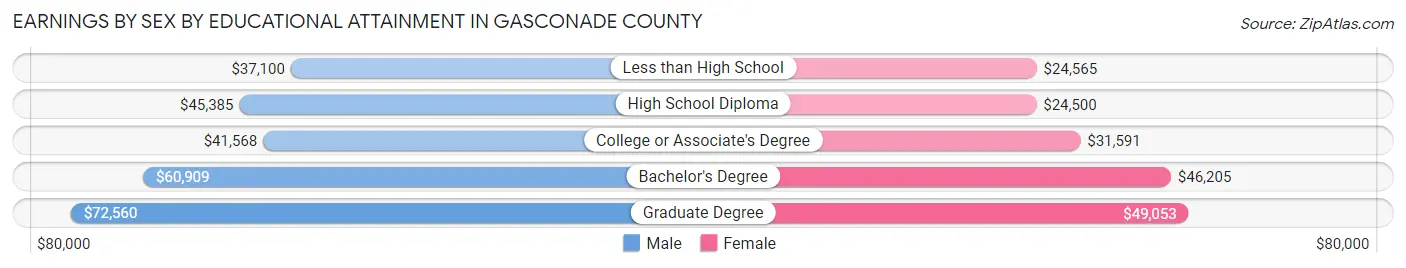
| Educational Attainment | Male Income | Female Income |
| Less than High School | $37,100 | $24,565 |
| High School Diploma | $45,385 | $24,500 |
| College or Associate's Degree | $41,568 | $31,591 |
| Bachelor's Degree | $60,909 | $46,205 |
| Graduate Degree | $72,560 | $49,053 |
| Total | $44,663 | $30,676 |
Family Income in Gasconade County
Family Income Brackets in Gasconade County
According to the Gasconade County family income data, there are 872 families falling into the $50,000 to $74,999 income range, which is the most common income bracket and makes up 22.2% of all families. Conversely, the $10,000 to $14,999 income bracket is the least frequent group with only 83 families (2.1%) belonging to this category.
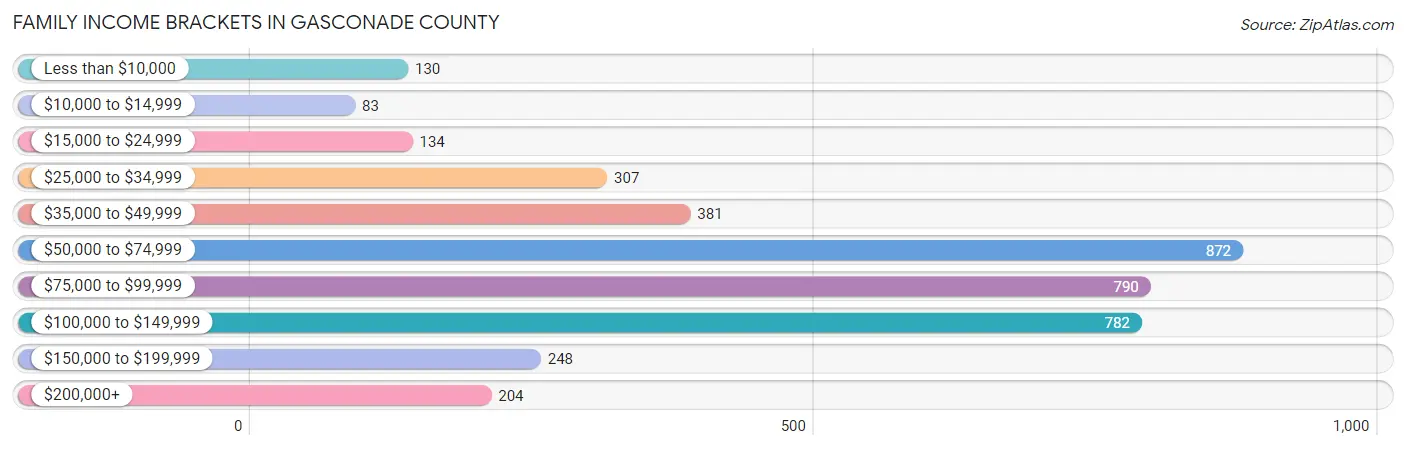
| Income Bracket | # Families | % Families |
| Less than $10,000 | 130 | 3.3% |
| $10,000 to $14,999 | 83 | 2.1% |
| $15,000 to $24,999 | 134 | 3.4% |
| $25,000 to $34,999 | 307 | 7.8% |
| $35,000 to $49,999 | 381 | 9.7% |
| $50,000 to $74,999 | 872 | 22.2% |
| $75,000 to $99,999 | 790 | 20.1% |
| $100,000 to $149,999 | 782 | 19.9% |
| $150,000 to $199,999 | 248 | 6.3% |
| $200,000+ | 204 | 5.2% |
Family Income by Famaliy Size in Gasconade County
7+ person families (16 | 0.4%) account for the highest median family income in Gasconade County with $115,000 per family, while 2-person families (1,998 | 50.8%) have the highest median income of $33,776 per family member.
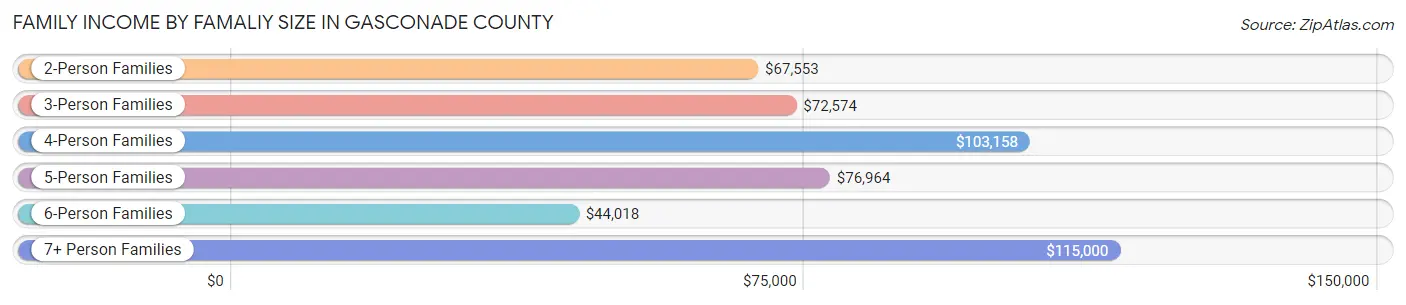
| Income Bracket | # Families | Median Income |
| 2-Person Families | 1,998 (50.8%) | $67,553 |
| 3-Person Families | 881 (22.4%) | $72,574 |
| 4-Person Families | 614 (15.6%) | $103,158 |
| 5-Person Families | 314 (8.0%) | $76,964 |
| 6-Person Families | 107 (2.7%) | $44,018 |
| 7+ Person Families | 16 (0.4%) | $115,000 |
| Total | 3,930 (100.0%) | $77,652 |
Family Income by Number of Earners in Gasconade County
The median family income in Gasconade County is $77,652, with families comprising 3+ earners (337) having the highest median family income of $123,920, while families with no earners (652) have the lowest median family income of $49,286, accounting for 8.6% and 16.6% of families, respectively.
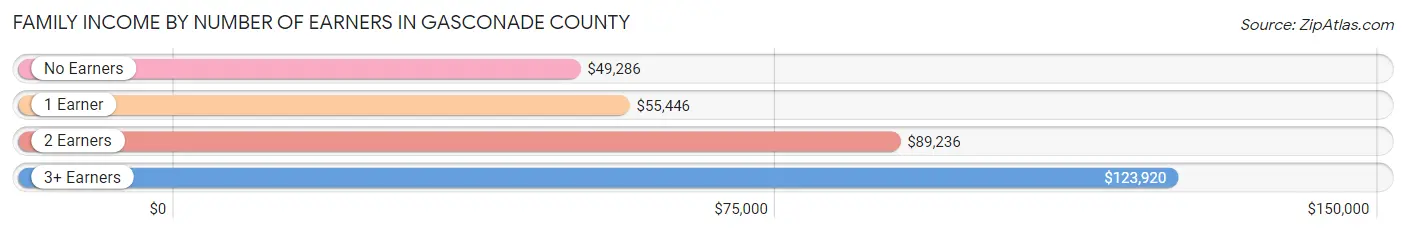
| Number of Earners | # Families | Median Income |
| No Earners | 652 (16.6%) | $49,286 |
| 1 Earner | 1,164 (29.6%) | $55,446 |
| 2 Earners | 1,777 (45.2%) | $89,236 |
| 3+ Earners | 337 (8.6%) | $123,920 |
| Total | 3,930 (100.0%) | $77,652 |
Household Income in Gasconade County
Household Income Brackets in Gasconade County
With 1,212 households falling in the category, the $50,000 to $74,999 income range is the most frequent in Gasconade County, accounting for 20.3% of all households. In contrast, only 233 households (3.9%) fall into the less than $10,000 income bracket, making it the least populous group.
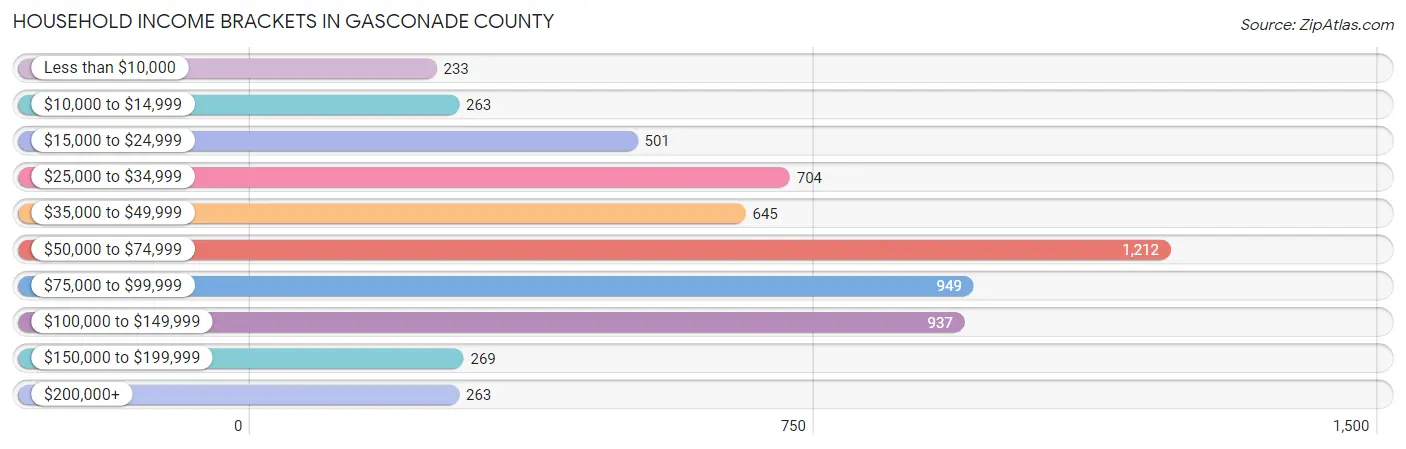
| Income Bracket | # Households | % Households |
| Less than $10,000 | 233 | 3.9% |
| $10,000 to $14,999 | 263 | 4.4% |
| $15,000 to $24,999 | 501 | 8.4% |
| $25,000 to $34,999 | 704 | 11.8% |
| $35,000 to $49,999 | 645 | 10.8% |
| $50,000 to $74,999 | 1,212 | 20.3% |
| $75,000 to $99,999 | 949 | 15.9% |
| $100,000 to $149,999 | 937 | 15.7% |
| $150,000 to $199,999 | 269 | 4.5% |
| $200,000+ | 263 | 4.4% |
Household Income by Householder Age in Gasconade County
The median household income in Gasconade County is $62,638, with the highest median household income of $75,109 found in the 25 to 44 years age bracket for the primary householder. A total of 1,472 households (24.7%) fall into this category. Meanwhile, the 15 to 24 years age bracket for the primary householder has the lowest median household income of $0, with 107 households (1.8%) in this group.
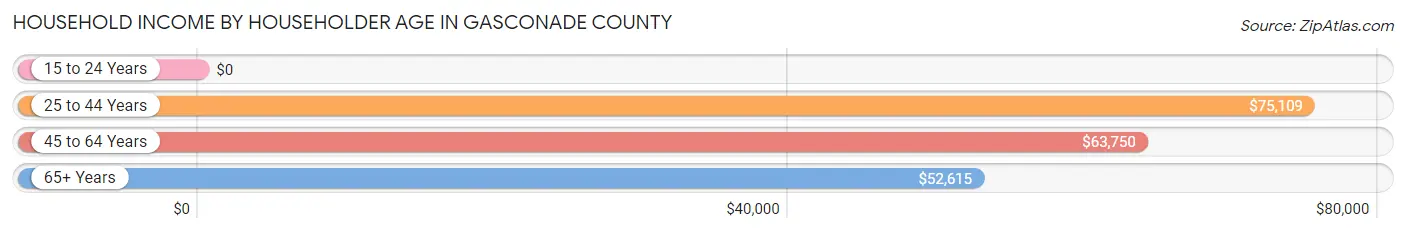
| Income Bracket | # Households | Median Income |
| 15 to 24 Years | 107 (1.8%) | $0 |
| 25 to 44 Years | 1,472 (24.7%) | $75,109 |
| 45 to 64 Years | 2,366 (39.6%) | $63,750 |
| 65+ Years | 2,025 (33.9%) | $52,615 |
| Total | 5,970 (100.0%) | $62,638 |
Poverty in Gasconade County
Income Below Poverty by Sex and Age in Gasconade County
With 11.3% poverty level for males and 12.6% for females among the residents of Gasconade County, 15 year old males and 5 year old females are the most vulnerable to poverty, with 52 males (62.6%) and 32 females (41.0%) in their respective age groups living below the poverty level.
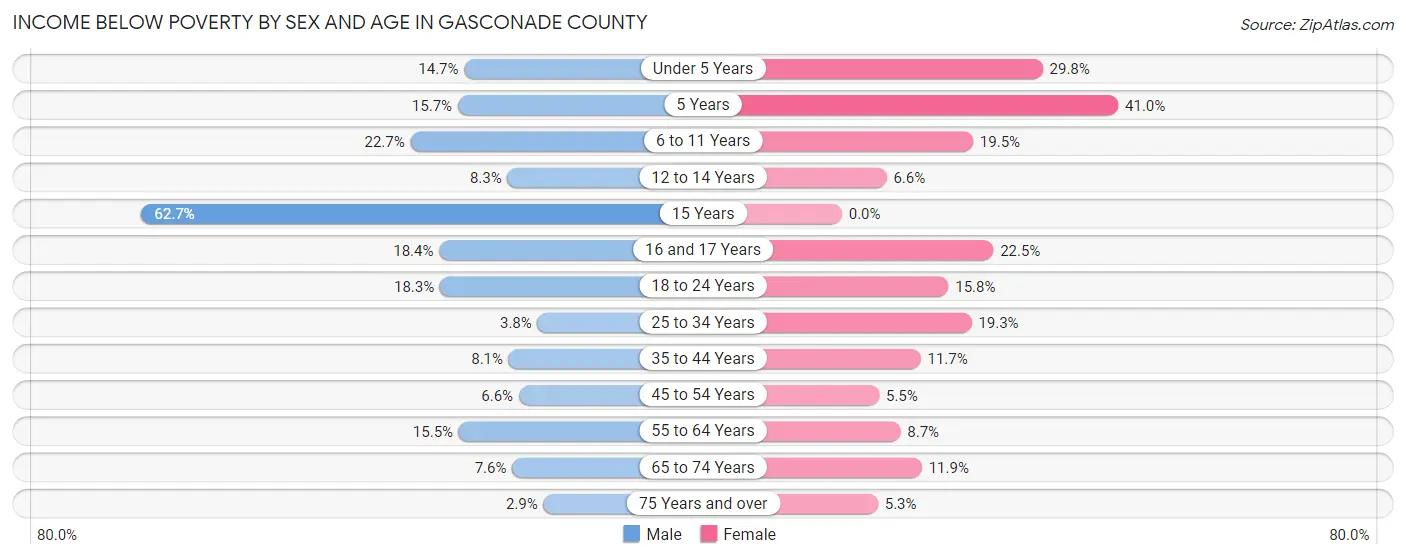
| Age Bracket | Male | Female |
| Under 5 Years | 61 (14.7%) | 99 (29.8%) |
| 5 Years | 13 (15.7%) | 32 (41.0%) |
| 6 to 11 Years | 98 (22.7%) | 102 (19.5%) |
| 12 to 14 Years | 30 (8.3%) | 11 (6.6%) |
| 15 Years | 52 (62.6%) | 0 (0.0%) |
| 16 and 17 Years | 42 (18.4%) | 29 (22.5%) |
| 18 to 24 Years | 104 (18.3%) | 77 (15.8%) |
| 25 to 34 Years | 30 (3.8%) | 153 (19.3%) |
| 35 to 44 Years | 62 (8.1%) | 88 (11.7%) |
| 45 to 54 Years | 60 (6.6%) | 50 (5.5%) |
| 55 to 64 Years | 195 (15.5%) | 100 (8.7%) |
| 65 to 74 Years | 71 (7.6%) | 108 (11.9%) |
| 75 Years and over | 17 (2.9%) | 38 (5.3%) |
| Total | 835 (11.3%) | 887 (12.6%) |
Income Above Poverty by Sex and Age in Gasconade County
According to the poverty statistics in Gasconade County, males aged 75 years and over and females aged 15 years are the age groups that are most secure financially, with 97.1% of males and 100.0% of females in these age groups living above the poverty line.
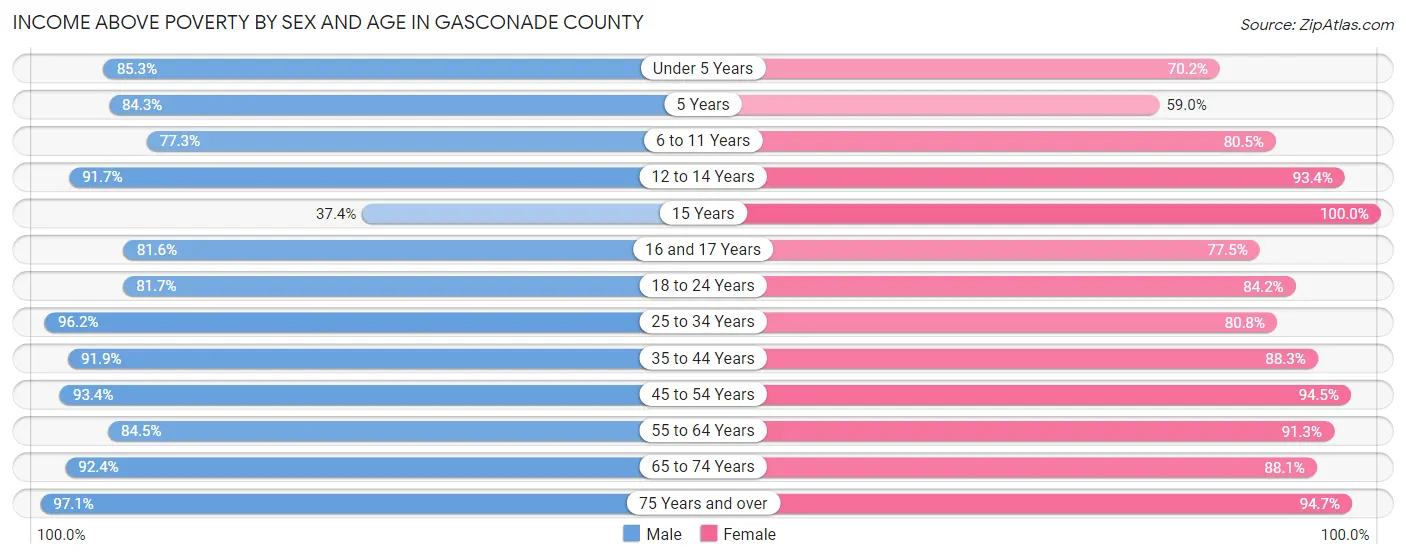
| Age Bracket | Male | Female |
| Under 5 Years | 354 (85.3%) | 233 (70.2%) |
| 5 Years | 70 (84.3%) | 46 (59.0%) |
| 6 to 11 Years | 334 (77.3%) | 422 (80.5%) |
| 12 to 14 Years | 332 (91.7%) | 155 (93.4%) |
| 15 Years | 31 (37.3%) | 127 (100.0%) |
| 16 and 17 Years | 186 (81.6%) | 100 (77.5%) |
| 18 to 24 Years | 464 (81.7%) | 410 (84.2%) |
| 25 to 34 Years | 756 (96.2%) | 642 (80.7%) |
| 35 to 44 Years | 704 (91.9%) | 665 (88.3%) |
| 45 to 54 Years | 850 (93.4%) | 854 (94.5%) |
| 55 to 64 Years | 1,062 (84.5%) | 1,051 (91.3%) |
| 65 to 74 Years | 866 (92.4%) | 802 (88.1%) |
| 75 Years and over | 561 (97.1%) | 674 (94.7%) |
| Total | 6,570 (88.7%) | 6,181 (87.5%) |
Income Below Poverty Among Married-Couple Families in Gasconade County
The poverty statistics for married-couple families in Gasconade County show that 4.0% or 129 of the total 3,214 families live below the poverty line. Families with 3 or 4 children have the highest poverty rate of 19.1%, comprising of 47 families. On the other hand, families with no children have the lowest poverty rate of 2.5%, which includes 50 families.
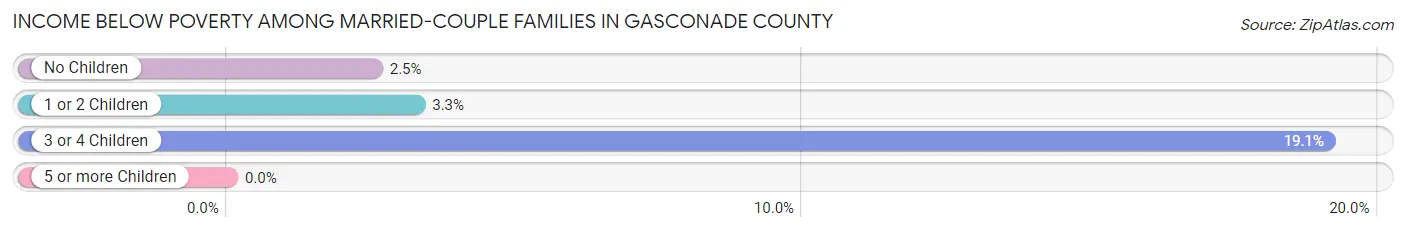
| Children | Above Poverty | Below Poverty |
| No Children | 1,936 (97.5%) | 50 (2.5%) |
| 1 or 2 Children | 950 (96.7%) | 32 (3.3%) |
| 3 or 4 Children | 199 (80.9%) | 47 (19.1%) |
| 5 or more Children | 0 (0.0%) | 0 (0.0%) |
| Total | 3,085 (96.0%) | 129 (4.0%) |
Income Below Poverty Among Single-Parent Households in Gasconade County
According to the poverty data in Gasconade County, 6.3% or 16 single-father households and 41.0% or 190 single-mother households are living below the poverty line. Among single-father households, those with 3 or 4 children have the highest poverty rate, with 13 households (72.2%) experiencing poverty. Likewise, among single-mother households, those with 5 or more children have the highest poverty rate, with 24 households (100.0%) falling below the poverty line.
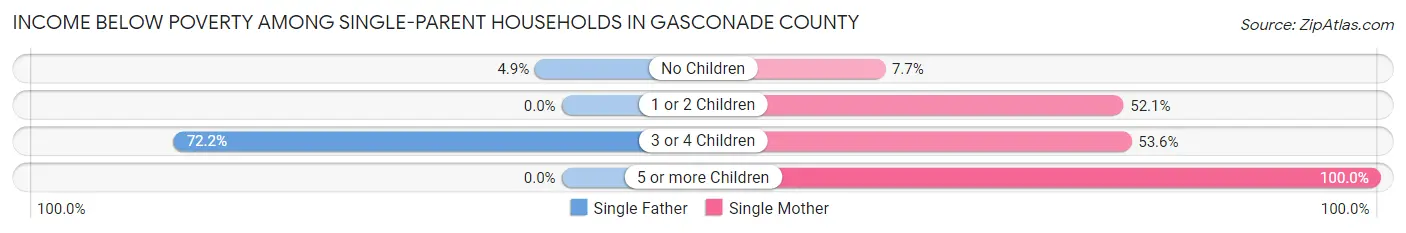
| Children | Single Father | Single Mother |
| No Children | 3 (4.9%) | 11 (7.7%) |
| 1 or 2 Children | 0 (0.0%) | 125 (52.1%) |
| 3 or 4 Children | 13 (72.2%) | 30 (53.6%) |
| 5 or more Children | 0 (0.0%) | 24 (100.0%) |
| Total | 16 (6.3%) | 190 (41.0%) |
Income Below Poverty Among Married-Couple vs Single-Parent Households in Gasconade County
The poverty data for Gasconade County shows that 129 of the married-couple family households (4.0%) and 206 of the single-parent households (28.8%) are living below the poverty level. Within the married-couple family households, those with 3 or 4 children have the highest poverty rate, with 47 households (19.1%) falling below the poverty line. Among the single-parent households, those with 5 or more children have the highest poverty rate, with 24 household (100.0%) living below poverty.
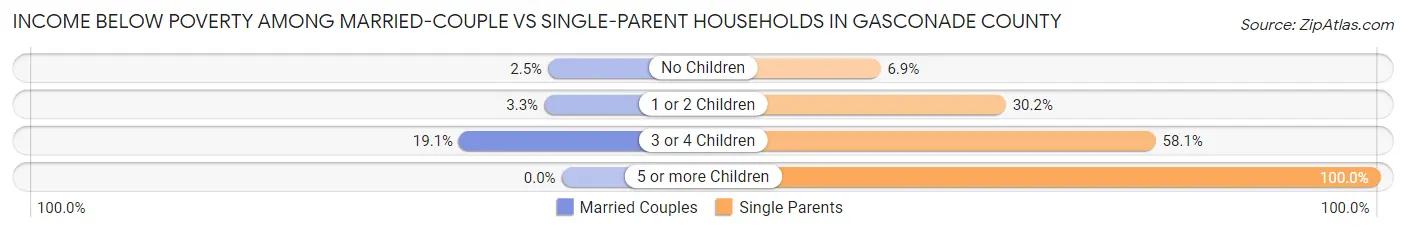
| Children | Married-Couple Families | Single-Parent Households |
| No Children | 50 (2.5%) | 14 (6.9%) |
| 1 or 2 Children | 32 (3.3%) | 125 (30.2%) |
| 3 or 4 Children | 47 (19.1%) | 43 (58.1%) |
| 5 or more Children | 0 (0.0%) | 24 (100.0%) |
| Total | 129 (4.0%) | 206 (28.8%) |
Race in Gasconade County
The most populous races in Gasconade County are White / Caucasian (14,042 | 94.9%), Two or more Races (511 | 3.5%), and Black / African American (129 | 0.9%).
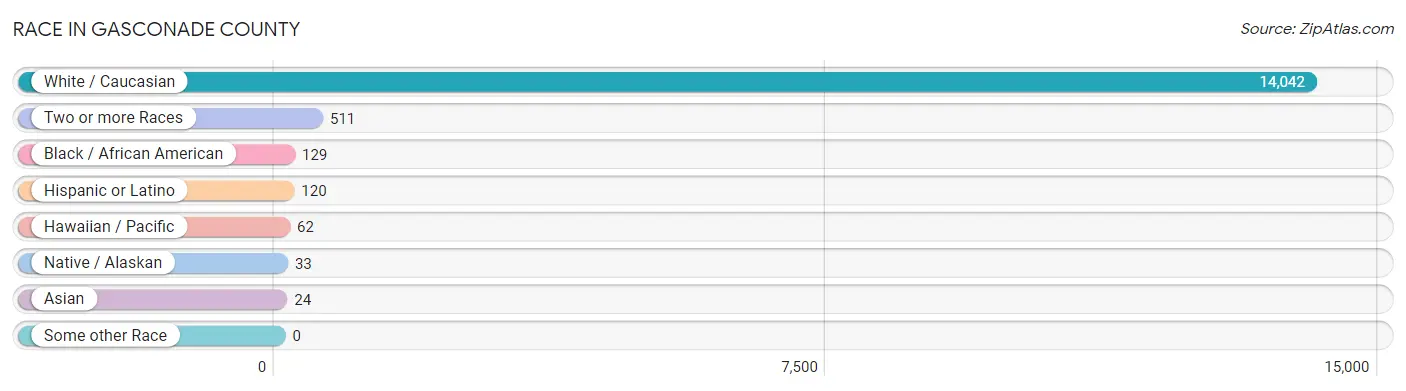
| Race | # Population | % Population |
| Asian | 24 | 0.2% |
| Black / African American | 129 | 0.9% |
| Hawaiian / Pacific | 62 | 0.4% |
| Hispanic or Latino | 120 | 0.8% |
| Native / Alaskan | 33 | 0.2% |
| White / Caucasian | 14,042 | 94.9% |
| Two or more Races | 511 | 3.5% |
| Some other Race | 0 | 0.0% |
| Total | 14,801 | 100.0% |
Ancestry in Gasconade County
The most populous ancestries reported in Gasconade County are German (5,100 | 34.5%), Irish (1,970 | 13.3%), American (1,542 | 10.4%), English (1,470 | 9.9%), and Polish (451 | 3.0%), together accounting for 71.2% of all Gasconade County residents.
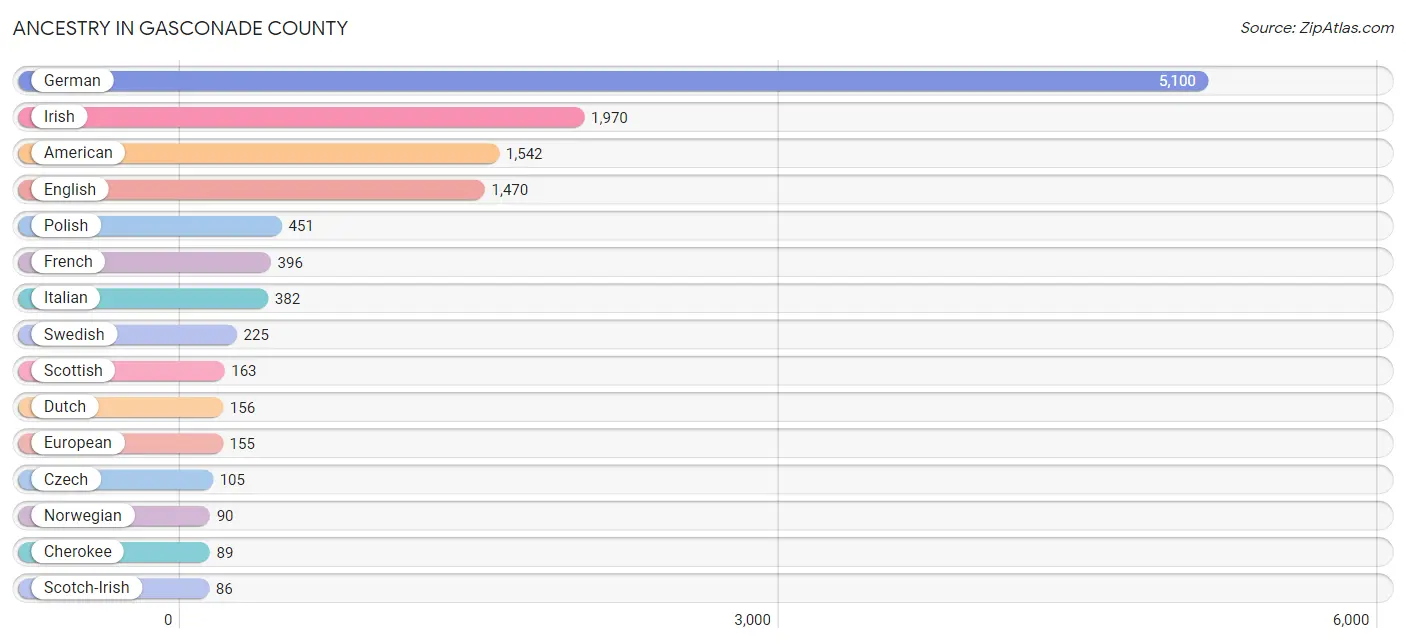
| Ancestry | # Population | % Population |
| African | 11 | 0.1% |
| Albanian | 11 | 0.1% |
| American | 1,542 | 10.4% |
| Armenian | 41 | 0.3% |
| Austrian | 14 | 0.1% |
| Belgian | 16 | 0.1% |
| Blackfeet | 13 | 0.1% |
| British | 7 | 0.1% |
| Cajun | 12 | 0.1% |
| Canadian | 8 | 0.1% |
| Celtic | 9 | 0.1% |
| Cherokee | 89 | 0.6% |
| Choctaw | 21 | 0.1% |
| Cuban | 14 | 0.1% |
| Czech | 105 | 0.7% |
| Danish | 9 | 0.1% |
| Dutch | 156 | 1.1% |
| English | 1,470 | 9.9% |
| European | 155 | 1.1% |
| Finnish | 5 | 0.0% |
| French | 396 | 2.7% |
| French Canadian | 17 | 0.1% |
| German | 5,100 | 34.5% |
| Haitian | 10 | 0.1% |
| Hungarian | 21 | 0.1% |
| Irish | 1,970 | 13.3% |
| Iroquois | 28 | 0.2% |
| Italian | 382 | 2.6% |
| Jamaican | 14 | 0.1% |
| Korean | 36 | 0.2% |
| Lithuanian | 21 | 0.1% |
| Menominee | 7 | 0.1% |
| Mexican | 27 | 0.2% |
| Native Hawaiian | 33 | 0.2% |
| Northern European | 19 | 0.1% |
| Norwegian | 90 | 0.6% |
| Polish | 451 | 3.0% |
| Portuguese | 15 | 0.1% |
| Romanian | 12 | 0.1% |
| Russian | 7 | 0.1% |
| Scandinavian | 26 | 0.2% |
| Scotch-Irish | 86 | 0.6% |
| Scottish | 163 | 1.1% |
| Slovak | 5 | 0.0% |
| Slovene | 11 | 0.1% |
| Spanish | 38 | 0.3% |
| Subsaharan African | 11 | 0.1% |
| Swedish | 225 | 1.5% |
| Swiss | 85 | 0.6% |
| Welsh | 64 | 0.4% |
| Yugoslavian | 8 | 0.1% | View All 51 Rows |
Immigrants in Gasconade County
The most numerous immigrant groups reported in Gasconade County came from Asia (33 | 0.2%), Europe (29 | 0.2%), Latin America (28 | 0.2%), Western Europe (20 | 0.1%), and Philippines (16 | 0.1%), together accounting for 0.9% of all Gasconade County residents.
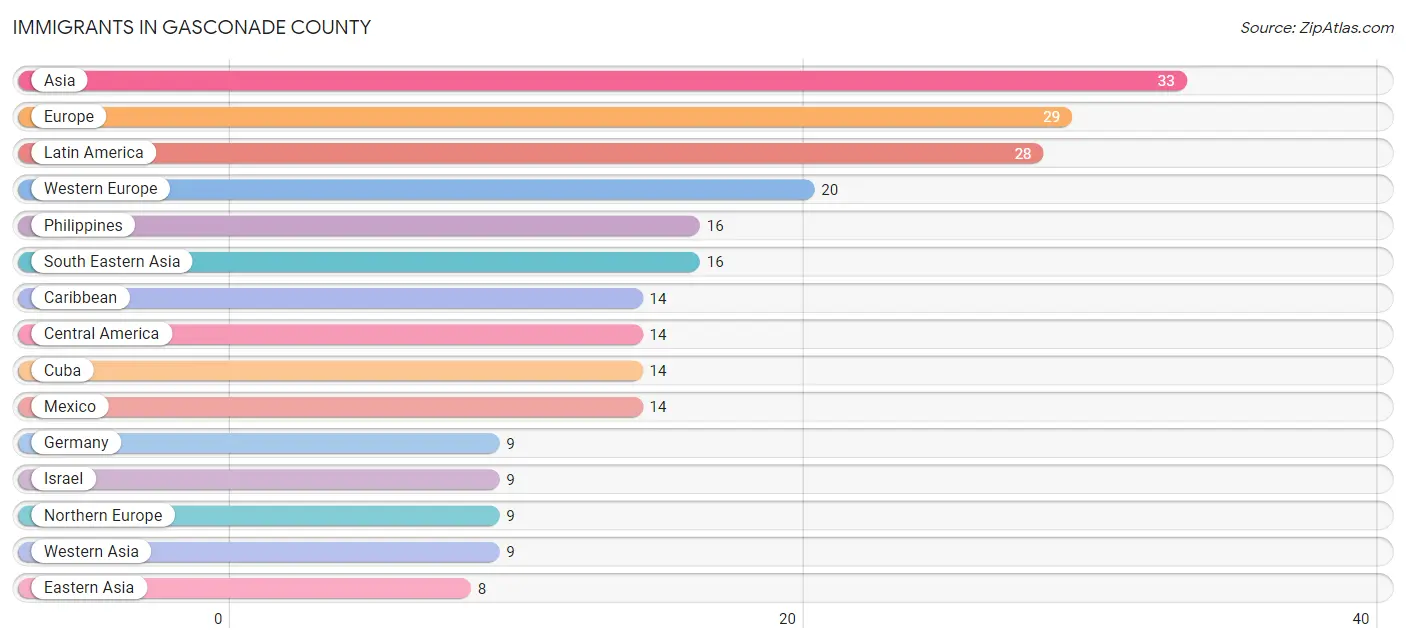
| Immigration Origin | # Population | % Population |
| Asia | 33 | 0.2% |
| Austria | 4 | 0.0% |
| Canada | 5 | 0.0% |
| Caribbean | 14 | 0.1% |
| Central America | 14 | 0.1% |
| Cuba | 14 | 0.1% |
| Eastern Asia | 8 | 0.1% |
| Europe | 29 | 0.2% |
| Germany | 9 | 0.1% |
| Israel | 9 | 0.1% |
| Korea | 8 | 0.1% |
| Latin America | 28 | 0.2% |
| Mexico | 14 | 0.1% |
| Netherlands | 7 | 0.1% |
| Northern Europe | 9 | 0.1% |
| Philippines | 16 | 0.1% |
| South Eastern Asia | 16 | 0.1% |
| Western Asia | 9 | 0.1% |
| Western Europe | 20 | 0.1% | View All 19 Rows |
Sex and Age in Gasconade County
Sex and Age in Gasconade County
The most populous age groups in Gasconade County are 55 to 59 Years (673 | 8.9%) for men and 55 to 59 Years (664 | 9.1%) for women.
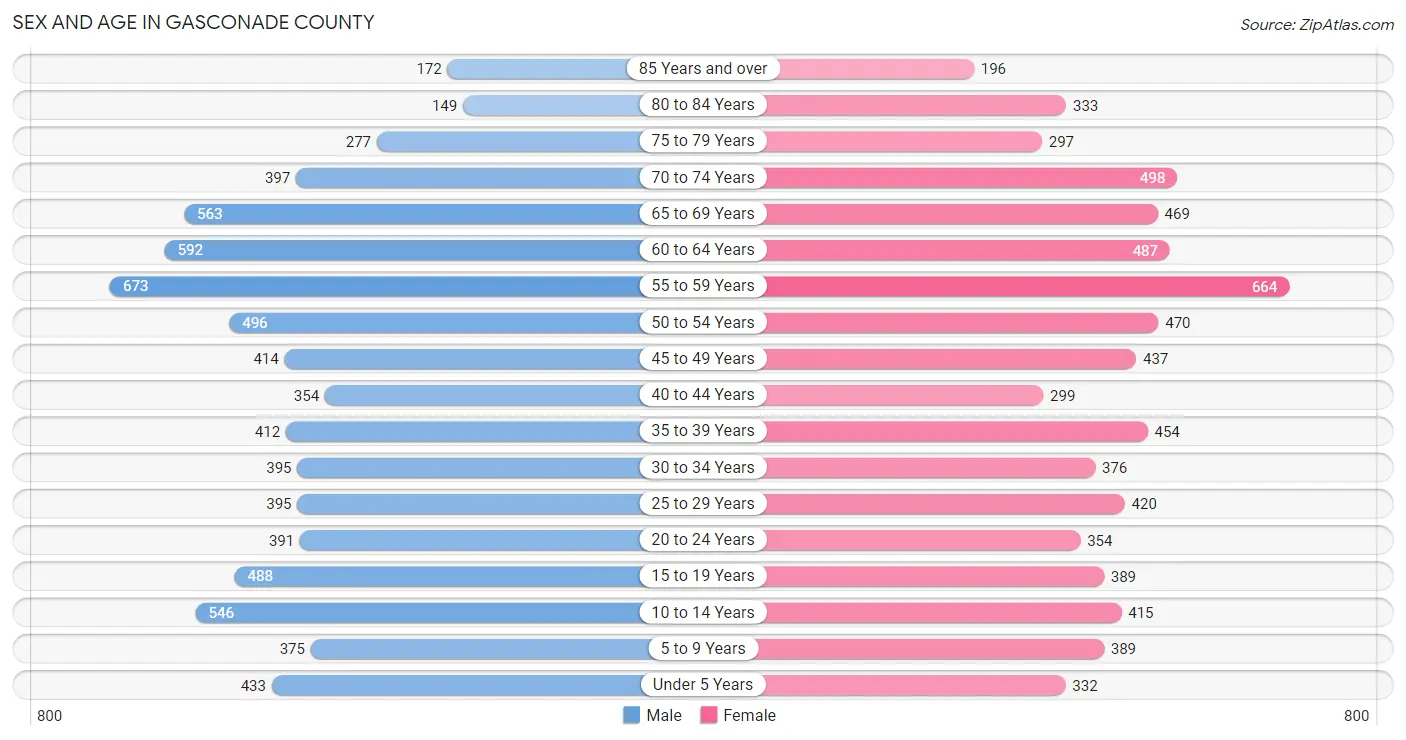
| Age Bracket | Male | Female |
| Under 5 Years | 433 (5.8%) | 332 (4.6%) |
| 5 to 9 Years | 375 (5.0%) | 389 (5.3%) |
| 10 to 14 Years | 546 (7.3%) | 415 (5.7%) |
| 15 to 19 Years | 488 (6.5%) | 389 (5.3%) |
| 20 to 24 Years | 391 (5.2%) | 354 (4.9%) |
| 25 to 29 Years | 395 (5.2%) | 420 (5.8%) |
| 30 to 34 Years | 395 (5.2%) | 376 (5.2%) |
| 35 to 39 Years | 412 (5.5%) | 454 (6.2%) |
| 40 to 44 Years | 354 (4.7%) | 299 (4.1%) |
| 45 to 49 Years | 414 (5.5%) | 437 (6.0%) |
| 50 to 54 Years | 496 (6.6%) | 470 (6.5%) |
| 55 to 59 Years | 673 (8.9%) | 664 (9.1%) |
| 60 to 64 Years | 592 (7.9%) | 487 (6.7%) |
| 65 to 69 Years | 563 (7.5%) | 469 (6.4%) |
| 70 to 74 Years | 397 (5.3%) | 498 (6.8%) |
| 75 to 79 Years | 277 (3.7%) | 297 (4.1%) |
| 80 to 84 Years | 149 (2.0%) | 333 (4.6%) |
| 85 Years and over | 172 (2.3%) | 196 (2.7%) |
| Total | 7,522 (100.0%) | 7,279 (100.0%) |
Families and Households in Gasconade County
Median Family Size in Gasconade County
The median family size in Gasconade County is 2.95 persons per family, with single male/father families (253 | 6.4%) accounting for the largest median family size of 3.12 persons per family. On the other hand, single female/mother families (463 | 11.8%) represent the smallest median family size with 2.89 persons per family.
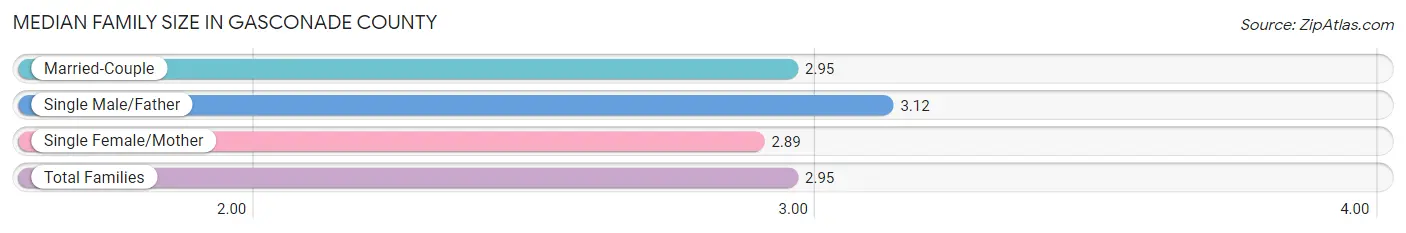
| Family Type | # Families | Family Size |
| Married-Couple | 3,214 (81.8%) | 2.95 |
| Single Male/Father | 253 (6.4%) | 3.12 |
| Single Female/Mother | 463 (11.8%) | 2.89 |
| Total Families | 3,930 (100.0%) | 2.95 |
Median Household Size in Gasconade County
The median household size in Gasconade County is 2.44 persons per household, with single male/father households (253 | 4.2%) accounting for the largest median household size of 3.55 persons per household. non-family households (2,040 | 34.2%) represent the smallest median household size with 1.23 persons per household.
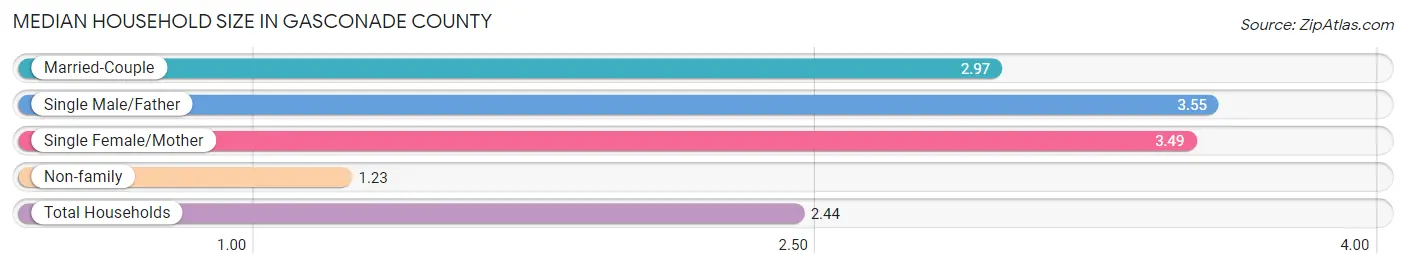
| Household Type | # Households | Household Size |
| Married-Couple | 3,214 (53.8%) | 2.97 |
| Single Male/Father | 253 (4.2%) | 3.55 |
| Single Female/Mother | 463 (7.8%) | 3.49 |
| Non-family | 2,040 (34.2%) | 1.23 |
| Total Households | 5,970 (100.0%) | 2.44 |
Household Size by Marriage Status in Gasconade County
Out of a total of 5,970 households in Gasconade County, 3,930 (65.8%) are family households, while 2,040 (34.2%) are nonfamily households. The most numerous type of family households are 2-person households, comprising 1,915, and the most common type of nonfamily households are 1-person households, comprising 1,691.
| Household Size | Family Households | Nonfamily Households |
| 1-Person Households | - | 1,691 (28.3%) |
| 2-Person Households | 1,915 (32.1%) | 325 (5.4%) |
| 3-Person Households | 891 (14.9%) | 24 (0.4%) |
| 4-Person Households | 622 (10.4%) | 0 (0.0%) |
| 5-Person Households | 310 (5.2%) | 0 (0.0%) |
| 6-Person Households | 111 (1.9%) | 0 (0.0%) |
| 7+ Person Households | 81 (1.4%) | 0 (0.0%) |
| Total | 3,930 (65.8%) | 2,040 (34.2%) |
Female Fertility in Gasconade County
Fertility by Age in Gasconade County
Average fertility rate in Gasconade County is 60.0 births per 1,000 women. Women in the age bracket of 20 to 34 years have the highest fertility rate with 118.0 births per 1,000 women. Women in the age bracket of 20 to 34 years acount for 79.5% of all women with births.
| Age Bracket | Women with Births | Births / 1,000 Women |
| 15 to 19 years | 0 (0.0%) | 0.0 |
| 20 to 34 years | 136 (79.5%) | 118.0 |
| 35 to 50 years | 35 (20.5%) | 26.0 |
| Total | 171 (100.0%) | 60.0 |
Fertility by Age by Marriage Status in Gasconade County
82.5% of women with births (171) in Gasconade County are married. The highest percentage of unmarried women with births falls into 35 to 50 years age bracket with 85.7% of them unmarried at the time of birth, while the lowest percentage of unmarried women with births belong to 20 to 34 years age bracket with 0.0% of them unmarried.
| Age Bracket | Married | Unmarried |
| 15 to 19 years | 0 (0.0%) | 0 (0.0%) |
| 20 to 34 years | 136 (100.0%) | 0 (0.0%) |
| 35 to 50 years | 5 (14.3%) | 30 (85.7%) |
| Total | 141 (82.5%) | 30 (17.5%) |
Fertility by Education in Gasconade County
| Educational Attainment | Women with Births | Births / 1,000 Women |
| Less than High School | 5 (2.9%) | 10.0 |
| High School Diploma | 56 (32.8%) | 82.0 |
| College or Associate's Degree | 52 (30.4%) | 50.0 |
| Bachelor's Degree | 58 (33.9%) | 131.0 |
| Graduate Degree | 0 (0.0%) | 0.0 |
| Total | 171 (100.0%) | 60.0 |
Fertility by Education by Marriage Status in Gasconade County
17.5% of women with births in Gasconade County are unmarried. Women with the educational attainment of less than high school are most likely to be married with 100.0% of them married at childbirth, while women with the educational attainment of high school diploma are least likely to be married with 44.6% of them unmarried at childbirth.
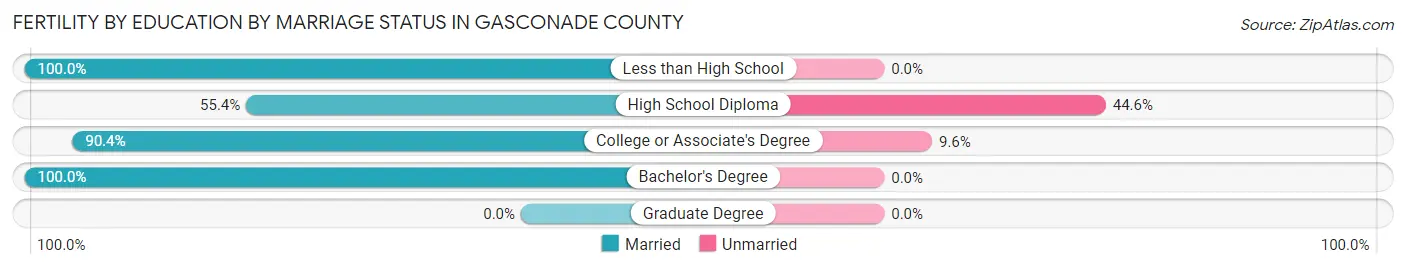
| Educational Attainment | Married | Unmarried |
| Less than High School | 5 (100.0%) | 0 (0.0%) |
| High School Diploma | 31 (55.4%) | 25 (44.6%) |
| College or Associate's Degree | 47 (90.4%) | 5 (9.6%) |
| Bachelor's Degree | 58 (100.0%) | 0 (0.0%) |
| Graduate Degree | 0 (0.0%) | 0 (0.0%) |
| Total | 141 (82.5%) | 30 (17.5%) |
Employment Characteristics in Gasconade County
Employment by Class of Employer in Gasconade County
Among the 6,988 employed individuals in Gasconade County, private company employees (4,560 | 65.2%), not-for-profit organizations (684 | 9.8%), and self-employed (not incorporated) (570 | 8.2%) make up the most common classes of employment.
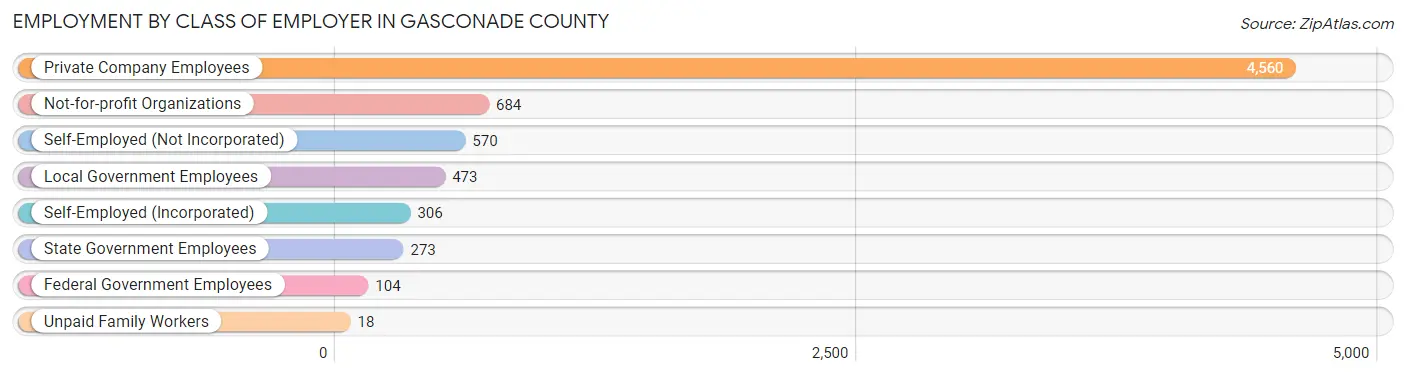
| Employer Class | # Employees | % Employees |
| Private Company Employees | 4,560 | 65.2% |
| Self-Employed (Incorporated) | 306 | 4.4% |
| Self-Employed (Not Incorporated) | 570 | 8.2% |
| Not-for-profit Organizations | 684 | 9.8% |
| Local Government Employees | 473 | 6.8% |
| State Government Employees | 273 | 3.9% |
| Federal Government Employees | 104 | 1.5% |
| Unpaid Family Workers | 18 | 0.3% |
| Total | 6,988 | 100.0% |
Employment Status by Age in Gasconade County
According to the labor force statistics for Gasconade County, out of the total population over 16 years of age (12,101), 60.6% or 7,333 individuals are in the labor force, with 2.1% or 154 of them unemployed. The age group with the highest labor force participation rate is 35 to 44 years, with 87.8% or 1,334 individuals in the labor force. Within the labor force, the 16 to 19 years age range has the highest percentage of unemployed individuals, with 11.9% or 41 of them being unemployed.
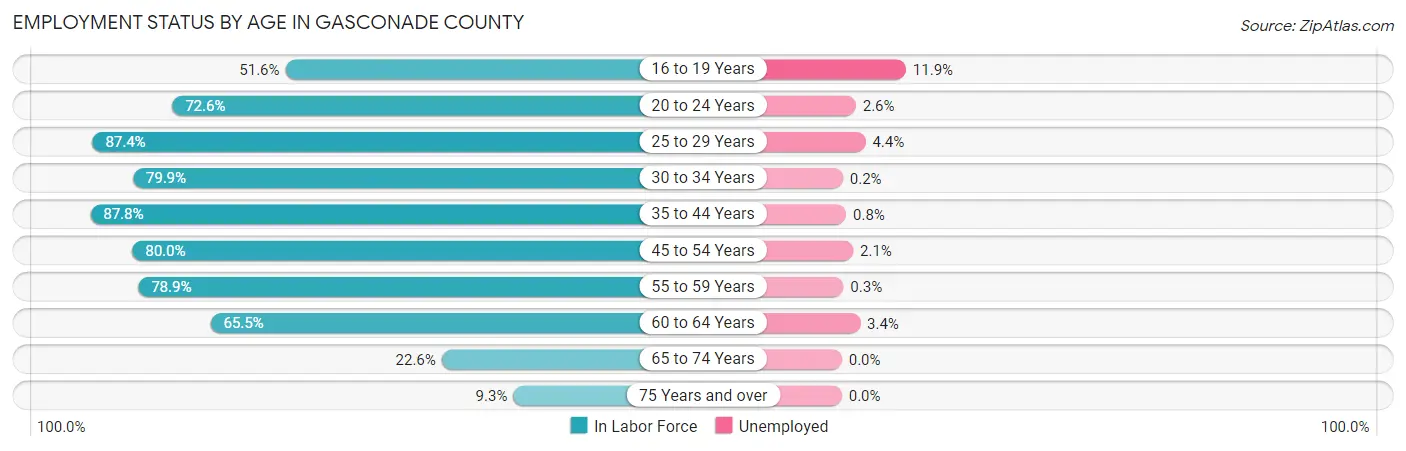
| Age Bracket | In Labor Force | Unemployed |
| 16 to 19 Years | 344 (51.6%) | 41 (11.9%) |
| 20 to 24 Years | 541 (72.6%) | 14 (2.6%) |
| 25 to 29 Years | 712 (87.4%) | 31 (4.4%) |
| 30 to 34 Years | 616 (79.9%) | 1 (0.2%) |
| 35 to 44 Years | 1,334 (87.8%) | 11 (0.8%) |
| 45 to 54 Years | 1,454 (80.0%) | 31 (2.1%) |
| 55 to 59 Years | 1,055 (78.9%) | 3 (0.3%) |
| 60 to 64 Years | 707 (65.5%) | 24 (3.4%) |
| 65 to 74 Years | 436 (22.6%) | 0 (0.0%) |
| 75 Years and over | 132 (9.3%) | 0 (0.0%) |
| Total | 7,333 (60.6%) | 154 (2.1%) |
Employment Status by Educational Attainment in Gasconade County
According to labor force statistics for Gasconade County, 80.1% of individuals (5,878) out of the total population between 25 and 64 years of age (7,338) are in the labor force, with 1.7% or 100 of them being unemployed. The group with the highest labor force participation rate are those with the educational attainment of bachelor's degree or higher, with 91.8% or 1,253 individuals in the labor force. Within the labor force, individuals with high school diploma education have the highest percentage of unemployment, with 1.8% or 39 of them being unemployed.
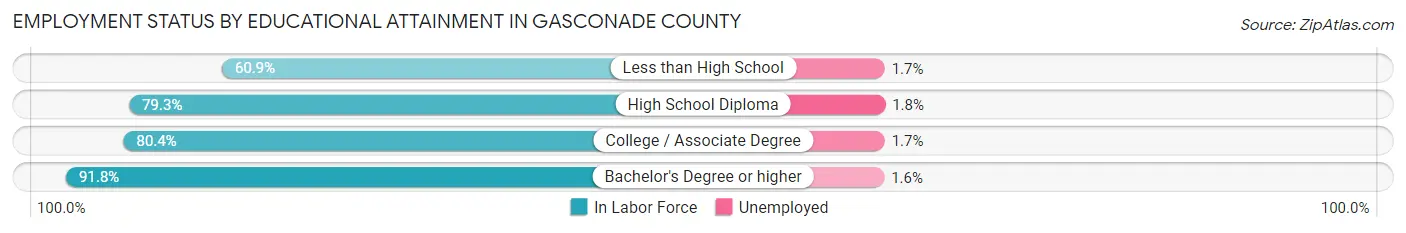
| Educational Attainment | In Labor Force | Unemployed |
| Less than High School | 465 (60.9%) | 13 (1.7%) |
| High School Diploma | 2,152 (79.3%) | 49 (1.8%) |
| College / Associate Degree | 2,007 (80.4%) | 42 (1.7%) |
| Bachelor's Degree or higher | 1,253 (91.8%) | 22 (1.6%) |
| Total | 5,878 (80.1%) | 125 (1.7%) |
Employment Occupations by Sex in Gasconade County
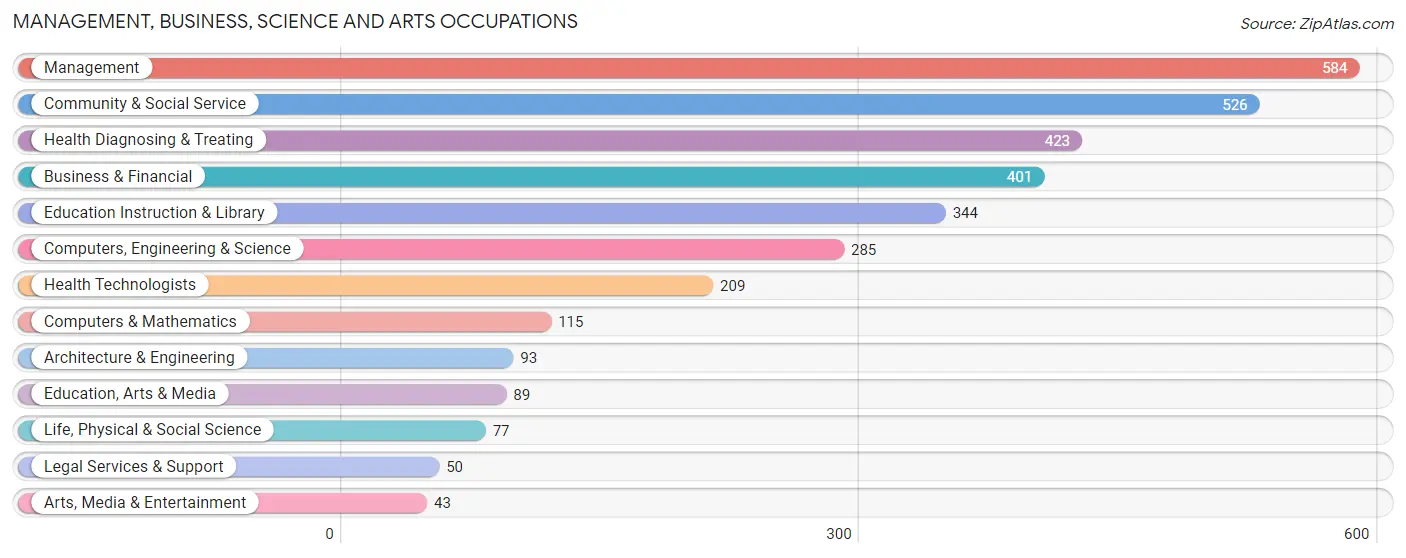
Management, Business, Science and Arts Occupations
The most common Management, Business, Science and Arts occupations in Gasconade County are Management (584 | 8.1%), Community & Social Service (526 | 7.3%), Health Diagnosing & Treating (423 | 5.9%), Business & Financial (401 | 5.6%), and Education Instruction & Library (344 | 4.8%).
Management, Business, Science and Arts Occupations by Sex
Within the Management, Business, Science and Arts occupations in Gasconade County, the most male-oriented occupations are Management (69.9%), Architecture & Engineering (64.5%), and Life, Physical & Social Science (63.6%), while the most female-oriented occupations are Health Diagnosing & Treating (88.2%), Education, Arts & Media (87.6%), and Arts, Media & Entertainment (86.1%).
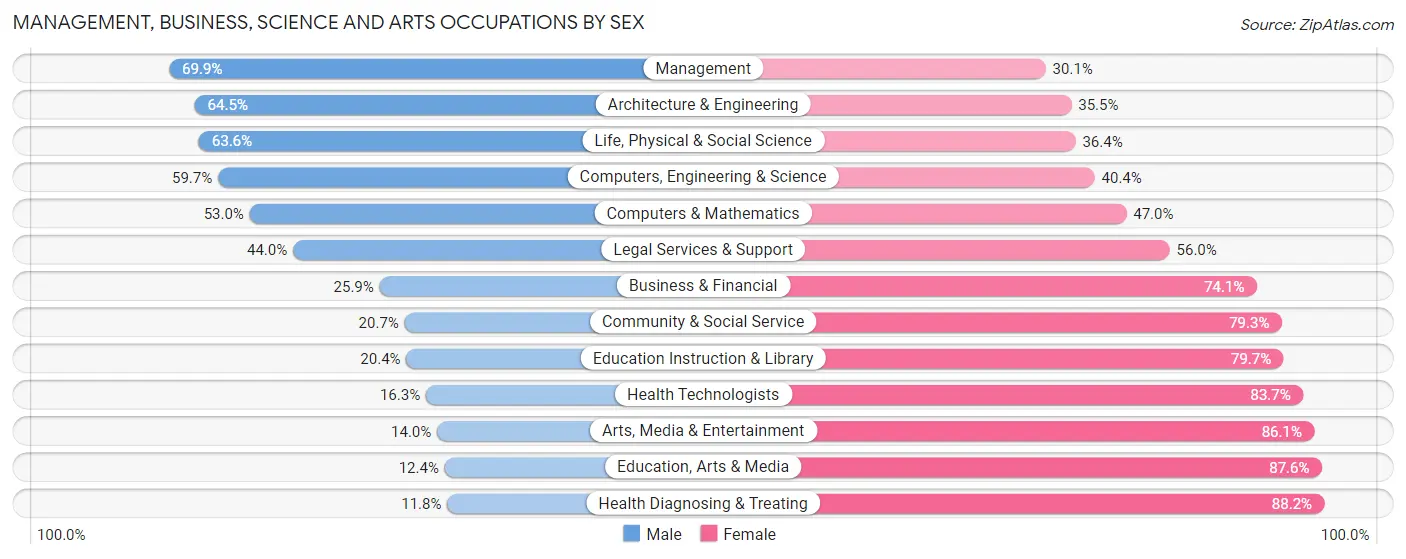
| Occupation | Male | Female |
| Management | 408 (69.9%) | 176 (30.1%) |
| Business & Financial | 104 (25.9%) | 297 (74.1%) |
| Computers, Engineering & Science | 170 (59.7%) | 115 (40.4%) |
| Computers & Mathematics | 61 (53.0%) | 54 (47.0%) |
| Architecture & Engineering | 60 (64.5%) | 33 (35.5%) |
| Life, Physical & Social Science | 49 (63.6%) | 28 (36.4%) |
| Community & Social Service | 109 (20.7%) | 417 (79.3%) |
| Education, Arts & Media | 11 (12.4%) | 78 (87.6%) |
| Legal Services & Support | 22 (44.0%) | 28 (56.0%) |
| Education Instruction & Library | 70 (20.3%) | 274 (79.6%) |
| Arts, Media & Entertainment | 6 (14.0%) | 37 (86.1%) |
| Health Diagnosing & Treating | 50 (11.8%) | 373 (88.2%) |
| Health Technologists | 34 (16.3%) | 175 (83.7%) |
| Total (Category) | 841 (37.9%) | 1,378 (62.1%) |
| Total (Overall) | 3,911 (54.5%) | 3,264 (45.5%) |
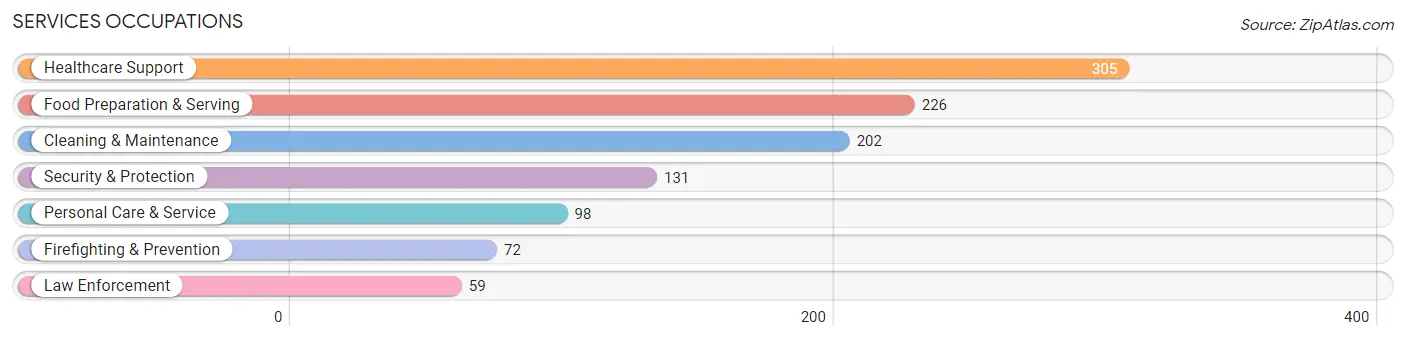
Services Occupations
The most common Services occupations in Gasconade County are Healthcare Support (305 | 4.3%), Food Preparation & Serving (226 | 3.2%), Cleaning & Maintenance (202 | 2.8%), Security & Protection (131 | 1.8%), and Personal Care & Service (98 | 1.4%).
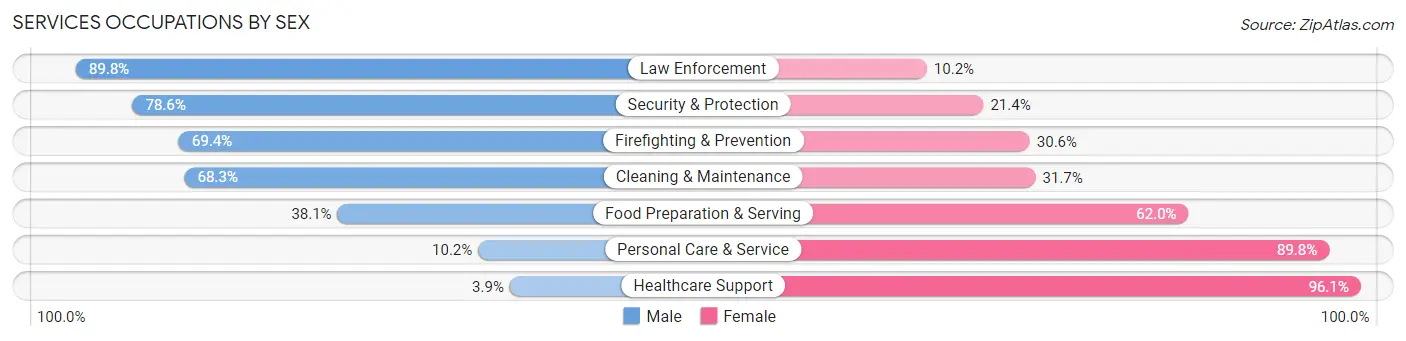
Services Occupations by Sex
Within the Services occupations in Gasconade County, the most male-oriented occupations are Law Enforcement (89.8%), Security & Protection (78.6%), and Firefighting & Prevention (69.4%), while the most female-oriented occupations are Healthcare Support (96.1%), Personal Care & Service (89.8%), and Food Preparation & Serving (62.0%).
| Occupation | Male | Female |
| Healthcare Support | 12 (3.9%) | 293 (96.1%) |
| Security & Protection | 103 (78.6%) | 28 (21.4%) |
| Firefighting & Prevention | 50 (69.4%) | 22 (30.6%) |
| Law Enforcement | 53 (89.8%) | 6 (10.2%) |
| Food Preparation & Serving | 86 (38.1%) | 140 (62.0%) |
| Cleaning & Maintenance | 138 (68.3%) | 64 (31.7%) |
| Personal Care & Service | 10 (10.2%) | 88 (89.8%) |
| Total (Category) | 349 (36.3%) | 613 (63.7%) |
| Total (Overall) | 3,911 (54.5%) | 3,264 (45.5%) |
Sales and Office Occupations
The most common Sales and Office occupations in Gasconade County are Office & Administration (639 | 8.9%), and Sales & Related (590 | 8.2%).

Sales and Office Occupations by Sex

| Occupation | Male | Female |
| Sales & Related | 344 (58.3%) | 246 (41.7%) |
| Office & Administration | 131 (20.5%) | 508 (79.5%) |
| Total (Category) | 475 (38.7%) | 754 (61.4%) |
| Total (Overall) | 3,911 (54.5%) | 3,264 (45.5%) |
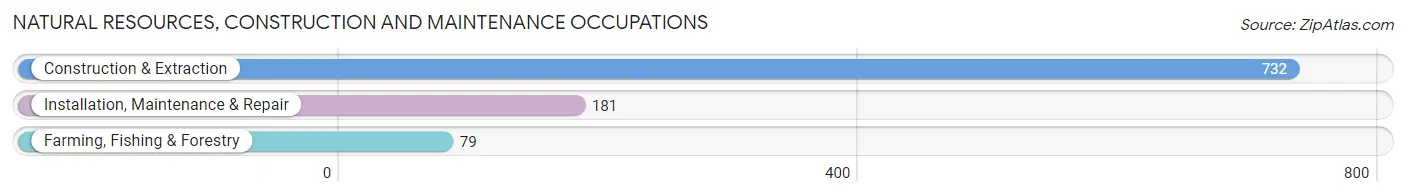
Natural Resources, Construction and Maintenance Occupations
The most common Natural Resources, Construction and Maintenance occupations in Gasconade County are Construction & Extraction (732 | 10.2%), Installation, Maintenance & Repair (181 | 2.5%), and Farming, Fishing & Forestry (79 | 1.1%).
Natural Resources, Construction and Maintenance Occupations by Sex
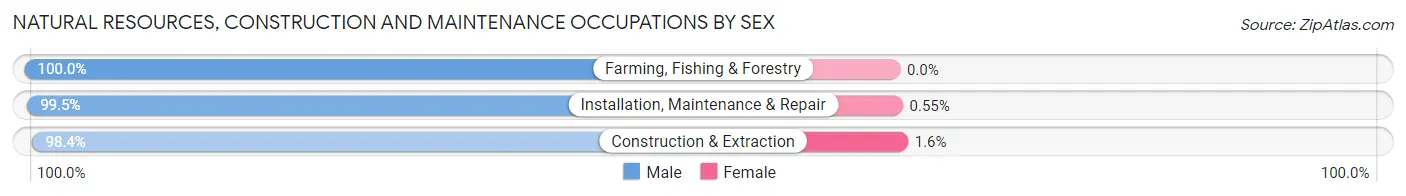
| Occupation | Male | Female |
| Farming, Fishing & Forestry | 79 (100.0%) | 0 (0.0%) |
| Construction & Extraction | 720 (98.4%) | 12 (1.6%) |
| Installation, Maintenance & Repair | 180 (99.5%) | 1 (0.5%) |
| Total (Category) | 979 (98.7%) | 13 (1.3%) |
| Total (Overall) | 3,911 (54.5%) | 3,264 (45.5%) |
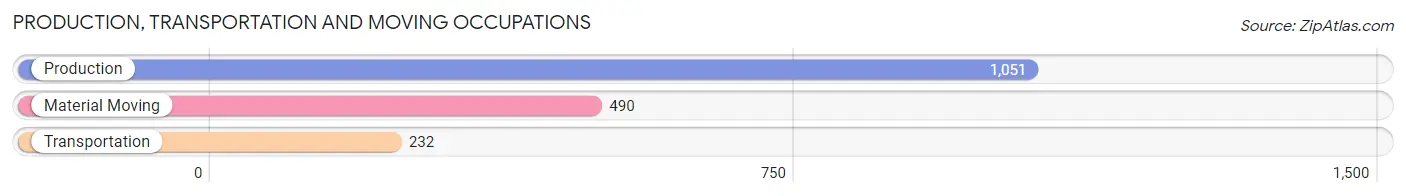
Production, Transportation and Moving Occupations
The most common Production, Transportation and Moving occupations in Gasconade County are Production (1,051 | 14.6%), Material Moving (490 | 6.8%), and Transportation (232 | 3.2%).
Production, Transportation and Moving Occupations by Sex
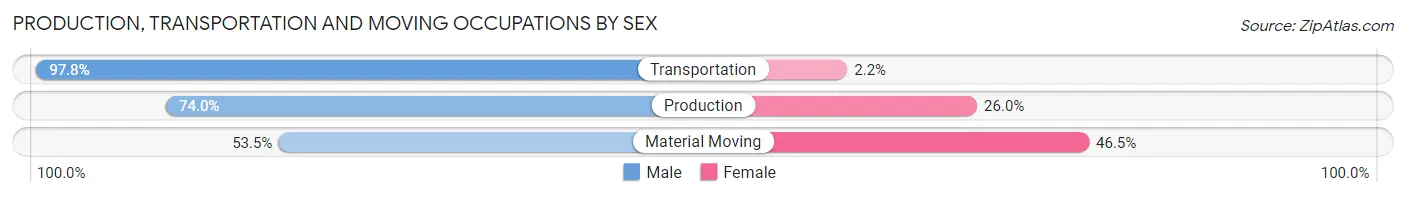
| Occupation | Male | Female |
| Production | 778 (74.0%) | 273 (26.0%) |
| Transportation | 227 (97.8%) | 5 (2.2%) |
| Material Moving | 262 (53.5%) | 228 (46.5%) |
| Total (Category) | 1,267 (71.5%) | 506 (28.5%) |
| Total (Overall) | 3,911 (54.5%) | 3,264 (45.5%) |
Employment Industries by Sex in Gasconade County
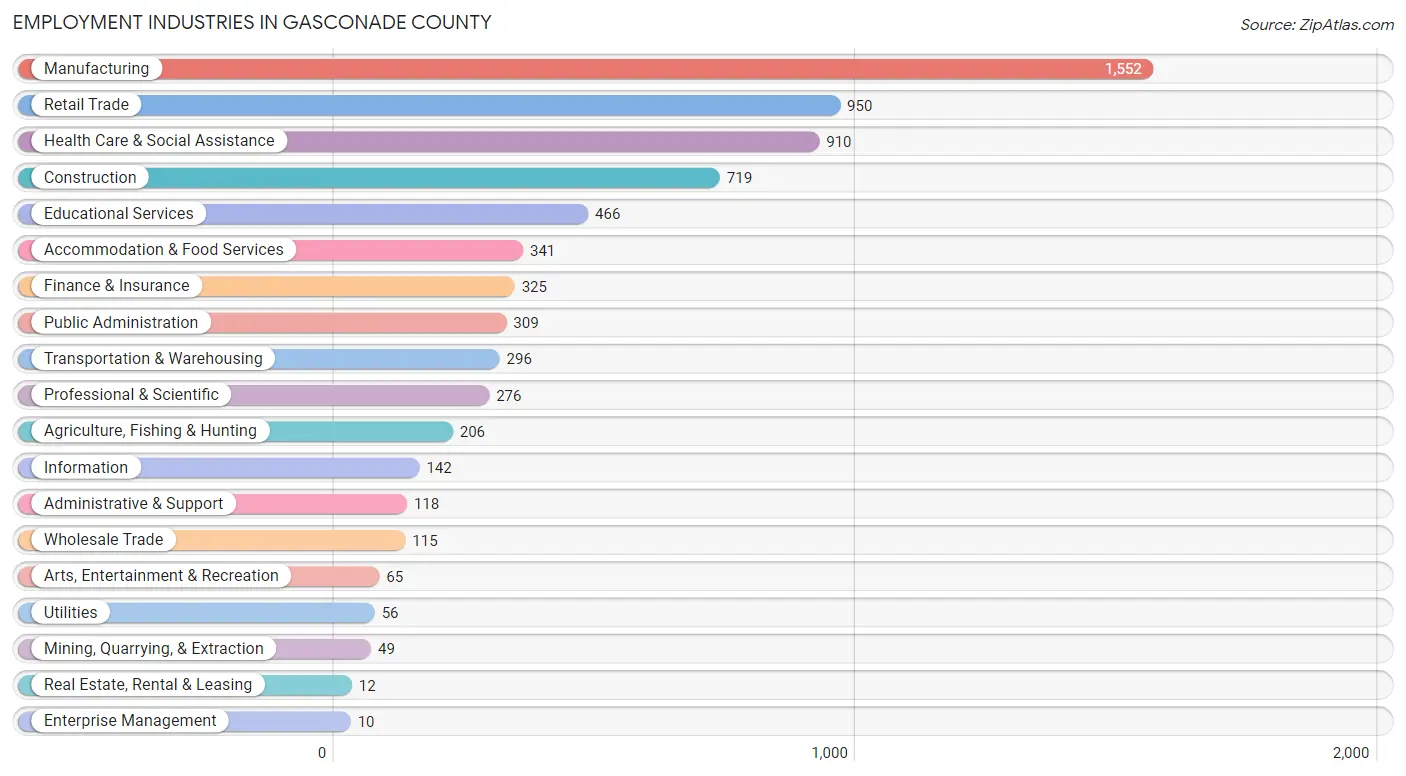
Employment Industries in Gasconade County
The major employment industries in Gasconade County include Manufacturing (1,552 | 21.6%), Retail Trade (950 | 13.2%), Health Care & Social Assistance (910 | 12.7%), Construction (719 | 10.0%), and Educational Services (466 | 6.5%).
Employment Industries by Sex in Gasconade County
The Gasconade County industries that see more men than women are Construction (98.2%), Wholesale Trade (93.9%), and Agriculture, Fishing & Hunting (91.7%), whereas the industries that tend to have a higher number of women are Health Care & Social Assistance (86.8%), Educational Services (78.5%), and Finance & Insurance (73.9%).
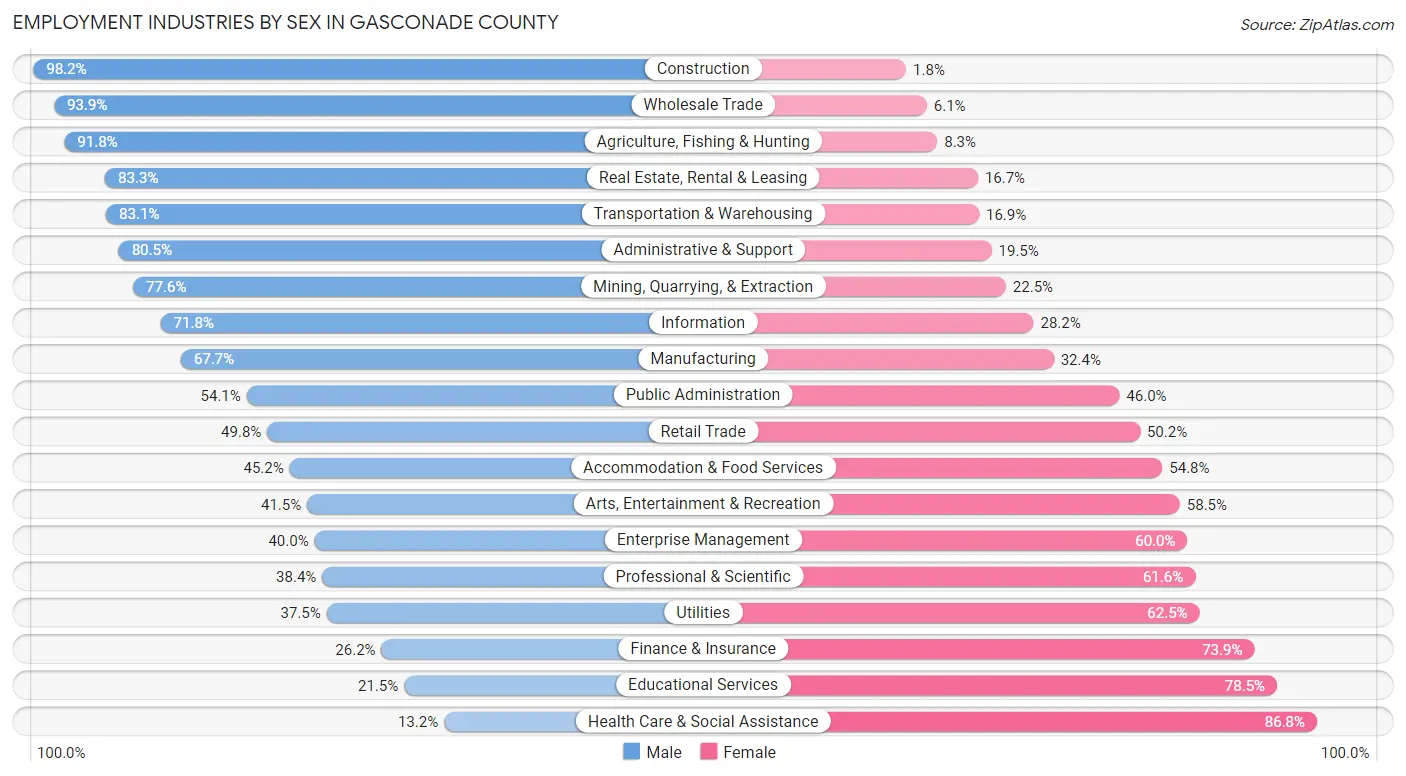
| Industry | Male | Female |
| Agriculture, Fishing & Hunting | 189 (91.7%) | 17 (8.3%) |
| Mining, Quarrying, & Extraction | 38 (77.5%) | 11 (22.5%) |
| Construction | 706 (98.2%) | 13 (1.8%) |
| Manufacturing | 1,050 (67.6%) | 502 (32.4%) |
| Wholesale Trade | 108 (93.9%) | 7 (6.1%) |
| Retail Trade | 473 (49.8%) | 477 (50.2%) |
| Transportation & Warehousing | 246 (83.1%) | 50 (16.9%) |
| Utilities | 21 (37.5%) | 35 (62.5%) |
| Information | 102 (71.8%) | 40 (28.2%) |
| Finance & Insurance | 85 (26.2%) | 240 (73.9%) |
| Real Estate, Rental & Leasing | 10 (83.3%) | 2 (16.7%) |
| Professional & Scientific | 106 (38.4%) | 170 (61.6%) |
| Enterprise Management | 4 (40.0%) | 6 (60.0%) |
| Administrative & Support | 95 (80.5%) | 23 (19.5%) |
| Educational Services | 100 (21.5%) | 366 (78.5%) |
| Health Care & Social Assistance | 120 (13.2%) | 790 (86.8%) |
| Arts, Entertainment & Recreation | 27 (41.5%) | 38 (58.5%) |
| Accommodation & Food Services | 154 (45.2%) | 187 (54.8%) |
| Public Administration | 167 (54.0%) | 142 (46.0%) |
| Total | 3,911 (54.5%) | 3,264 (45.5%) |
Education in Gasconade County
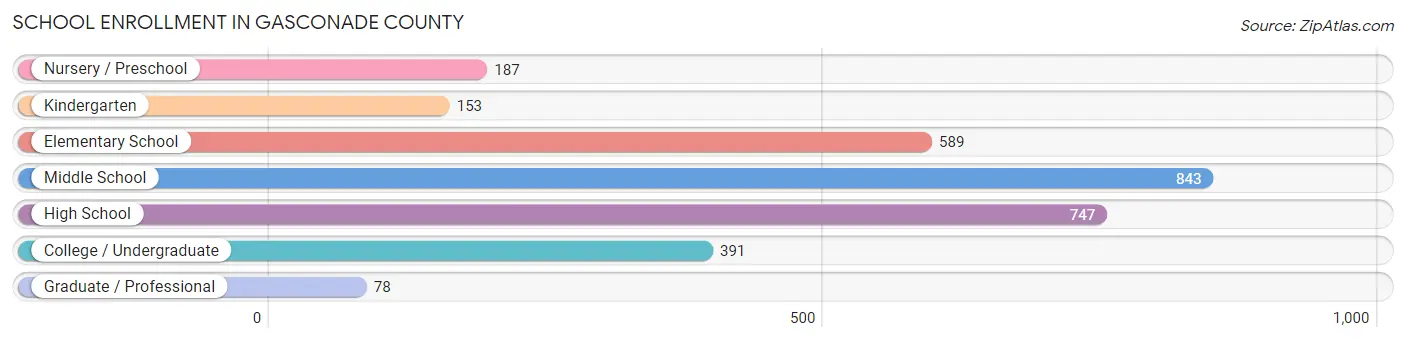
School Enrollment in Gasconade County
The most common levels of schooling among the 2,988 students in Gasconade County are middle school (843 | 28.2%), high school (747 | 25.0%), and elementary school (589 | 19.7%).
| School Level | # Students | % Students |
| Nursery / Preschool | 187 | 6.3% |
| Kindergarten | 153 | 5.1% |
| Elementary School | 589 | 19.7% |
| Middle School | 843 | 28.2% |
| High School | 747 | 25.0% |
| College / Undergraduate | 391 | 13.1% |
| Graduate / Professional | 78 | 2.6% |
| Total | 2,988 | 100.0% |
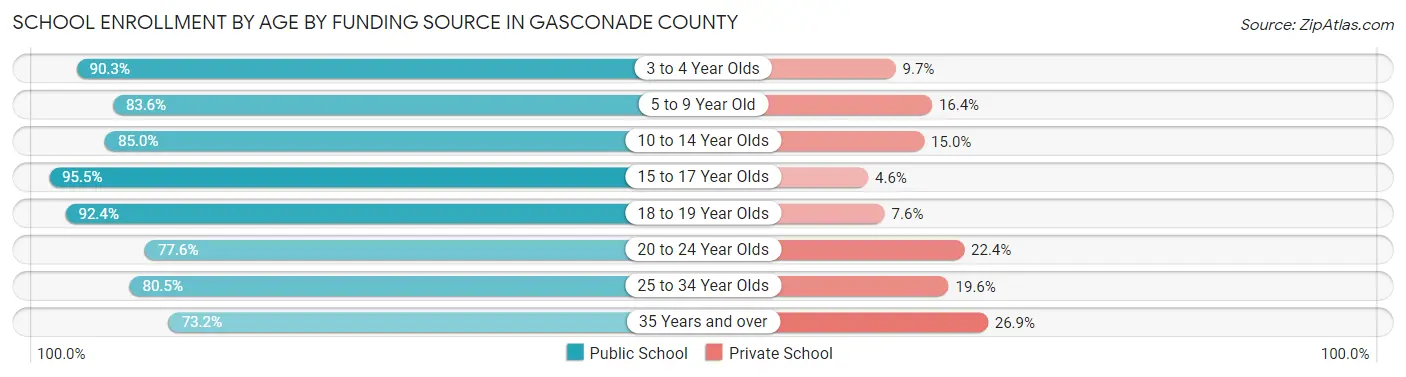
School Enrollment by Age by Funding Source in Gasconade County
Out of a total of 2,988 students who are enrolled in schools in Gasconade County, 409 (13.7%) attend a private institution, while the remaining 2,579 (86.3%) are enrolled in public schools. The age group of 35 years and over has the highest likelihood of being enrolled in private schools, with 40 (26.9% in the age bracket) enrolled. Conversely, the age group of 15 to 17 year olds has the lowest likelihood of being enrolled in a private school, with 524 (95.5% in the age bracket) attending a public institution.
| Age Bracket | Public School | Private School |
| 3 to 4 Year Olds | 112 (90.3%) | 12 (9.7%) |
| 5 to 9 Year Old | 610 (83.6%) | 120 (16.4%) |
| 10 to 14 Year Olds | 805 (85.0%) | 142 (15.0%) |
| 15 to 17 Year Olds | 524 (95.5%) | 25 (4.5%) |
| 18 to 19 Year Olds | 230 (92.4%) | 19 (7.6%) |
| 20 to 24 Year Olds | 83 (77.6%) | 24 (22.4%) |
| 25 to 34 Year Olds | 107 (80.4%) | 26 (19.6%) |
| 35 Years and over | 109 (73.2%) | 40 (26.9%) |
| Total | 2,579 (86.3%) | 409 (13.7%) |
Educational Attainment by Field of Study in Gasconade County
Education (435 | 18.5%), business (320 | 13.6%), bio, nature & agricultural (219 | 9.3%), science & technology (205 | 8.7%), and literature & languages (197 | 8.4%) are the most common fields of study among 2,352 individuals in Gasconade County who have obtained a bachelor's degree or higher.
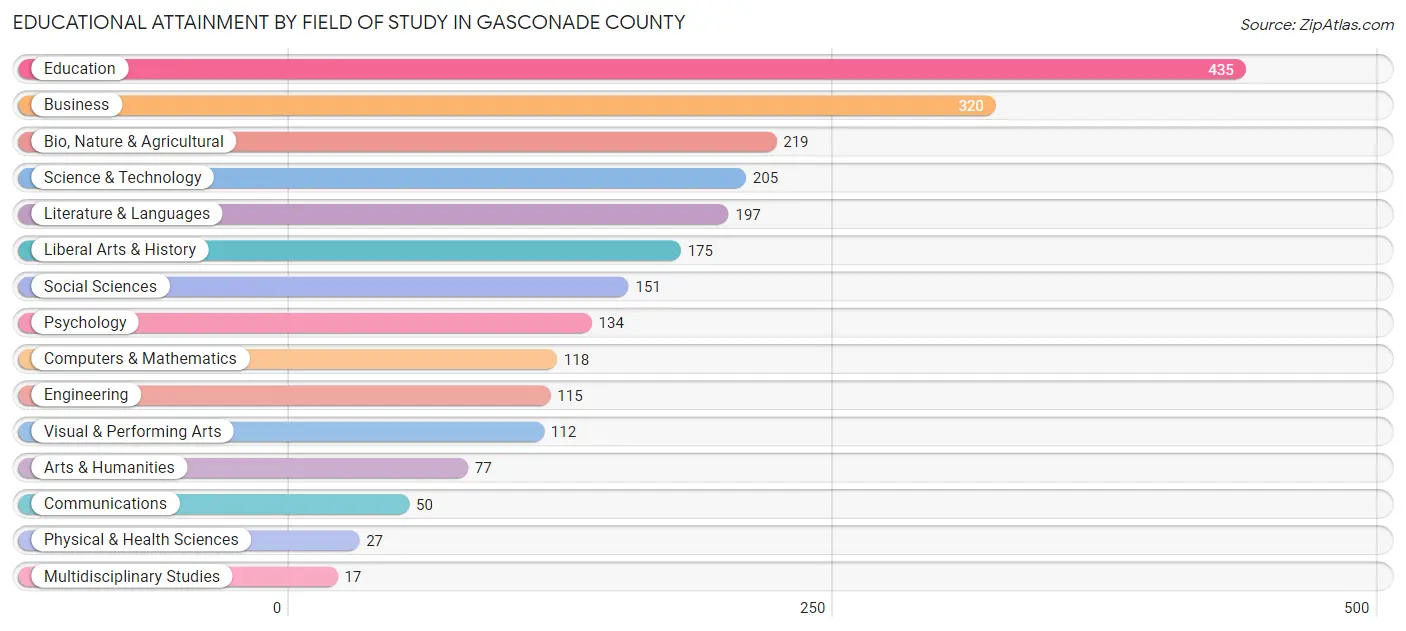
| Field of Study | # Graduates | % Graduates |
| Computers & Mathematics | 118 | 5.0% |
| Bio, Nature & Agricultural | 219 | 9.3% |
| Physical & Health Sciences | 27 | 1.1% |
| Psychology | 134 | 5.7% |
| Social Sciences | 151 | 6.4% |
| Engineering | 115 | 4.9% |
| Multidisciplinary Studies | 17 | 0.7% |
| Science & Technology | 205 | 8.7% |
| Business | 320 | 13.6% |
| Education | 435 | 18.5% |
| Literature & Languages | 197 | 8.4% |
| Liberal Arts & History | 175 | 7.4% |
| Visual & Performing Arts | 112 | 4.8% |
| Communications | 50 | 2.1% |
| Arts & Humanities | 77 | 3.3% |
| Total | 2,352 | 100.0% |
Transportation & Commute in Gasconade County
Vehicle Availability by Sex in Gasconade County
The most prevalent vehicle ownership categories in Gasconade County are males with 2 vehicles (1,154, accounting for 30.6%) and females with 2 vehicles (1,052, making up 36.0%).
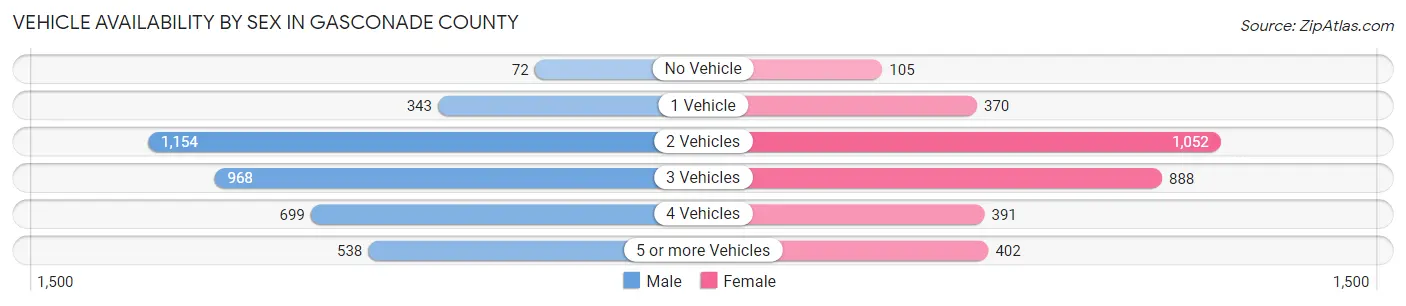
| Vehicles Available | Male | Female |
| No Vehicle | 72 (1.9%) | 105 (3.3%) |
| 1 Vehicle | 343 (9.1%) | 370 (11.5%) |
| 2 Vehicles | 1,154 (30.6%) | 1,052 (32.8%) |
| 3 Vehicles | 968 (25.7%) | 888 (27.7%) |
| 4 Vehicles | 699 (18.5%) | 391 (12.2%) |
| 5 or more Vehicles | 538 (14.3%) | 402 (12.5%) |
| Total | 3,774 (100.0%) | 3,208 (100.0%) |
Commute Time in Gasconade County
The most frequently occuring commute durations in Gasconade County are 5 to 9 minutes (1,363 commuters, 20.5%), 10 to 14 minutes (1,124 commuters, 16.9%), and 60 to 89 minutes (808 commuters, 12.1%).
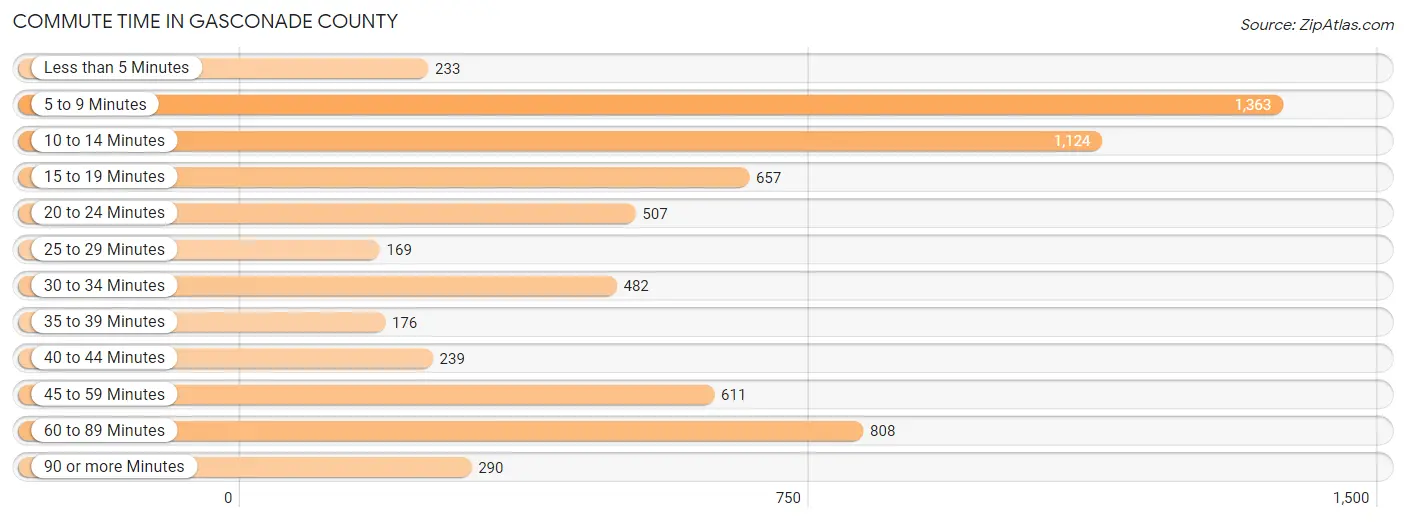
| Commute Time | # Commuters | % Commuters |
| Less than 5 Minutes | 233 | 3.5% |
| 5 to 9 Minutes | 1,363 | 20.5% |
| 10 to 14 Minutes | 1,124 | 16.9% |
| 15 to 19 Minutes | 657 | 9.9% |
| 20 to 24 Minutes | 507 | 7.6% |
| 25 to 29 Minutes | 169 | 2.5% |
| 30 to 34 Minutes | 482 | 7.2% |
| 35 to 39 Minutes | 176 | 2.6% |
| 40 to 44 Minutes | 239 | 3.6% |
| 45 to 59 Minutes | 611 | 9.2% |
| 60 to 89 Minutes | 808 | 12.1% |
| 90 or more Minutes | 290 | 4.4% |
Commute Time by Sex in Gasconade County
The most common commute times in Gasconade County are 60 to 89 minutes (588 commuters, 16.3%) for males and 5 to 9 minutes (807 commuters, 26.5%) for females.
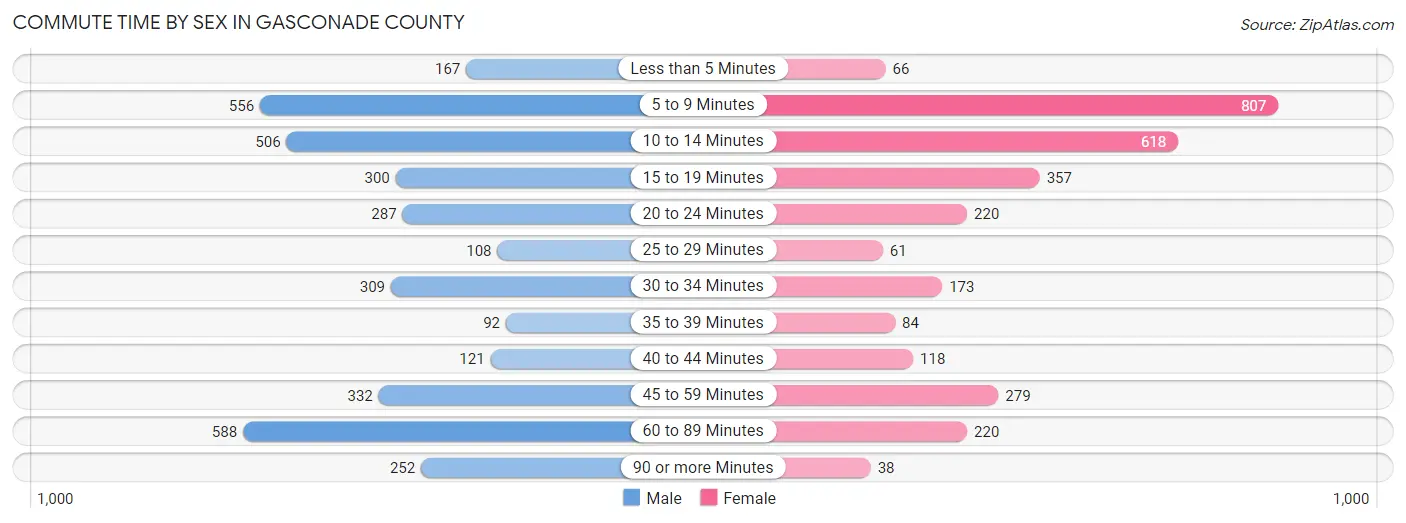
| Commute Time | Male | Female |
| Less than 5 Minutes | 167 (4.6%) | 66 (2.2%) |
| 5 to 9 Minutes | 556 (15.4%) | 807 (26.5%) |
| 10 to 14 Minutes | 506 (14.0%) | 618 (20.3%) |
| 15 to 19 Minutes | 300 (8.3%) | 357 (11.7%) |
| 20 to 24 Minutes | 287 (7.9%) | 220 (7.2%) |
| 25 to 29 Minutes | 108 (3.0%) | 61 (2.0%) |
| 30 to 34 Minutes | 309 (8.5%) | 173 (5.7%) |
| 35 to 39 Minutes | 92 (2.5%) | 84 (2.8%) |
| 40 to 44 Minutes | 121 (3.3%) | 118 (3.9%) |
| 45 to 59 Minutes | 332 (9.2%) | 279 (9.2%) |
| 60 to 89 Minutes | 588 (16.3%) | 220 (7.2%) |
| 90 or more Minutes | 252 (7.0%) | 38 (1.3%) |
Time of Departure to Work by Sex in Gasconade County
The most frequent times of departure to work in Gasconade County are 6:30 AM to 6:59 AM (557, 15.4%) for males and 7:30 AM to 7:59 AM (592, 19.5%) for females.
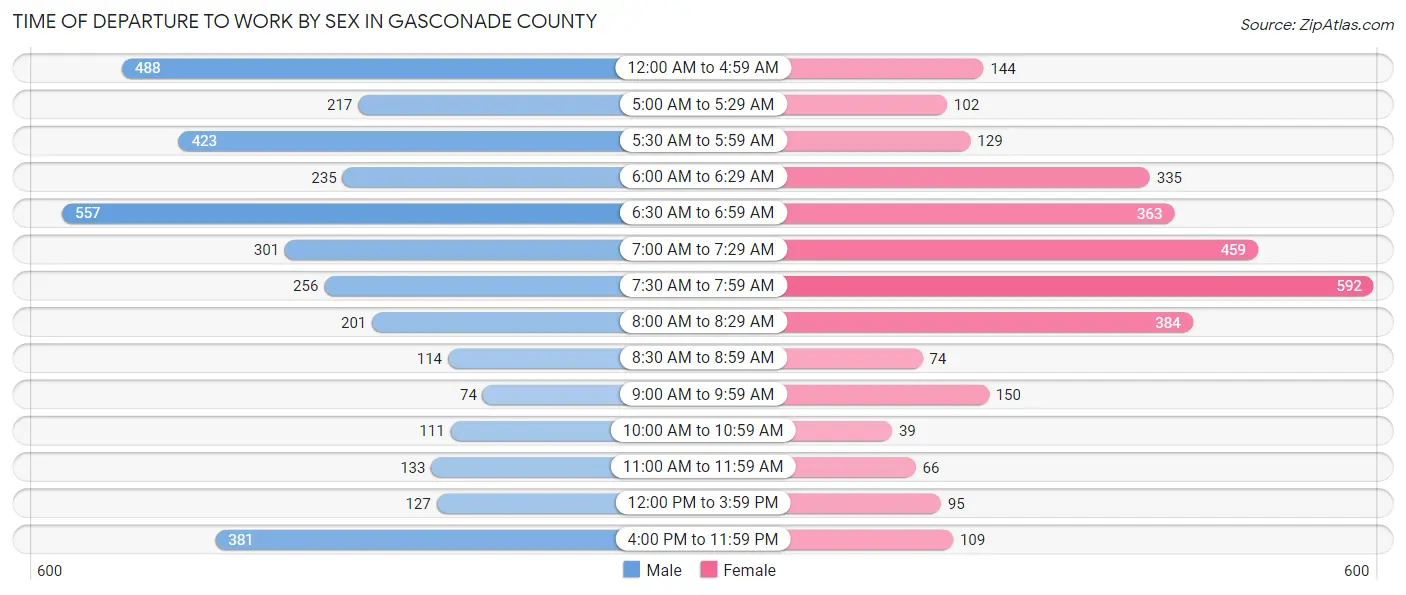
| Time of Departure | Male | Female |
| 12:00 AM to 4:59 AM | 488 (13.5%) | 144 (4.7%) |
| 5:00 AM to 5:29 AM | 217 (6.0%) | 102 (3.4%) |
| 5:30 AM to 5:59 AM | 423 (11.7%) | 129 (4.2%) |
| 6:00 AM to 6:29 AM | 235 (6.5%) | 335 (11.0%) |
| 6:30 AM to 6:59 AM | 557 (15.4%) | 363 (11.9%) |
| 7:00 AM to 7:29 AM | 301 (8.3%) | 459 (15.1%) |
| 7:30 AM to 7:59 AM | 256 (7.1%) | 592 (19.5%) |
| 8:00 AM to 8:29 AM | 201 (5.6%) | 384 (12.6%) |
| 8:30 AM to 8:59 AM | 114 (3.2%) | 74 (2.4%) |
| 9:00 AM to 9:59 AM | 74 (2.1%) | 150 (4.9%) |
| 10:00 AM to 10:59 AM | 111 (3.1%) | 39 (1.3%) |
| 11:00 AM to 11:59 AM | 133 (3.7%) | 66 (2.2%) |
| 12:00 PM to 3:59 PM | 127 (3.5%) | 95 (3.1%) |
| 4:00 PM to 11:59 PM | 381 (10.5%) | 109 (3.6%) |
| Total | 3,618 (100.0%) | 3,041 (100.0%) |
Housing Occupancy in Gasconade County
Occupancy by Ownership in Gasconade County
Of the total 5,970 dwellings in Gasconade County, owner-occupied units account for 4,818 (80.7%), while renter-occupied units make up 1,152 (19.3%).
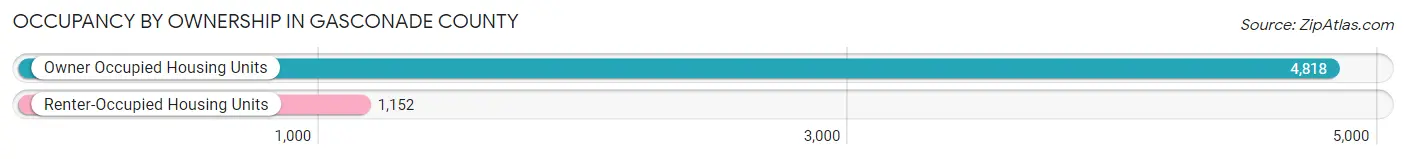
| Occupancy | # Housing Units | % Housing Units |
| Owner Occupied Housing Units | 4,818 | 80.7% |
| Renter-Occupied Housing Units | 1,152 | 19.3% |
| Total Occupied Housing Units | 5,970 | 100.0% |
Occupancy by Household Size in Gasconade County
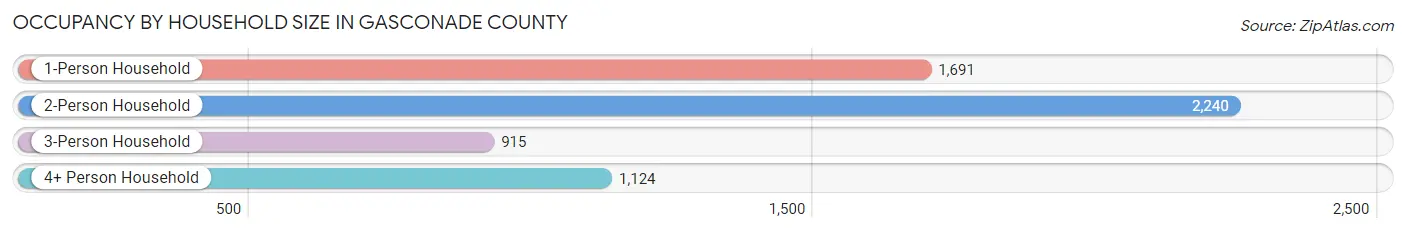
| Household Size | # Housing Units | % Housing Units |
| 1-Person Household | 1,691 | 28.3% |
| 2-Person Household | 2,240 | 37.5% |
| 3-Person Household | 915 | 15.3% |
| 4+ Person Household | 1,124 | 18.8% |
| Total Housing Units | 5,970 | 100.0% |
Occupancy by Ownership by Household Size in Gasconade County
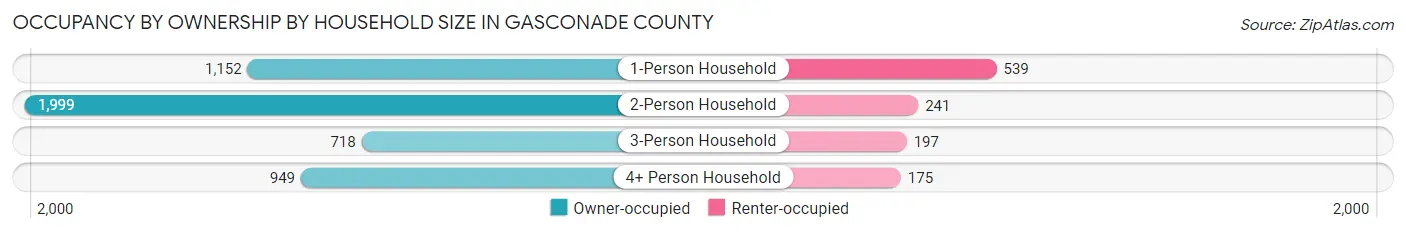
| Household Size | Owner-occupied | Renter-occupied |
| 1-Person Household | 1,152 (68.1%) | 539 (31.9%) |
| 2-Person Household | 1,999 (89.2%) | 241 (10.8%) |
| 3-Person Household | 718 (78.5%) | 197 (21.5%) |
| 4+ Person Household | 949 (84.4%) | 175 (15.6%) |
| Total Housing Units | 4,818 (80.7%) | 1,152 (19.3%) |
Occupancy by Educational Attainment in Gasconade County
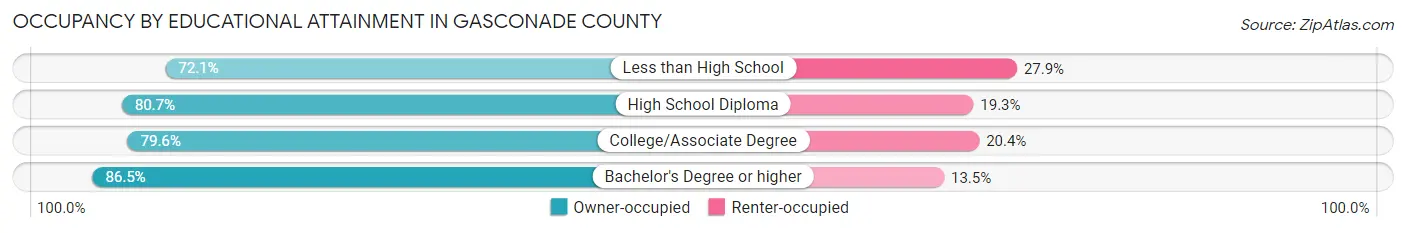
| Household Size | Owner-occupied | Renter-occupied |
| Less than High School | 421 (72.1%) | 163 (27.9%) |
| High School Diploma | 1,776 (80.7%) | 424 (19.3%) |
| College/Associate Degree | 1,554 (79.6%) | 399 (20.4%) |
| Bachelor's Degree or higher | 1,067 (86.5%) | 166 (13.5%) |
Occupancy by Age of Householder in Gasconade County
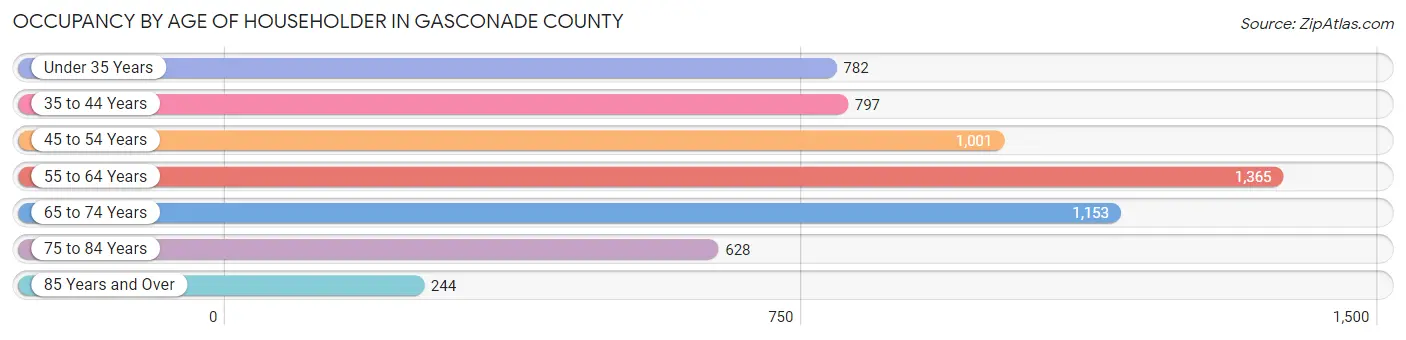
| Age Bracket | # Households | % Households |
| Under 35 Years | 782 | 13.1% |
| 35 to 44 Years | 797 | 13.4% |
| 45 to 54 Years | 1,001 | 16.8% |
| 55 to 64 Years | 1,365 | 22.9% |
| 65 to 74 Years | 1,153 | 19.3% |
| 75 to 84 Years | 628 | 10.5% |
| 85 Years and Over | 244 | 4.1% |
| Total | 5,970 | 100.0% |
Housing Finances in Gasconade County
Median Income by Occupancy in Gasconade County
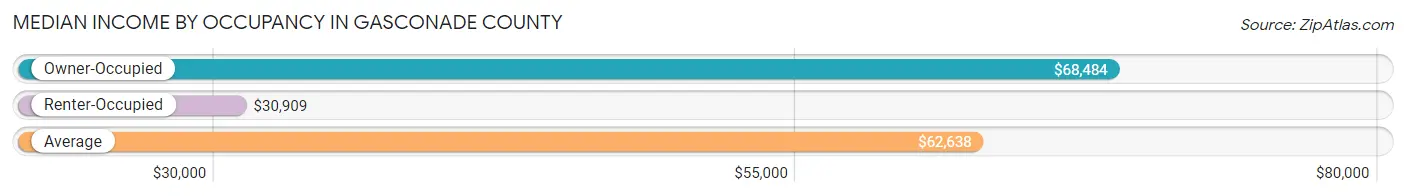
| Occupancy Type | # Households | Median Income |
| Owner-Occupied | 4,818 (80.7%) | $68,484 |
| Renter-Occupied | 1,152 (19.3%) | $30,909 |
| Average | 5,970 (100.0%) | $62,638 |
Occupancy by Householder Income Bracket in Gasconade County
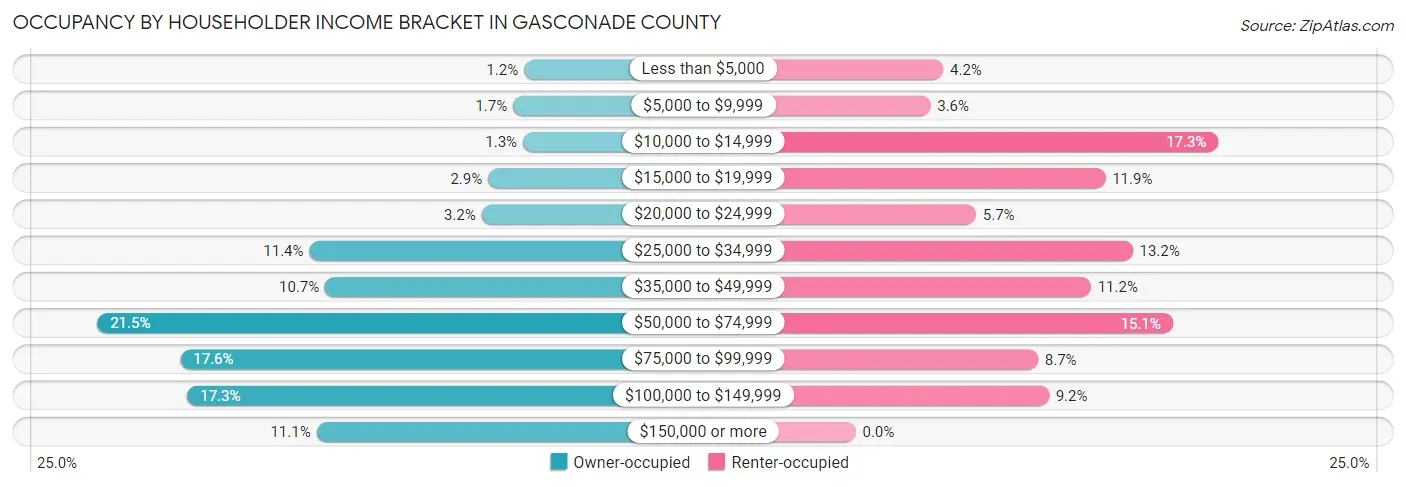
| Income Bracket | Owner-occupied | Renter-occupied |
| Less than $5,000 | 59 (1.2%) | 48 (4.2%) |
| $5,000 to $9,999 | 84 (1.7%) | 41 (3.6%) |
| $10,000 to $14,999 | 61 (1.3%) | 199 (17.3%) |
| $15,000 to $19,999 | 141 (2.9%) | 137 (11.9%) |
| $20,000 to $24,999 | 156 (3.2%) | 66 (5.7%) |
| $25,000 to $34,999 | 551 (11.4%) | 152 (13.2%) |
| $35,000 to $49,999 | 515 (10.7%) | 129 (11.2%) |
| $50,000 to $74,999 | 1,038 (21.5%) | 174 (15.1%) |
| $75,000 to $99,999 | 847 (17.6%) | 100 (8.7%) |
| $100,000 to $149,999 | 831 (17.2%) | 106 (9.2%) |
| $150,000 or more | 535 (11.1%) | 0 (0.0%) |
| Total | 4,818 (100.0%) | 1,152 (100.0%) |
Monthly Housing Cost Tiers in Gasconade County
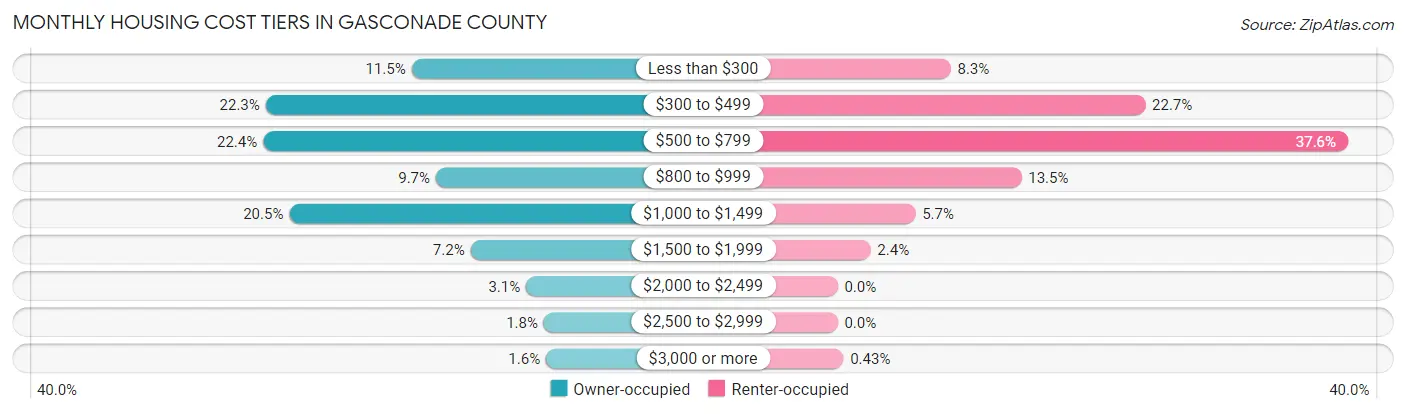
| Monthly Cost | Owner-occupied | Renter-occupied |
| Less than $300 | 554 (11.5%) | 96 (8.3%) |
| $300 to $499 | 1,072 (22.3%) | 261 (22.7%) |
| $500 to $799 | 1,081 (22.4%) | 433 (37.6%) |
| $800 to $999 | 468 (9.7%) | 156 (13.5%) |
| $1,000 to $1,499 | 988 (20.5%) | 66 (5.7%) |
| $1,500 to $1,999 | 345 (7.2%) | 28 (2.4%) |
| $2,000 to $2,499 | 148 (3.1%) | 0 (0.0%) |
| $2,500 to $2,999 | 85 (1.8%) | 0 (0.0%) |
| $3,000 or more | 77 (1.6%) | 5 (0.4%) |
| Total | 4,818 (100.0%) | 1,152 (100.0%) |
Physical Housing Characteristics in Gasconade County
Housing Structures in Gasconade County
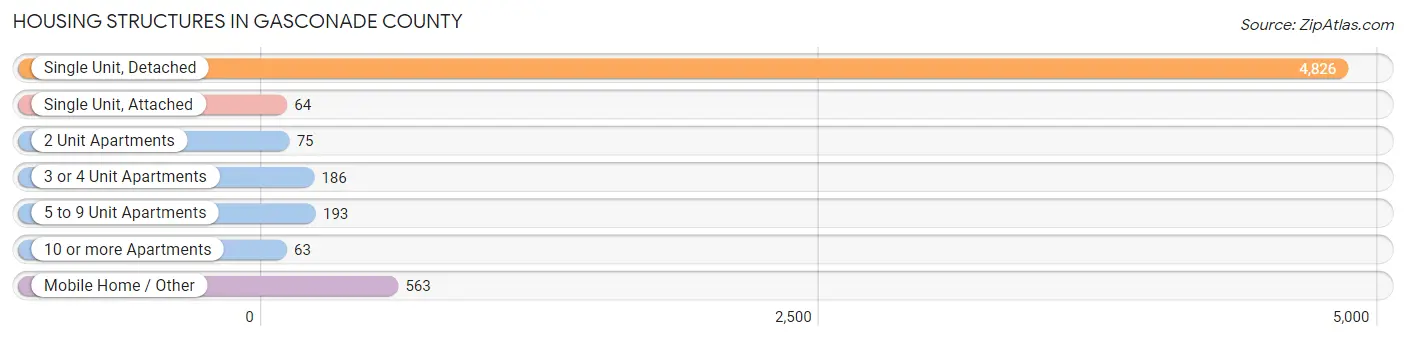
| Structure Type | # Housing Units | % Housing Units |
| Single Unit, Detached | 4,826 | 80.8% |
| Single Unit, Attached | 64 | 1.1% |
| 2 Unit Apartments | 75 | 1.3% |
| 3 or 4 Unit Apartments | 186 | 3.1% |
| 5 to 9 Unit Apartments | 193 | 3.2% |
| 10 or more Apartments | 63 | 1.1% |
| Mobile Home / Other | 563 | 9.4% |
| Total | 5,970 | 100.0% |
Housing Structures by Occupancy in Gasconade County
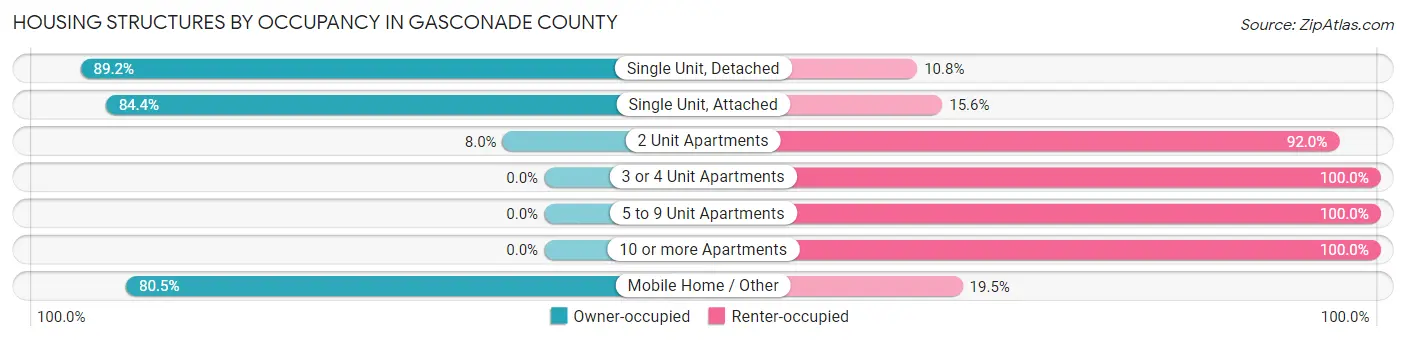
| Structure Type | Owner-occupied | Renter-occupied |
| Single Unit, Detached | 4,305 (89.2%) | 521 (10.8%) |
| Single Unit, Attached | 54 (84.4%) | 10 (15.6%) |
| 2 Unit Apartments | 6 (8.0%) | 69 (92.0%) |
| 3 or 4 Unit Apartments | 0 (0.0%) | 186 (100.0%) |
| 5 to 9 Unit Apartments | 0 (0.0%) | 193 (100.0%) |
| 10 or more Apartments | 0 (0.0%) | 63 (100.0%) |
| Mobile Home / Other | 453 (80.5%) | 110 (19.5%) |
| Total | 4,818 (80.7%) | 1,152 (19.3%) |
Housing Structures by Number of Rooms in Gasconade County
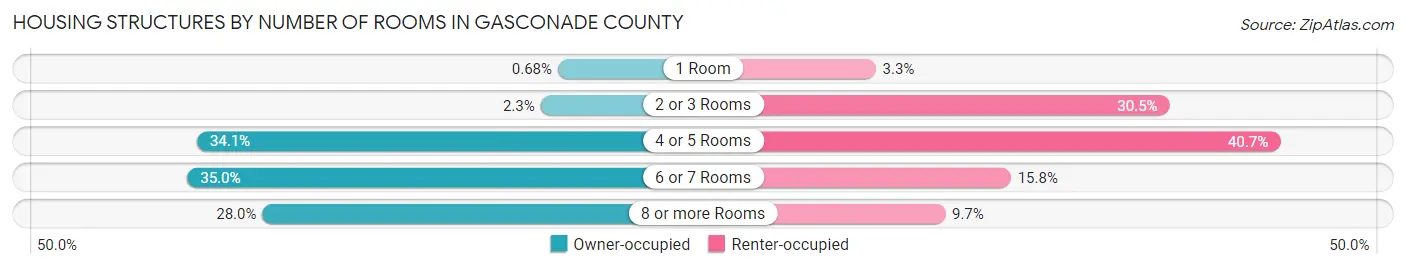
| Number of Rooms | Owner-occupied | Renter-occupied |
| 1 Room | 33 (0.7%) | 38 (3.3%) |
| 2 or 3 Rooms | 110 (2.3%) | 351 (30.5%) |
| 4 or 5 Rooms | 1,641 (34.1%) | 469 (40.7%) |
| 6 or 7 Rooms | 1,684 (34.9%) | 182 (15.8%) |
| 8 or more Rooms | 1,350 (28.0%) | 112 (9.7%) |
| Total | 4,818 (100.0%) | 1,152 (100.0%) |
Housing Structure by Heating Type in Gasconade County
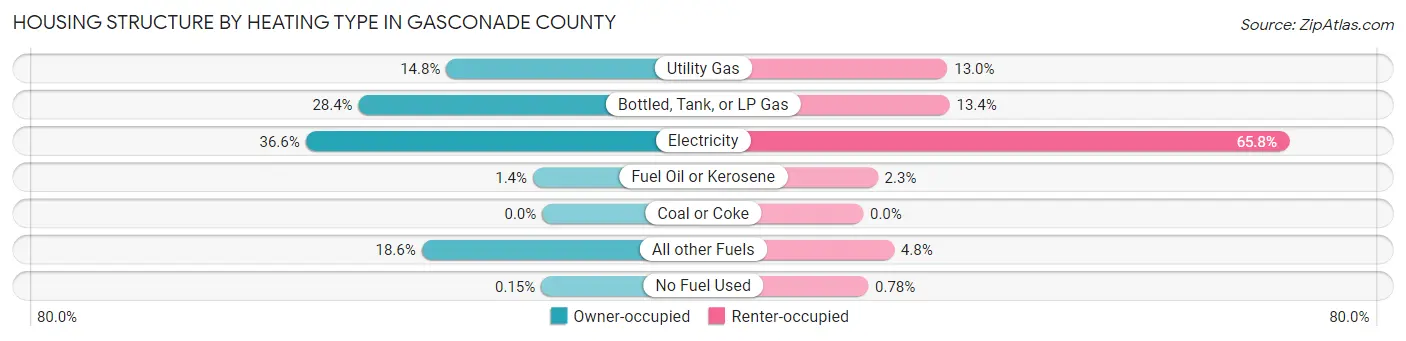
| Heating Type | Owner-occupied | Renter-occupied |
| Utility Gas | 714 (14.8%) | 150 (13.0%) |
| Bottled, Tank, or LP Gas | 1,368 (28.4%) | 154 (13.4%) |
| Electricity | 1,762 (36.6%) | 758 (65.8%) |
| Fuel Oil or Kerosene | 69 (1.4%) | 26 (2.3%) |
| Coal or Coke | 0 (0.0%) | 0 (0.0%) |
| All other Fuels | 898 (18.6%) | 55 (4.8%) |
| No Fuel Used | 7 (0.2%) | 9 (0.8%) |
| Total | 4,818 (100.0%) | 1,152 (100.0%) |
Household Vehicle Usage in Gasconade County
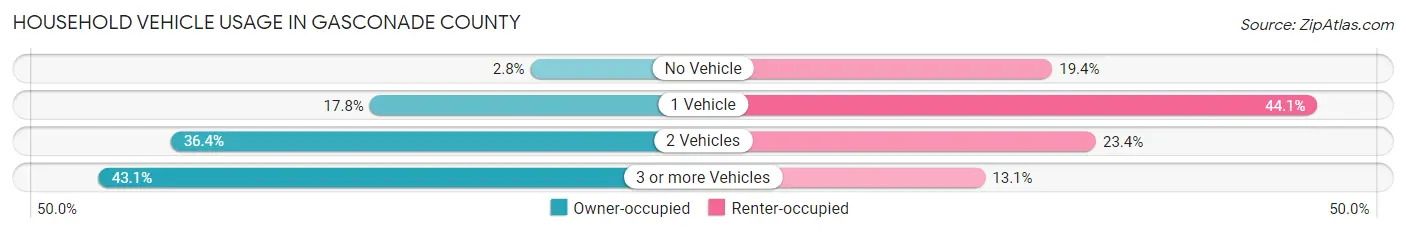
| Vehicles per Household | Owner-occupied | Renter-occupied |
| No Vehicle | 134 (2.8%) | 223 (19.4%) |
| 1 Vehicle | 857 (17.8%) | 508 (44.1%) |
| 2 Vehicles | 1,752 (36.4%) | 270 (23.4%) |
| 3 or more Vehicles | 2,075 (43.1%) | 151 (13.1%) |
| Total | 4,818 (100.0%) | 1,152 (100.0%) |
Real Estate & Mortgages in Gasconade County
Real Estate and Mortgage Overview in Gasconade County
| Characteristic | Without Mortgage | With Mortgage |
| Housing Units | 2,383 | 2,435 |
| Median Property Value | $150,600 | $165,000 |
| Median Household Income | $59,640 | $296 |
| Monthly Housing Costs | $434 | $77 |
| Real Estate Taxes | $1,163 | $82 |
Property Value by Mortgage Status in Gasconade County
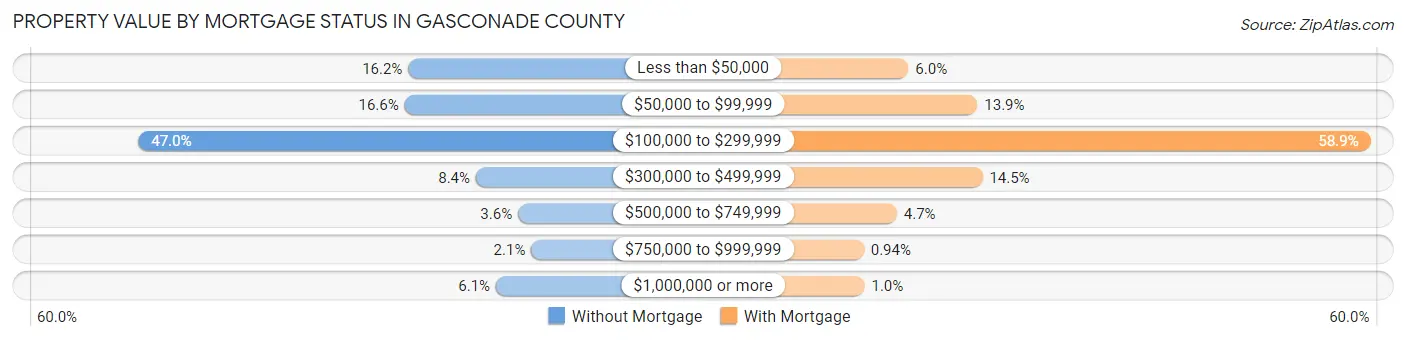
| Property Value | Without Mortgage | With Mortgage |
| Less than $50,000 | 385 (16.2%) | 147 (6.0%) |
| $50,000 to $99,999 | 395 (16.6%) | 339 (13.9%) |
| $100,000 to $299,999 | 1,120 (47.0%) | 1,433 (58.9%) |
| $300,000 to $499,999 | 201 (8.4%) | 353 (14.5%) |
| $500,000 to $749,999 | 86 (3.6%) | 115 (4.7%) |
| $750,000 to $999,999 | 50 (2.1%) | 23 (0.9%) |
| $1,000,000 or more | 146 (6.1%) | 25 (1.0%) |
| Total | 2,383 (100.0%) | 2,435 (100.0%) |
Household Income by Mortgage Status in Gasconade County
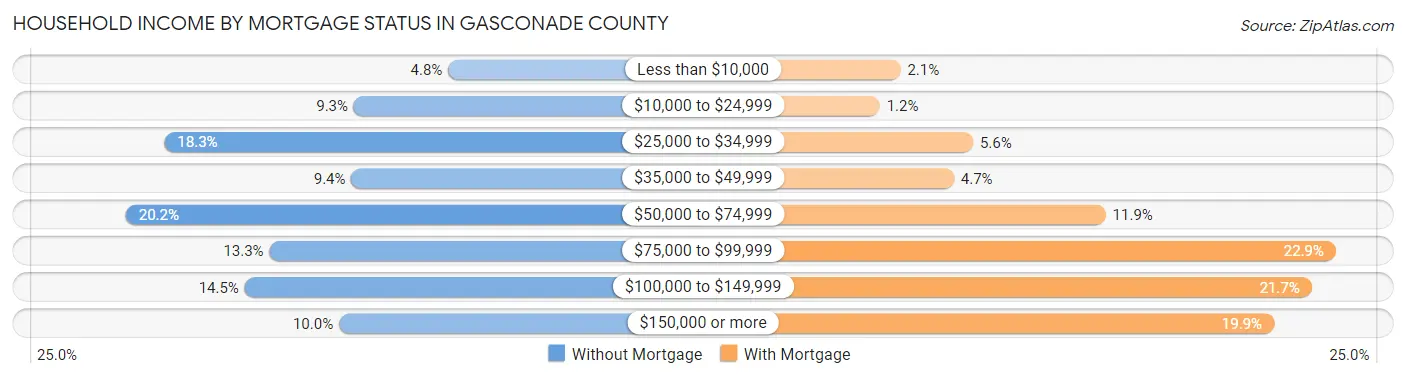
| Household Income | Without Mortgage | With Mortgage |
| Less than $10,000 | 115 (4.8%) | 52 (2.1%) |
| $10,000 to $24,999 | 222 (9.3%) | 28 (1.1%) |
| $25,000 to $34,999 | 437 (18.3%) | 136 (5.6%) |
| $35,000 to $49,999 | 225 (9.4%) | 114 (4.7%) |
| $50,000 to $74,999 | 481 (20.2%) | 290 (11.9%) |
| $75,000 to $99,999 | 318 (13.3%) | 557 (22.9%) |
| $100,000 to $149,999 | 346 (14.5%) | 529 (21.7%) |
| $150,000 or more | 239 (10.0%) | 485 (19.9%) |
| Total | 2,383 (100.0%) | 2,435 (100.0%) |
Property Value to Household Income Ratio in Gasconade County
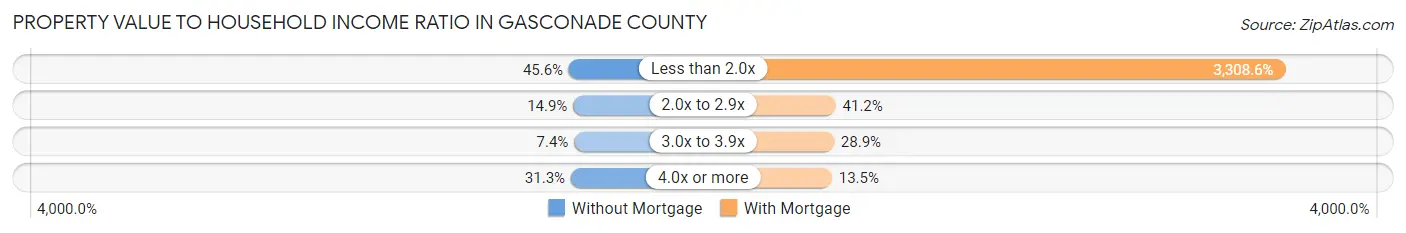
| Value-to-Income Ratio | Without Mortgage | With Mortgage |
| Less than 2.0x | 1,087 (45.6%) | 80,565 (3,308.6%) |
| 2.0x to 2.9x | 354 (14.9%) | 1,003 (41.2%) |
| 3.0x to 3.9x | 176 (7.4%) | 704 (28.9%) |
| 4.0x or more | 746 (31.3%) | 329 (13.5%) |
| Total | 2,383 (100.0%) | 2,435 (100.0%) |
Real Estate Taxes by Mortgage Status in Gasconade County
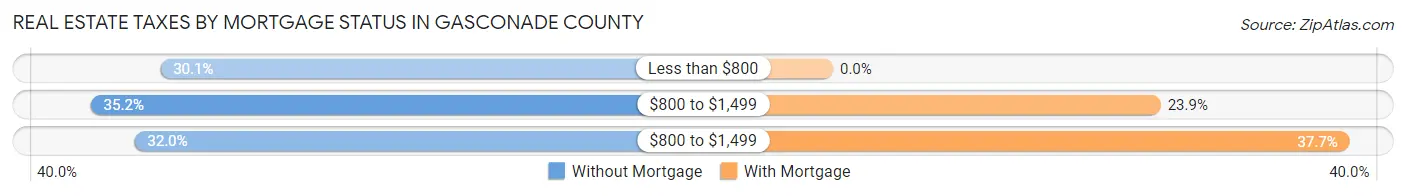
| Property Taxes | Without Mortgage | With Mortgage |
| Less than $800 | 717 (30.1%) | 0 (0.0%) |
| $800 to $1,499 | 838 (35.2%) | 583 (23.9%) |
| $800 to $1,499 | 762 (32.0%) | 919 (37.7%) |
| Total | 2,383 (100.0%) | 2,435 (100.0%) |
Health & Disability in Gasconade County
Health Insurance Coverage by Age in Gasconade County
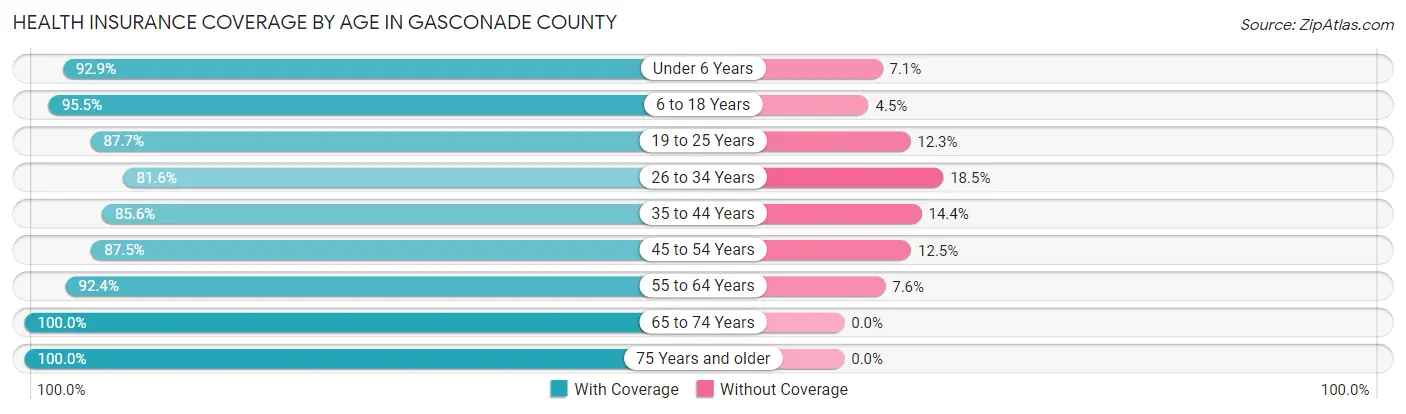
| Age Bracket | With Coverage | Without Coverage |
| Under 6 Years | 860 (92.9%) | 66 (7.1%) |
| 6 to 18 Years | 2,235 (95.5%) | 106 (4.5%) |
| 19 to 25 Years | 925 (87.7%) | 130 (12.3%) |
| 26 to 34 Years | 1,118 (81.6%) | 253 (18.4%) |
| 35 to 44 Years | 1,300 (85.6%) | 219 (14.4%) |
| 45 to 54 Years | 1,588 (87.5%) | 226 (12.5%) |
| 55 to 64 Years | 2,224 (92.4%) | 184 (7.6%) |
| 65 to 74 Years | 1,847 (100.0%) | 0 (0.0%) |
| 75 Years and older | 1,290 (100.0%) | 0 (0.0%) |
| Total | 13,387 (91.9%) | 1,184 (8.1%) |
Health Insurance Coverage by Citizenship Status in Gasconade County

| Citizenship Status | With Coverage | Without Coverage |
| Native Born | 860 (92.9%) | 66 (7.1%) |
| Foreign Born, Citizen | 2,235 (95.5%) | 106 (4.5%) |
| Foreign Born, not a Citizen | 925 (87.7%) | 130 (12.3%) |
Health Insurance Coverage by Household Income in Gasconade County
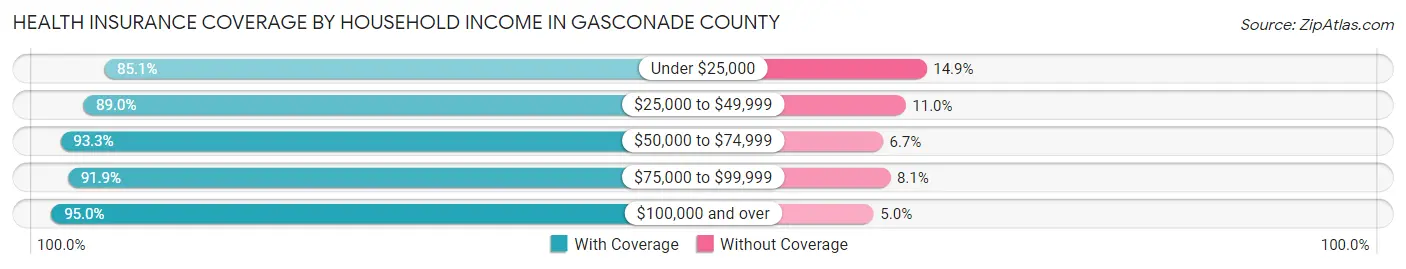
| Household Income | With Coverage | Without Coverage |
| Under $25,000 | 1,325 (85.1%) | 232 (14.9%) |
| $25,000 to $49,999 | 2,393 (89.0%) | 295 (11.0%) |
| $50,000 to $74,999 | 2,720 (93.3%) | 195 (6.7%) |
| $75,000 to $99,999 | 2,593 (91.9%) | 228 (8.1%) |
| $100,000 and over | 4,343 (95.0%) | 228 (5.0%) |
Public vs Private Health Insurance Coverage by Age in Gasconade County
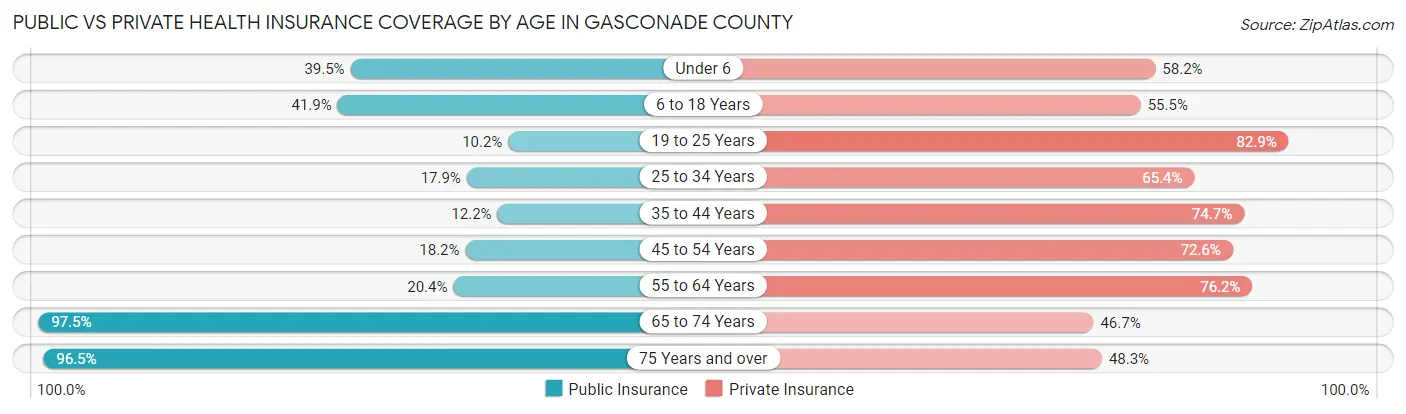
| Age Bracket | Public Insurance | Private Insurance |
| Under 6 | 366 (39.5%) | 539 (58.2%) |
| 6 to 18 Years | 981 (41.9%) | 1,299 (55.5%) |
| 19 to 25 Years | 108 (10.2%) | 875 (82.9%) |
| 25 to 34 Years | 246 (17.9%) | 897 (65.4%) |
| 35 to 44 Years | 186 (12.2%) | 1,134 (74.7%) |
| 45 to 54 Years | 330 (18.2%) | 1,316 (72.6%) |
| 55 to 64 Years | 492 (20.4%) | 1,835 (76.2%) |
| 65 to 74 Years | 1,800 (97.5%) | 863 (46.7%) |
| 75 Years and over | 1,245 (96.5%) | 623 (48.3%) |
| Total | 5,754 (39.5%) | 9,381 (64.4%) |
Disability Status by Sex by Age in Gasconade County
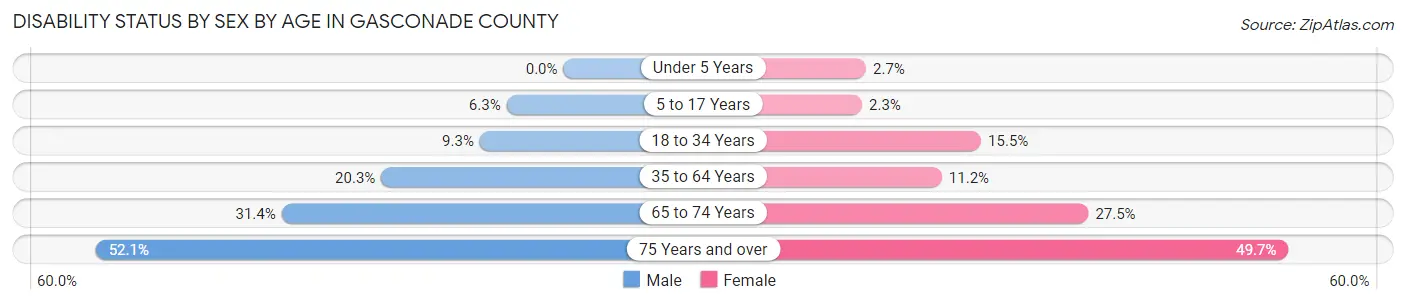
| Age Bracket | Male | Female |
| Under 5 Years | 0 (0.0%) | 9 (2.7%) |
| 5 to 17 Years | 78 (6.3%) | 24 (2.3%) |
| 18 to 34 Years | 126 (9.3%) | 199 (15.5%) |
| 35 to 64 Years | 595 (20.3%) | 313 (11.2%) |
| 65 to 74 Years | 294 (31.4%) | 250 (27.5%) |
| 75 Years and over | 301 (52.1%) | 354 (49.7%) |
Disability Class by Sex by Age in Gasconade County
Disability Class: Hearing Difficulty
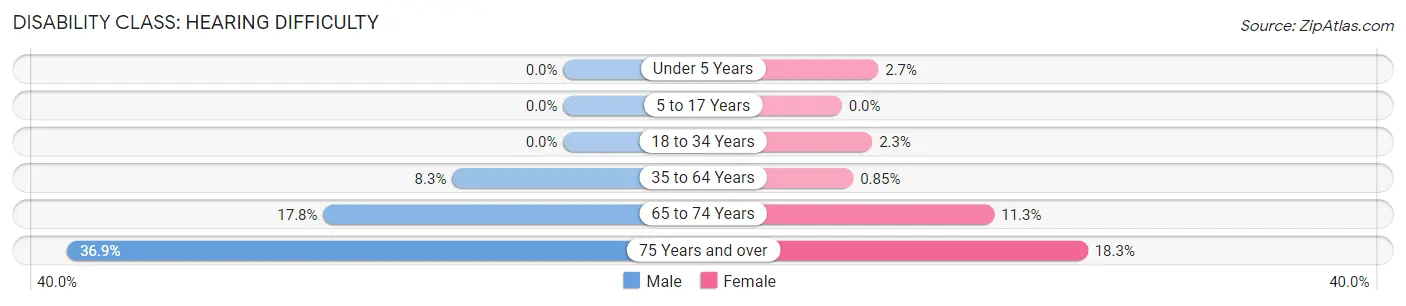
| Age Bracket | Male | Female |
| Under 5 Years | 0 (0.0%) | 9 (2.7%) |
| 5 to 17 Years | 0 (0.0%) | 0 (0.0%) |
| 18 to 34 Years | 0 (0.0%) | 29 (2.3%) |
| 35 to 64 Years | 242 (8.3%) | 24 (0.9%) |
| 65 to 74 Years | 167 (17.8%) | 103 (11.3%) |
| 75 Years and over | 213 (36.8%) | 130 (18.3%) |
Disability Class: Vision Difficulty
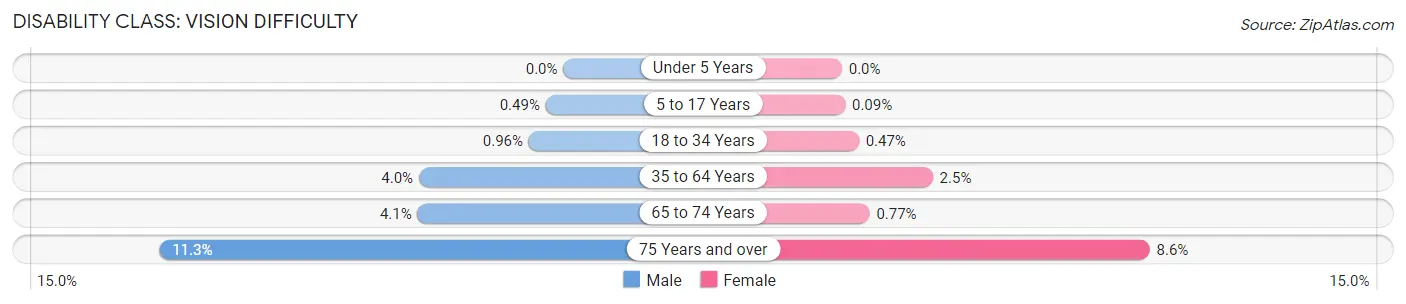
| Age Bracket | Male | Female |
| Under 5 Years | 0 (0.0%) | 0 (0.0%) |
| 5 to 17 Years | 6 (0.5%) | 1 (0.1%) |
| 18 to 34 Years | 13 (1.0%) | 6 (0.5%) |
| 35 to 64 Years | 118 (4.0%) | 71 (2.5%) |
| 65 to 74 Years | 38 (4.1%) | 7 (0.8%) |
| 75 Years and over | 65 (11.3%) | 61 (8.6%) |
Disability Class: Cognitive Difficulty
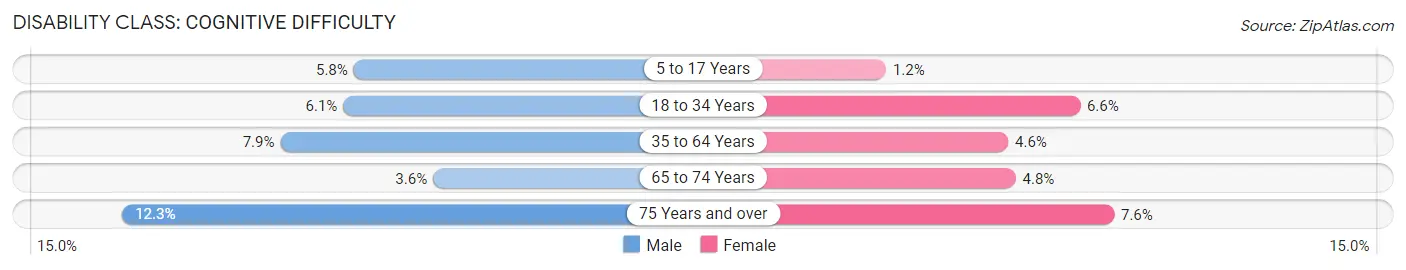
| Age Bracket | Male | Female |
| 5 to 17 Years | 72 (5.8%) | 13 (1.2%) |
| 18 to 34 Years | 83 (6.1%) | 85 (6.6%) |
| 35 to 64 Years | 231 (7.9%) | 130 (4.6%) |
| 65 to 74 Years | 34 (3.6%) | 44 (4.8%) |
| 75 Years and over | 71 (12.3%) | 54 (7.6%) |
Disability Class: Ambulatory Difficulty
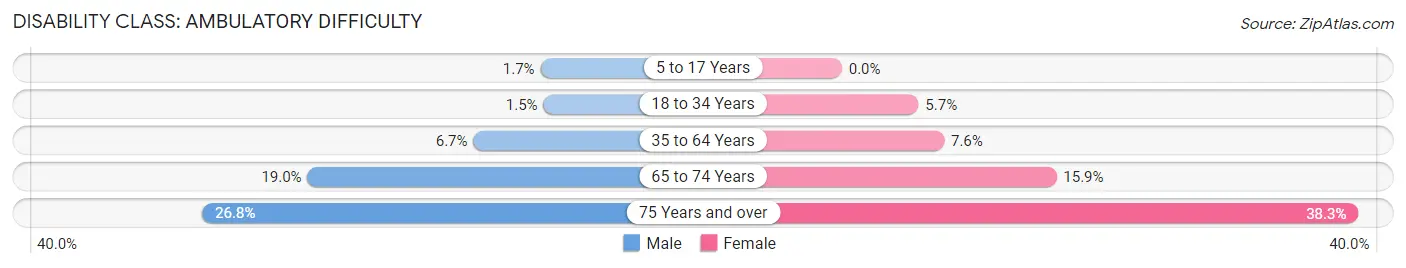
| Age Bracket | Male | Female |
| 5 to 17 Years | 21 (1.7%) | 0 (0.0%) |
| 18 to 34 Years | 20 (1.5%) | 73 (5.7%) |
| 35 to 64 Years | 196 (6.7%) | 213 (7.6%) |
| 65 to 74 Years | 178 (19.0%) | 145 (15.9%) |
| 75 Years and over | 155 (26.8%) | 273 (38.3%) |
Disability Class: Self-Care Difficulty
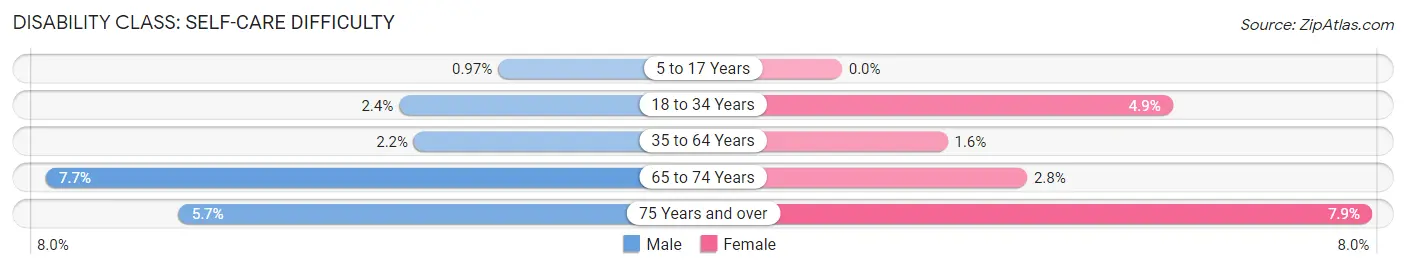
| Age Bracket | Male | Female |
| 5 to 17 Years | 12 (1.0%) | 0 (0.0%) |
| 18 to 34 Years | 33 (2.4%) | 63 (4.9%) |
| 35 to 64 Years | 65 (2.2%) | 44 (1.6%) |
| 65 to 74 Years | 72 (7.7%) | 25 (2.8%) |
| 75 Years and over | 33 (5.7%) | 56 (7.9%) |
Technology Access in Gasconade County
Computing Device Access in Gasconade County
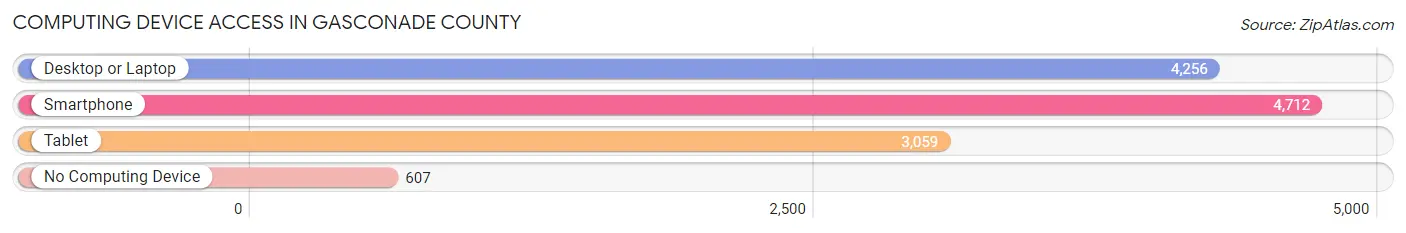
| Device Type | # Households | % Households |
| Desktop or Laptop | 4,256 | 71.3% |
| Smartphone | 4,712 | 78.9% |
| Tablet | 3,059 | 51.2% |
| No Computing Device | 607 | 10.2% |
| Total | 5,970 | 100.0% |
Internet Access in Gasconade County
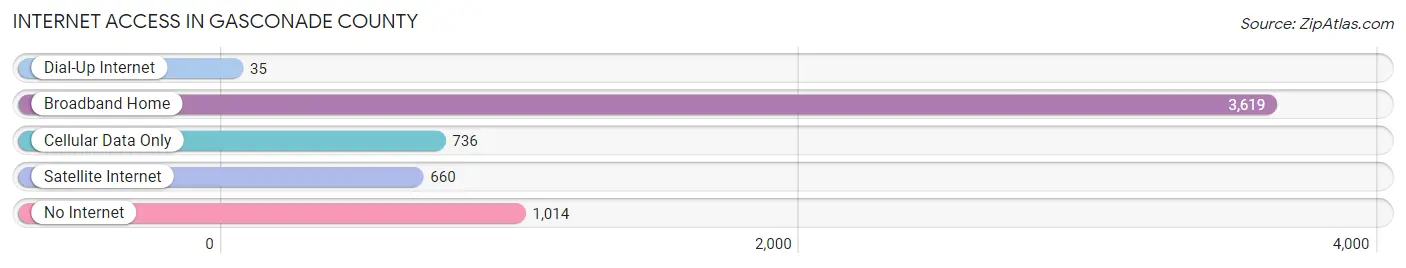
| Internet Type | # Households | % Households |
| Dial-Up Internet | 35 | 0.6% |
| Broadband Home | 3,619 | 60.6% |
| Cellular Data Only | 736 | 12.3% |
| Satellite Internet | 660 | 11.1% |
| No Internet | 1,014 | 17.0% |
| Total | 5,970 | 100.0% |
Gasconade County Summary
Geography
Gasconade County is located in east-central Missouri, in the Ozark region of the state. It is bordered by Franklin County to the north, Osage County to the east, Maries County to the south, and Phelps and Crawford counties to the west. The county covers an area of 576 square miles and is home to a population of 15,222 people, according to the 2010 census.
The county is mostly rural, with rolling hills and valleys, and is home to several small towns and villages. The Gasconade River runs through the county, and is a popular destination for fishing, boating, and other recreational activities. The county is also home to several state parks, including the Gasconade River State Park, which offers camping, hiking, and other outdoor activities.
History
Gasconade County was established in 1820, and was named after the Gasconade River, which runs through the county. The county was originally part of Franklin County, and was later divided into its own county.
The county was largely agricultural in its early years, with the majority of the population living in small farming communities. The county was also home to several small industries, including sawmills, gristmills, and tanneries.
In the late 19th century, the county began to experience a population boom, as more people moved to the area to take advantage of the fertile land and abundant resources. The county also saw an influx of German immigrants, who established several small towns and villages in the area.
Economy
The economy of Gasconade County is largely based on agriculture, with the majority of the population employed in farming and related industries. The county is home to several large farms, as well as smaller family-owned operations.
The county is also home to several small businesses, including restaurants, retail stores, and service providers. The county is also home to several manufacturing companies, including a furniture factory and a metal fabrication plant.
Demographics
According to the 2010 census, the population of Gasconade County was 15,222, with a population density of 26 people per square mile. The median household income was $41,945, and the median age was 41.7 years.
The racial makeup of the county was 97.3% White, 0.7% African American, 0.3% Native American, 0.2% Asian, 0.1% Pacific Islander, 0.4% from other races, and 1.0% from two or more races. Hispanic or Latino of any race were 1.3% of the population.
The largest ancestry groups in the county were German (44.2%), Irish (14.2%), English (13.2%), and American (7.2%). The majority of the population (90.2%) spoke English as their primary language, while 4.2% spoke Spanish, and 1.2% spoke German.
Common Questions
What is Per Capita Income in Gasconade County?
Per Capita income in Gasconade County is $34,414.
What is the Median Family Income in Gasconade County?
Median Family Income in Gasconade County is $77,652.
What is the Median Household income in Gasconade County?
Median Household Income in Gasconade County is $62,638.
What is Income or Wage Gap in Gasconade County?
Income or Wage Gap in Gasconade County is 28.3%.
Women in Gasconade County earn 71.7 cents for every dollar earned by a man.
What is Family Income Deficit in Gasconade County?
Family Income Deficit in Gasconade County is $12,880.
Families that are below poverty line in Gasconade County earn $12,880 less on average than the poverty threshold level.
What is Inequality or Gini Index in Gasconade County?
Inequality or Gini Index in Gasconade County is 0.46.
What is the Total Population of Gasconade County?
Total Population of Gasconade County is 14,801.
What is the Total Male Population of Gasconade County?
Total Male Population of Gasconade County is 7,522.
What is the Total Female Population of Gasconade County?
Total Female Population of Gasconade County is 7,279.
What is the Ratio of Males per 100 Females in Gasconade County?
There are 103.34 Males per 100 Females in Gasconade County.
What is the Ratio of Females per 100 Males in Gasconade County?
There are 96.77 Females per 100 Males in Gasconade County.
What is the Median Population Age in Gasconade County?
Median Population Age in Gasconade County is 46.3 Years.
What is the Average Family Size in Gasconade County
Average Family Size in Gasconade County is 3.0 People.
What is the Average Household Size in Gasconade County
Average Household Size in Gasconade County is 2.4 People.
How Large is the Labor Force in Gasconade County?
There are 7,333 People in the Labor Forcein in Gasconade County.
What is the Percentage of People in the Labor Force in Gasconade County?
60.6% of People are in the Labor Force in Gasconade County.
What is the Unemployment Rate in Gasconade County?
Unemployment Rate in Gasconade County is 2.1%.