Dunklin County, MO Map & Demographics
Dunklin County Overview
$26,123
PER CAPITA INCOME
$58,785
AVG FAMILY INCOME
$44,868
AVG HOUSEHOLD INCOME
32.4%
WAGE / INCOME GAP [ % ]
67.6¢/ $1
WAGE / INCOME GAP [ $ ]
$11,163
FAMILY INCOME DEFICIT
0.49
INEQUALITY / GINI INDEX
28,174
TOTAL POPULATION
13,489
MALE POPULATION
14,685
FEMALE POPULATION
91.86
MALES / 100 FEMALES
108.87
FEMALES / 100 MALES
39.4
MEDIAN AGE
3.0
AVG FAMILY SIZE
2.5
AVG HOUSEHOLD SIZE
11,722
LABOR FORCE [ PEOPLE ]
53.9%
PERCENT IN LABOR FORCE
5.7%
UNEMPLOYMENT RATE
Dunklin County Area Codes
Income in Dunklin County
Income Overview in Dunklin County
Per Capita Income in Dunklin County is $26,123, while median incomes of families and households are $58,785 and $44,868 respectively.
| Characteristic | Number | Measure |
| Per Capita Income | 28,174 | $26,123 |
| Median Family Income | 7,093 | $58,785 |
| Mean Family Income | 7,093 | $80,369 |
| Median Household Income | 11,134 | $44,868 |
| Mean Household Income | 11,134 | $64,879 |
| Income Deficit | 7,093 | $11,163 |
| Wage / Income Gap (%) | 28,174 | 32.44% |
| Wage / Income Gap ($) | 28,174 | 67.56¢ per $1 |
| Gini / Inequality Index | 28,174 | 0.49 |
Earnings by Sex in Dunklin County
Average Earnings in Dunklin County are $32,246, $38,556 for men and $26,047 for women, a difference of 32.4%.
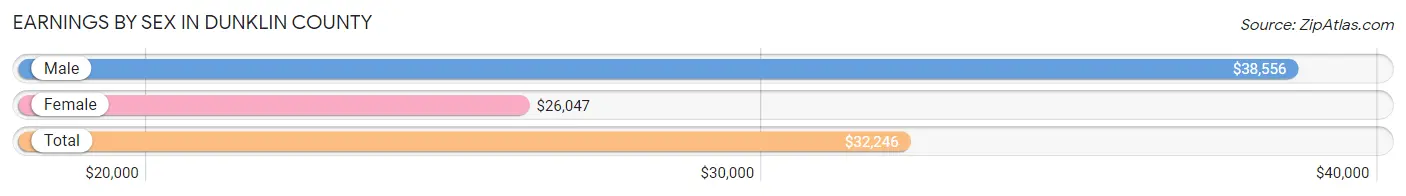
| Sex | Number | Average Earnings |
| Male | 6,302 (51.5%) | $38,556 |
| Female | 5,925 (48.5%) | $26,047 |
| Total | 12,227 (100.0%) | $32,246 |
Earnings by Sex by Income Bracket in Dunklin County
The most common earnings brackets in Dunklin County are $100,000+ for men (664 | 10.5%) and $25,000 to $29,999 for women (610 | 10.3%).
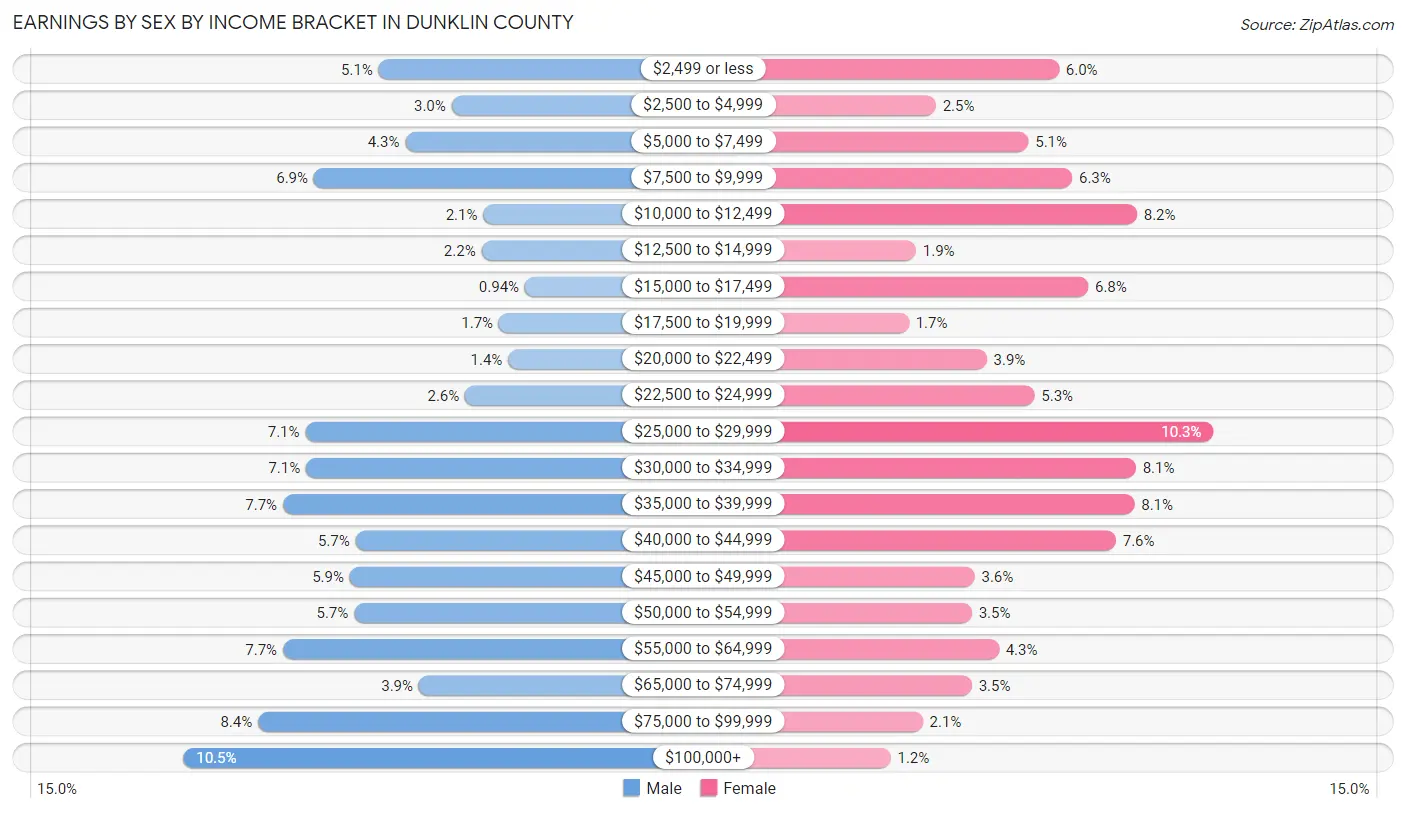
| Income | Male | Female |
| $2,499 or less | 318 (5.1%) | 353 (6.0%) |
| $2,500 to $4,999 | 189 (3.0%) | 148 (2.5%) |
| $5,000 to $7,499 | 271 (4.3%) | 302 (5.1%) |
| $7,500 to $9,999 | 433 (6.9%) | 375 (6.3%) |
| $10,000 to $12,499 | 133 (2.1%) | 483 (8.2%) |
| $12,500 to $14,999 | 136 (2.2%) | 115 (1.9%) |
| $15,000 to $17,499 | 59 (0.9%) | 402 (6.8%) |
| $17,500 to $19,999 | 105 (1.7%) | 103 (1.7%) |
| $20,000 to $22,499 | 89 (1.4%) | 233 (3.9%) |
| $22,500 to $24,999 | 165 (2.6%) | 312 (5.3%) |
| $25,000 to $29,999 | 448 (7.1%) | 610 (10.3%) |
| $30,000 to $34,999 | 447 (7.1%) | 481 (8.1%) |
| $35,000 to $39,999 | 488 (7.7%) | 479 (8.1%) |
| $40,000 to $44,999 | 359 (5.7%) | 448 (7.6%) |
| $45,000 to $49,999 | 369 (5.9%) | 213 (3.6%) |
| $50,000 to $54,999 | 362 (5.7%) | 208 (3.5%) |
| $55,000 to $64,999 | 488 (7.7%) | 253 (4.3%) |
| $65,000 to $74,999 | 247 (3.9%) | 208 (3.5%) |
| $75,000 to $99,999 | 532 (8.4%) | 126 (2.1%) |
| $100,000+ | 664 (10.5%) | 73 (1.2%) |
| Total | 6,302 (100.0%) | 5,925 (100.0%) |
Earnings by Sex by Educational Attainment in Dunklin County
Average earnings in Dunklin County are $43,432 for men and $28,739 for women, a difference of 33.8%. Men with an educational attainment of graduate degree enjoy the highest average annual earnings of $75,769, while those with less than high school education earn the least with $33,153. Women with an educational attainment of graduate degree earn the most with the average annual earnings of $50,066, while those with less than high school education have the smallest earnings of $16,329.
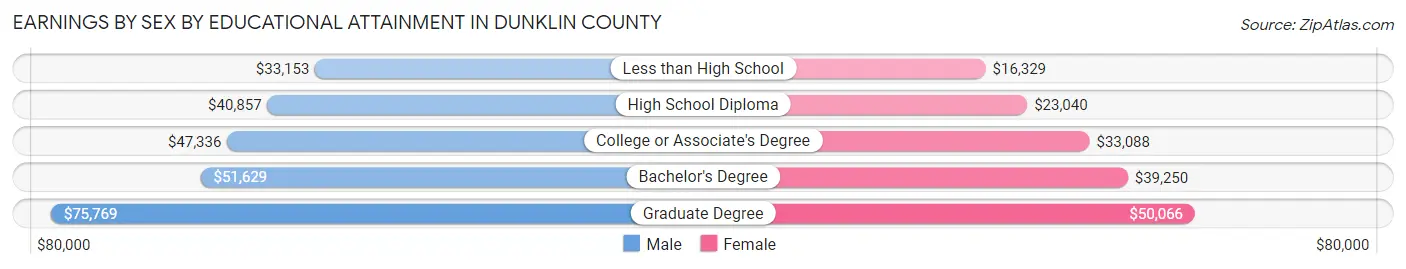
| Educational Attainment | Male Income | Female Income |
| Less than High School | $33,153 | $16,329 |
| High School Diploma | $40,857 | $23,040 |
| College or Associate's Degree | $47,336 | $33,088 |
| Bachelor's Degree | $51,629 | $39,250 |
| Graduate Degree | $75,769 | $50,066 |
| Total | $43,432 | $28,739 |
Family Income in Dunklin County
Family Income Brackets in Dunklin County
According to the Dunklin County family income data, there are 1,497 families falling into the $50,000 to $74,999 income range, which is the most common income bracket and makes up 21.1% of all families. Conversely, the $10,000 to $14,999 income bracket is the least frequent group with only 192 families (2.7%) belonging to this category.
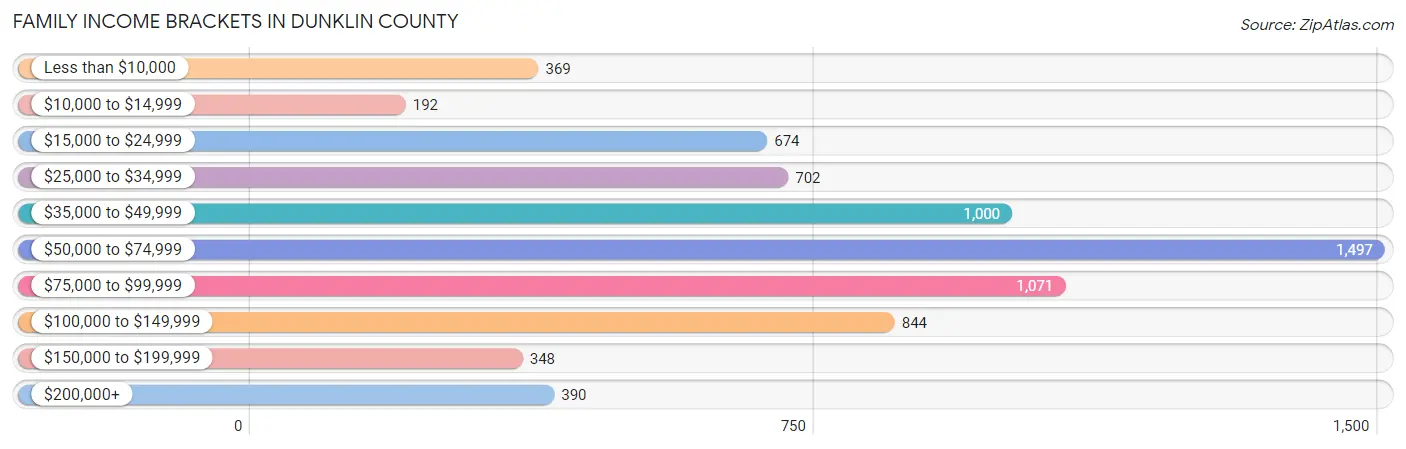
| Income Bracket | # Families | % Families |
| Less than $10,000 | 369 | 5.2% |
| $10,000 to $14,999 | 192 | 2.7% |
| $15,000 to $24,999 | 674 | 9.5% |
| $25,000 to $34,999 | 702 | 9.9% |
| $35,000 to $49,999 | 1,000 | 14.1% |
| $50,000 to $74,999 | 1,497 | 21.1% |
| $75,000 to $99,999 | 1,071 | 15.1% |
| $100,000 to $149,999 | 844 | 11.9% |
| $150,000 to $199,999 | 348 | 4.9% |
| $200,000+ | 390 | 5.5% |
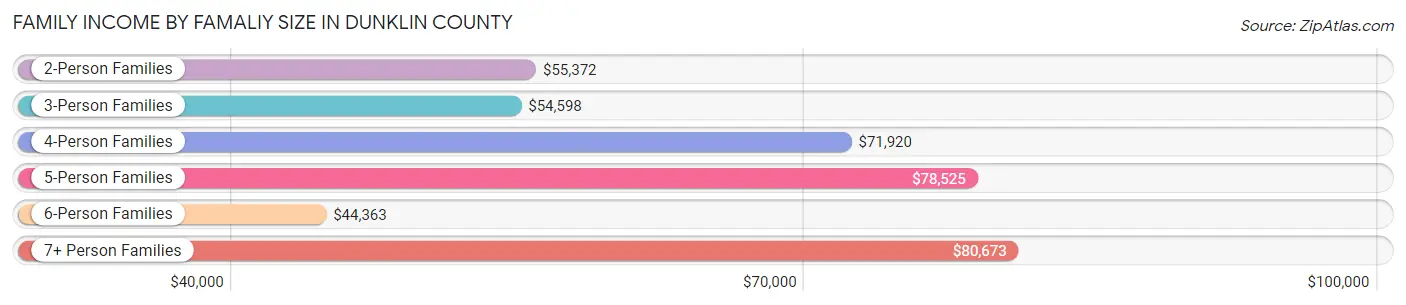
Family Income by Famaliy Size in Dunklin County
7+ person families (94 | 1.3%) account for the highest median family income in Dunklin County with $80,673 per family, while 2-person families (3,463 | 48.8%) have the highest median income of $27,686 per family member.
| Income Bracket | # Families | Median Income |
| 2-Person Families | 3,463 (48.8%) | $55,372 |
| 3-Person Families | 1,613 (22.7%) | $54,598 |
| 4-Person Families | 1,388 (19.6%) | $71,920 |
| 5-Person Families | 427 (6.0%) | $78,525 |
| 6-Person Families | 108 (1.5%) | $44,363 |
| 7+ Person Families | 94 (1.3%) | $80,673 |
| Total | 7,093 (100.0%) | $58,785 |
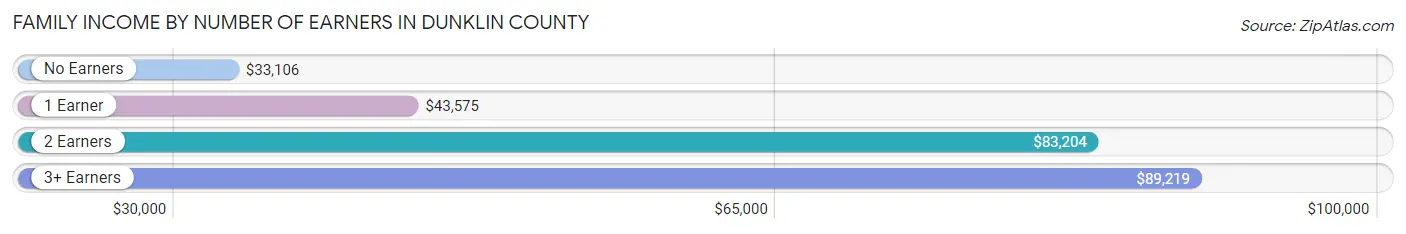
Family Income by Number of Earners in Dunklin County
The median family income in Dunklin County is $58,785, with families comprising 3+ earners (383) having the highest median family income of $89,219, while families with no earners (1,304) have the lowest median family income of $33,106, accounting for 5.4% and 18.4% of families, respectively.
| Number of Earners | # Families | Median Income |
| No Earners | 1,304 (18.4%) | $33,106 |
| 1 Earner | 2,769 (39.0%) | $43,575 |
| 2 Earners | 2,637 (37.2%) | $83,204 |
| 3+ Earners | 383 (5.4%) | $89,219 |
| Total | 7,093 (100.0%) | $58,785 |
Household Income in Dunklin County
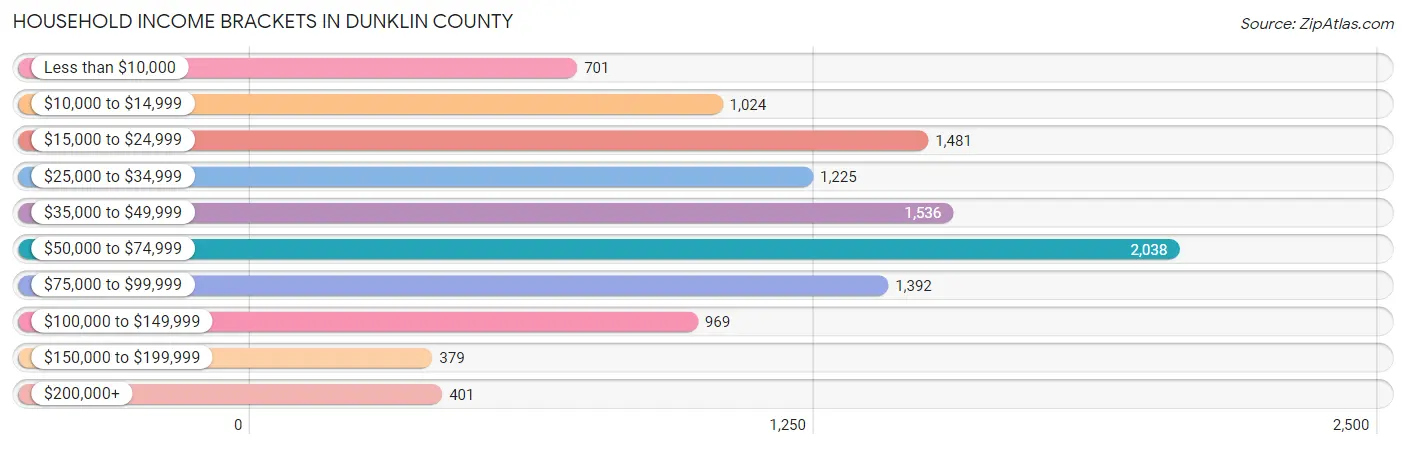
Household Income Brackets in Dunklin County
With 2,038 households falling in the category, the $50,000 to $74,999 income range is the most frequent in Dunklin County, accounting for 18.3% of all households. In contrast, only 379 households (3.4%) fall into the $150,000 to $199,999 income bracket, making it the least populous group.
| Income Bracket | # Households | % Households |
| Less than $10,000 | 701 | 6.3% |
| $10,000 to $14,999 | 1,024 | 9.2% |
| $15,000 to $24,999 | 1,481 | 13.3% |
| $25,000 to $34,999 | 1,225 | 11.0% |
| $35,000 to $49,999 | 1,536 | 13.8% |
| $50,000 to $74,999 | 2,038 | 18.3% |
| $75,000 to $99,999 | 1,392 | 12.5% |
| $100,000 to $149,999 | 969 | 8.7% |
| $150,000 to $199,999 | 379 | 3.4% |
| $200,000+ | 401 | 3.6% |
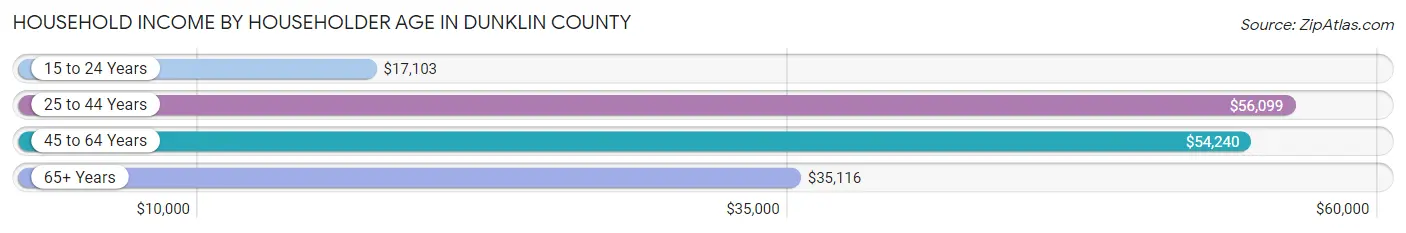
Household Income by Householder Age in Dunklin County
The median household income in Dunklin County is $44,868, with the highest median household income of $56,099 found in the 25 to 44 years age bracket for the primary householder. A total of 3,323 households (29.8%) fall into this category. Meanwhile, the 15 to 24 years age bracket for the primary householder has the lowest median household income of $17,103, with 618 households (5.6%) in this group.
| Income Bracket | # Households | Median Income |
| 15 to 24 Years | 618 (5.6%) | $17,103 |
| 25 to 44 Years | 3,323 (29.8%) | $56,099 |
| 45 to 64 Years | 3,987 (35.8%) | $54,240 |
| 65+ Years | 3,206 (28.8%) | $35,116 |
| Total | 11,134 (100.0%) | $44,868 |
Poverty in Dunklin County
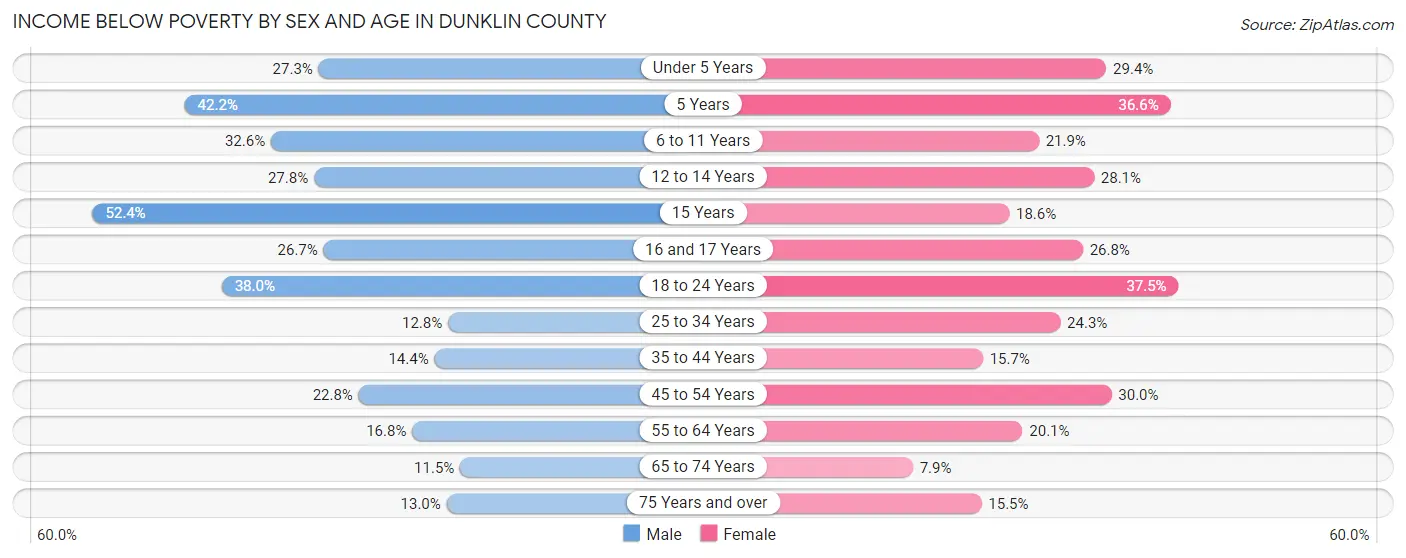
Income Below Poverty by Sex and Age in Dunklin County
With 21.7% poverty level for males and 22.3% for females among the residents of Dunklin County, 15 year old males and 18 to 24 year old females are the most vulnerable to poverty, with 43 males (52.4%) and 409 females (37.5%) in their respective age groups living below the poverty level.
| Age Bracket | Male | Female |
| Under 5 Years | 248 (27.3%) | 277 (29.4%) |
| 5 Years | 35 (42.2%) | 67 (36.6%) |
| 6 to 11 Years | 436 (32.6%) | 243 (21.9%) |
| 12 to 14 Years | 168 (27.8%) | 199 (28.1%) |
| 15 Years | 43 (52.4%) | 60 (18.6%) |
| 16 and 17 Years | 149 (26.7%) | 66 (26.8%) |
| 18 to 24 Years | 453 (38.0%) | 409 (37.5%) |
| 25 to 34 Years | 173 (12.8%) | 405 (24.3%) |
| 35 to 44 Years | 217 (14.3%) | 258 (15.7%) |
| 45 to 54 Years | 355 (22.8%) | 501 (30.0%) |
| 55 to 64 Years | 302 (16.8%) | 388 (20.1%) |
| 65 to 74 Years | 150 (11.5%) | 125 (7.9%) |
| 75 Years and over | 97 (13.0%) | 195 (15.5%) |
| Total | 2,826 (21.7%) | 3,193 (22.3%) |
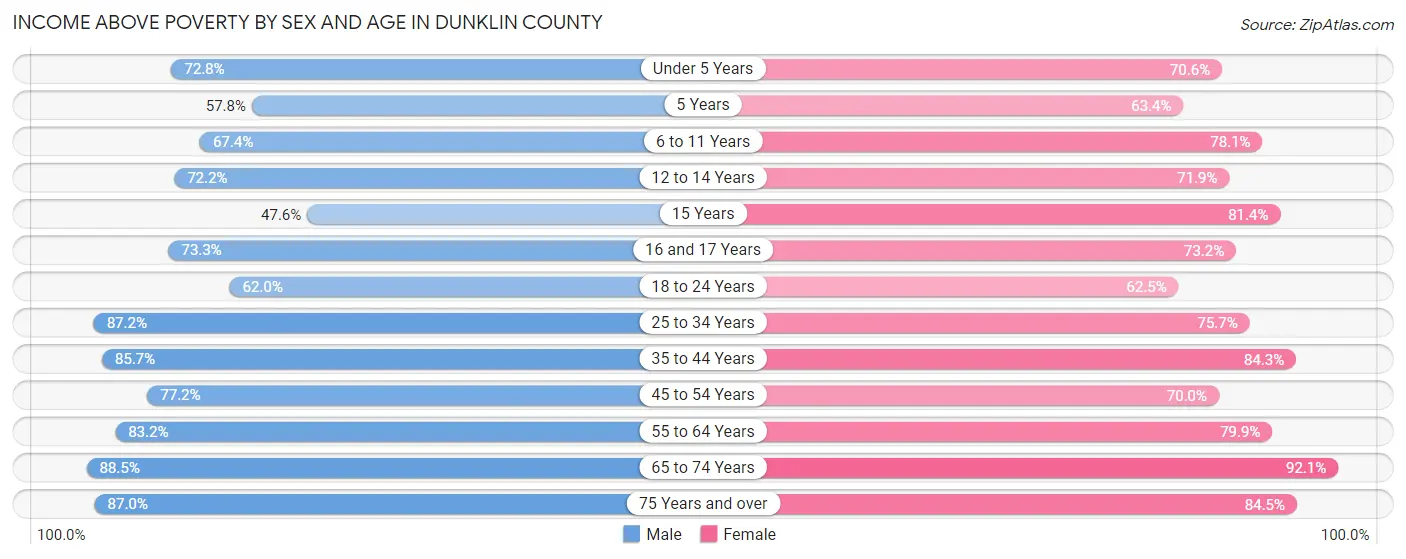
Income Above Poverty by Sex and Age in Dunklin County
According to the poverty statistics in Dunklin County, males aged 65 to 74 years and females aged 65 to 74 years are the age groups that are most secure financially, with 88.5% of males and 92.1% of females in these age groups living above the poverty line.
| Age Bracket | Male | Female |
| Under 5 Years | 662 (72.8%) | 664 (70.6%) |
| 5 Years | 48 (57.8%) | 116 (63.4%) |
| 6 to 11 Years | 903 (67.4%) | 865 (78.1%) |
| 12 to 14 Years | 437 (72.2%) | 510 (71.9%) |
| 15 Years | 39 (47.6%) | 262 (81.4%) |
| 16 and 17 Years | 409 (73.3%) | 180 (73.2%) |
| 18 to 24 Years | 738 (62.0%) | 682 (62.5%) |
| 25 to 34 Years | 1,174 (87.2%) | 1,260 (75.7%) |
| 35 to 44 Years | 1,295 (85.7%) | 1,386 (84.3%) |
| 45 to 54 Years | 1,203 (77.2%) | 1,168 (70.0%) |
| 55 to 64 Years | 1,492 (83.2%) | 1,541 (79.9%) |
| 65 to 74 Years | 1,155 (88.5%) | 1,457 (92.1%) |
| 75 Years and over | 649 (87.0%) | 1,060 (84.5%) |
| Total | 10,204 (78.3%) | 11,151 (77.7%) |
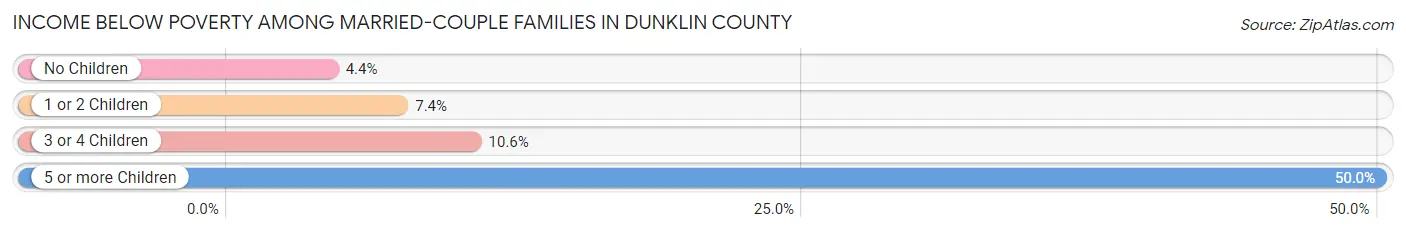
Income Below Poverty Among Married-Couple Families in Dunklin County
The poverty statistics for married-couple families in Dunklin County show that 5.8% or 262 of the total 4,489 families live below the poverty line. Families with 5 or more children have the highest poverty rate of 50.0%, comprising of 3 families. On the other hand, families with no children have the lowest poverty rate of 4.4%, which includes 119 families.
| Children | Above Poverty | Below Poverty |
| No Children | 2,597 (95.6%) | 119 (4.4%) |
| 1 or 2 Children | 1,374 (92.6%) | 110 (7.4%) |
| 3 or 4 Children | 253 (89.4%) | 30 (10.6%) |
| 5 or more Children | 3 (50.0%) | 3 (50.0%) |
| Total | 4,227 (94.2%) | 262 (5.8%) |
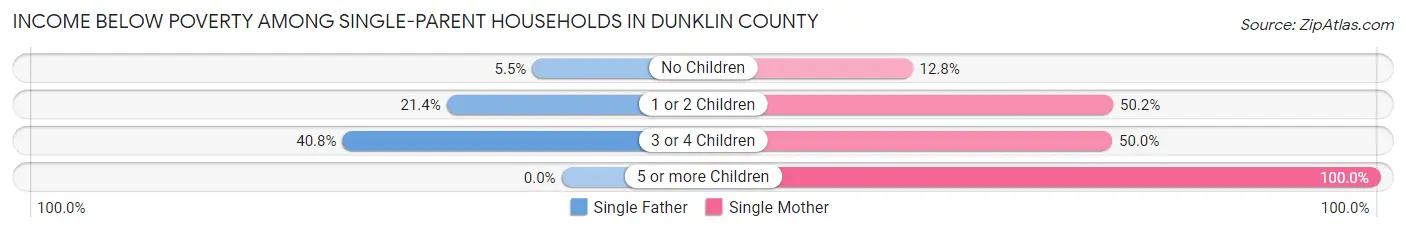
Income Below Poverty Among Single-Parent Households in Dunklin County
According to the poverty data in Dunklin County, 17.4% or 157 single-father households and 38.7% or 658 single-mother households are living below the poverty line. Among single-father households, those with 3 or 4 children have the highest poverty rate, with 40 households (40.8%) experiencing poverty. Likewise, among single-mother households, those with 5 or more children have the highest poverty rate, with 7 households (100.0%) falling below the poverty line.
| Children | Single Father | Single Mother |
| No Children | 19 (5.5%) | 68 (12.8%) |
| 1 or 2 Children | 98 (21.4%) | 423 (50.2%) |
| 3 or 4 Children | 40 (40.8%) | 160 (50.0%) |
| 5 or more Children | 0 (0.0%) | 7 (100.0%) |
| Total | 157 (17.4%) | 658 (38.7%) |
Income Below Poverty Among Married-Couple vs Single-Parent Households in Dunklin County
The poverty data for Dunklin County shows that 262 of the married-couple family households (5.8%) and 815 of the single-parent households (31.3%) are living below the poverty level. Within the married-couple family households, those with 5 or more children have the highest poverty rate, with 3 households (50.0%) falling below the poverty line. Among the single-parent households, those with 5 or more children have the highest poverty rate, with 7 household (100.0%) living below poverty.
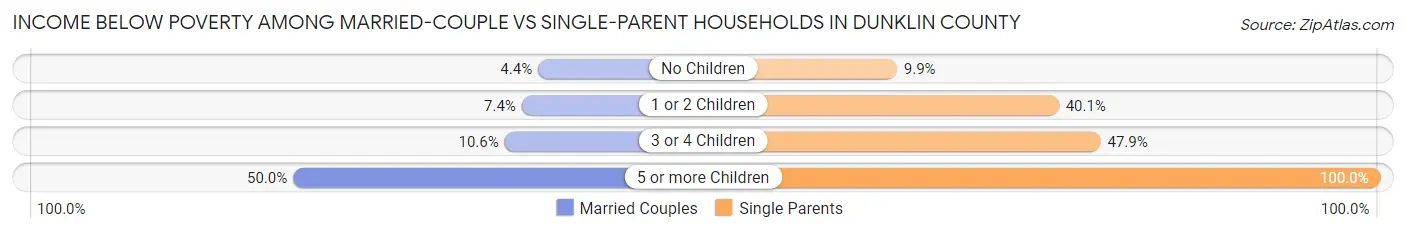
| Children | Married-Couple Families | Single-Parent Households |
| No Children | 119 (4.4%) | 87 (9.9%) |
| 1 or 2 Children | 110 (7.4%) | 521 (40.1%) |
| 3 or 4 Children | 30 (10.6%) | 200 (47.8%) |
| 5 or more Children | 3 (50.0%) | 7 (100.0%) |
| Total | 262 (5.8%) | 815 (31.3%) |
Race in Dunklin County
The most populous races in Dunklin County are White / Caucasian (22,593 | 80.2%), Two or more Races (3,016 | 10.7%), and Black / African American (2,219 | 7.9%).
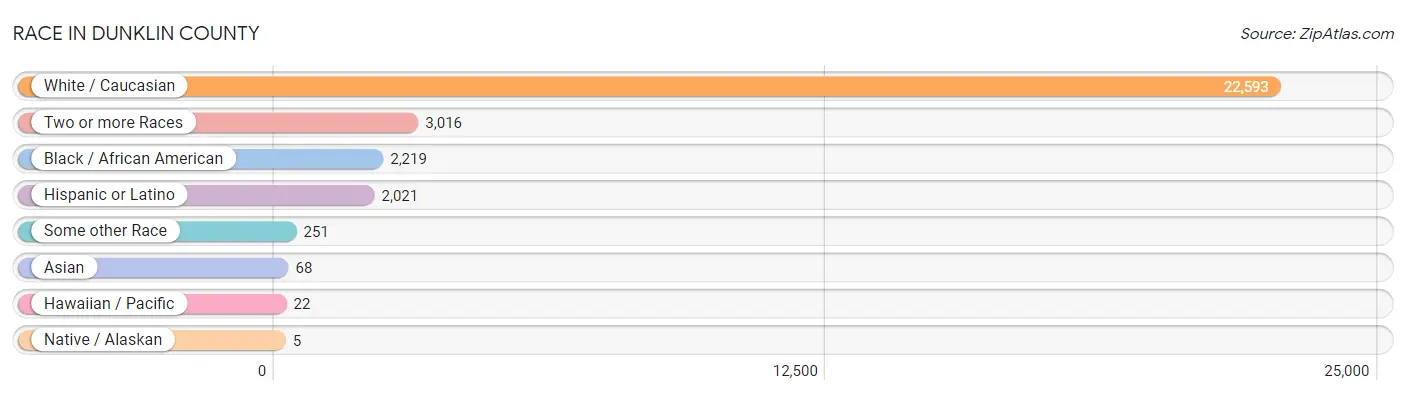
| Race | # Population | % Population |
| Asian | 68 | 0.2% |
| Black / African American | 2,219 | 7.9% |
| Hawaiian / Pacific | 22 | 0.1% |
| Hispanic or Latino | 2,021 | 7.2% |
| Native / Alaskan | 5 | 0.0% |
| White / Caucasian | 22,593 | 80.2% |
| Two or more Races | 3,016 | 10.7% |
| Some other Race | 251 | 0.9% |
| Total | 28,174 | 100.0% |
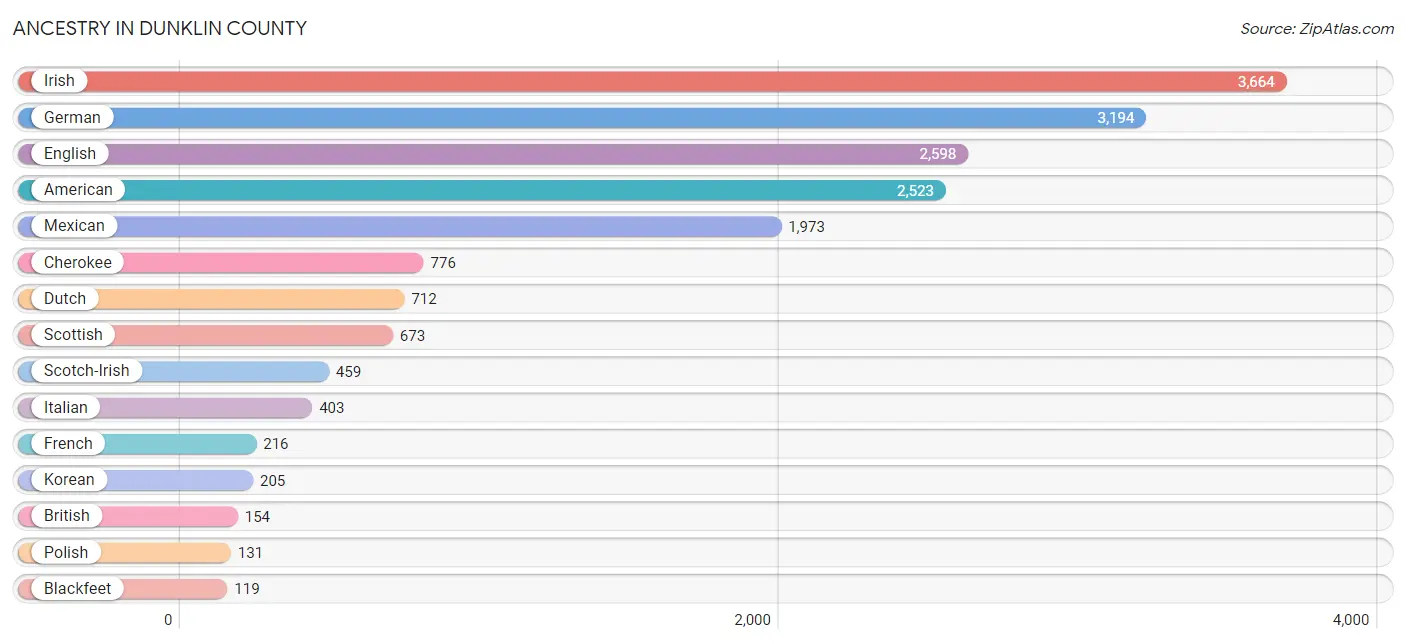
Ancestry in Dunklin County
The most populous ancestries reported in Dunklin County are Irish (3,664 | 13.0%), German (3,194 | 11.3%), English (2,598 | 9.2%), American (2,523 | 9.0%), and Mexican (1,973 | 7.0%), together accounting for 49.5% of all Dunklin County residents.
| Ancestry | # Population | % Population |
| African | 23 | 0.1% |
| American | 2,523 | 9.0% |
| Apache | 4 | 0.0% |
| Arab | 12 | 0.0% |
| Austrian | 7 | 0.0% |
| Bhutanese | 17 | 0.1% |
| Blackfeet | 119 | 0.4% |
| Brazilian | 8 | 0.0% |
| British | 154 | 0.5% |
| Burmese | 20 | 0.1% |
| Cherokee | 776 | 2.8% |
| Cheyenne | 57 | 0.2% |
| Choctaw | 31 | 0.1% |
| Creek | 46 | 0.2% |
| Cuban | 8 | 0.0% |
| Czech | 7 | 0.0% |
| Czechoslovakian | 11 | 0.0% |
| Danish | 42 | 0.2% |
| Dominican | 23 | 0.1% |
| Dutch | 712 | 2.5% |
| Dutch West Indian | 60 | 0.2% |
| English | 2,598 | 9.2% |
| European | 103 | 0.4% |
| French | 216 | 0.8% |
| French American Indian | 10 | 0.0% |
| French Canadian | 82 | 0.3% |
| German | 3,194 | 11.3% |
| Greek | 61 | 0.2% |
| Hungarian | 111 | 0.4% |
| Indian (Asian) | 8 | 0.0% |
| Irish | 3,664 | 13.0% |
| Italian | 403 | 1.4% |
| Korean | 205 | 0.7% |
| Lebanese | 12 | 0.0% |
| Lithuanian | 37 | 0.1% |
| Mexican | 1,973 | 7.0% |
| Mexican American Indian | 4 | 0.0% |
| Navajo | 2 | 0.0% |
| Northern European | 11 | 0.0% |
| Norwegian | 51 | 0.2% |
| Polish | 131 | 0.5% |
| Portuguese | 5 | 0.0% |
| Potawatomi | 1 | 0.0% |
| Puerto Rican | 5 | 0.0% |
| Russian | 34 | 0.1% |
| Samoan | 22 | 0.1% |
| Scandinavian | 94 | 0.3% |
| Scotch-Irish | 459 | 1.6% |
| Scottish | 673 | 2.4% |
| Sioux | 2 | 0.0% |
| Spaniard | 6 | 0.0% |
| Spanish | 6 | 0.0% |
| Subsaharan African | 23 | 0.1% |
| Swedish | 27 | 0.1% |
| Thai | 7 | 0.0% |
| Turkish | 8 | 0.0% |
| Welsh | 37 | 0.1% | View All 57 Rows |
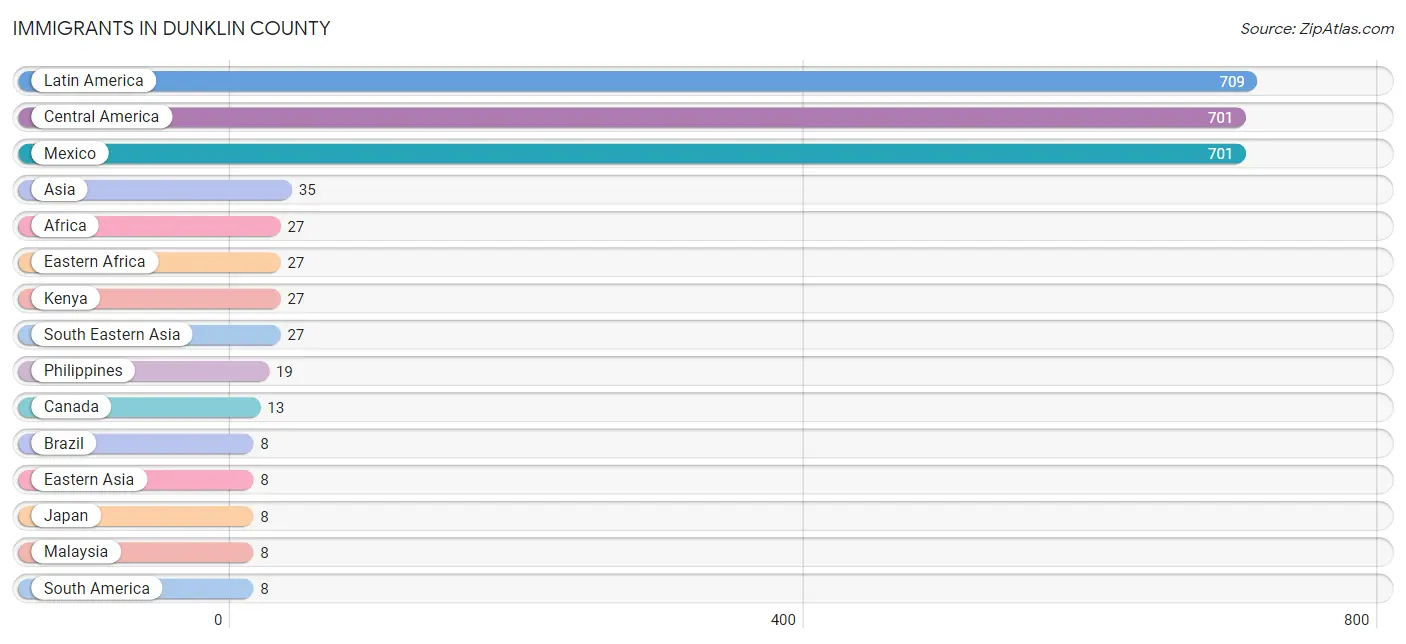
Immigrants in Dunklin County
The most numerous immigrant groups reported in Dunklin County came from Latin America (709 | 2.5%), Central America (701 | 2.5%), Mexico (701 | 2.5%), Asia (35 | 0.1%), and Africa (27 | 0.1%), together accounting for 7.7% of all Dunklin County residents.
| Immigration Origin | # Population | % Population |
| Africa | 27 | 0.1% |
| Asia | 35 | 0.1% |
| Brazil | 8 | 0.0% |
| Canada | 13 | 0.1% |
| Central America | 701 | 2.5% |
| Eastern Africa | 27 | 0.1% |
| Eastern Asia | 8 | 0.0% |
| Europe | 5 | 0.0% |
| Germany | 1 | 0.0% |
| Greece | 4 | 0.0% |
| Japan | 8 | 0.0% |
| Kenya | 27 | 0.1% |
| Latin America | 709 | 2.5% |
| Malaysia | 8 | 0.0% |
| Mexico | 701 | 2.5% |
| Philippines | 19 | 0.1% |
| South America | 8 | 0.0% |
| South Eastern Asia | 27 | 0.1% |
| Southern Europe | 4 | 0.0% |
| Western Europe | 1 | 0.0% | View All 20 Rows |
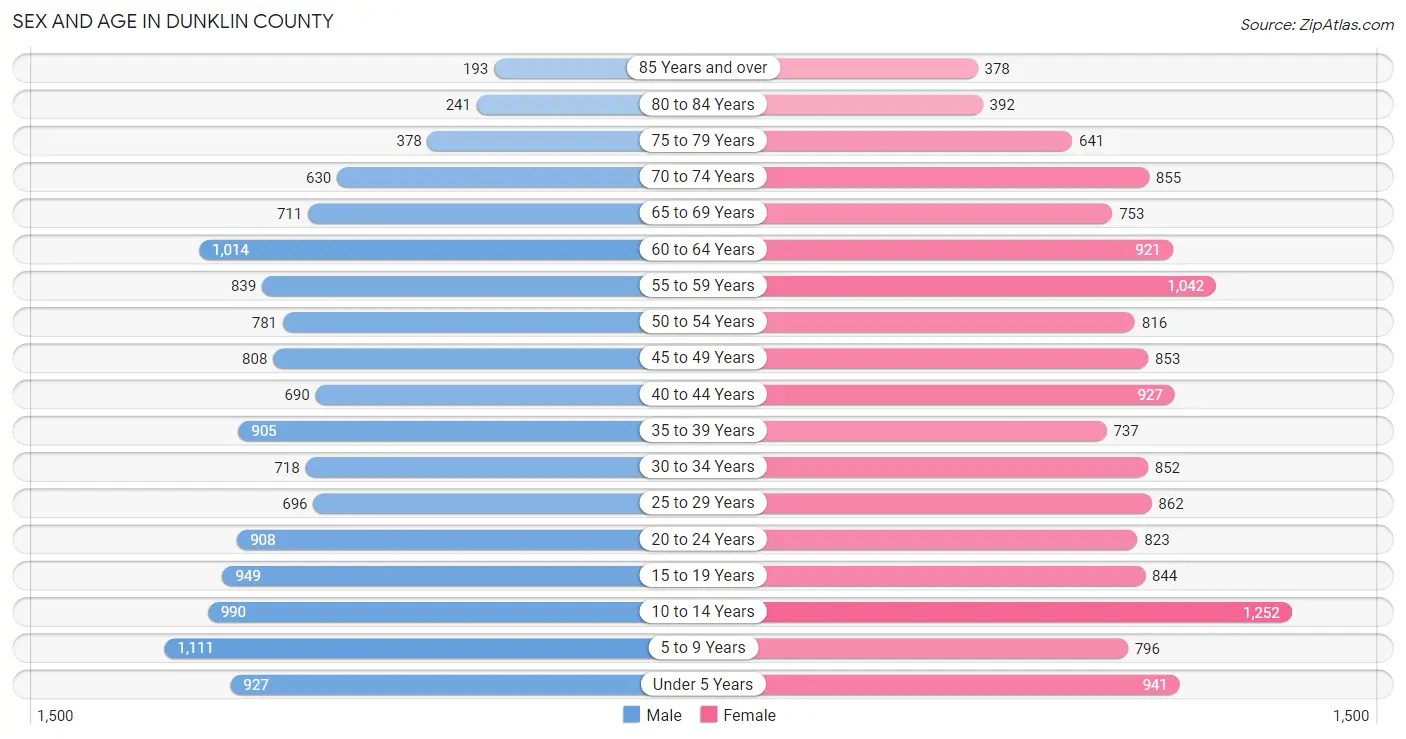
Sex and Age in Dunklin County
Sex and Age in Dunklin County
The most populous age groups in Dunklin County are 5 to 9 Years (1,111 | 8.2%) for men and 10 to 14 Years (1,252 | 8.5%) for women.
| Age Bracket | Male | Female |
| Under 5 Years | 927 (6.9%) | 941 (6.4%) |
| 5 to 9 Years | 1,111 (8.2%) | 796 (5.4%) |
| 10 to 14 Years | 990 (7.3%) | 1,252 (8.5%) |
| 15 to 19 Years | 949 (7.0%) | 844 (5.8%) |
| 20 to 24 Years | 908 (6.7%) | 823 (5.6%) |
| 25 to 29 Years | 696 (5.2%) | 862 (5.9%) |
| 30 to 34 Years | 718 (5.3%) | 852 (5.8%) |
| 35 to 39 Years | 905 (6.7%) | 737 (5.0%) |
| 40 to 44 Years | 690 (5.1%) | 927 (6.3%) |
| 45 to 49 Years | 808 (6.0%) | 853 (5.8%) |
| 50 to 54 Years | 781 (5.8%) | 816 (5.6%) |
| 55 to 59 Years | 839 (6.2%) | 1,042 (7.1%) |
| 60 to 64 Years | 1,014 (7.5%) | 921 (6.3%) |
| 65 to 69 Years | 711 (5.3%) | 753 (5.1%) |
| 70 to 74 Years | 630 (4.7%) | 855 (5.8%) |
| 75 to 79 Years | 378 (2.8%) | 641 (4.4%) |
| 80 to 84 Years | 241 (1.8%) | 392 (2.7%) |
| 85 Years and over | 193 (1.4%) | 378 (2.6%) |
| Total | 13,489 (100.0%) | 14,685 (100.0%) |
Families and Households in Dunklin County
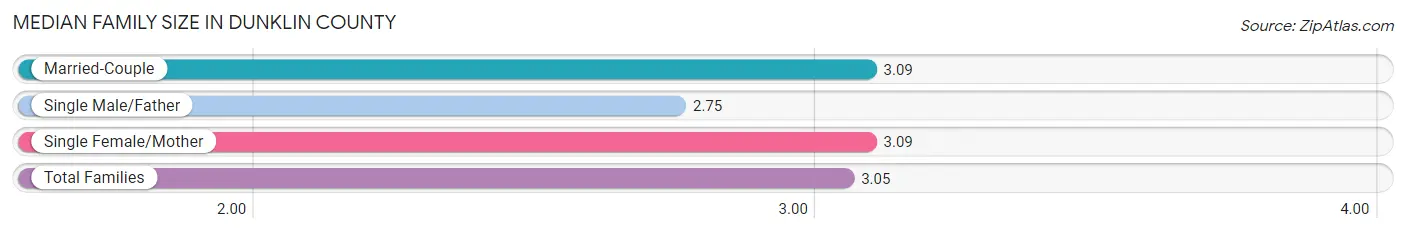
Median Family Size in Dunklin County
The median family size in Dunklin County is 3.05 persons per family, with married-couple families (4,489 | 63.3%) accounting for the largest median family size of 3.09 persons per family. On the other hand, single male/father families (904 | 12.7%) represent the smallest median family size with 2.75 persons per family.
| Family Type | # Families | Family Size |
| Married-Couple | 4,489 (63.3%) | 3.09 |
| Single Male/Father | 904 (12.7%) | 2.75 |
| Single Female/Mother | 1,700 (24.0%) | 3.09 |
| Total Families | 7,093 (100.0%) | 3.05 |
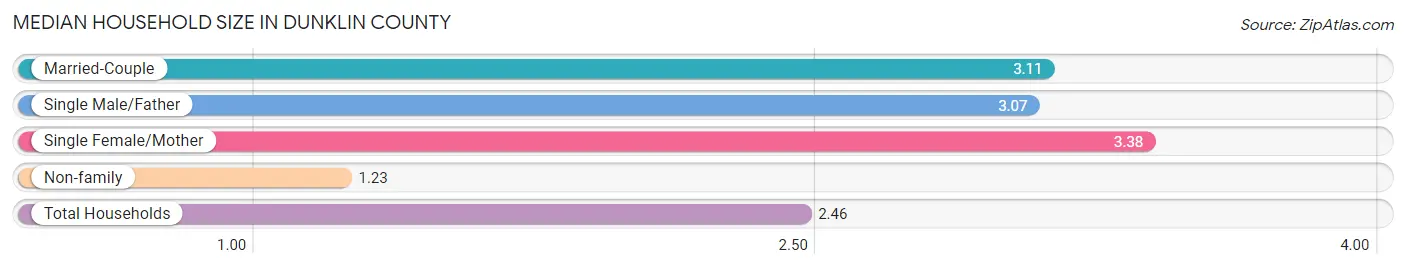
Median Household Size in Dunklin County
The median household size in Dunklin County is 2.46 persons per household, with single female/mother households (1,700 | 15.3%) accounting for the largest median household size of 3.38 persons per household. non-family households (4,041 | 36.3%) represent the smallest median household size with 1.23 persons per household.
| Household Type | # Households | Household Size |
| Married-Couple | 4,489 (40.3%) | 3.11 |
| Single Male/Father | 904 (8.1%) | 3.07 |
| Single Female/Mother | 1,700 (15.3%) | 3.38 |
| Non-family | 4,041 (36.3%) | 1.23 |
| Total Households | 11,134 (100.0%) | 2.46 |
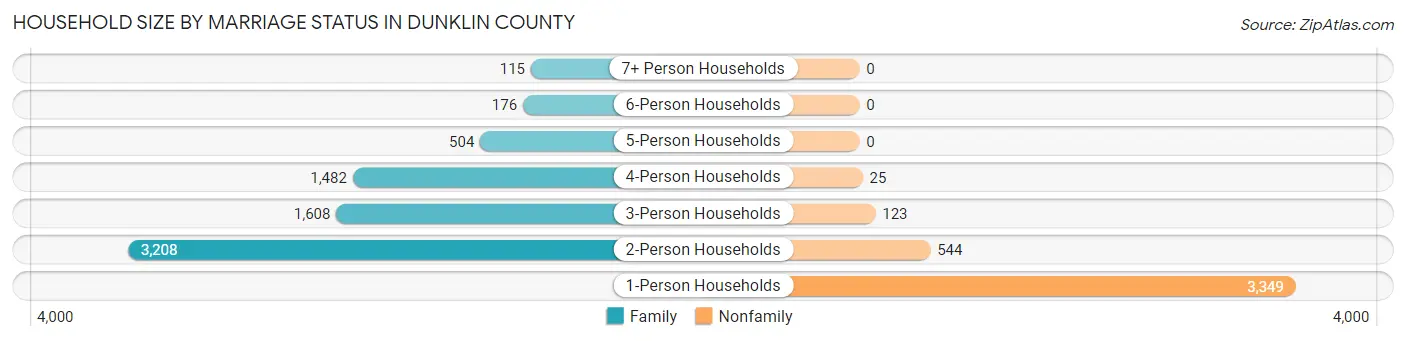
Household Size by Marriage Status in Dunklin County
Out of a total of 11,134 households in Dunklin County, 7,093 (63.7%) are family households, while 4,041 (36.3%) are nonfamily households. The most numerous type of family households are 2-person households, comprising 3,208, and the most common type of nonfamily households are 1-person households, comprising 3,349.
| Household Size | Family Households | Nonfamily Households |
| 1-Person Households | - | 3,349 (30.1%) |
| 2-Person Households | 3,208 (28.8%) | 544 (4.9%) |
| 3-Person Households | 1,608 (14.4%) | 123 (1.1%) |
| 4-Person Households | 1,482 (13.3%) | 25 (0.2%) |
| 5-Person Households | 504 (4.5%) | 0 (0.0%) |
| 6-Person Households | 176 (1.6%) | 0 (0.0%) |
| 7+ Person Households | 115 (1.0%) | 0 (0.0%) |
| Total | 7,093 (63.7%) | 4,041 (36.3%) |
Female Fertility in Dunklin County
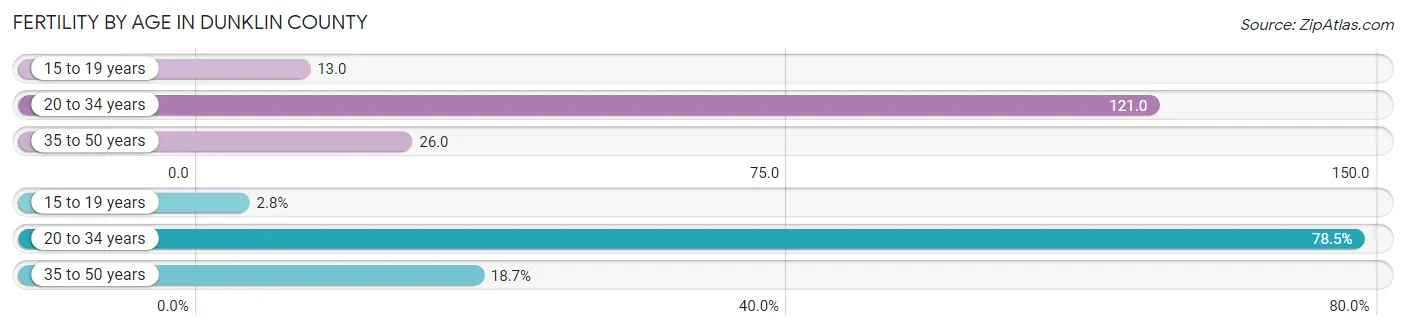
Fertility by Age in Dunklin County
Average fertility rate in Dunklin County is 64.0 births per 1,000 women. Women in the age bracket of 20 to 34 years have the highest fertility rate with 121.0 births per 1,000 women. Women in the age bracket of 20 to 34 years acount for 78.5% of all women with births.
| Age Bracket | Women with Births | Births / 1,000 Women |
| 15 to 19 years | 11 (2.8%) | 13.0 |
| 20 to 34 years | 306 (78.5%) | 121.0 |
| 35 to 50 years | 73 (18.7%) | 26.0 |
| Total | 390 (100.0%) | 64.0 |
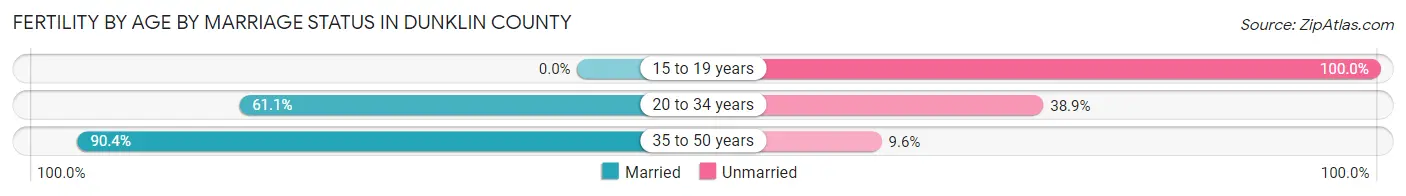
Fertility by Age by Marriage Status in Dunklin County
64.9% of women with births (390) in Dunklin County are married. The highest percentage of unmarried women with births falls into 15 to 19 years age bracket with 100.0% of them unmarried at the time of birth, while the lowest percentage of unmarried women with births belong to 35 to 50 years age bracket with 9.6% of them unmarried.
| Age Bracket | Married | Unmarried |
| 15 to 19 years | 0 (0.0%) | 11 (100.0%) |
| 20 to 34 years | 187 (61.1%) | 119 (38.9%) |
| 35 to 50 years | 66 (90.4%) | 7 (9.6%) |
| Total | 253 (64.9%) | 137 (35.1%) |
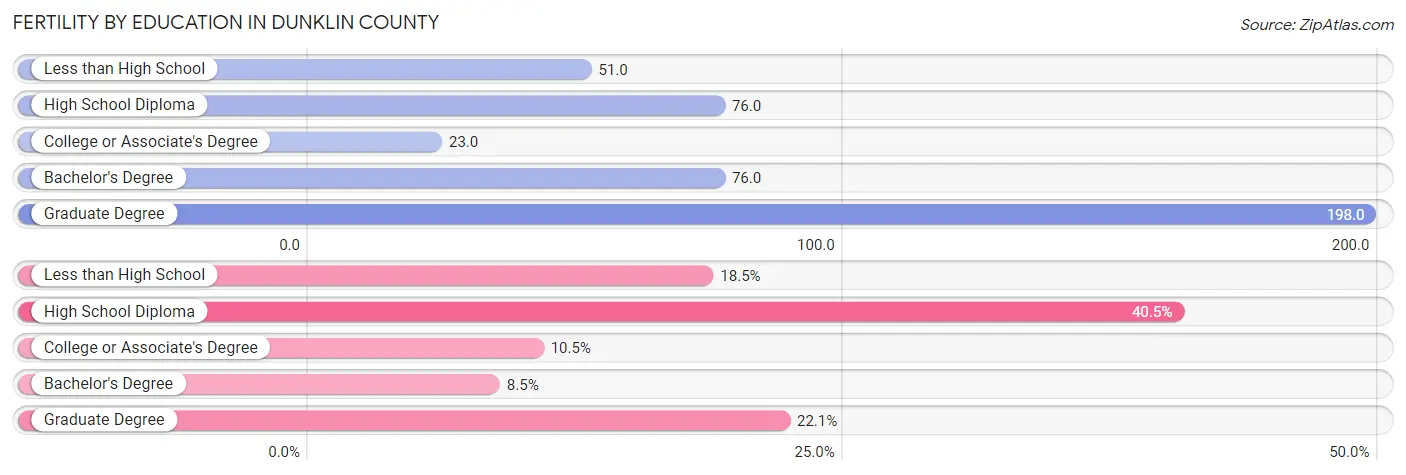
Fertility by Education in Dunklin County
Average fertility rate in Dunklin County is 64.0 births per 1,000 women. Women with the education attainment of graduate degree have the highest fertility rate of 198.0 births per 1,000 women, while women with the education attainment of college or associate's degree have the lowest fertility at 23.0 births per 1,000 women. Women with the education attainment of high school diploma represent 40.5% of all women with births.
| Educational Attainment | Women with Births | Births / 1,000 Women |
| Less than High School | 72 (18.5%) | 51.0 |
| High School Diploma | 158 (40.5%) | 76.0 |
| College or Associate's Degree | 41 (10.5%) | 23.0 |
| Bachelor's Degree | 33 (8.5%) | 76.0 |
| Graduate Degree | 86 (22.1%) | 198.0 |
| Total | 390 (100.0%) | 64.0 |
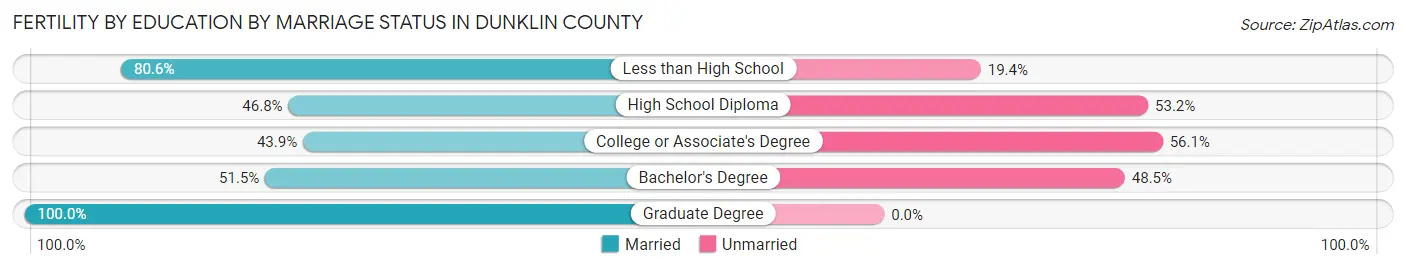
Fertility by Education by Marriage Status in Dunklin County
35.1% of women with births in Dunklin County are unmarried. Women with the educational attainment of graduate degree are most likely to be married with 100.0% of them married at childbirth, while women with the educational attainment of college or associate's degree are least likely to be married with 56.1% of them unmarried at childbirth.
| Educational Attainment | Married | Unmarried |
| Less than High School | 58 (80.6%) | 14 (19.4%) |
| High School Diploma | 74 (46.8%) | 84 (53.2%) |
| College or Associate's Degree | 18 (43.9%) | 23 (56.1%) |
| Bachelor's Degree | 17 (51.5%) | 16 (48.5%) |
| Graduate Degree | 86 (100.0%) | 0 (0.0%) |
| Total | 253 (64.9%) | 137 (35.1%) |
Employment Characteristics in Dunklin County
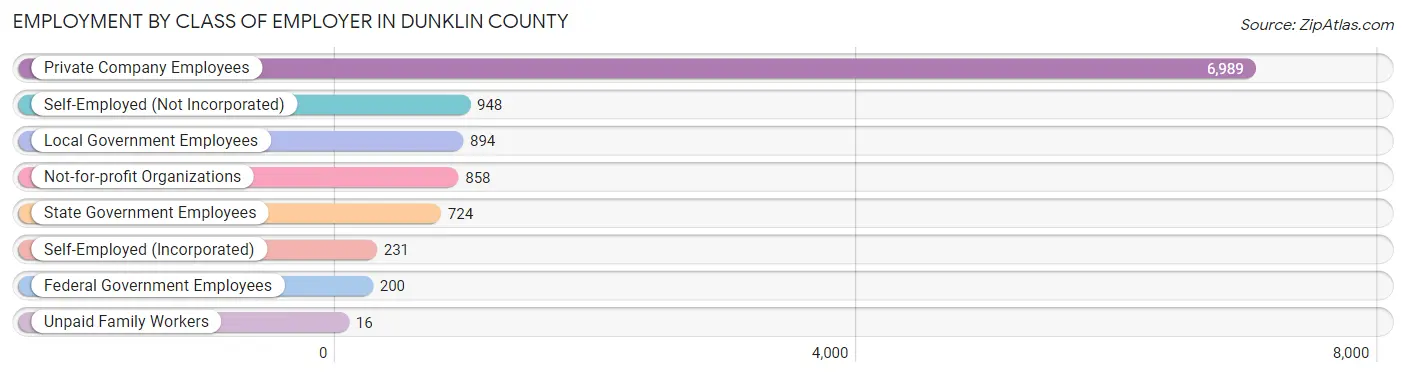
Employment by Class of Employer in Dunklin County
Among the 10,860 employed individuals in Dunklin County, private company employees (6,989 | 64.4%), self-employed (not incorporated) (948 | 8.7%), and local government employees (894 | 8.2%) make up the most common classes of employment.
| Employer Class | # Employees | % Employees |
| Private Company Employees | 6,989 | 64.4% |
| Self-Employed (Incorporated) | 231 | 2.1% |
| Self-Employed (Not Incorporated) | 948 | 8.7% |
| Not-for-profit Organizations | 858 | 7.9% |
| Local Government Employees | 894 | 8.2% |
| State Government Employees | 724 | 6.7% |
| Federal Government Employees | 200 | 1.8% |
| Unpaid Family Workers | 16 | 0.2% |
| Total | 10,860 | 100.0% |
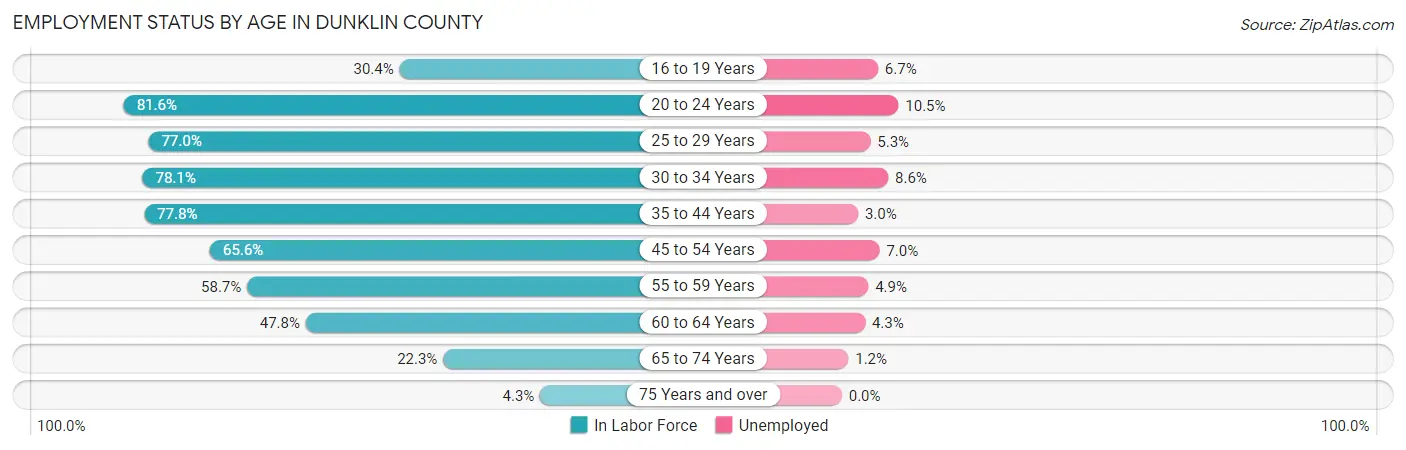
Employment Status by Age in Dunklin County
According to the labor force statistics for Dunklin County, out of the total population over 16 years of age (21,747), 53.9% or 11,722 individuals are in the labor force, with 5.7% or 668 of them unemployed. The age group with the highest labor force participation rate is 20 to 24 years, with 81.6% or 1,412 individuals in the labor force. Within the labor force, the 20 to 24 years age range has the highest percentage of unemployed individuals, with 10.5% or 148 of them being unemployed.
| Age Bracket | In Labor Force | Unemployed |
| 16 to 19 Years | 420 (30.4%) | 28 (6.7%) |
| 20 to 24 Years | 1,412 (81.6%) | 148 (10.5%) |
| 25 to 29 Years | 1,200 (77.0%) | 64 (5.3%) |
| 30 to 34 Years | 1,226 (78.1%) | 105 (8.6%) |
| 35 to 44 Years | 2,536 (77.8%) | 76 (3.0%) |
| 45 to 54 Years | 2,137 (65.6%) | 150 (7.0%) |
| 55 to 59 Years | 1,104 (58.7%) | 54 (4.9%) |
| 60 to 64 Years | 925 (47.8%) | 40 (4.3%) |
| 65 to 74 Years | 658 (22.3%) | 8 (1.2%) |
| 75 Years and over | 96 (4.3%) | 0 (0.0%) |
| Total | 11,722 (53.9%) | 668 (5.7%) |
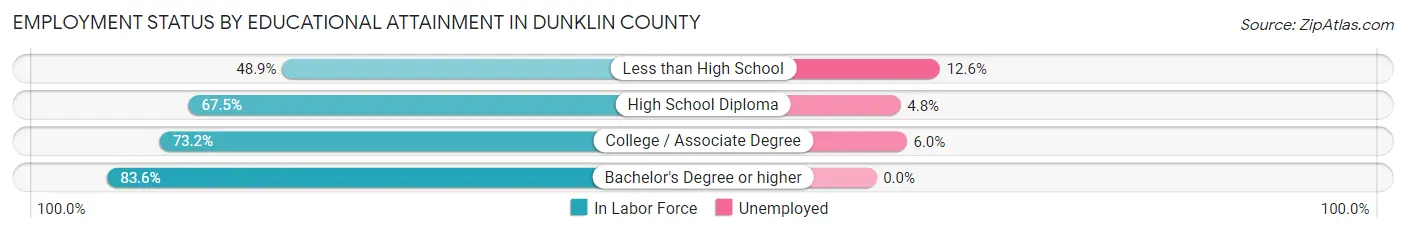
Employment Status by Educational Attainment in Dunklin County
According to labor force statistics for Dunklin County, 67.8% of individuals (9,127) out of the total population between 25 and 64 years of age (13,461) are in the labor force, with 5.3% or 484 of them being unemployed. The group with the highest labor force participation rate are those with the educational attainment of bachelor's degree or higher, with 83.6% or 1,595 individuals in the labor force. Within the labor force, individuals with less than high school education have the highest percentage of unemployment, with 12.6% or 151 of them being unemployed.
| Educational Attainment | In Labor Force | Unemployed |
| Less than High School | 1,202 (48.9%) | 310 (12.6%) |
| High School Diploma | 3,908 (67.5%) | 278 (4.8%) |
| College / Associate Degree | 2,419 (73.2%) | 198 (6.0%) |
| Bachelor's Degree or higher | 1,595 (83.6%) | 0 (0.0%) |
| Total | 9,127 (67.8%) | 713 (5.3%) |
Employment Occupations by Sex in Dunklin County
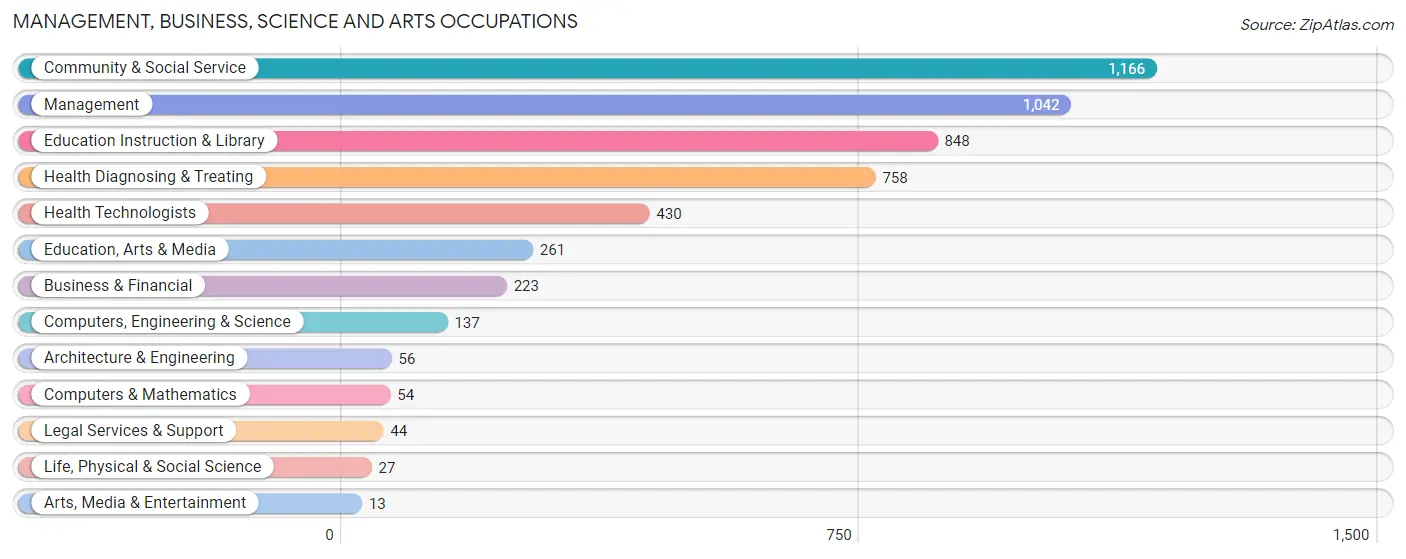
Management, Business, Science and Arts Occupations
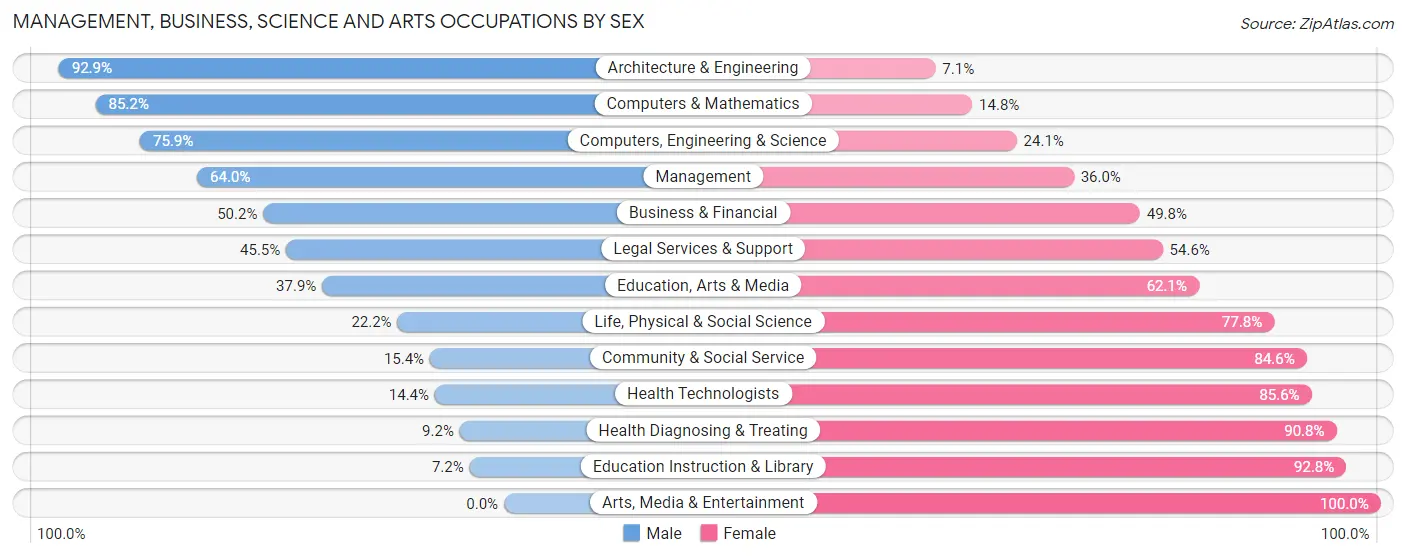
The most common Management, Business, Science and Arts occupations in Dunklin County are Community & Social Service (1,166 | 10.6%), Management (1,042 | 9.4%), Education Instruction & Library (848 | 7.7%), Health Diagnosing & Treating (758 | 6.9%), and Health Technologists (430 | 3.9%).
Management, Business, Science and Arts Occupations by Sex
Within the Management, Business, Science and Arts occupations in Dunklin County, the most male-oriented occupations are Architecture & Engineering (92.9%), Computers & Mathematics (85.2%), and Computers, Engineering & Science (75.9%), while the most female-oriented occupations are Arts, Media & Entertainment (100.0%), Education Instruction & Library (92.8%), and Health Diagnosing & Treating (90.8%).
| Occupation | Male | Female |
| Management | 667 (64.0%) | 375 (36.0%) |
| Business & Financial | 112 (50.2%) | 111 (49.8%) |
| Computers, Engineering & Science | 104 (75.9%) | 33 (24.1%) |
| Computers & Mathematics | 46 (85.2%) | 8 (14.8%) |
| Architecture & Engineering | 52 (92.9%) | 4 (7.1%) |
| Life, Physical & Social Science | 6 (22.2%) | 21 (77.8%) |
| Community & Social Service | 180 (15.4%) | 986 (84.6%) |
| Education, Arts & Media | 99 (37.9%) | 162 (62.1%) |
| Legal Services & Support | 20 (45.5%) | 24 (54.5%) |
| Education Instruction & Library | 61 (7.2%) | 787 (92.8%) |
| Arts, Media & Entertainment | 0 (0.0%) | 13 (100.0%) |
| Health Diagnosing & Treating | 70 (9.2%) | 688 (90.8%) |
| Health Technologists | 62 (14.4%) | 368 (85.6%) |
| Total (Category) | 1,133 (34.1%) | 2,193 (65.9%) |
| Total (Overall) | 5,676 (51.4%) | 5,367 (48.6%) |
Services Occupations
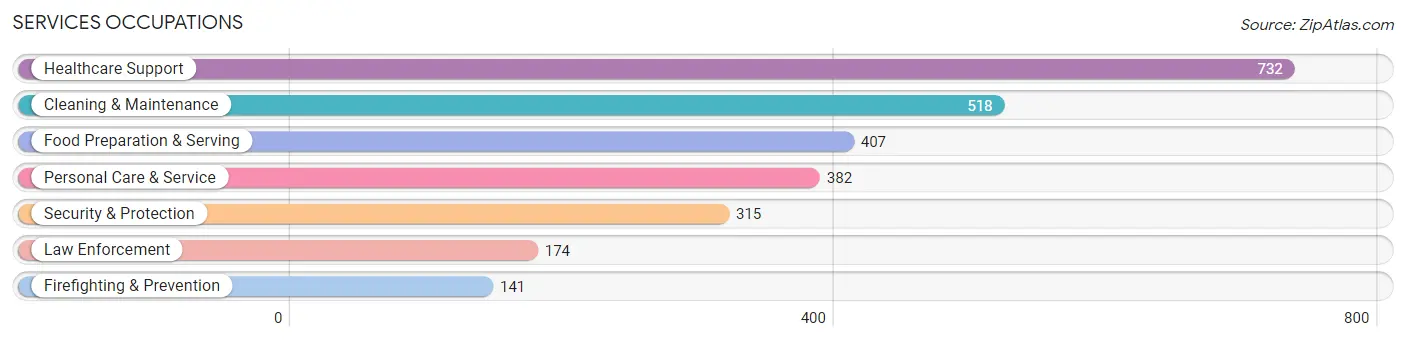
The most common Services occupations in Dunklin County are Healthcare Support (732 | 6.6%), Cleaning & Maintenance (518 | 4.7%), Food Preparation & Serving (407 | 3.7%), Personal Care & Service (382 | 3.5%), and Security & Protection (315 | 2.9%).
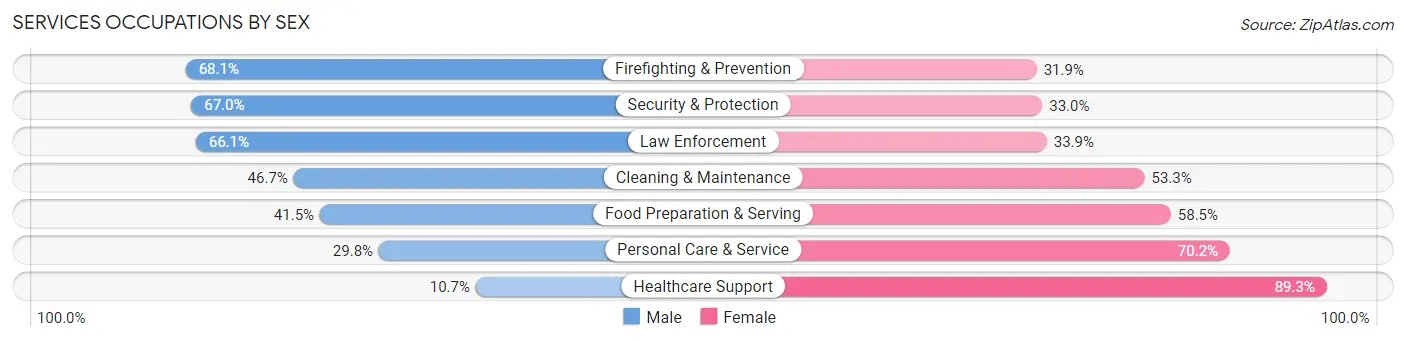
Services Occupations by Sex
Within the Services occupations in Dunklin County, the most male-oriented occupations are Firefighting & Prevention (68.1%), Security & Protection (67.0%), and Law Enforcement (66.1%), while the most female-oriented occupations are Healthcare Support (89.3%), Personal Care & Service (70.2%), and Food Preparation & Serving (58.5%).
| Occupation | Male | Female |
| Healthcare Support | 78 (10.7%) | 654 (89.3%) |
| Security & Protection | 211 (67.0%) | 104 (33.0%) |
| Firefighting & Prevention | 96 (68.1%) | 45 (31.9%) |
| Law Enforcement | 115 (66.1%) | 59 (33.9%) |
| Food Preparation & Serving | 169 (41.5%) | 238 (58.5%) |
| Cleaning & Maintenance | 242 (46.7%) | 276 (53.3%) |
| Personal Care & Service | 114 (29.8%) | 268 (70.2%) |
| Total (Category) | 814 (34.6%) | 1,540 (65.4%) |
| Total (Overall) | 5,676 (51.4%) | 5,367 (48.6%) |
Sales and Office Occupations
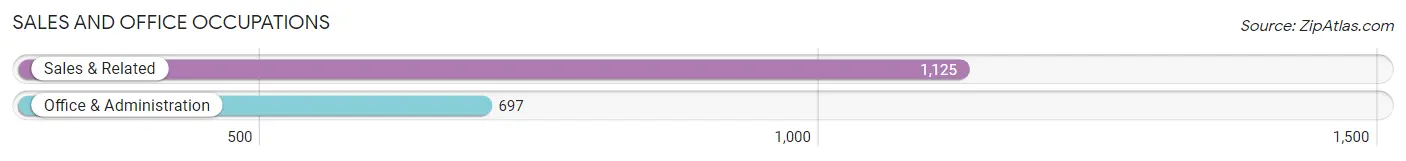
The most common Sales and Office occupations in Dunklin County are Sales & Related (1,125 | 10.2%), and Office & Administration (697 | 6.3%).
Sales and Office Occupations by Sex
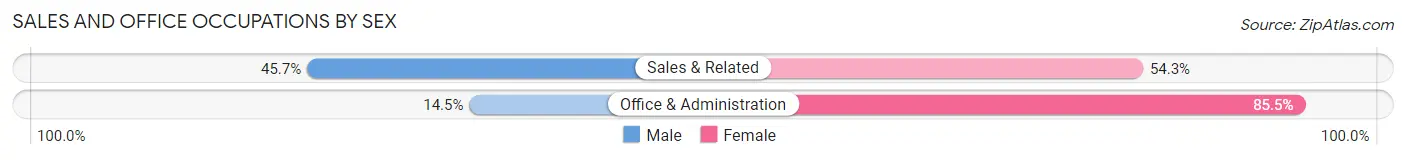
| Occupation | Male | Female |
| Sales & Related | 514 (45.7%) | 611 (54.3%) |
| Office & Administration | 101 (14.5%) | 596 (85.5%) |
| Total (Category) | 615 (33.8%) | 1,207 (66.2%) |
| Total (Overall) | 5,676 (51.4%) | 5,367 (48.6%) |
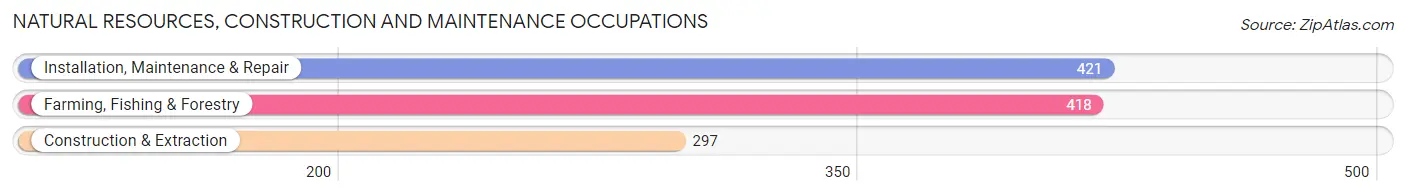
Natural Resources, Construction and Maintenance Occupations
The most common Natural Resources, Construction and Maintenance occupations in Dunklin County are Installation, Maintenance & Repair (421 | 3.8%), Farming, Fishing & Forestry (418 | 3.8%), and Construction & Extraction (297 | 2.7%).
Natural Resources, Construction and Maintenance Occupations by Sex
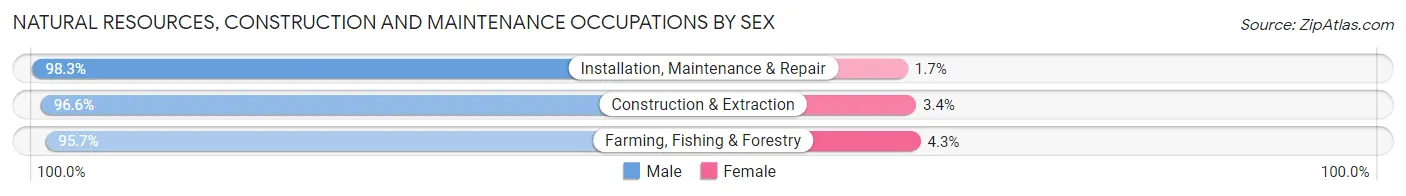
| Occupation | Male | Female |
| Farming, Fishing & Forestry | 400 (95.7%) | 18 (4.3%) |
| Construction & Extraction | 287 (96.6%) | 10 (3.4%) |
| Installation, Maintenance & Repair | 414 (98.3%) | 7 (1.7%) |
| Total (Category) | 1,101 (96.9%) | 35 (3.1%) |
| Total (Overall) | 5,676 (51.4%) | 5,367 (48.6%) |
Production, Transportation and Moving Occupations
The most common Production, Transportation and Moving occupations in Dunklin County are Production (1,135 | 10.3%), Transportation (795 | 7.2%), and Material Moving (475 | 4.3%).
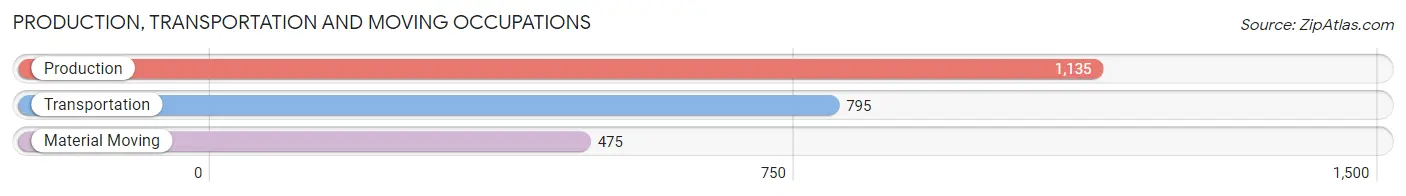
Production, Transportation and Moving Occupations by Sex
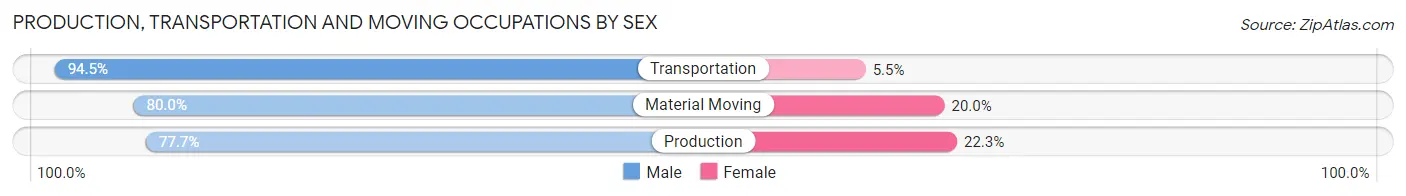
| Occupation | Male | Female |
| Production | 882 (77.7%) | 253 (22.3%) |
| Transportation | 751 (94.5%) | 44 (5.5%) |
| Material Moving | 380 (80.0%) | 95 (20.0%) |
| Total (Category) | 2,013 (83.7%) | 392 (16.3%) |
| Total (Overall) | 5,676 (51.4%) | 5,367 (48.6%) |
Employment Industries by Sex in Dunklin County
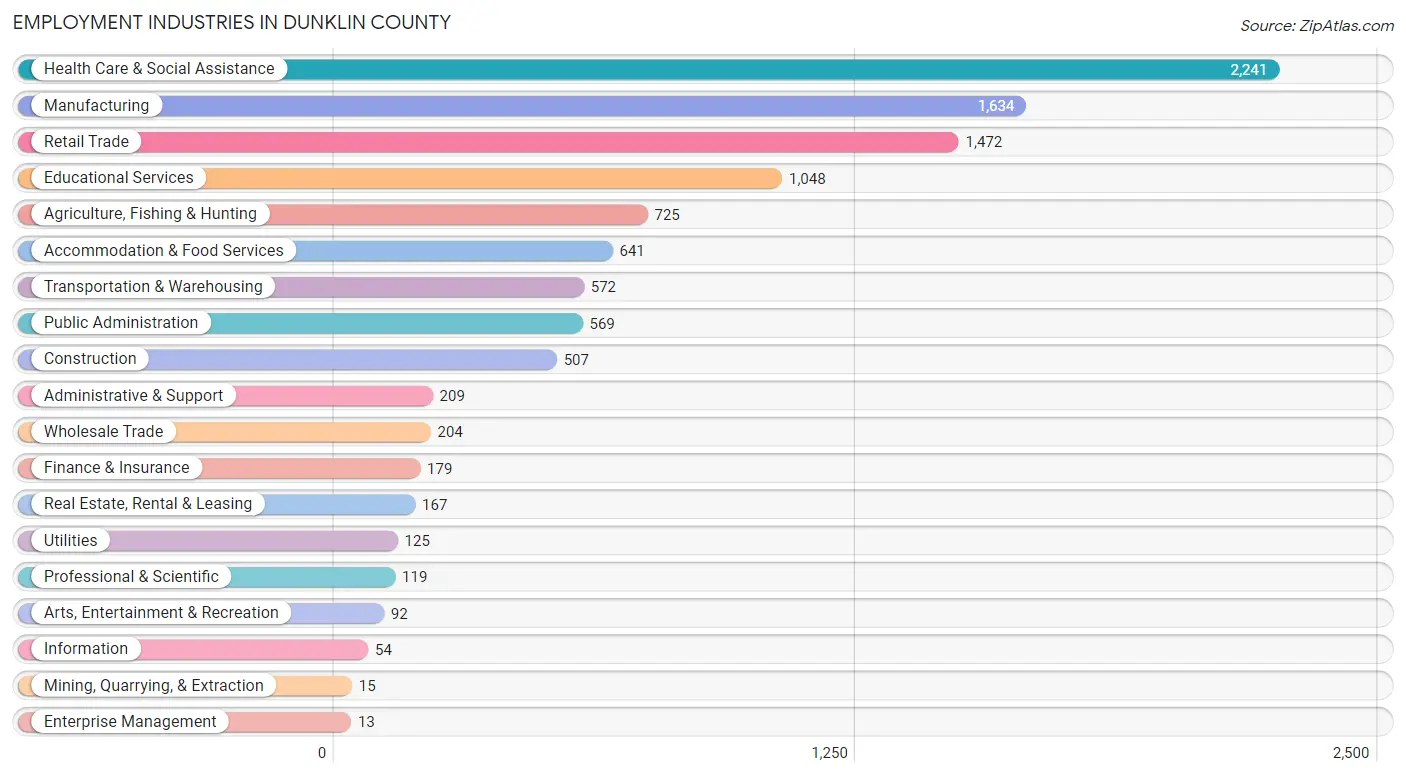
Employment Industries in Dunklin County
The major employment industries in Dunklin County include Health Care & Social Assistance (2,241 | 20.3%), Manufacturing (1,634 | 14.8%), Retail Trade (1,472 | 13.3%), Educational Services (1,048 | 9.5%), and Agriculture, Fishing & Hunting (725 | 6.6%).
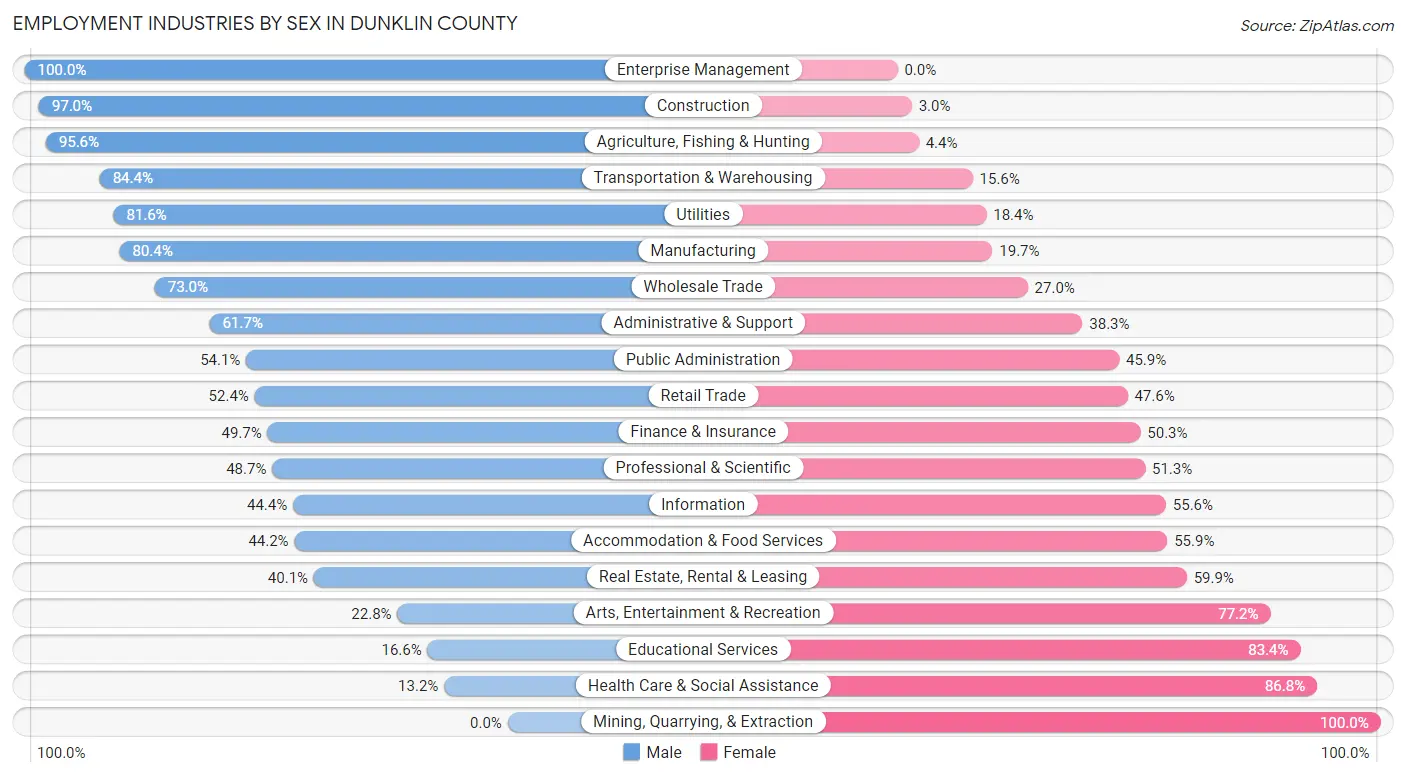
Employment Industries by Sex in Dunklin County
The Dunklin County industries that see more men than women are Enterprise Management (100.0%), Construction (97.0%), and Agriculture, Fishing & Hunting (95.6%), whereas the industries that tend to have a higher number of women are Mining, Quarrying, & Extraction (100.0%), Health Care & Social Assistance (86.8%), and Educational Services (83.4%).
| Industry | Male | Female |
| Agriculture, Fishing & Hunting | 693 (95.6%) | 32 (4.4%) |
| Mining, Quarrying, & Extraction | 0 (0.0%) | 15 (100.0%) |
| Construction | 492 (97.0%) | 15 (3.0%) |
| Manufacturing | 1,313 (80.3%) | 321 (19.7%) |
| Wholesale Trade | 149 (73.0%) | 55 (27.0%) |
| Retail Trade | 771 (52.4%) | 701 (47.6%) |
| Transportation & Warehousing | 483 (84.4%) | 89 (15.6%) |
| Utilities | 102 (81.6%) | 23 (18.4%) |
| Information | 24 (44.4%) | 30 (55.6%) |
| Finance & Insurance | 89 (49.7%) | 90 (50.3%) |
| Real Estate, Rental & Leasing | 67 (40.1%) | 100 (59.9%) |
| Professional & Scientific | 58 (48.7%) | 61 (51.3%) |
| Enterprise Management | 13 (100.0%) | 0 (0.0%) |
| Administrative & Support | 129 (61.7%) | 80 (38.3%) |
| Educational Services | 174 (16.6%) | 874 (83.4%) |
| Health Care & Social Assistance | 295 (13.2%) | 1,946 (86.8%) |
| Arts, Entertainment & Recreation | 21 (22.8%) | 71 (77.2%) |
| Accommodation & Food Services | 283 (44.2%) | 358 (55.8%) |
| Public Administration | 308 (54.1%) | 261 (45.9%) |
| Total | 5,676 (51.4%) | 5,367 (48.6%) |
Education in Dunklin County
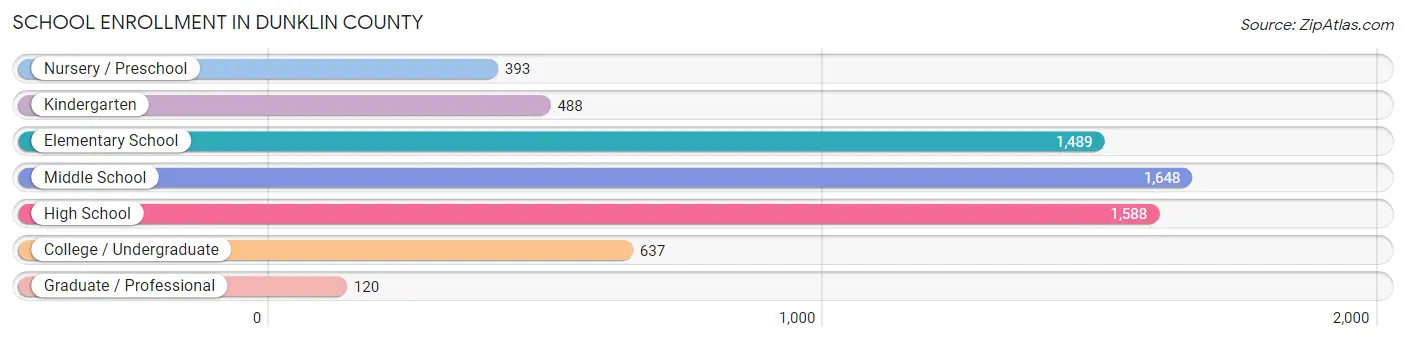
School Enrollment in Dunklin County
The most common levels of schooling among the 6,363 students in Dunklin County are middle school (1,648 | 25.9%), high school (1,588 | 25.0%), and elementary school (1,489 | 23.4%).
| School Level | # Students | % Students |
| Nursery / Preschool | 393 | 6.2% |
| Kindergarten | 488 | 7.7% |
| Elementary School | 1,489 | 23.4% |
| Middle School | 1,648 | 25.9% |
| High School | 1,588 | 25.0% |
| College / Undergraduate | 637 | 10.0% |
| Graduate / Professional | 120 | 1.9% |
| Total | 6,363 | 100.0% |
School Enrollment by Age by Funding Source in Dunklin County
Out of a total of 6,363 students who are enrolled in schools in Dunklin County, 312 (4.9%) attend a private institution, while the remaining 6,051 (95.1%) are enrolled in public schools. The age group of 35 years and over has the highest likelihood of being enrolled in private schools, with 33 (22.2% in the age bracket) enrolled. Conversely, the age group of 10 to 14 year olds has the lowest likelihood of being enrolled in a private school, with 2,050 (98.3% in the age bracket) attending a public institution.
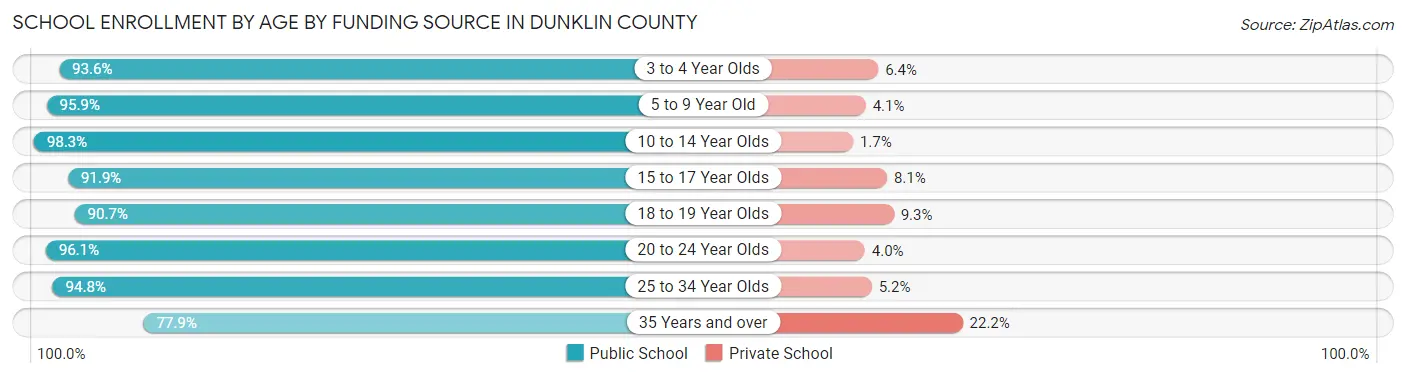
| Age Bracket | Public School | Private School |
| 3 to 4 Year Olds | 305 (93.6%) | 21 (6.4%) |
| 5 to 9 Year Old | 1,680 (95.9%) | 72 (4.1%) |
| 10 to 14 Year Olds | 2,050 (98.3%) | 36 (1.7%) |
| 15 to 17 Year Olds | 1,093 (91.9%) | 96 (8.1%) |
| 18 to 19 Year Olds | 321 (90.7%) | 33 (9.3%) |
| 20 to 24 Year Olds | 340 (96.1%) | 14 (4.0%) |
| 25 to 34 Year Olds | 145 (94.8%) | 8 (5.2%) |
| 35 Years and over | 116 (77.8%) | 33 (22.2%) |
| Total | 6,051 (95.1%) | 312 (4.9%) |
Educational Attainment by Field of Study in Dunklin County
Education (1,202 | 45.5%), business (396 | 15.0%), science & technology (206 | 7.8%), liberal arts & history (183 | 6.9%), and bio, nature & agricultural (150 | 5.7%) are the most common fields of study among 2,644 individuals in Dunklin County who have obtained a bachelor's degree or higher.
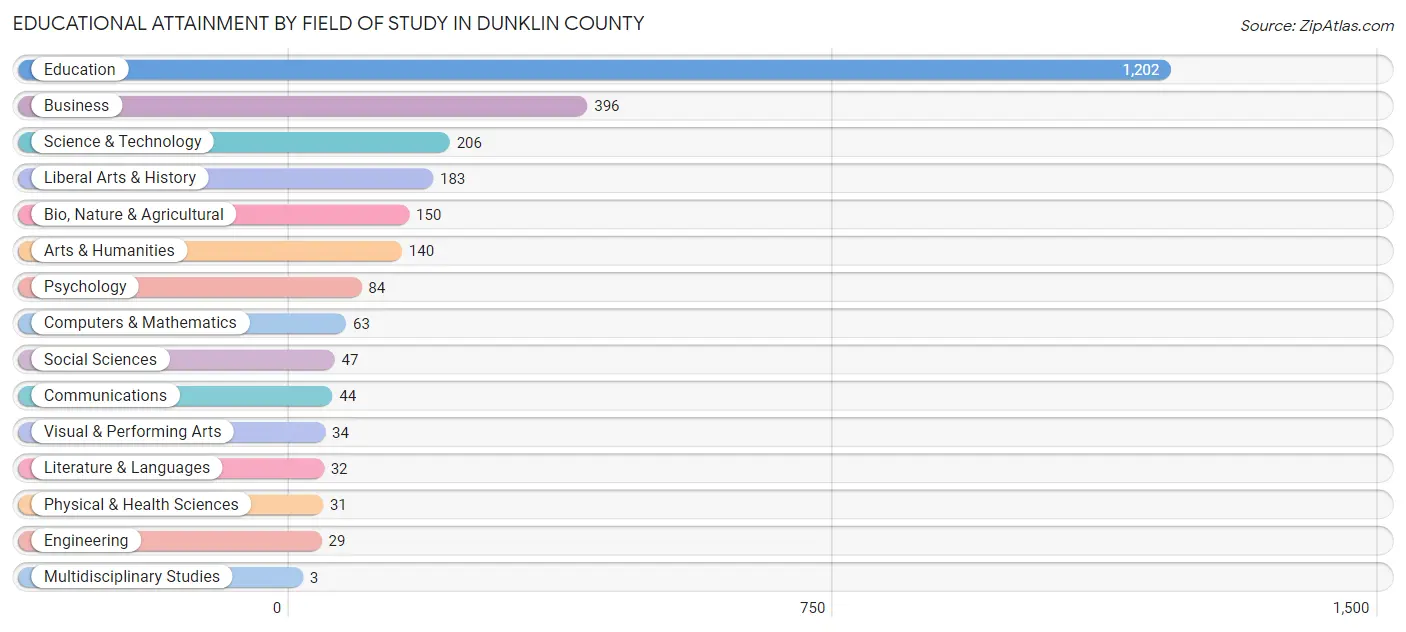
| Field of Study | # Graduates | % Graduates |
| Computers & Mathematics | 63 | 2.4% |
| Bio, Nature & Agricultural | 150 | 5.7% |
| Physical & Health Sciences | 31 | 1.2% |
| Psychology | 84 | 3.2% |
| Social Sciences | 47 | 1.8% |
| Engineering | 29 | 1.1% |
| Multidisciplinary Studies | 3 | 0.1% |
| Science & Technology | 206 | 7.8% |
| Business | 396 | 15.0% |
| Education | 1,202 | 45.5% |
| Literature & Languages | 32 | 1.2% |
| Liberal Arts & History | 183 | 6.9% |
| Visual & Performing Arts | 34 | 1.3% |
| Communications | 44 | 1.7% |
| Arts & Humanities | 140 | 5.3% |
| Total | 2,644 | 100.0% |
Transportation & Commute in Dunklin County
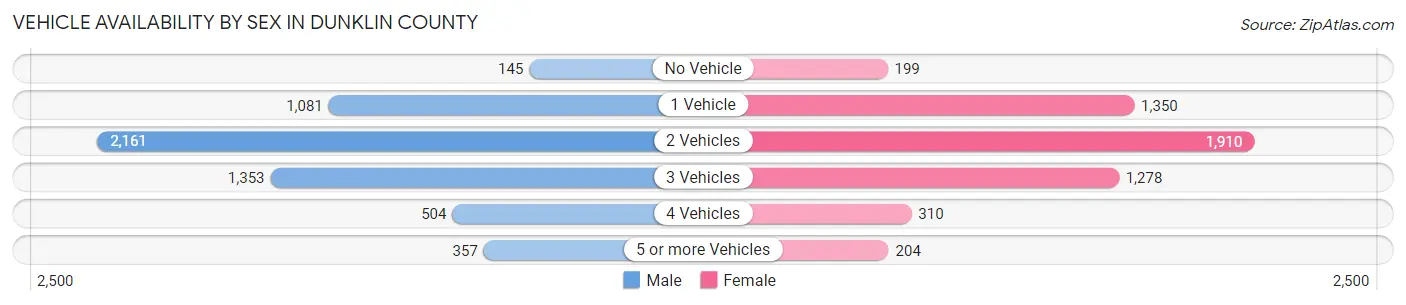
Vehicle Availability by Sex in Dunklin County
The most prevalent vehicle ownership categories in Dunklin County are males with 2 vehicles (2,161, accounting for 38.6%) and females with 2 vehicles (1,910, making up 41.1%).
| Vehicles Available | Male | Female |
| No Vehicle | 145 (2.6%) | 199 (3.8%) |
| 1 Vehicle | 1,081 (19.3%) | 1,350 (25.7%) |
| 2 Vehicles | 2,161 (38.6%) | 1,910 (36.4%) |
| 3 Vehicles | 1,353 (24.2%) | 1,278 (24.3%) |
| 4 Vehicles | 504 (9.0%) | 310 (5.9%) |
| 5 or more Vehicles | 357 (6.4%) | 204 (3.9%) |
| Total | 5,601 (100.0%) | 5,251 (100.0%) |
Commute Time in Dunklin County
The most frequently occuring commute durations in Dunklin County are 5 to 9 minutes (2,155 commuters, 20.7%), 10 to 14 minutes (1,288 commuters, 12.4%), and less than 5 minutes (1,106 commuters, 10.6%).
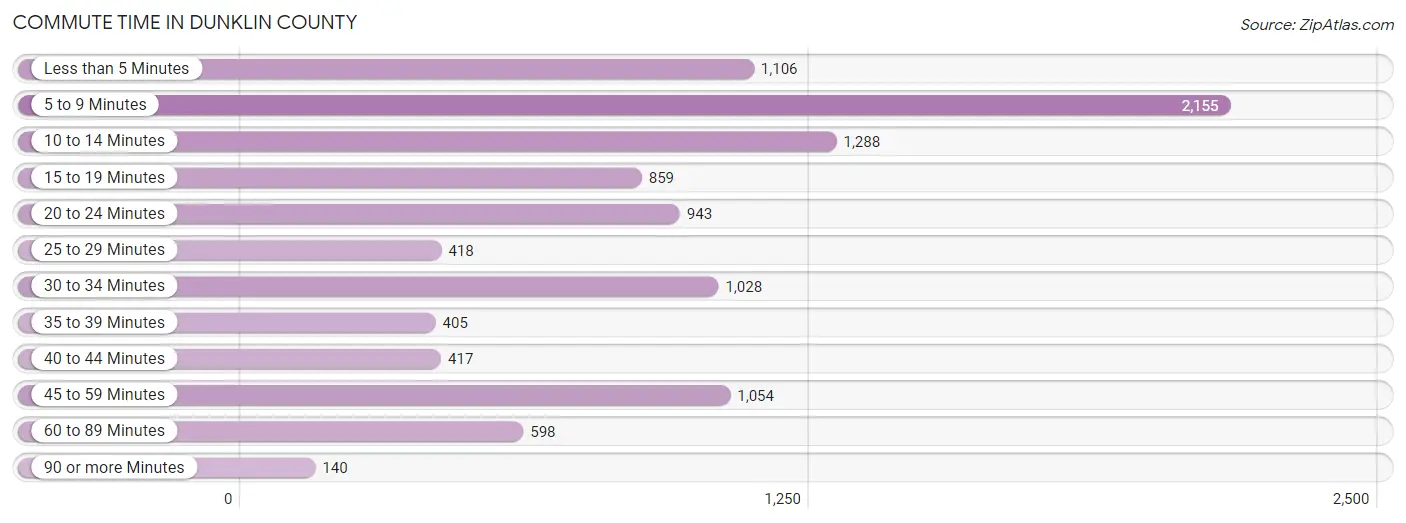
| Commute Time | # Commuters | % Commuters |
| Less than 5 Minutes | 1,106 | 10.6% |
| 5 to 9 Minutes | 2,155 | 20.7% |
| 10 to 14 Minutes | 1,288 | 12.4% |
| 15 to 19 Minutes | 859 | 8.3% |
| 20 to 24 Minutes | 943 | 9.1% |
| 25 to 29 Minutes | 418 | 4.0% |
| 30 to 34 Minutes | 1,028 | 9.9% |
| 35 to 39 Minutes | 405 | 3.9% |
| 40 to 44 Minutes | 417 | 4.0% |
| 45 to 59 Minutes | 1,054 | 10.1% |
| 60 to 89 Minutes | 598 | 5.7% |
| 90 or more Minutes | 140 | 1.3% |
Commute Time by Sex in Dunklin County
The most common commute times in Dunklin County are 5 to 9 minutes (923 commuters, 17.0%) for males and 5 to 9 minutes (1,232 commuters, 24.7%) for females.
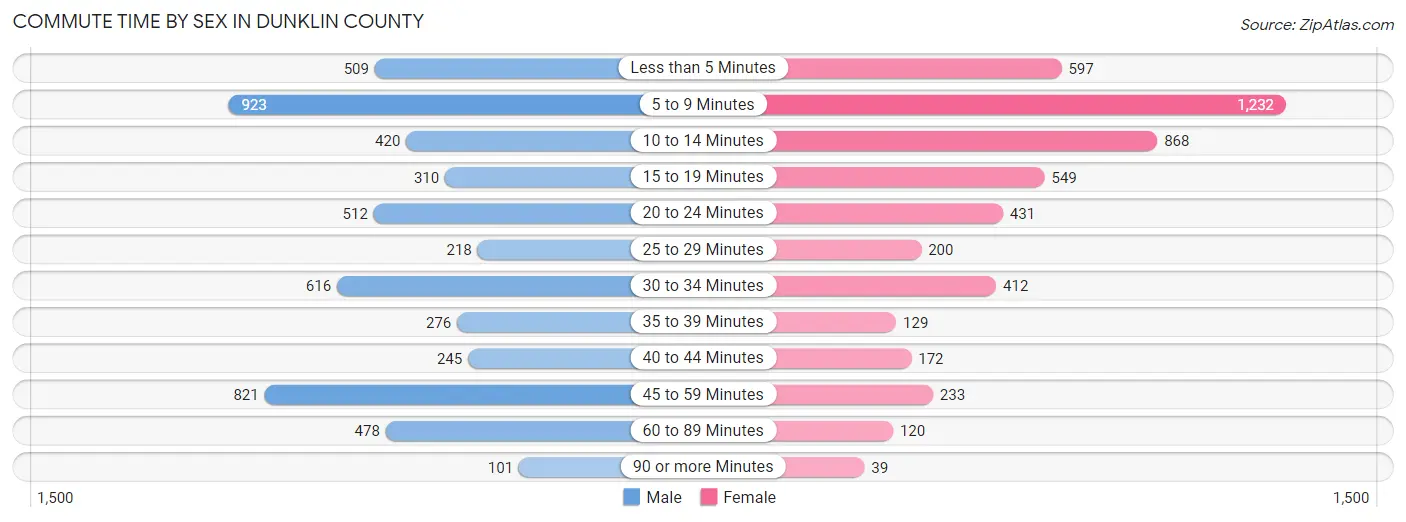
| Commute Time | Male | Female |
| Less than 5 Minutes | 509 (9.4%) | 597 (12.0%) |
| 5 to 9 Minutes | 923 (17.0%) | 1,232 (24.7%) |
| 10 to 14 Minutes | 420 (7.7%) | 868 (17.4%) |
| 15 to 19 Minutes | 310 (5.7%) | 549 (11.0%) |
| 20 to 24 Minutes | 512 (9.4%) | 431 (8.6%) |
| 25 to 29 Minutes | 218 (4.0%) | 200 (4.0%) |
| 30 to 34 Minutes | 616 (11.4%) | 412 (8.3%) |
| 35 to 39 Minutes | 276 (5.1%) | 129 (2.6%) |
| 40 to 44 Minutes | 245 (4.5%) | 172 (3.5%) |
| 45 to 59 Minutes | 821 (15.1%) | 233 (4.7%) |
| 60 to 89 Minutes | 478 (8.8%) | 120 (2.4%) |
| 90 or more Minutes | 101 (1.9%) | 39 (0.8%) |
Time of Departure to Work by Sex in Dunklin County
The most frequent times of departure to work in Dunklin County are 7:00 AM to 7:29 AM (697, 12.8%) for males and 7:00 AM to 7:29 AM (856, 17.2%) for females.
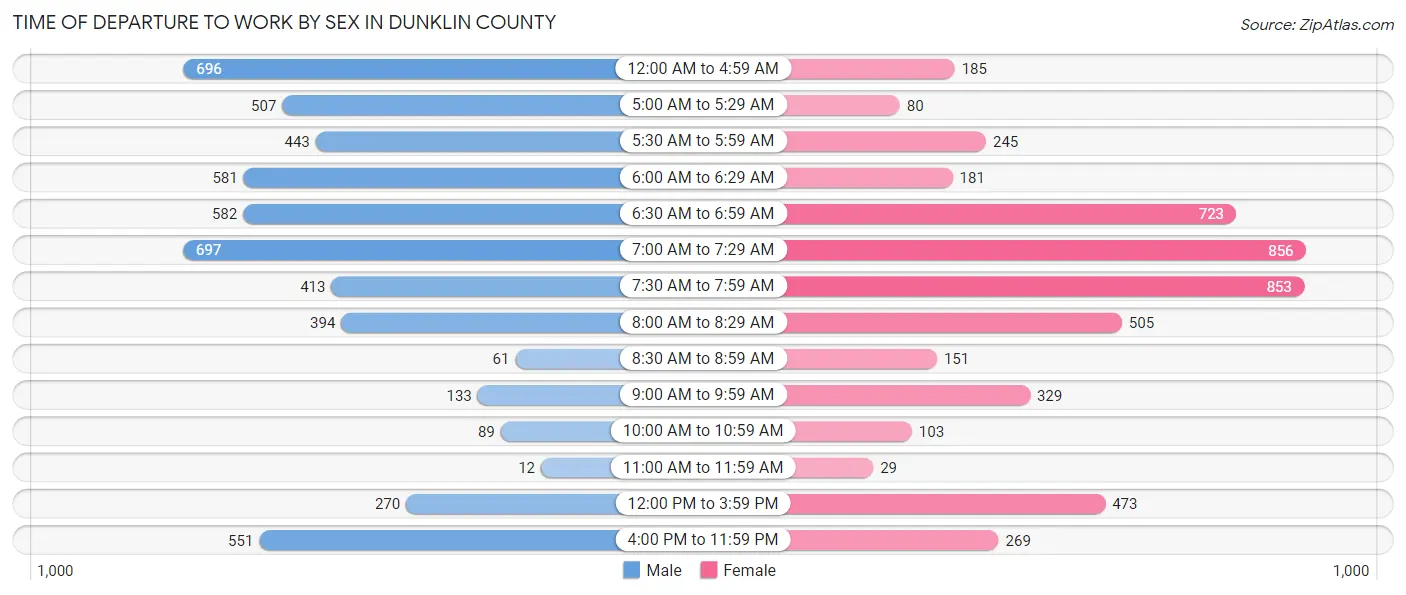
| Time of Departure | Male | Female |
| 12:00 AM to 4:59 AM | 696 (12.8%) | 185 (3.7%) |
| 5:00 AM to 5:29 AM | 507 (9.3%) | 80 (1.6%) |
| 5:30 AM to 5:59 AM | 443 (8.2%) | 245 (4.9%) |
| 6:00 AM to 6:29 AM | 581 (10.7%) | 181 (3.6%) |
| 6:30 AM to 6:59 AM | 582 (10.7%) | 723 (14.5%) |
| 7:00 AM to 7:29 AM | 697 (12.8%) | 856 (17.2%) |
| 7:30 AM to 7:59 AM | 413 (7.6%) | 853 (17.1%) |
| 8:00 AM to 8:29 AM | 394 (7.3%) | 505 (10.1%) |
| 8:30 AM to 8:59 AM | 61 (1.1%) | 151 (3.0%) |
| 9:00 AM to 9:59 AM | 133 (2.5%) | 329 (6.6%) |
| 10:00 AM to 10:59 AM | 89 (1.6%) | 103 (2.1%) |
| 11:00 AM to 11:59 AM | 12 (0.2%) | 29 (0.6%) |
| 12:00 PM to 3:59 PM | 270 (5.0%) | 473 (9.5%) |
| 4:00 PM to 11:59 PM | 551 (10.2%) | 269 (5.4%) |
| Total | 5,429 (100.0%) | 4,982 (100.0%) |
Housing Occupancy in Dunklin County
Occupancy by Ownership in Dunklin County
Of the total 11,134 dwellings in Dunklin County, owner-occupied units account for 6,959 (62.5%), while renter-occupied units make up 4,175 (37.5%).
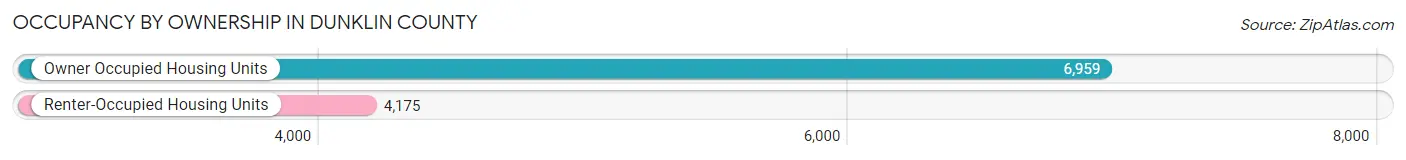
| Occupancy | # Housing Units | % Housing Units |
| Owner Occupied Housing Units | 6,959 | 62.5% |
| Renter-Occupied Housing Units | 4,175 | 37.5% |
| Total Occupied Housing Units | 11,134 | 100.0% |
Occupancy by Household Size in Dunklin County
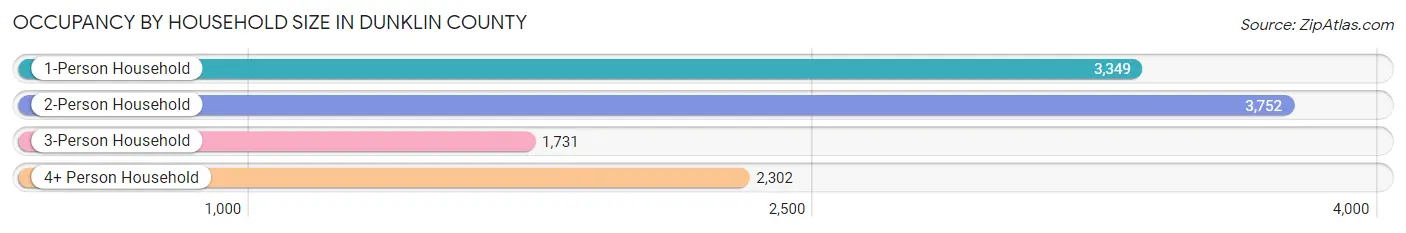
| Household Size | # Housing Units | % Housing Units |
| 1-Person Household | 3,349 | 30.1% |
| 2-Person Household | 3,752 | 33.7% |
| 3-Person Household | 1,731 | 15.5% |
| 4+ Person Household | 2,302 | 20.7% |
| Total Housing Units | 11,134 | 100.0% |
Occupancy by Ownership by Household Size in Dunklin County
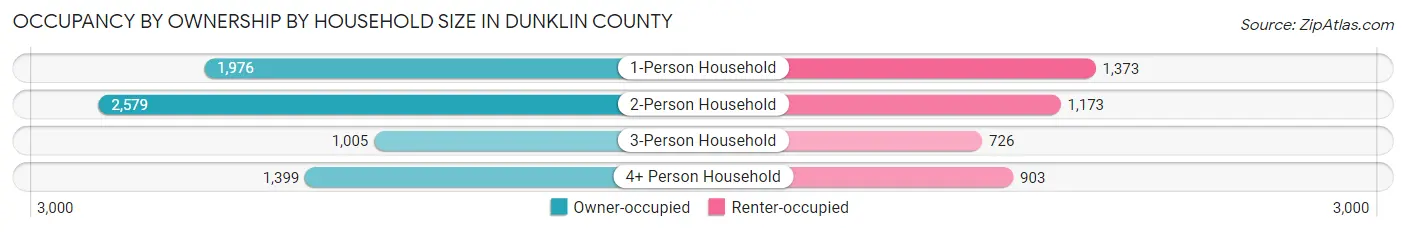
| Household Size | Owner-occupied | Renter-occupied |
| 1-Person Household | 1,976 (59.0%) | 1,373 (41.0%) |
| 2-Person Household | 2,579 (68.7%) | 1,173 (31.3%) |
| 3-Person Household | 1,005 (58.1%) | 726 (41.9%) |
| 4+ Person Household | 1,399 (60.8%) | 903 (39.2%) |
| Total Housing Units | 6,959 (62.5%) | 4,175 (37.5%) |
Occupancy by Educational Attainment in Dunklin County
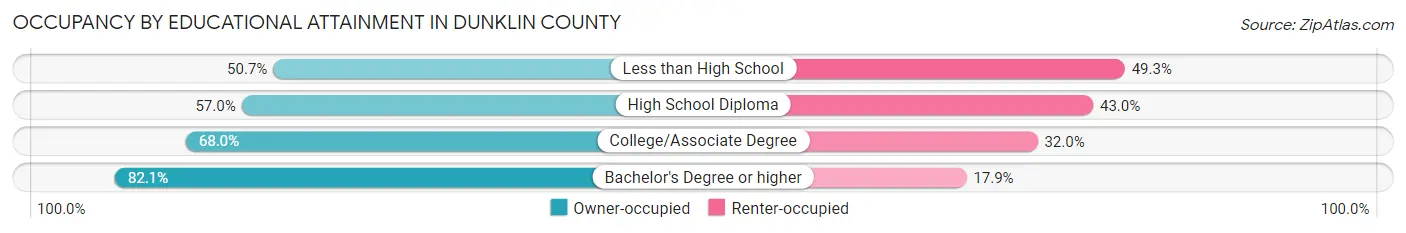
| Household Size | Owner-occupied | Renter-occupied |
| Less than High School | 1,051 (50.7%) | 1,021 (49.3%) |
| High School Diploma | 2,557 (57.0%) | 1,929 (43.0%) |
| College/Associate Degree | 1,961 (68.0%) | 922 (32.0%) |
| Bachelor's Degree or higher | 1,390 (82.1%) | 303 (17.9%) |
Occupancy by Age of Householder in Dunklin County
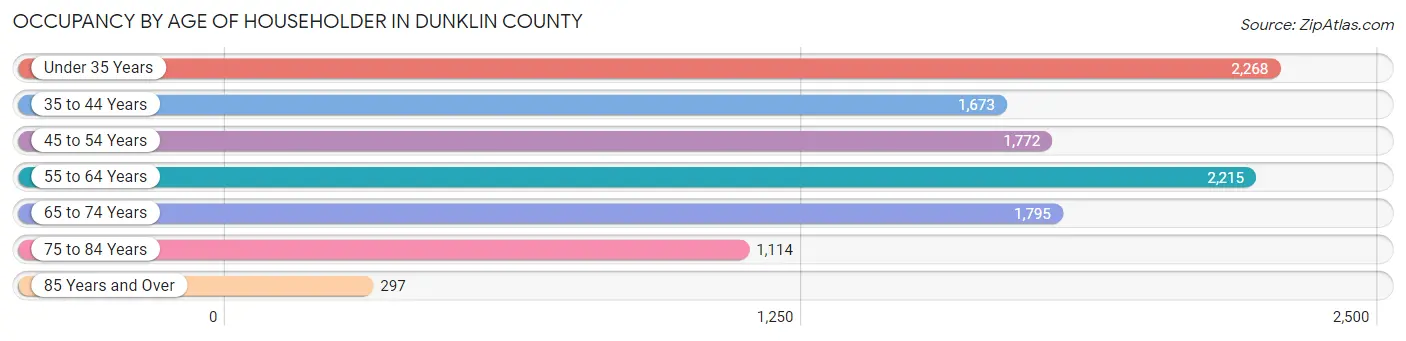
| Age Bracket | # Households | % Households |
| Under 35 Years | 2,268 | 20.4% |
| 35 to 44 Years | 1,673 | 15.0% |
| 45 to 54 Years | 1,772 | 15.9% |
| 55 to 64 Years | 2,215 | 19.9% |
| 65 to 74 Years | 1,795 | 16.1% |
| 75 to 84 Years | 1,114 | 10.0% |
| 85 Years and Over | 297 | 2.7% |
| Total | 11,134 | 100.0% |
Housing Finances in Dunklin County
Median Income by Occupancy in Dunklin County
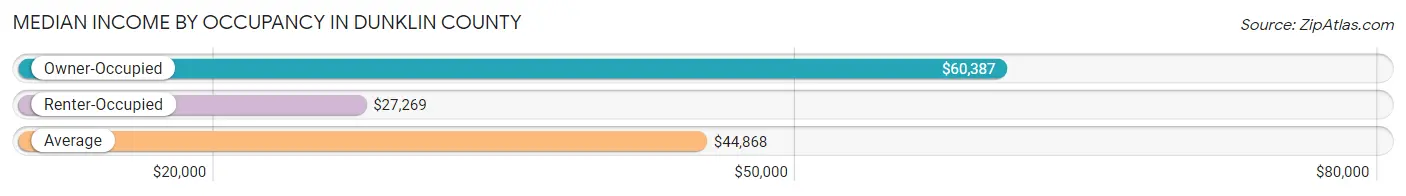
| Occupancy Type | # Households | Median Income |
| Owner-Occupied | 6,959 (62.5%) | $60,387 |
| Renter-Occupied | 4,175 (37.5%) | $27,269 |
| Average | 11,134 (100.0%) | $44,868 |
Occupancy by Householder Income Bracket in Dunklin County
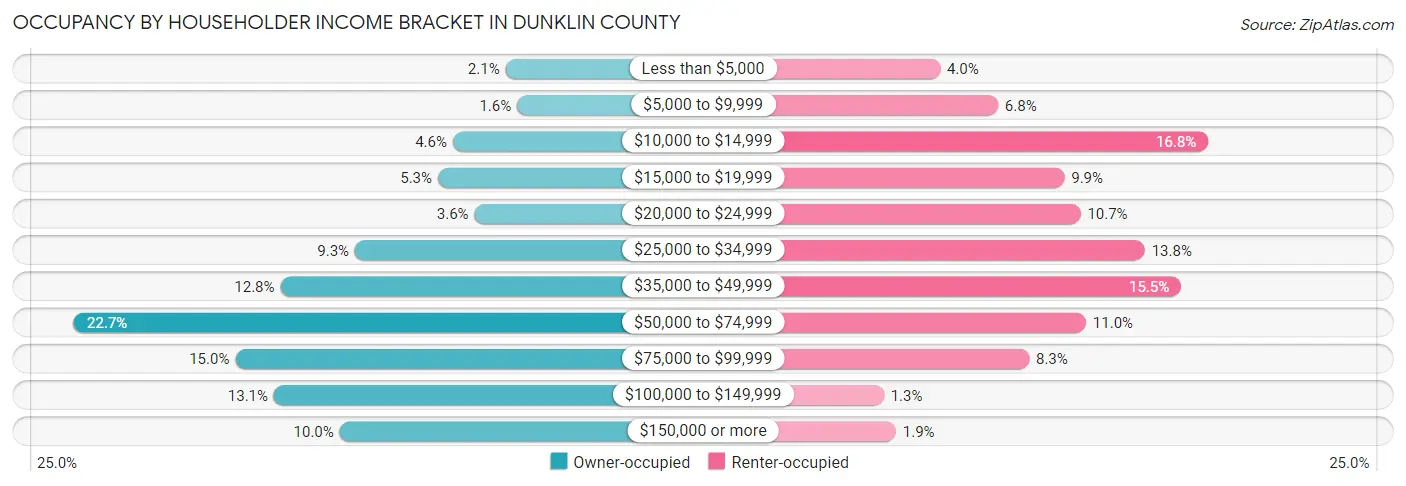
| Income Bracket | Owner-occupied | Renter-occupied |
| Less than $5,000 | 146 (2.1%) | 168 (4.0%) |
| $5,000 to $9,999 | 108 (1.5%) | 283 (6.8%) |
| $10,000 to $14,999 | 321 (4.6%) | 701 (16.8%) |
| $15,000 to $19,999 | 370 (5.3%) | 415 (9.9%) |
| $20,000 to $24,999 | 249 (3.6%) | 447 (10.7%) |
| $25,000 to $34,999 | 645 (9.3%) | 575 (13.8%) |
| $35,000 to $49,999 | 892 (12.8%) | 647 (15.5%) |
| $50,000 to $74,999 | 1,576 (22.7%) | 458 (11.0%) |
| $75,000 to $99,999 | 1,042 (15.0%) | 345 (8.3%) |
| $100,000 to $149,999 | 914 (13.1%) | 56 (1.3%) |
| $150,000 or more | 696 (10.0%) | 80 (1.9%) |
| Total | 6,959 (100.0%) | 4,175 (100.0%) |
Monthly Housing Cost Tiers in Dunklin County
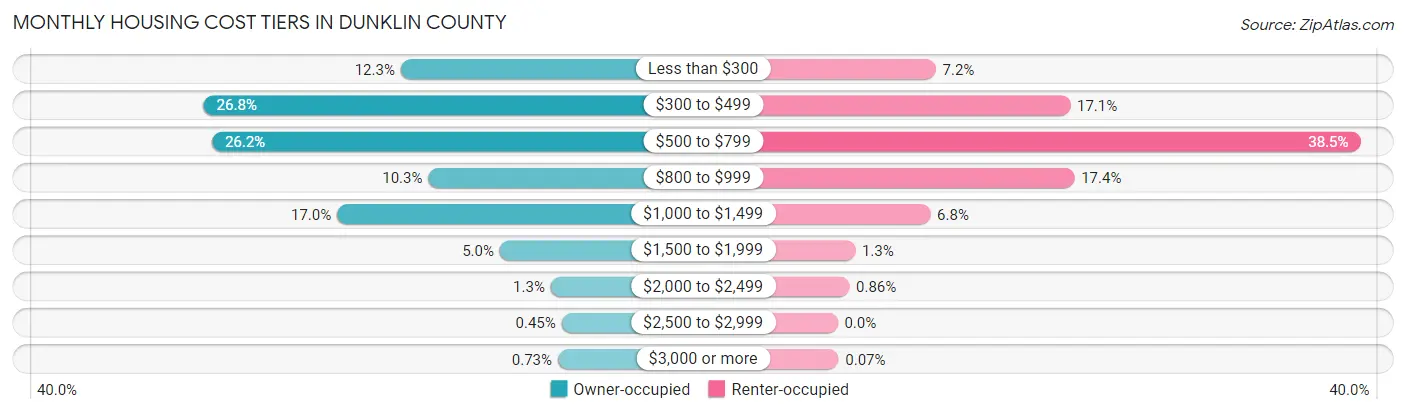
| Monthly Cost | Owner-occupied | Renter-occupied |
| Less than $300 | 856 (12.3%) | 302 (7.2%) |
| $300 to $499 | 1,866 (26.8%) | 715 (17.1%) |
| $500 to $799 | 1,823 (26.2%) | 1,608 (38.5%) |
| $800 to $999 | 715 (10.3%) | 728 (17.4%) |
| $1,000 to $1,499 | 1,182 (17.0%) | 285 (6.8%) |
| $1,500 to $1,999 | 348 (5.0%) | 54 (1.3%) |
| $2,000 to $2,499 | 87 (1.3%) | 36 (0.9%) |
| $2,500 to $2,999 | 31 (0.4%) | 0 (0.0%) |
| $3,000 or more | 51 (0.7%) | 3 (0.1%) |
| Total | 6,959 (100.0%) | 4,175 (100.0%) |
Physical Housing Characteristics in Dunklin County
Housing Structures in Dunklin County
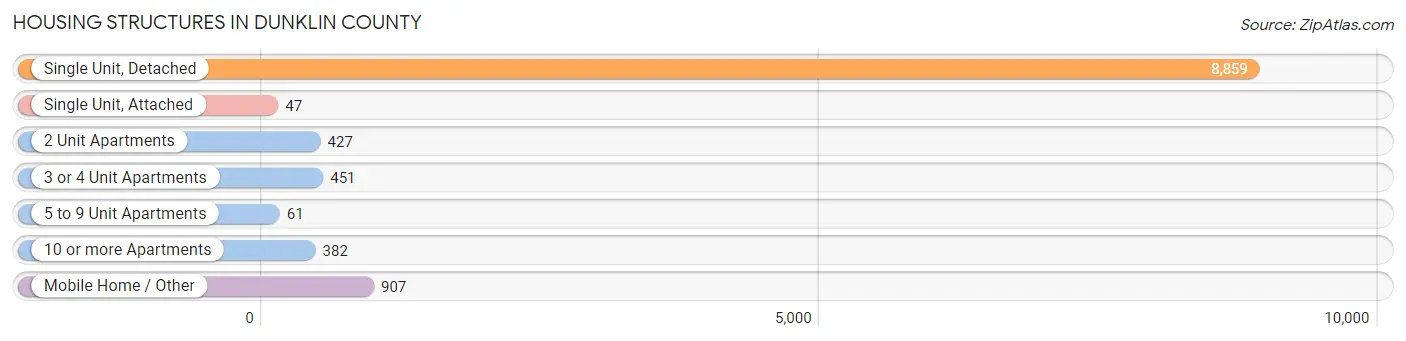
| Structure Type | # Housing Units | % Housing Units |
| Single Unit, Detached | 8,859 | 79.6% |
| Single Unit, Attached | 47 | 0.4% |
| 2 Unit Apartments | 427 | 3.8% |
| 3 or 4 Unit Apartments | 451 | 4.1% |
| 5 to 9 Unit Apartments | 61 | 0.5% |
| 10 or more Apartments | 382 | 3.4% |
| Mobile Home / Other | 907 | 8.2% |
| Total | 11,134 | 100.0% |
Housing Structures by Occupancy in Dunklin County
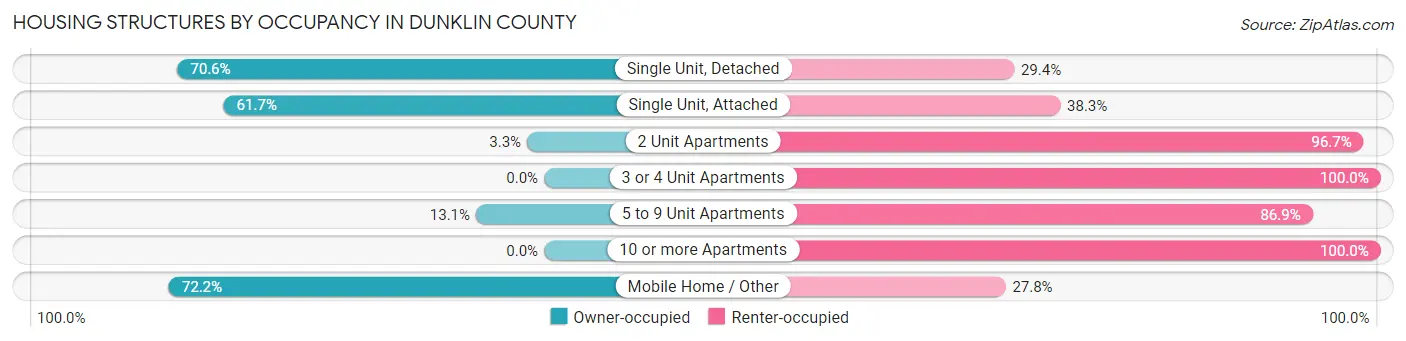
| Structure Type | Owner-occupied | Renter-occupied |
| Single Unit, Detached | 6,253 (70.6%) | 2,606 (29.4%) |
| Single Unit, Attached | 29 (61.7%) | 18 (38.3%) |
| 2 Unit Apartments | 14 (3.3%) | 413 (96.7%) |
| 3 or 4 Unit Apartments | 0 (0.0%) | 451 (100.0%) |
| 5 to 9 Unit Apartments | 8 (13.1%) | 53 (86.9%) |
| 10 or more Apartments | 0 (0.0%) | 382 (100.0%) |
| Mobile Home / Other | 655 (72.2%) | 252 (27.8%) |
| Total | 6,959 (62.5%) | 4,175 (37.5%) |
Housing Structures by Number of Rooms in Dunklin County
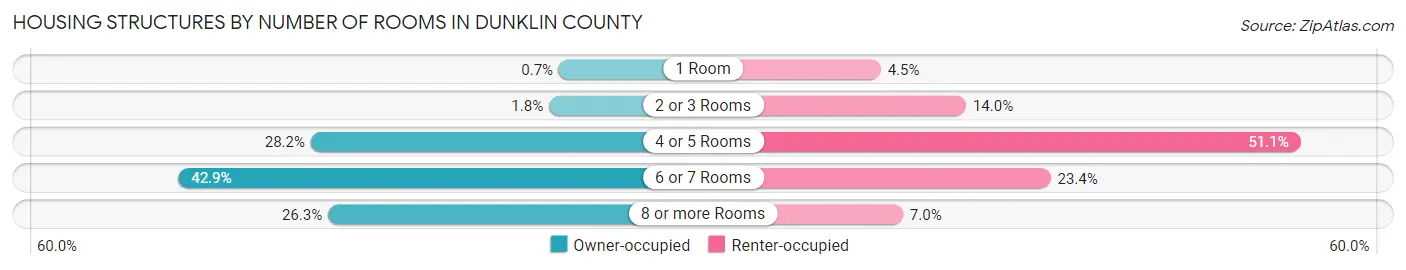
| Number of Rooms | Owner-occupied | Renter-occupied |
| 1 Room | 49 (0.7%) | 189 (4.5%) |
| 2 or 3 Rooms | 125 (1.8%) | 584 (14.0%) |
| 4 or 5 Rooms | 1,965 (28.2%) | 2,134 (51.1%) |
| 6 or 7 Rooms | 2,988 (42.9%) | 976 (23.4%) |
| 8 or more Rooms | 1,832 (26.3%) | 292 (7.0%) |
| Total | 6,959 (100.0%) | 4,175 (100.0%) |
Housing Structure by Heating Type in Dunklin County
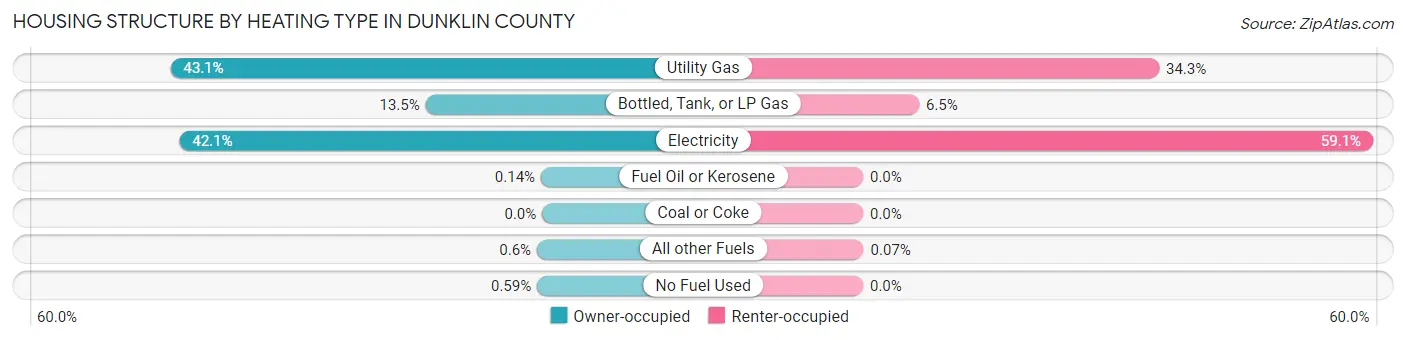
| Heating Type | Owner-occupied | Renter-occupied |
| Utility Gas | 2,999 (43.1%) | 1,433 (34.3%) |
| Bottled, Tank, or LP Gas | 940 (13.5%) | 271 (6.5%) |
| Electricity | 2,927 (42.1%) | 2,468 (59.1%) |
| Fuel Oil or Kerosene | 10 (0.1%) | 0 (0.0%) |
| Coal or Coke | 0 (0.0%) | 0 (0.0%) |
| All other Fuels | 42 (0.6%) | 3 (0.1%) |
| No Fuel Used | 41 (0.6%) | 0 (0.0%) |
| Total | 6,959 (100.0%) | 4,175 (100.0%) |
Household Vehicle Usage in Dunklin County
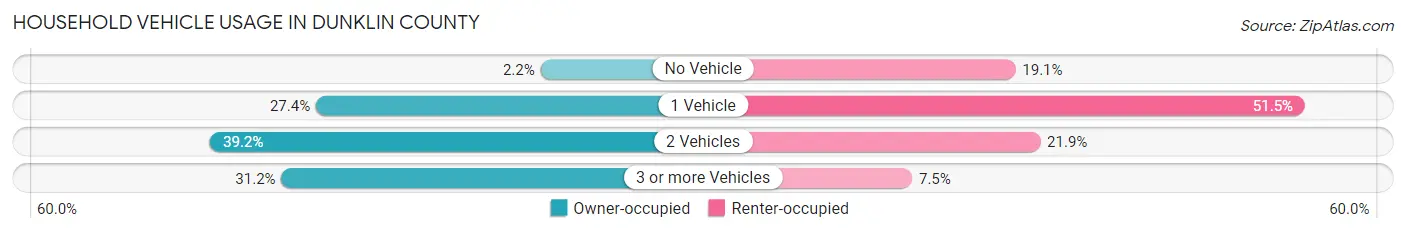
| Vehicles per Household | Owner-occupied | Renter-occupied |
| No Vehicle | 153 (2.2%) | 797 (19.1%) |
| 1 Vehicle | 1,904 (27.4%) | 2,151 (51.5%) |
| 2 Vehicles | 2,729 (39.2%) | 913 (21.9%) |
| 3 or more Vehicles | 2,173 (31.2%) | 314 (7.5%) |
| Total | 6,959 (100.0%) | 4,175 (100.0%) |
Real Estate & Mortgages in Dunklin County
Real Estate and Mortgage Overview in Dunklin County
| Characteristic | Without Mortgage | With Mortgage |
| Housing Units | 3,876 | 3,083 |
| Median Property Value | $87,700 | $97,800 |
| Median Household Income | $46,850 | $444 |
| Monthly Housing Costs | $406 | $48 |
| Real Estate Taxes | $622 | $27 |
Property Value by Mortgage Status in Dunklin County
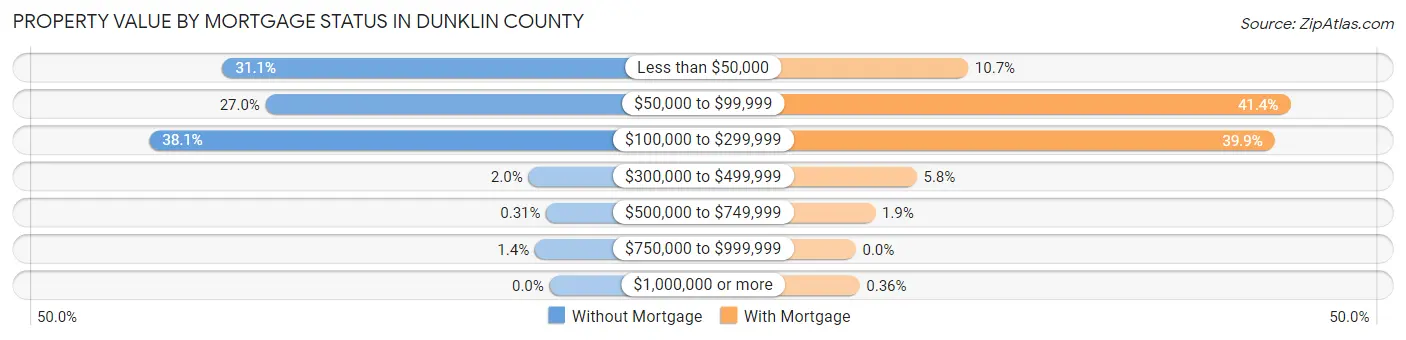
| Property Value | Without Mortgage | With Mortgage |
| Less than $50,000 | 1,207 (31.1%) | 330 (10.7%) |
| $50,000 to $99,999 | 1,048 (27.0%) | 1,276 (41.4%) |
| $100,000 to $299,999 | 1,477 (38.1%) | 1,230 (39.9%) |
| $300,000 to $499,999 | 78 (2.0%) | 179 (5.8%) |
| $500,000 to $749,999 | 12 (0.3%) | 57 (1.8%) |
| $750,000 to $999,999 | 54 (1.4%) | 0 (0.0%) |
| $1,000,000 or more | 0 (0.0%) | 11 (0.4%) |
| Total | 3,876 (100.0%) | 3,083 (100.0%) |
Household Income by Mortgage Status in Dunklin County
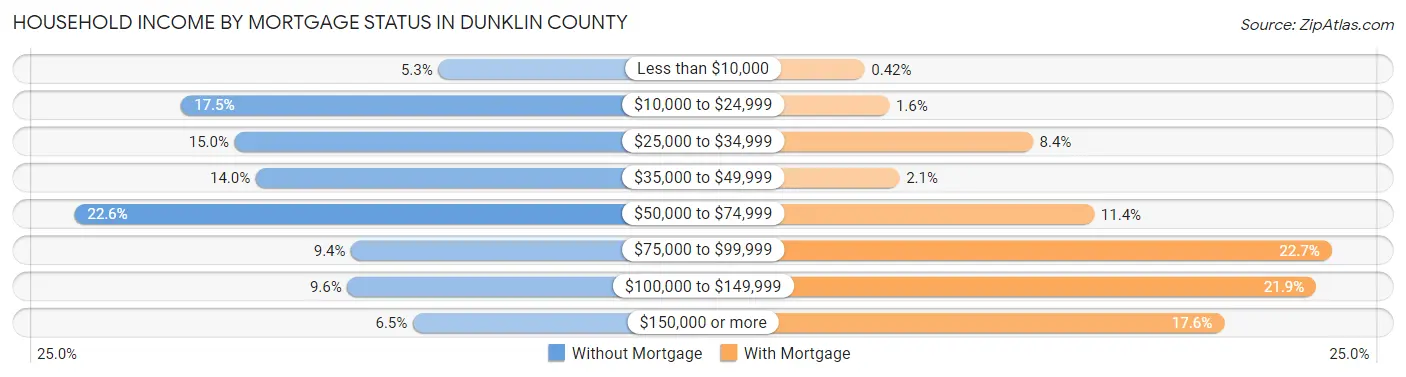
| Household Income | Without Mortgage | With Mortgage |
| Less than $10,000 | 205 (5.3%) | 13 (0.4%) |
| $10,000 to $24,999 | 680 (17.5%) | 49 (1.6%) |
| $25,000 to $34,999 | 581 (15.0%) | 260 (8.4%) |
| $35,000 to $49,999 | 542 (14.0%) | 64 (2.1%) |
| $50,000 to $74,999 | 877 (22.6%) | 350 (11.4%) |
| $75,000 to $99,999 | 366 (9.4%) | 699 (22.7%) |
| $100,000 to $149,999 | 373 (9.6%) | 676 (21.9%) |
| $150,000 or more | 252 (6.5%) | 541 (17.5%) |
| Total | 3,876 (100.0%) | 3,083 (100.0%) |
Property Value to Household Income Ratio in Dunklin County
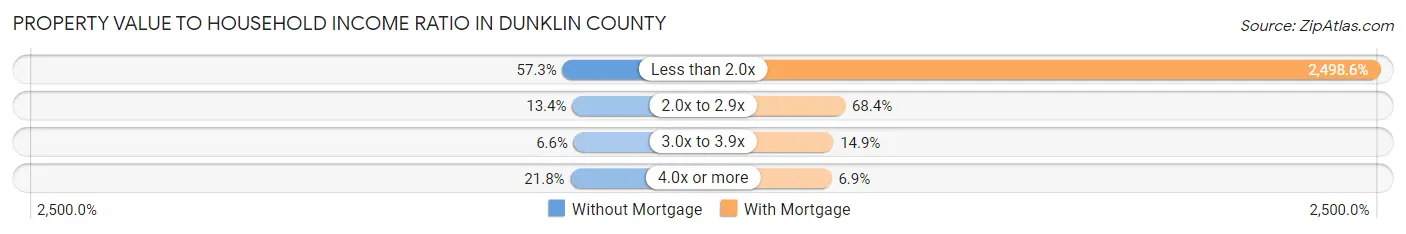
| Value-to-Income Ratio | Without Mortgage | With Mortgage |
| Less than 2.0x | 2,221 (57.3%) | 77,032 (2,498.6%) |
| 2.0x to 2.9x | 520 (13.4%) | 2,109 (68.4%) |
| 3.0x to 3.9x | 257 (6.6%) | 460 (14.9%) |
| 4.0x or more | 846 (21.8%) | 214 (6.9%) |
| Total | 3,876 (100.0%) | 3,083 (100.0%) |
Real Estate Taxes by Mortgage Status in Dunklin County
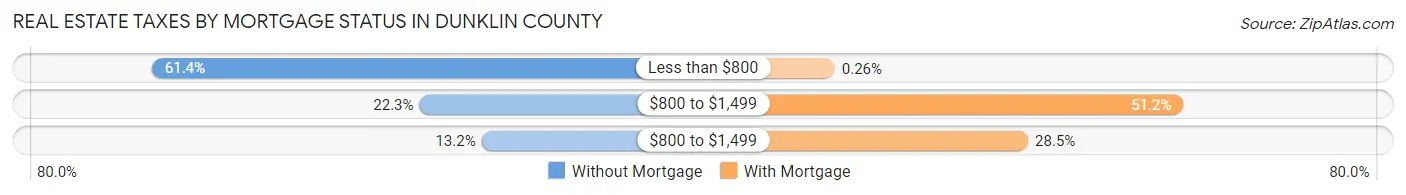
| Property Taxes | Without Mortgage | With Mortgage |
| Less than $800 | 2,380 (61.4%) | 8 (0.3%) |
| $800 to $1,499 | 865 (22.3%) | 1,578 (51.2%) |
| $800 to $1,499 | 513 (13.2%) | 879 (28.5%) |
| Total | 3,876 (100.0%) | 3,083 (100.0%) |
Health & Disability in Dunklin County
Health Insurance Coverage by Age in Dunklin County
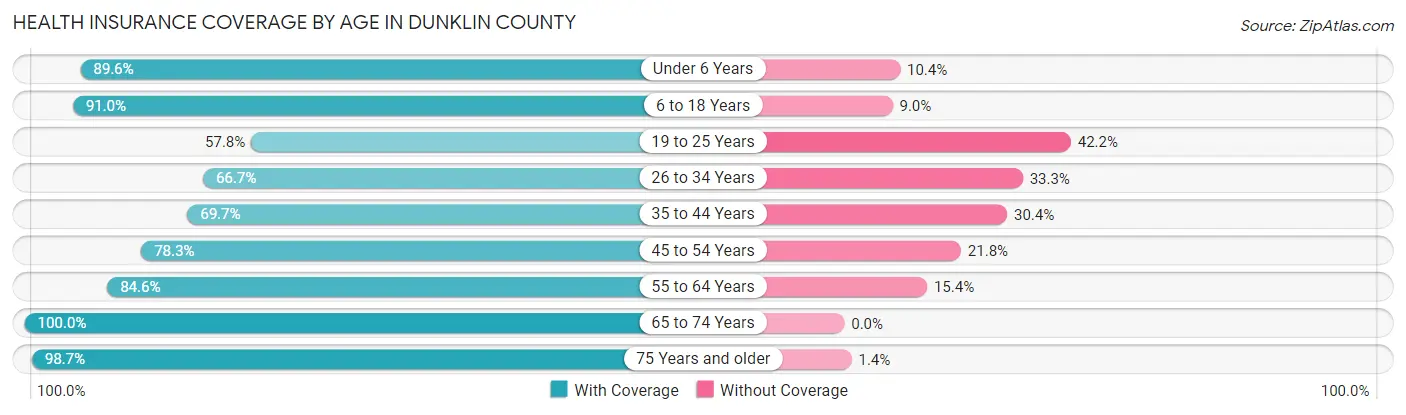
| Age Bracket | With Coverage | Without Coverage |
| Under 6 Years | 1,912 (89.6%) | 222 (10.4%) |
| 6 to 18 Years | 4,852 (91.0%) | 479 (9.0%) |
| 19 to 25 Years | 1,374 (57.8%) | 1,005 (42.2%) |
| 26 to 34 Years | 1,771 (66.7%) | 883 (33.3%) |
| 35 to 44 Years | 2,198 (69.7%) | 958 (30.3%) |
| 45 to 54 Years | 2,525 (78.2%) | 702 (21.7%) |
| 55 to 64 Years | 3,149 (84.6%) | 574 (15.4%) |
| 65 to 74 Years | 2,887 (100.0%) | 0 (0.0%) |
| 75 Years and older | 1,974 (98.7%) | 27 (1.3%) |
| Total | 22,642 (82.4%) | 4,850 (17.6%) |
Health Insurance Coverage by Citizenship Status in Dunklin County
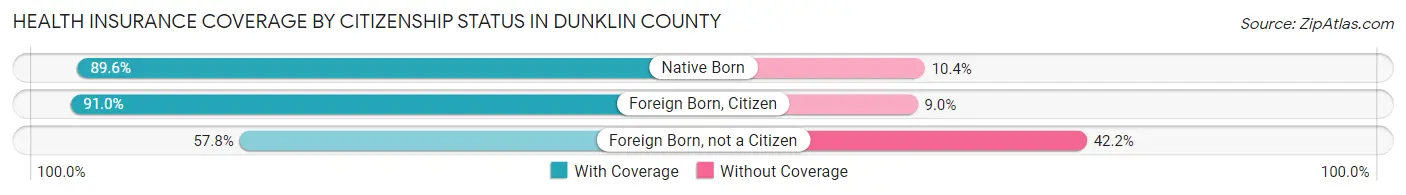
| Citizenship Status | With Coverage | Without Coverage |
| Native Born | 1,912 (89.6%) | 222 (10.4%) |
| Foreign Born, Citizen | 4,852 (91.0%) | 479 (9.0%) |
| Foreign Born, not a Citizen | 1,374 (57.8%) | 1,005 (42.2%) |
Health Insurance Coverage by Household Income in Dunklin County
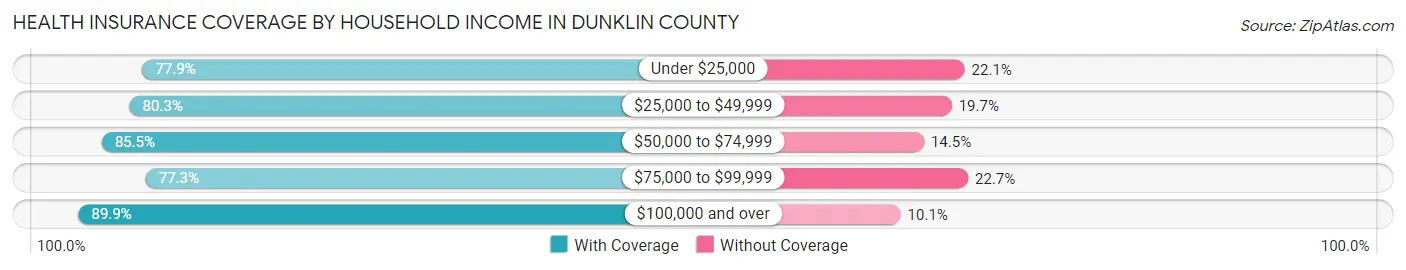
| Household Income | With Coverage | Without Coverage |
| Under $25,000 | 4,550 (77.9%) | 1,289 (22.1%) |
| $25,000 to $49,999 | 4,747 (80.3%) | 1,162 (19.7%) |
| $50,000 to $74,999 | 4,799 (85.5%) | 811 (14.5%) |
| $75,000 to $99,999 | 3,416 (77.3%) | 1,004 (22.7%) |
| $100,000 and over | 5,087 (89.9%) | 571 (10.1%) |
Public vs Private Health Insurance Coverage by Age in Dunklin County
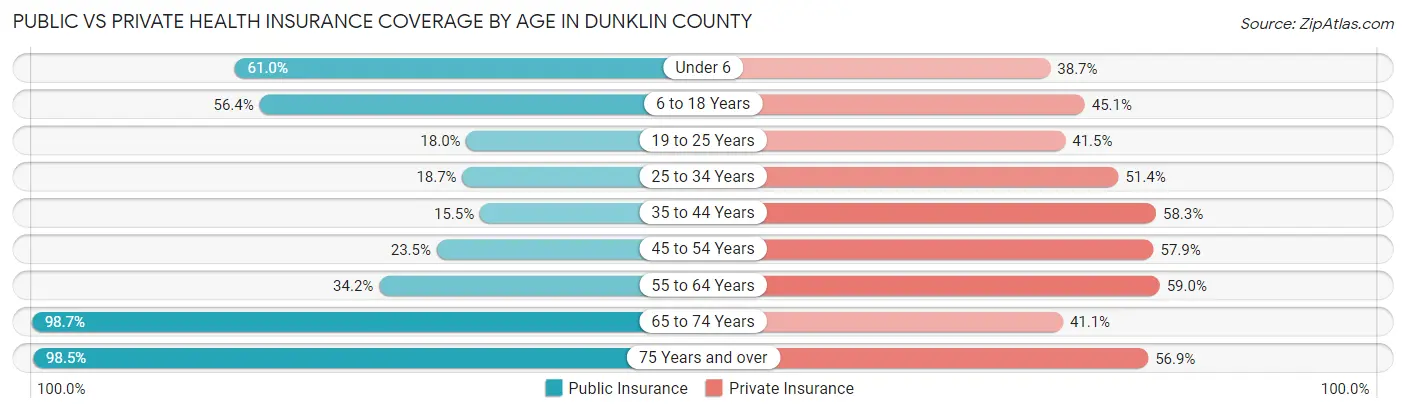
| Age Bracket | Public Insurance | Private Insurance |
| Under 6 | 1,302 (61.0%) | 826 (38.7%) |
| 6 to 18 Years | 3,006 (56.4%) | 2,405 (45.1%) |
| 19 to 25 Years | 428 (18.0%) | 987 (41.5%) |
| 25 to 34 Years | 497 (18.7%) | 1,363 (51.4%) |
| 35 to 44 Years | 488 (15.5%) | 1,841 (58.3%) |
| 45 to 54 Years | 758 (23.5%) | 1,867 (57.9%) |
| 55 to 64 Years | 1,273 (34.2%) | 2,197 (59.0%) |
| 65 to 74 Years | 2,849 (98.7%) | 1,185 (41.0%) |
| 75 Years and over | 1,970 (98.5%) | 1,138 (56.9%) |
| Total | 12,571 (45.7%) | 13,809 (50.2%) |
Disability Status by Sex by Age in Dunklin County
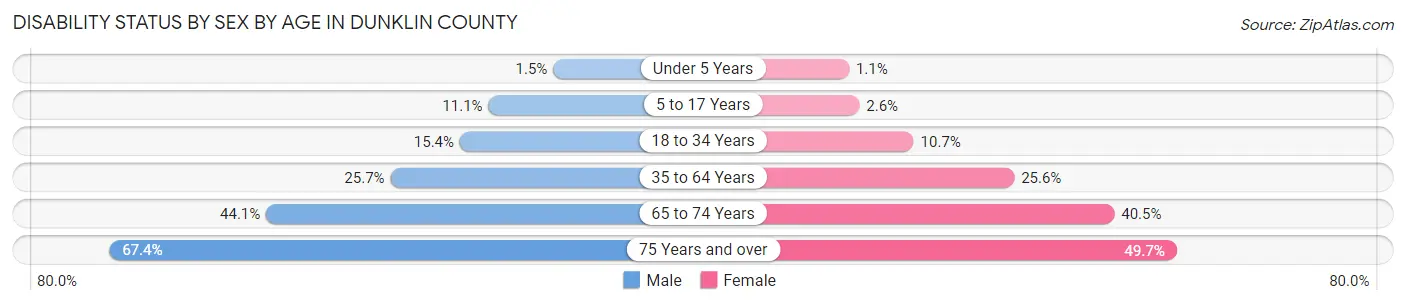
| Age Bracket | Male | Female |
| Under 5 Years | 14 (1.5%) | 10 (1.1%) |
| 5 to 17 Years | 304 (11.1%) | 68 (2.6%) |
| 18 to 34 Years | 390 (15.4%) | 294 (10.7%) |
| 35 to 64 Years | 1,249 (25.7%) | 1,342 (25.6%) |
| 65 to 74 Years | 576 (44.1%) | 640 (40.5%) |
| 75 Years and over | 503 (67.4%) | 624 (49.7%) |
Disability Class by Sex by Age in Dunklin County
Disability Class: Hearing Difficulty
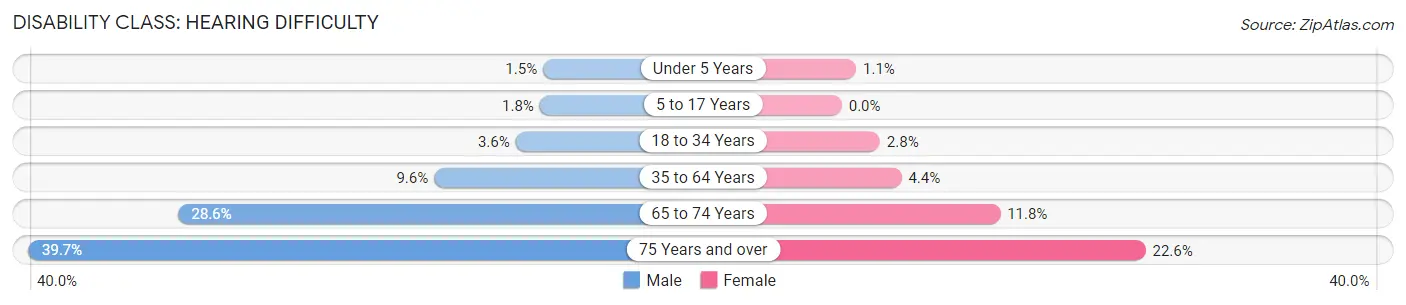
| Age Bracket | Male | Female |
| Under 5 Years | 14 (1.5%) | 10 (1.1%) |
| 5 to 17 Years | 48 (1.8%) | 0 (0.0%) |
| 18 to 34 Years | 90 (3.5%) | 78 (2.8%) |
| 35 to 64 Years | 467 (9.6%) | 232 (4.4%) |
| 65 to 74 Years | 373 (28.6%) | 186 (11.8%) |
| 75 Years and over | 296 (39.7%) | 283 (22.6%) |
Disability Class: Vision Difficulty
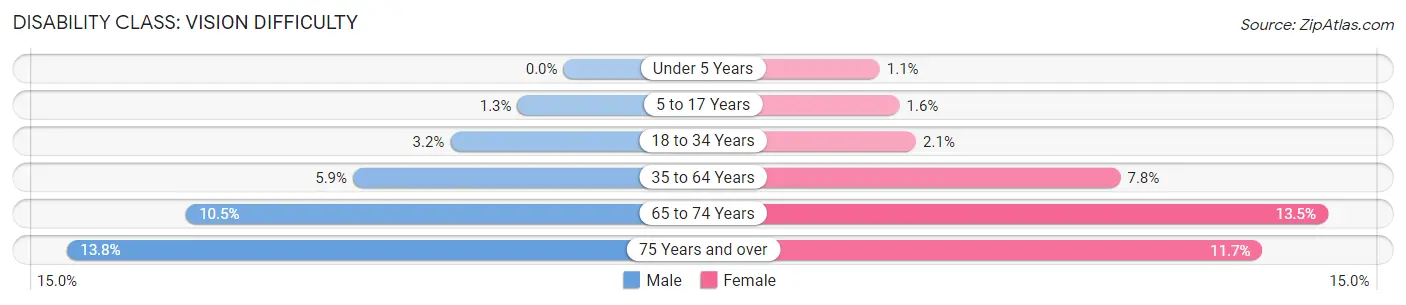
| Age Bracket | Male | Female |
| Under 5 Years | 0 (0.0%) | 10 (1.1%) |
| 5 to 17 Years | 35 (1.3%) | 42 (1.6%) |
| 18 to 34 Years | 80 (3.2%) | 57 (2.1%) |
| 35 to 64 Years | 285 (5.9%) | 407 (7.8%) |
| 65 to 74 Years | 137 (10.5%) | 214 (13.5%) |
| 75 Years and over | 103 (13.8%) | 147 (11.7%) |
Disability Class: Cognitive Difficulty
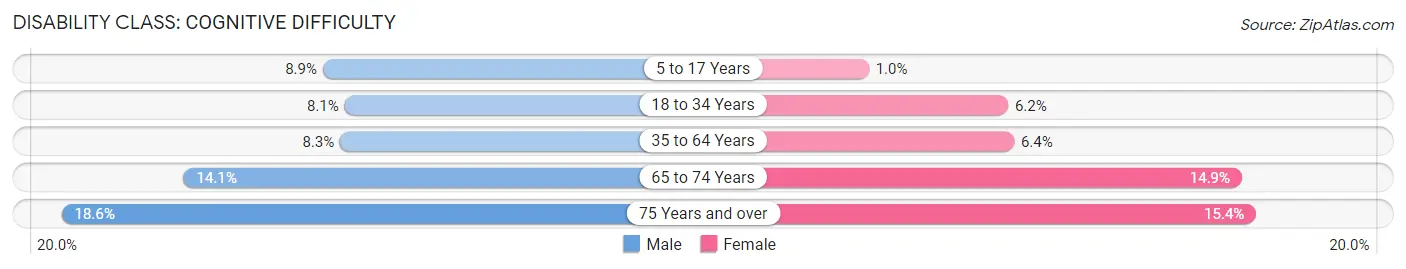
| Age Bracket | Male | Female |
| 5 to 17 Years | 244 (8.9%) | 26 (1.0%) |
| 18 to 34 Years | 206 (8.1%) | 170 (6.2%) |
| 35 to 64 Years | 403 (8.3%) | 335 (6.4%) |
| 65 to 74 Years | 184 (14.1%) | 235 (14.8%) |
| 75 Years and over | 139 (18.6%) | 193 (15.4%) |
Disability Class: Ambulatory Difficulty
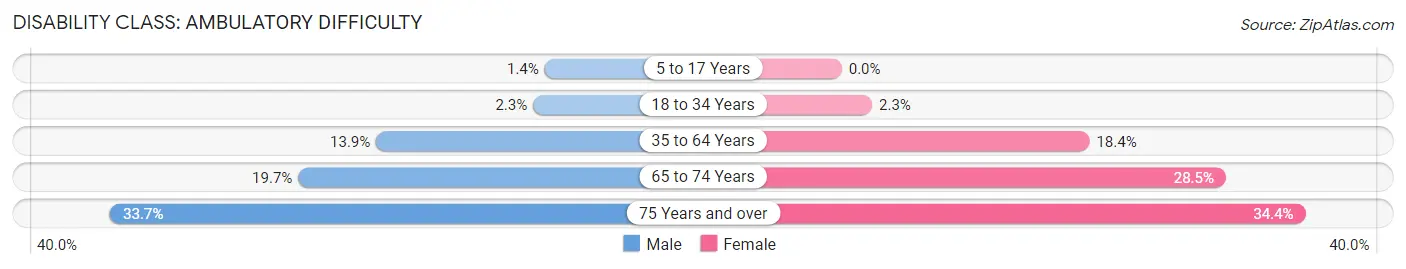
| Age Bracket | Male | Female |
| 5 to 17 Years | 38 (1.4%) | 0 (0.0%) |
| 18 to 34 Years | 57 (2.2%) | 62 (2.2%) |
| 35 to 64 Years | 676 (13.9%) | 964 (18.4%) |
| 65 to 74 Years | 257 (19.7%) | 451 (28.5%) |
| 75 Years and over | 251 (33.7%) | 432 (34.4%) |
Disability Class: Self-Care Difficulty
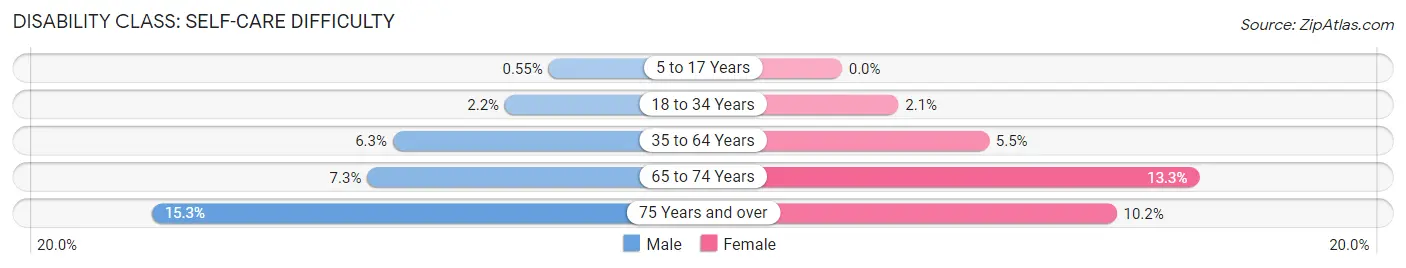
| Age Bracket | Male | Female |
| 5 to 17 Years | 15 (0.5%) | 0 (0.0%) |
| 18 to 34 Years | 55 (2.2%) | 58 (2.1%) |
| 35 to 64 Years | 308 (6.3%) | 286 (5.5%) |
| 65 to 74 Years | 95 (7.3%) | 210 (13.3%) |
| 75 Years and over | 114 (15.3%) | 128 (10.2%) |
Technology Access in Dunklin County
Computing Device Access in Dunklin County
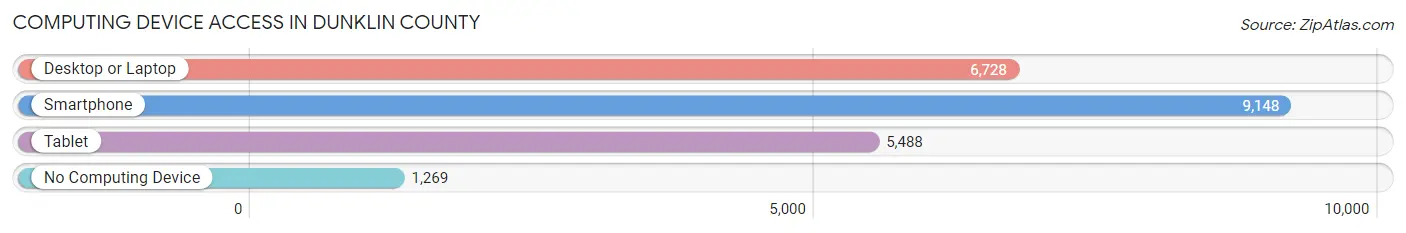
| Device Type | # Households | % Households |
| Desktop or Laptop | 6,728 | 60.4% |
| Smartphone | 9,148 | 82.2% |
| Tablet | 5,488 | 49.3% |
| No Computing Device | 1,269 | 11.4% |
| Total | 11,134 | 100.0% |
Internet Access in Dunklin County
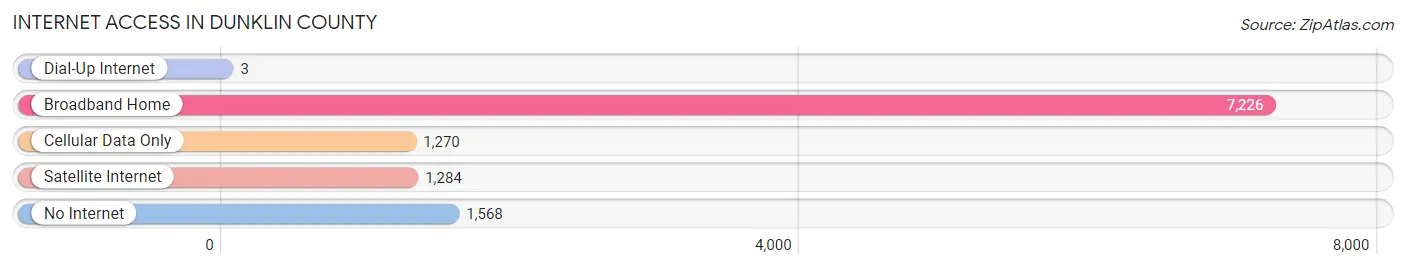
| Internet Type | # Households | % Households |
| Dial-Up Internet | 3 | 0.0% |
| Broadband Home | 7,226 | 64.9% |
| Cellular Data Only | 1,270 | 11.4% |
| Satellite Internet | 1,284 | 11.5% |
| No Internet | 1,568 | 14.1% |
| Total | 11,134 | 100.0% |
Dunklin County Summary
Dunklin County is located in the southeastern corner of Missouri, and is bordered by Arkansas to the south and Mississippi to the east. It is part of the Bootheel region of Missouri, and is the second-largest county in the state by area. The county seat is Kennett, and the largest city is Kennett. As of the 2010 census, the population was 31,953.
History
Dunklin County was organized in 1845 from parts of New Madrid, Stoddard, and Cape Girardeau counties. It was named for Daniel Dunklin, the fifth governor of Missouri. The county was largely rural and agricultural until the early 20th century, when the St. Louis-San Francisco Railway (Frisco) was built through the county. This brought an influx of new residents and businesses, and the county began to develop.
Geography
Dunklin County is located in the southeastern corner of Missouri, and is bordered by Arkansas to the south and Mississippi to the east. It is part of the Bootheel region of Missouri, and is the second-largest county in the state by area. The county has a total area of 819 square miles, of which 817 square miles is land and 2 square miles (0.2%) is water. The lowest point in the county is the St. Francis River, which forms the county's eastern border with Mississippi.
The county is mostly flat, with some rolling hills in the northern and western parts. The soil is mostly sandy loam, with some clay in the northern and western parts. The climate is humid subtropical, with hot, humid summers and mild winters.
Economy
Dunklin County's economy is largely based on agriculture. The county is one of the leading producers of cotton in the state, and is also a major producer of soybeans, corn, and wheat. Other crops grown in the county include rice, sorghum, and hay.
The county also has a strong manufacturing sector, with several factories producing furniture, clothing, and other goods. The county is also home to several large poultry processing plants.
Demographics
As of the 2010 census, there were 31,953 people, 11,945 households, and 8,541 families living in the county. The population density was 39.3 people per square mile. The racial makeup of the county was 79.2% White, 17.7% Black or African American, 0.4% Native American, 0.3% Asian, 0.1% Pacific Islander, 0.7% from other races, and 1.5% from two or more races. Hispanic or Latino of any race were 2.2% of the population.
The median income for a household in the county was $30,945, and the median income for a family was $37,945. The per capita income for the county was $15,945. About 19.2% of families and 23.2% of the population were below the poverty line, including 33.2% of those under age 18 and 16.2% of those age 65 or over.
Common Questions
What is Per Capita Income in Dunklin County?
Per Capita income in Dunklin County is $26,123.
What is the Median Family Income in Dunklin County?
Median Family Income in Dunklin County is $58,785.
What is the Median Household income in Dunklin County?
Median Household Income in Dunklin County is $44,868.
What is Income or Wage Gap in Dunklin County?
Income or Wage Gap in Dunklin County is 32.4%.
Women in Dunklin County earn 67.6 cents for every dollar earned by a man.
What is Family Income Deficit in Dunklin County?
Family Income Deficit in Dunklin County is $11,163.
Families that are below poverty line in Dunklin County earn $11,163 less on average than the poverty threshold level.
What is Inequality or Gini Index in Dunklin County?
Inequality or Gini Index in Dunklin County is 0.49.
What is the Total Population of Dunklin County?
Total Population of Dunklin County is 28,174.
What is the Total Male Population of Dunklin County?
Total Male Population of Dunklin County is 13,489.
What is the Total Female Population of Dunklin County?
Total Female Population of Dunklin County is 14,685.
What is the Ratio of Males per 100 Females in Dunklin County?
There are 91.86 Males per 100 Females in Dunklin County.
What is the Ratio of Females per 100 Males in Dunklin County?
There are 108.87 Females per 100 Males in Dunklin County.
What is the Median Population Age in Dunklin County?
Median Population Age in Dunklin County is 39.4 Years.
What is the Average Family Size in Dunklin County
Average Family Size in Dunklin County is 3.0 People.
What is the Average Household Size in Dunklin County
Average Household Size in Dunklin County is 2.5 People.
How Large is the Labor Force in Dunklin County?
There are 11,722 People in the Labor Forcein in Dunklin County.
What is the Percentage of People in the Labor Force in Dunklin County?
53.9% of People are in the Labor Force in Dunklin County.
What is the Unemployment Rate in Dunklin County?
Unemployment Rate in Dunklin County is 5.7%.