Dent County, MO Map & Demographics
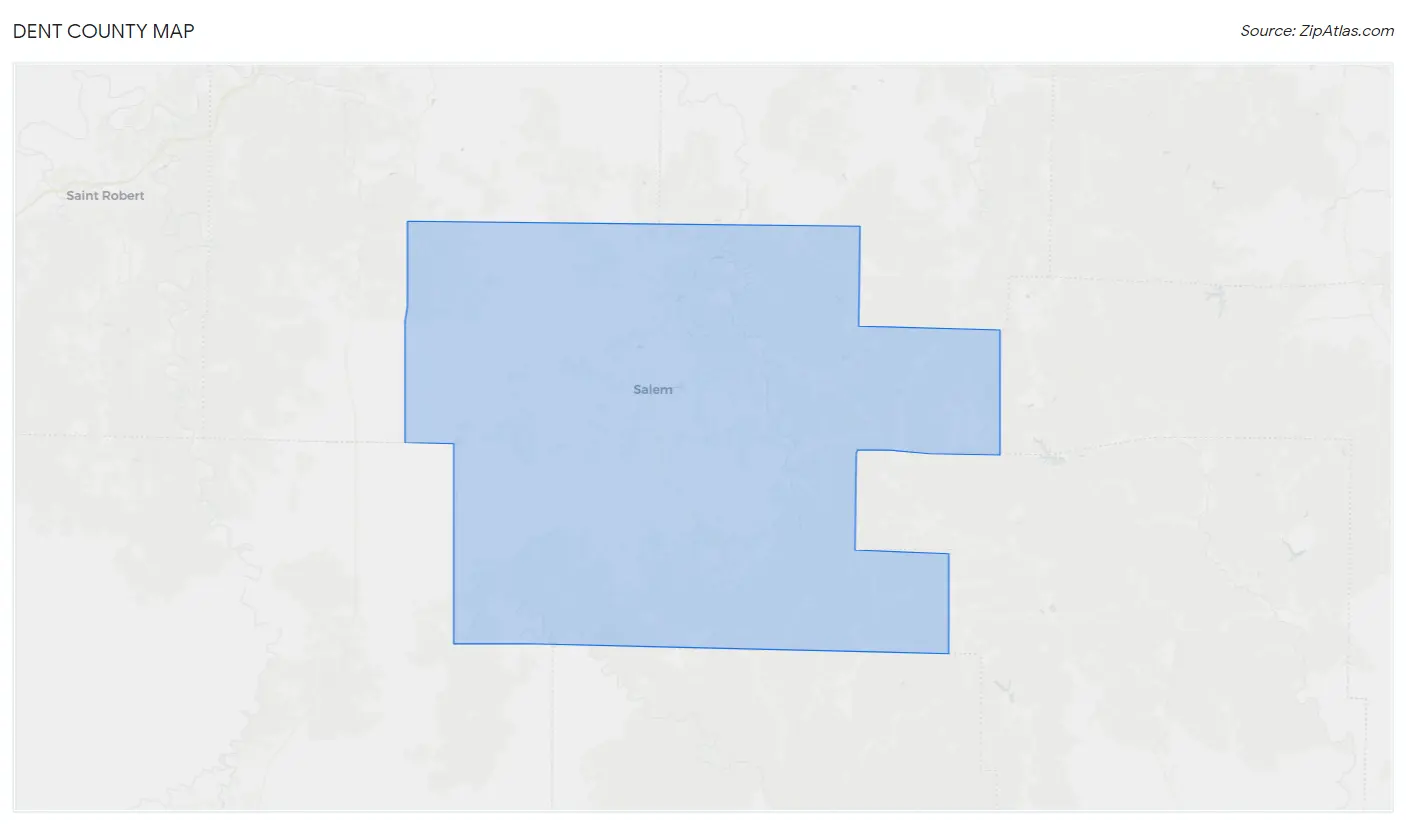
Dent County Map
Dent County Overview
$27,342
PER CAPITA INCOME
$59,708
AVG FAMILY INCOME
$51,410
AVG HOUSEHOLD INCOME
27.3%
WAGE / INCOME GAP [ % ]
72.7¢/ $1
WAGE / INCOME GAP [ $ ]
$10,221
FAMILY INCOME DEFICIT
0.45
INEQUALITY / GINI INDEX
14,509
TOTAL POPULATION
7,257
MALE POPULATION
7,252
FEMALE POPULATION
100.07
MALES / 100 FEMALES
99.93
FEMALES / 100 MALES
43.7
MEDIAN AGE
3.1
AVG FAMILY SIZE
2.5
AVG HOUSEHOLD SIZE
6,466
LABOR FORCE [ PEOPLE ]
55.8%
PERCENT IN LABOR FORCE
4.8%
UNEMPLOYMENT RATE
Dent County Area Codes
Income in Dent County
Income Overview in Dent County
Per Capita Income in Dent County is $27,342, while median incomes of families and households are $59,708 and $51,410 respectively.
| Characteristic | Number | Measure |
| Per Capita Income | 14,509 | $27,342 |
| Median Family Income | 3,769 | $59,708 |
| Mean Family Income | 3,769 | $77,178 |
| Median Household Income | 5,825 | $51,410 |
| Mean Household Income | 5,825 | $65,460 |
| Income Deficit | 3,769 | $10,221 |
| Wage / Income Gap (%) | 14,509 | 27.25% |
| Wage / Income Gap ($) | 14,509 | 72.75¢ per $1 |
| Gini / Inequality Index | 14,509 | 0.45 |
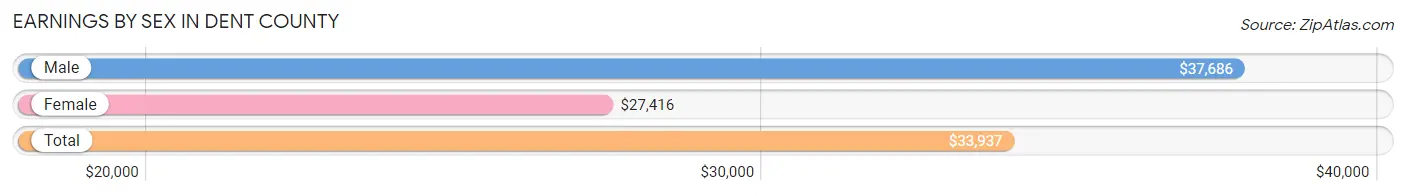
Earnings by Sex in Dent County
Average Earnings in Dent County are $33,937, $37,686 for men and $27,416 for women, a difference of 27.3%.
| Sex | Number | Average Earnings |
| Male | 3,527 (52.3%) | $37,686 |
| Female | 3,219 (47.7%) | $27,416 |
| Total | 6,746 (100.0%) | $33,937 |
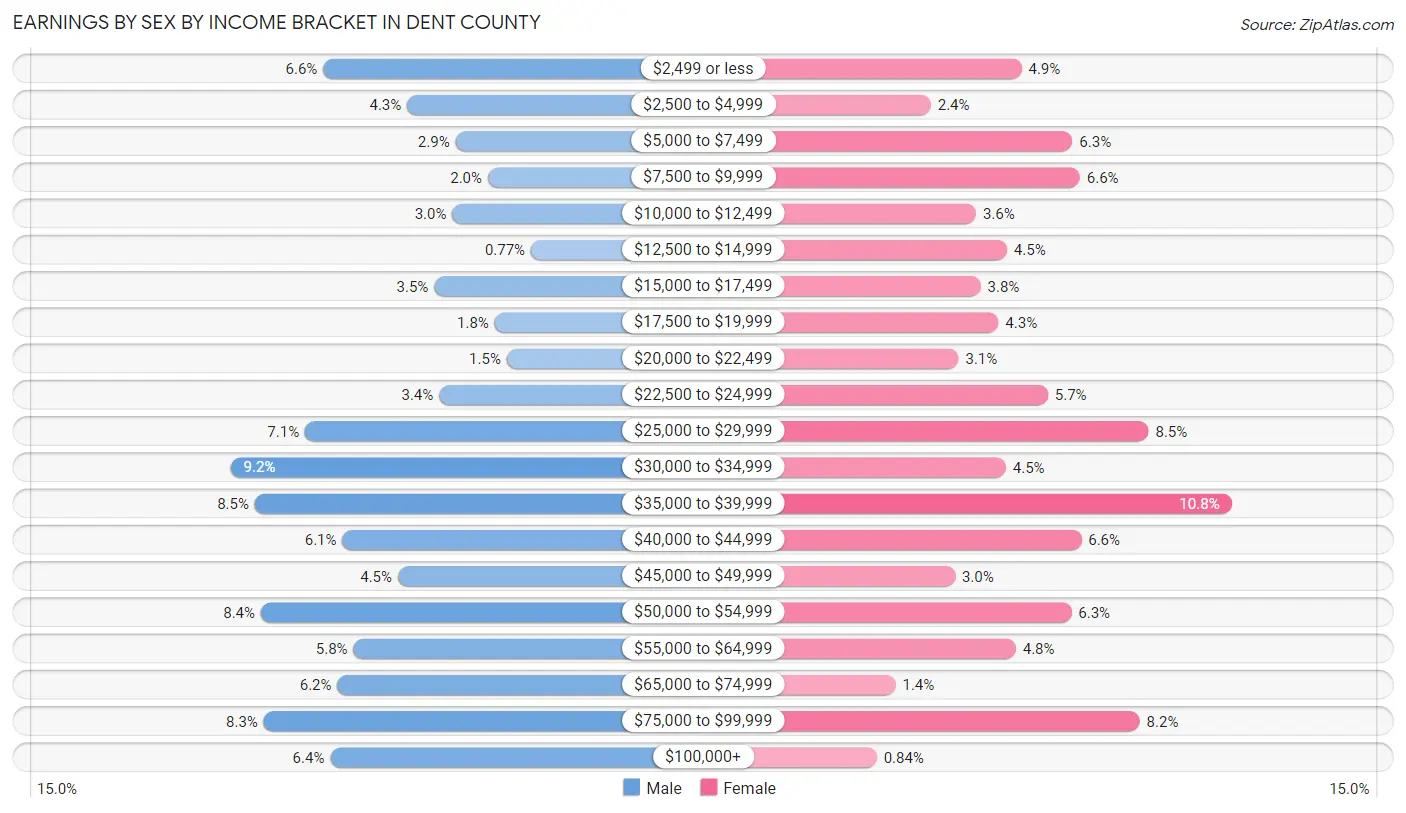
Earnings by Sex by Income Bracket in Dent County
The most common earnings brackets in Dent County are $30,000 to $34,999 for men (325 | 9.2%) and $35,000 to $39,999 for women (348 | 10.8%).
| Income | Male | Female |
| $2,499 or less | 233 (6.6%) | 158 (4.9%) |
| $2,500 to $4,999 | 150 (4.3%) | 76 (2.4%) |
| $5,000 to $7,499 | 102 (2.9%) | 204 (6.3%) |
| $7,500 to $9,999 | 70 (2.0%) | 211 (6.6%) |
| $10,000 to $12,499 | 105 (3.0%) | 117 (3.6%) |
| $12,500 to $14,999 | 27 (0.8%) | 145 (4.5%) |
| $15,000 to $17,499 | 123 (3.5%) | 121 (3.8%) |
| $17,500 to $19,999 | 63 (1.8%) | 137 (4.3%) |
| $20,000 to $22,499 | 51 (1.5%) | 101 (3.1%) |
| $22,500 to $24,999 | 118 (3.4%) | 182 (5.7%) |
| $25,000 to $29,999 | 251 (7.1%) | 273 (8.5%) |
| $30,000 to $34,999 | 325 (9.2%) | 144 (4.5%) |
| $35,000 to $39,999 | 301 (8.5%) | 348 (10.8%) |
| $40,000 to $44,999 | 214 (6.1%) | 212 (6.6%) |
| $45,000 to $49,999 | 159 (4.5%) | 98 (3.0%) |
| $50,000 to $54,999 | 295 (8.4%) | 203 (6.3%) |
| $55,000 to $64,999 | 203 (5.8%) | 153 (4.8%) |
| $65,000 to $74,999 | 219 (6.2%) | 44 (1.4%) |
| $75,000 to $99,999 | 292 (8.3%) | 265 (8.2%) |
| $100,000+ | 226 (6.4%) | 27 (0.8%) |
| Total | 3,527 (100.0%) | 3,219 (100.0%) |
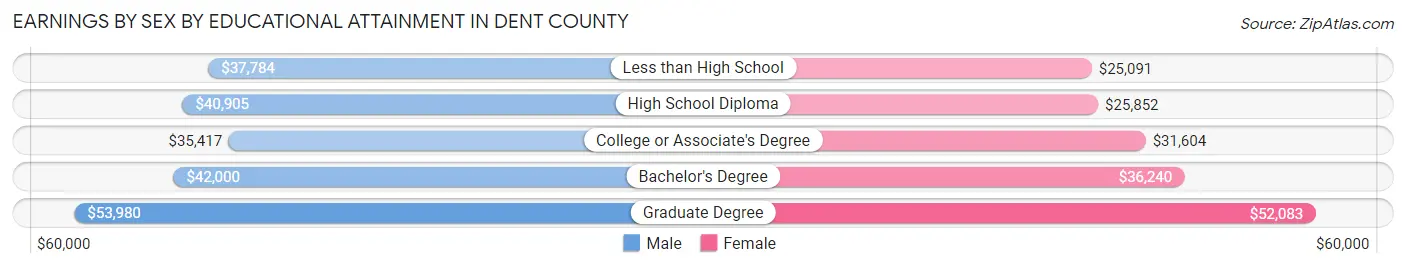
Earnings by Sex by Educational Attainment in Dent County
Average earnings in Dent County are $39,747 for men and $33,176 for women, a difference of 16.5%. Men with an educational attainment of graduate degree enjoy the highest average annual earnings of $53,980, while those with college or associate's degree education earn the least with $35,417. Women with an educational attainment of graduate degree earn the most with the average annual earnings of $52,083, while those with less than high school education have the smallest earnings of $25,091.
| Educational Attainment | Male Income | Female Income |
| Less than High School | $37,784 | $25,091 |
| High School Diploma | $40,905 | $25,852 |
| College or Associate's Degree | $35,417 | $31,604 |
| Bachelor's Degree | $42,000 | $36,240 |
| Graduate Degree | $53,980 | $52,083 |
| Total | $39,747 | $33,176 |
Family Income in Dent County
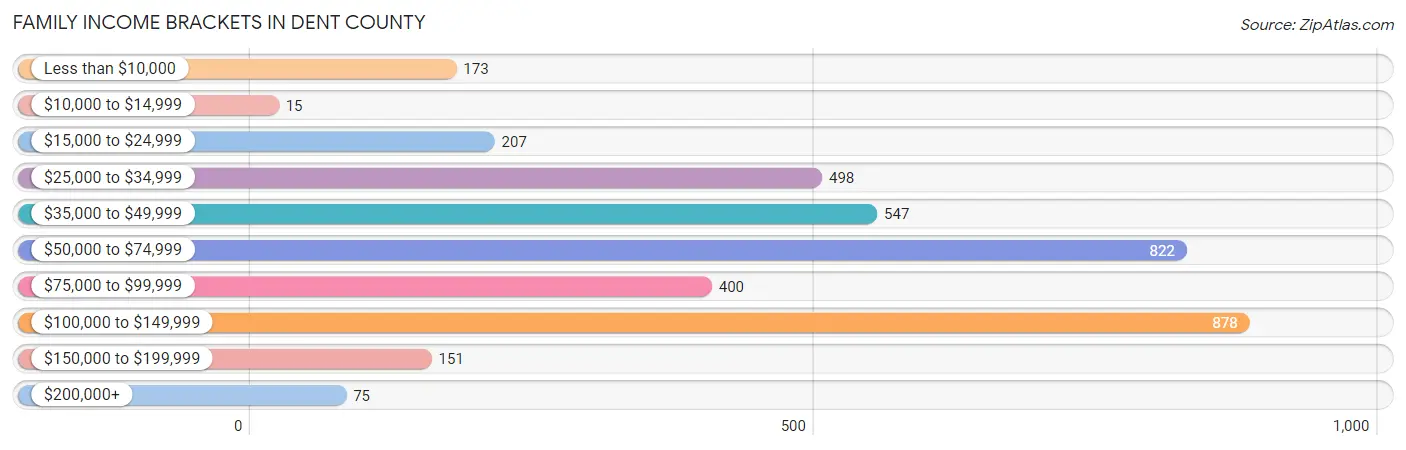
Family Income Brackets in Dent County
According to the Dent County family income data, there are 878 families falling into the $100,000 to $149,999 income range, which is the most common income bracket and makes up 23.3% of all families. Conversely, the $10,000 to $14,999 income bracket is the least frequent group with only 15 families (0.4%) belonging to this category.
| Income Bracket | # Families | % Families |
| Less than $10,000 | 173 | 4.6% |
| $10,000 to $14,999 | 15 | 0.4% |
| $15,000 to $24,999 | 207 | 5.5% |
| $25,000 to $34,999 | 498 | 13.2% |
| $35,000 to $49,999 | 547 | 14.5% |
| $50,000 to $74,999 | 822 | 21.8% |
| $75,000 to $99,999 | 400 | 10.6% |
| $100,000 to $149,999 | 878 | 23.3% |
| $150,000 to $199,999 | 151 | 4.0% |
| $200,000+ | 75 | 2.0% |
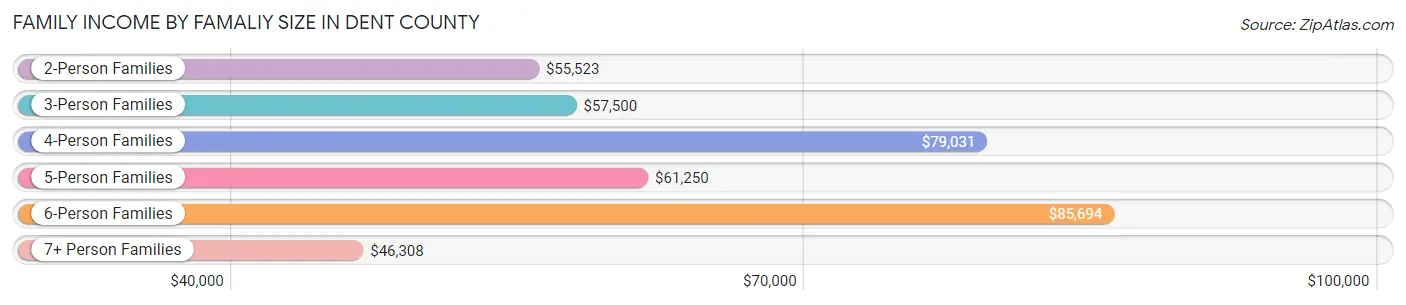
Family Income by Famaliy Size in Dent County
6-person families (85 | 2.3%) account for the highest median family income in Dent County with $85,694 per family, while 2-person families (1,949 | 51.7%) have the highest median income of $27,762 per family member.
| Income Bracket | # Families | Median Income |
| 2-Person Families | 1,949 (51.7%) | $55,523 |
| 3-Person Families | 688 (18.2%) | $57,500 |
| 4-Person Families | 676 (17.9%) | $79,031 |
| 5-Person Families | 236 (6.3%) | $61,250 |
| 6-Person Families | 85 (2.3%) | $85,694 |
| 7+ Person Families | 135 (3.6%) | $46,308 |
| Total | 3,769 (100.0%) | $59,708 |
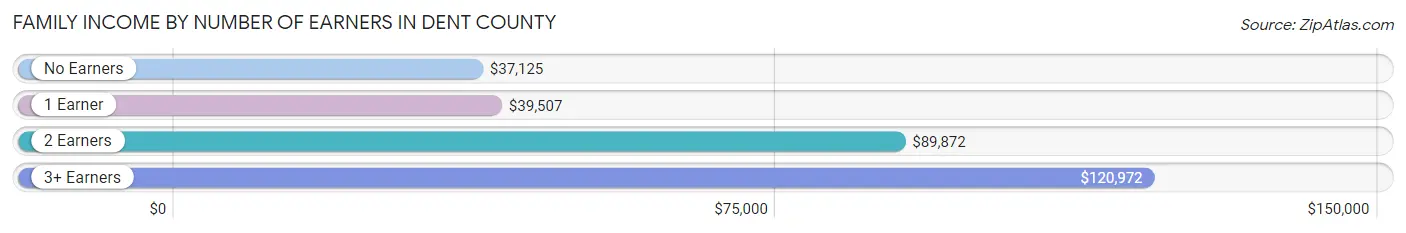
Family Income by Number of Earners in Dent County
The median family income in Dent County is $59,708, with families comprising 3+ earners (298) having the highest median family income of $120,972, while families with no earners (746) have the lowest median family income of $37,125, accounting for 7.9% and 19.8% of families, respectively.
| Number of Earners | # Families | Median Income |
| No Earners | 746 (19.8%) | $37,125 |
| 1 Earner | 1,055 (28.0%) | $39,507 |
| 2 Earners | 1,670 (44.3%) | $89,872 |
| 3+ Earners | 298 (7.9%) | $120,972 |
| Total | 3,769 (100.0%) | $59,708 |
Household Income in Dent County
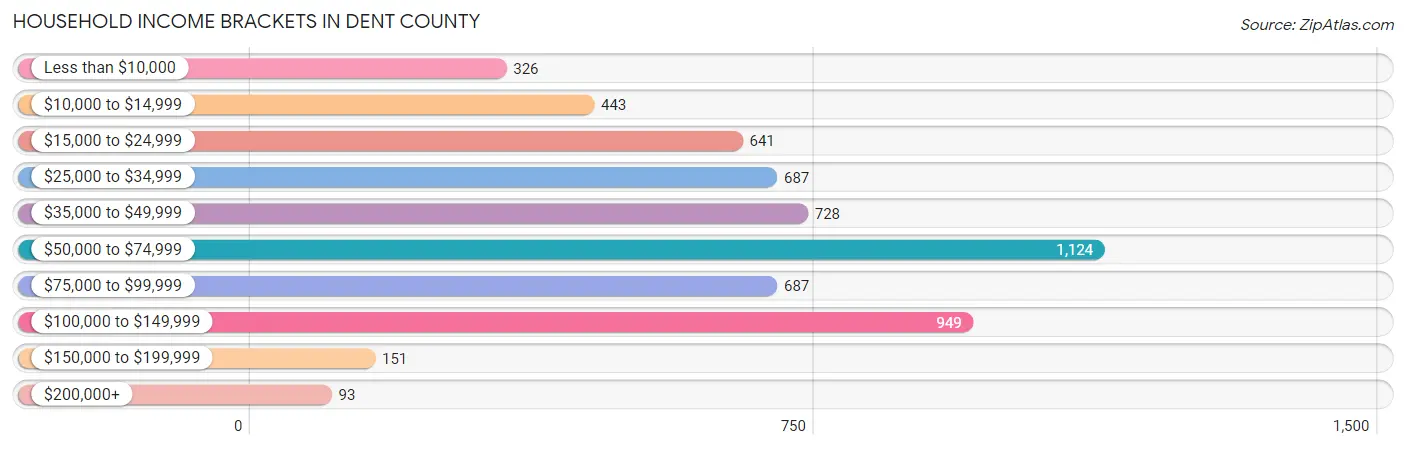
Household Income Brackets in Dent County
With 1,124 households falling in the category, the $50,000 to $74,999 income range is the most frequent in Dent County, accounting for 19.3% of all households. In contrast, only 93 households (1.6%) fall into the $200,000+ income bracket, making it the least populous group.
| Income Bracket | # Households | % Households |
| Less than $10,000 | 326 | 5.6% |
| $10,000 to $14,999 | 443 | 7.6% |
| $15,000 to $24,999 | 641 | 11.0% |
| $25,000 to $34,999 | 687 | 11.8% |
| $35,000 to $49,999 | 728 | 12.5% |
| $50,000 to $74,999 | 1,124 | 19.3% |
| $75,000 to $99,999 | 687 | 11.8% |
| $100,000 to $149,999 | 949 | 16.3% |
| $150,000 to $199,999 | 151 | 2.6% |
| $200,000+ | 93 | 1.6% |
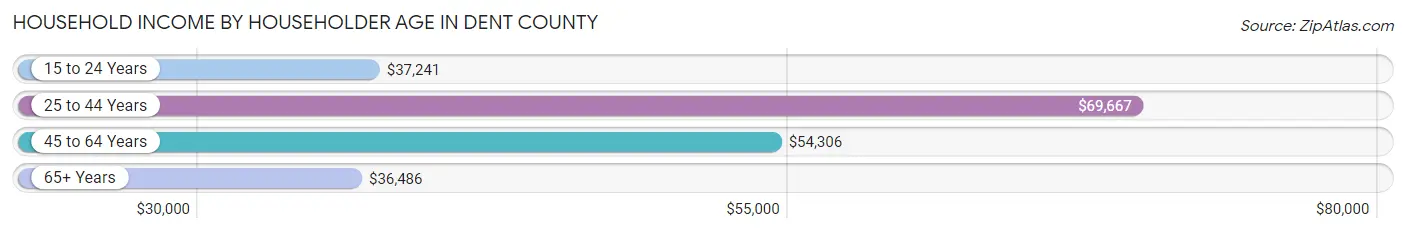
Household Income by Householder Age in Dent County
The median household income in Dent County is $51,410, with the highest median household income of $69,667 found in the 25 to 44 years age bracket for the primary householder. A total of 1,428 households (24.5%) fall into this category. Meanwhile, the 65+ years age bracket for the primary householder has the lowest median household income of $36,486, with 2,058 households (35.3%) in this group.
| Income Bracket | # Households | Median Income |
| 15 to 24 Years | 204 (3.5%) | $37,241 |
| 25 to 44 Years | 1,428 (24.5%) | $69,667 |
| 45 to 64 Years | 2,135 (36.6%) | $54,306 |
| 65+ Years | 2,058 (35.3%) | $36,486 |
| Total | 5,825 (100.0%) | $51,410 |
Poverty in Dent County
Income Below Poverty by Sex and Age in Dent County
With 15.8% poverty level for males and 17.8% for females among the residents of Dent County, 5 year old males and 5 year old females are the most vulnerable to poverty, with 35 males (44.3%) and 38 females (50.7%) in their respective age groups living below the poverty level.
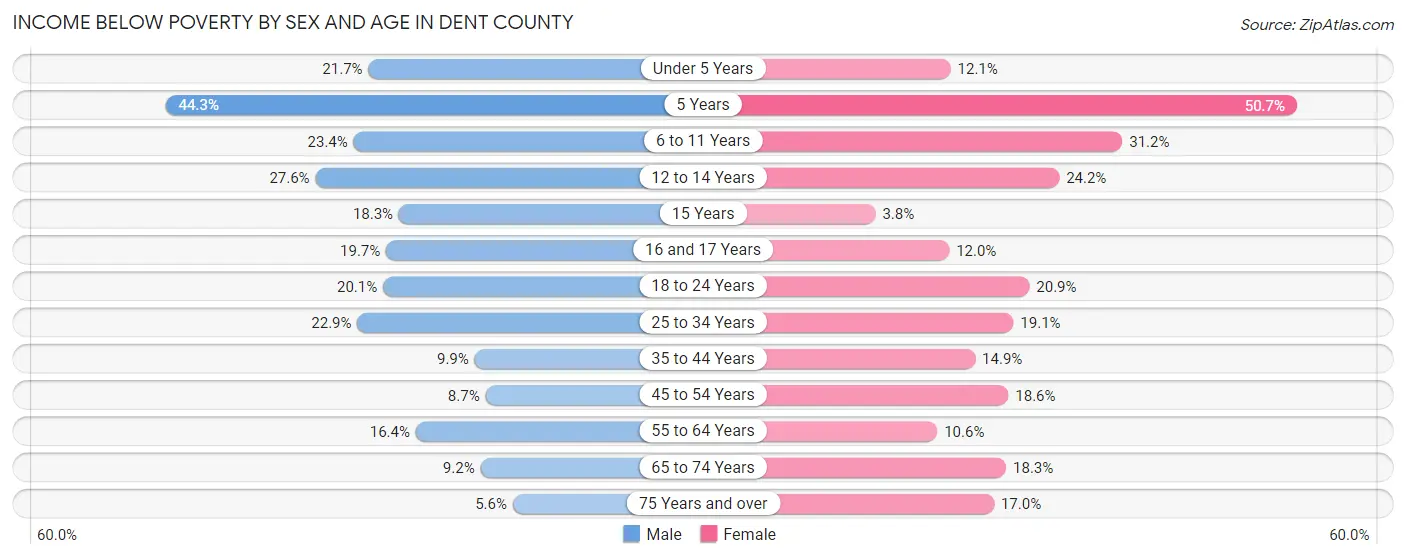
| Age Bracket | Male | Female |
| Under 5 Years | 89 (21.7%) | 48 (12.1%) |
| 5 Years | 35 (44.3%) | 38 (50.7%) |
| 6 to 11 Years | 135 (23.4%) | 189 (31.2%) |
| 12 to 14 Years | 98 (27.6%) | 46 (24.2%) |
| 15 Years | 26 (18.3%) | 3 (3.7%) |
| 16 and 17 Years | 30 (19.7%) | 25 (12.0%) |
| 18 to 24 Years | 103 (20.1%) | 103 (20.9%) |
| 25 to 34 Years | 164 (22.9%) | 142 (19.1%) |
| 35 to 44 Years | 84 (9.9%) | 116 (14.8%) |
| 45 to 54 Years | 77 (8.7%) | 159 (18.5%) |
| 55 to 64 Years | 183 (16.4%) | 114 (10.6%) |
| 65 to 74 Years | 76 (9.2%) | 170 (18.3%) |
| 75 Years and over | 30 (5.6%) | 129 (17.0%) |
| Total | 1,130 (15.8%) | 1,282 (17.8%) |
Income Above Poverty by Sex and Age in Dent County
According to the poverty statistics in Dent County, males aged 75 years and over and females aged 15 years are the age groups that are most secure financially, with 94.4% of males and 96.3% of females in these age groups living above the poverty line.
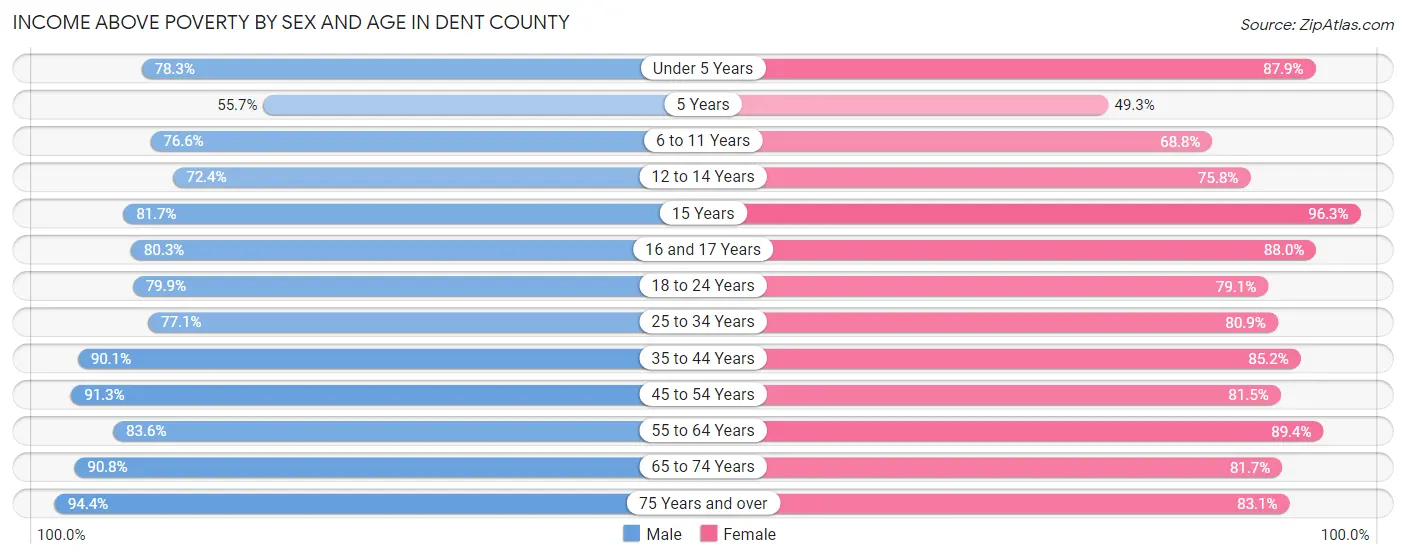
| Age Bracket | Male | Female |
| Under 5 Years | 321 (78.3%) | 348 (87.9%) |
| 5 Years | 44 (55.7%) | 37 (49.3%) |
| 6 to 11 Years | 443 (76.6%) | 416 (68.8%) |
| 12 to 14 Years | 257 (72.4%) | 144 (75.8%) |
| 15 Years | 116 (81.7%) | 77 (96.3%) |
| 16 and 17 Years | 122 (80.3%) | 184 (88.0%) |
| 18 to 24 Years | 410 (79.9%) | 390 (79.1%) |
| 25 to 34 Years | 551 (77.1%) | 601 (80.9%) |
| 35 to 44 Years | 766 (90.1%) | 665 (85.2%) |
| 45 to 54 Years | 811 (91.3%) | 698 (81.5%) |
| 55 to 64 Years | 931 (83.6%) | 958 (89.4%) |
| 65 to 74 Years | 747 (90.8%) | 759 (81.7%) |
| 75 Years and over | 503 (94.4%) | 632 (83.1%) |
| Total | 6,022 (84.2%) | 5,909 (82.2%) |
Income Below Poverty Among Married-Couple Families in Dent County
The poverty statistics for married-couple families in Dent County show that 8.3% or 232 of the total 2,799 families live below the poverty line. Families with 5 or more children have the highest poverty rate of 95.7%, comprising of 45 families. On the other hand, families with no children have the lowest poverty rate of 5.3%, which includes 87 families.
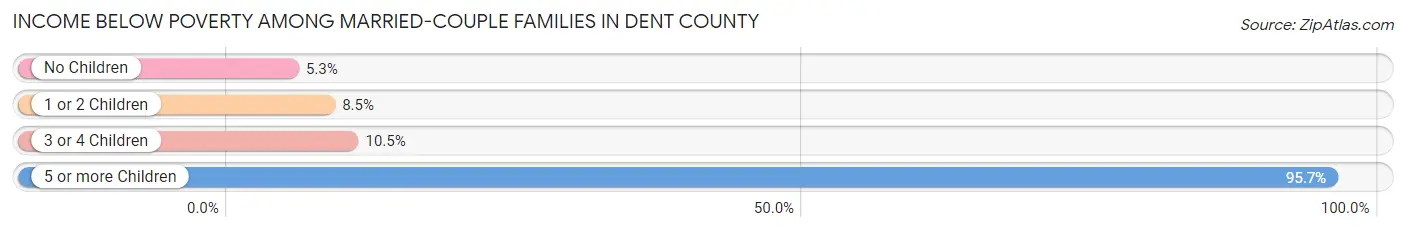
| Children | Above Poverty | Below Poverty |
| No Children | 1,552 (94.7%) | 87 (5.3%) |
| 1 or 2 Children | 757 (91.5%) | 70 (8.5%) |
| 3 or 4 Children | 256 (89.5%) | 30 (10.5%) |
| 5 or more Children | 2 (4.3%) | 45 (95.7%) |
| Total | 2,567 (91.7%) | 232 (8.3%) |
Income Below Poverty Among Single-Parent Households in Dent County
According to the poverty data in Dent County, 11.3% or 36 single-father households and 22.9% or 149 single-mother households are living below the poverty line. Among single-father households, those with 1 or 2 children have the highest poverty rate, with 29 households (43.3%) experiencing poverty. Likewise, among single-mother households, those with 1 or 2 children have the highest poverty rate, with 116 households (34.0%) falling below the poverty line.
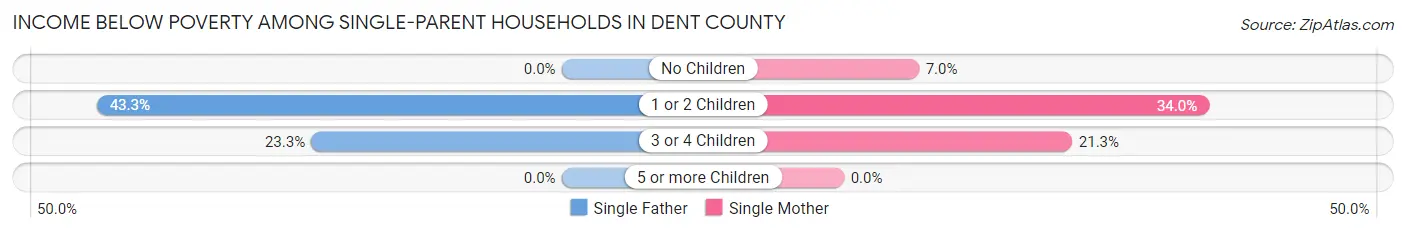
| Children | Single Father | Single Mother |
| No Children | 0 (0.0%) | 16 (7.0%) |
| 1 or 2 Children | 29 (43.3%) | 116 (34.0%) |
| 3 or 4 Children | 7 (23.3%) | 17 (21.2%) |
| 5 or more Children | 0 (0.0%) | 0 (0.0%) |
| Total | 36 (11.3%) | 149 (22.9%) |
Income Below Poverty Among Married-Couple vs Single-Parent Households in Dent County
The poverty data for Dent County shows that 232 of the married-couple family households (8.3%) and 185 of the single-parent households (19.1%) are living below the poverty level. Within the married-couple family households, those with 5 or more children have the highest poverty rate, with 45 households (95.7%) falling below the poverty line. Among the single-parent households, those with 1 or 2 children have the highest poverty rate, with 145 household (35.5%) living below poverty.
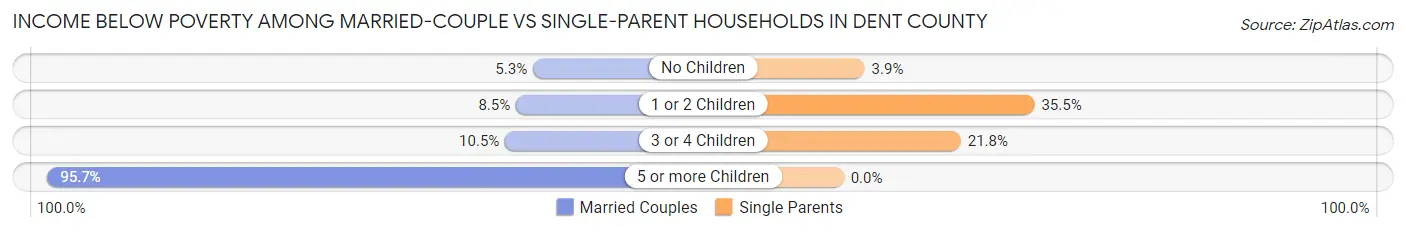
| Children | Married-Couple Families | Single-Parent Households |
| No Children | 87 (5.3%) | 16 (3.9%) |
| 1 or 2 Children | 70 (8.5%) | 145 (35.5%) |
| 3 or 4 Children | 30 (10.5%) | 24 (21.8%) |
| 5 or more Children | 45 (95.7%) | 0 (0.0%) |
| Total | 232 (8.3%) | 185 (19.1%) |
Race in Dent County
The most populous races in Dent County are White / Caucasian (13,491 | 93.0%), Two or more Races (638 | 4.4%), and Hispanic or Latino (293 | 2.0%).
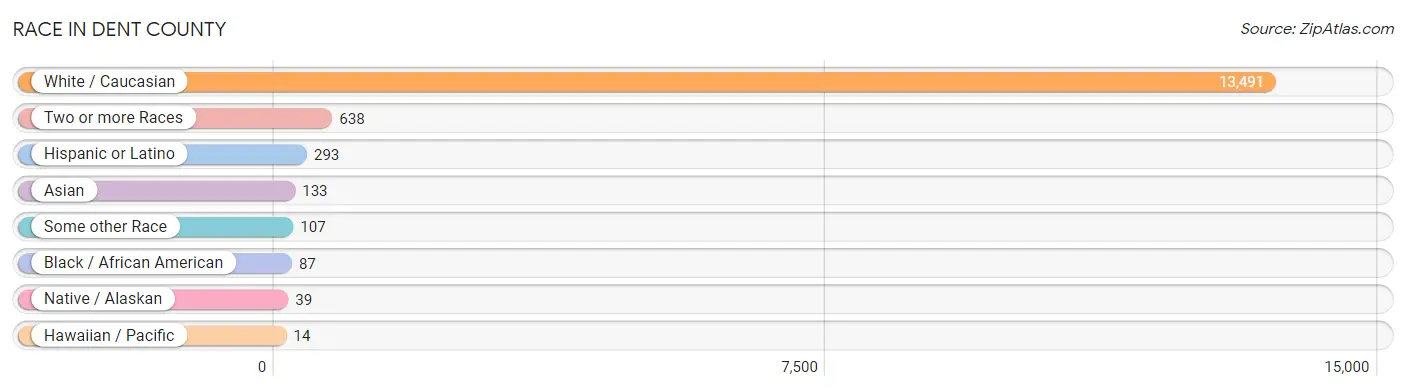
| Race | # Population | % Population |
| Asian | 133 | 0.9% |
| Black / African American | 87 | 0.6% |
| Hawaiian / Pacific | 14 | 0.1% |
| Hispanic or Latino | 293 | 2.0% |
| Native / Alaskan | 39 | 0.3% |
| White / Caucasian | 13,491 | 93.0% |
| Two or more Races | 638 | 4.4% |
| Some other Race | 107 | 0.7% |
| Total | 14,509 | 100.0% |
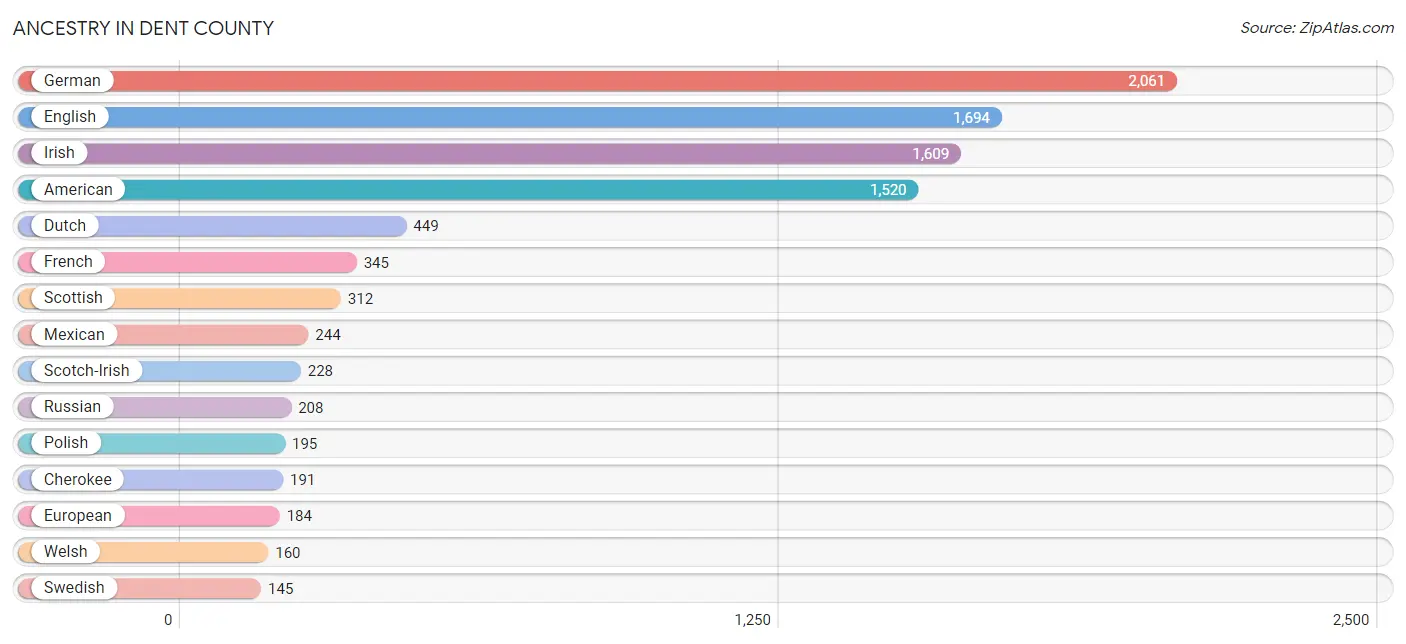
Ancestry in Dent County
The most populous ancestries reported in Dent County are German (2,061 | 14.2%), English (1,694 | 11.7%), Irish (1,609 | 11.1%), American (1,520 | 10.5%), and Dutch (449 | 3.1%), together accounting for 50.5% of all Dent County residents.
| Ancestry | # Population | % Population |
| African | 21 | 0.1% |
| American | 1,520 | 10.5% |
| Apache | 18 | 0.1% |
| Austrian | 25 | 0.2% |
| Basque | 4 | 0.0% |
| British | 91 | 0.6% |
| Cajun | 45 | 0.3% |
| Canadian | 6 | 0.0% |
| Central American Indian | 7 | 0.1% |
| Cherokee | 191 | 1.3% |
| Choctaw | 25 | 0.2% |
| Croatian | 3 | 0.0% |
| Czech | 40 | 0.3% |
| Czechoslovakian | 4 | 0.0% |
| Danish | 34 | 0.2% |
| Dutch | 449 | 3.1% |
| Eastern European | 12 | 0.1% |
| English | 1,694 | 11.7% |
| European | 184 | 1.3% |
| Finnish | 4 | 0.0% |
| French | 345 | 2.4% |
| French Canadian | 25 | 0.2% |
| German | 2,061 | 14.2% |
| Greek | 7 | 0.1% |
| Hungarian | 52 | 0.4% |
| Indian (Asian) | 108 | 0.7% |
| Irish | 1,609 | 11.1% |
| Italian | 104 | 0.7% |
| Kiowa | 57 | 0.4% |
| Korean | 7 | 0.1% |
| Lithuanian | 39 | 0.3% |
| Mexican | 244 | 1.7% |
| Northern European | 24 | 0.2% |
| Norwegian | 70 | 0.5% |
| Polish | 195 | 1.3% |
| Portuguese | 3 | 0.0% |
| Puerto Rican | 40 | 0.3% |
| Russian | 208 | 1.4% |
| Samoan | 14 | 0.1% |
| Scandinavian | 98 | 0.7% |
| Scotch-Irish | 228 | 1.6% |
| Scottish | 312 | 2.1% |
| Slavic | 5 | 0.0% |
| Spanish | 9 | 0.1% |
| Sri Lankan | 63 | 0.4% |
| Subsaharan African | 21 | 0.1% |
| Swedish | 145 | 1.0% |
| Swiss | 23 | 0.2% |
| Ukrainian | 10 | 0.1% |
| Welsh | 160 | 1.1% | View All 50 Rows |
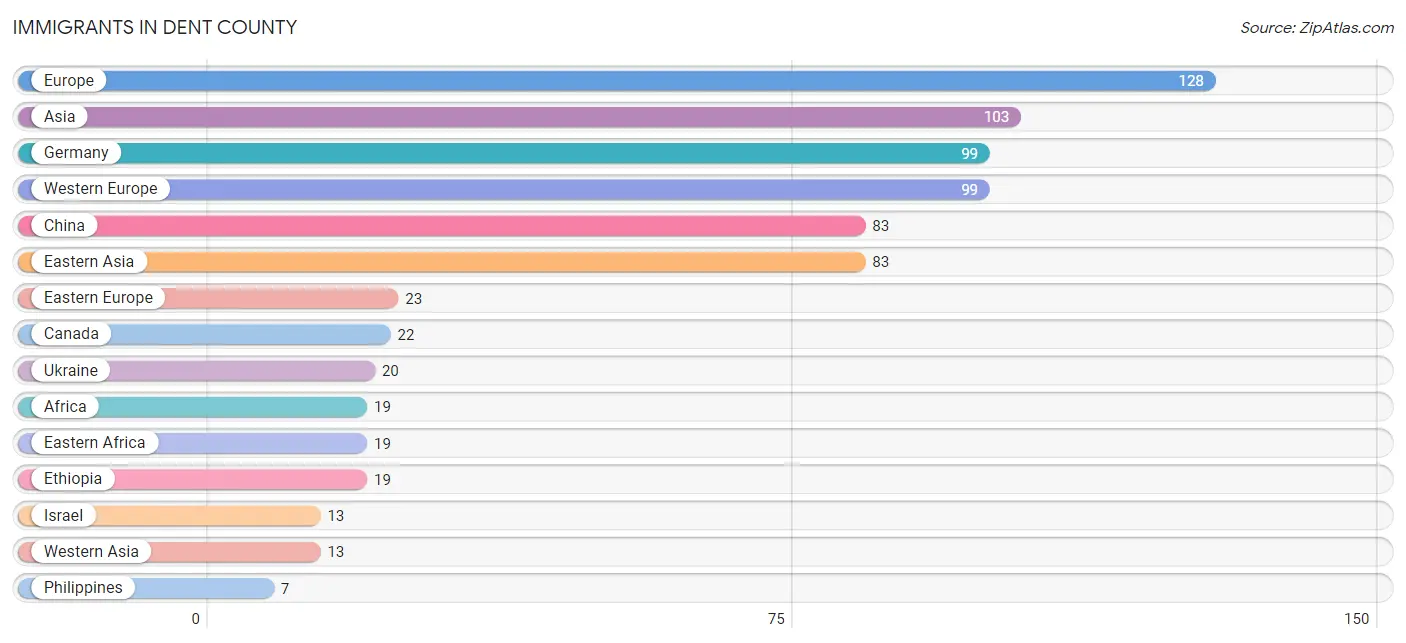
Immigrants in Dent County
The most numerous immigrant groups reported in Dent County came from Europe (128 | 0.9%), Asia (103 | 0.7%), Germany (99 | 0.7%), Western Europe (99 | 0.7%), and China (83 | 0.6%), together accounting for 3.5% of all Dent County residents.
| Immigration Origin | # Population | % Population |
| Africa | 19 | 0.1% |
| Asia | 103 | 0.7% |
| Canada | 22 | 0.2% |
| Central America | 4 | 0.0% |
| China | 83 | 0.6% |
| Croatia | 3 | 0.0% |
| Eastern Africa | 19 | 0.1% |
| Eastern Asia | 83 | 0.6% |
| Eastern Europe | 23 | 0.2% |
| England | 6 | 0.0% |
| Ethiopia | 19 | 0.1% |
| Europe | 128 | 0.9% |
| Germany | 99 | 0.7% |
| Israel | 13 | 0.1% |
| Latin America | 4 | 0.0% |
| Mexico | 4 | 0.0% |
| Northern Europe | 6 | 0.0% |
| Philippines | 7 | 0.1% |
| South Eastern Asia | 7 | 0.1% |
| Ukraine | 20 | 0.1% |
| Western Asia | 13 | 0.1% |
| Western Europe | 99 | 0.7% | View All 22 Rows |
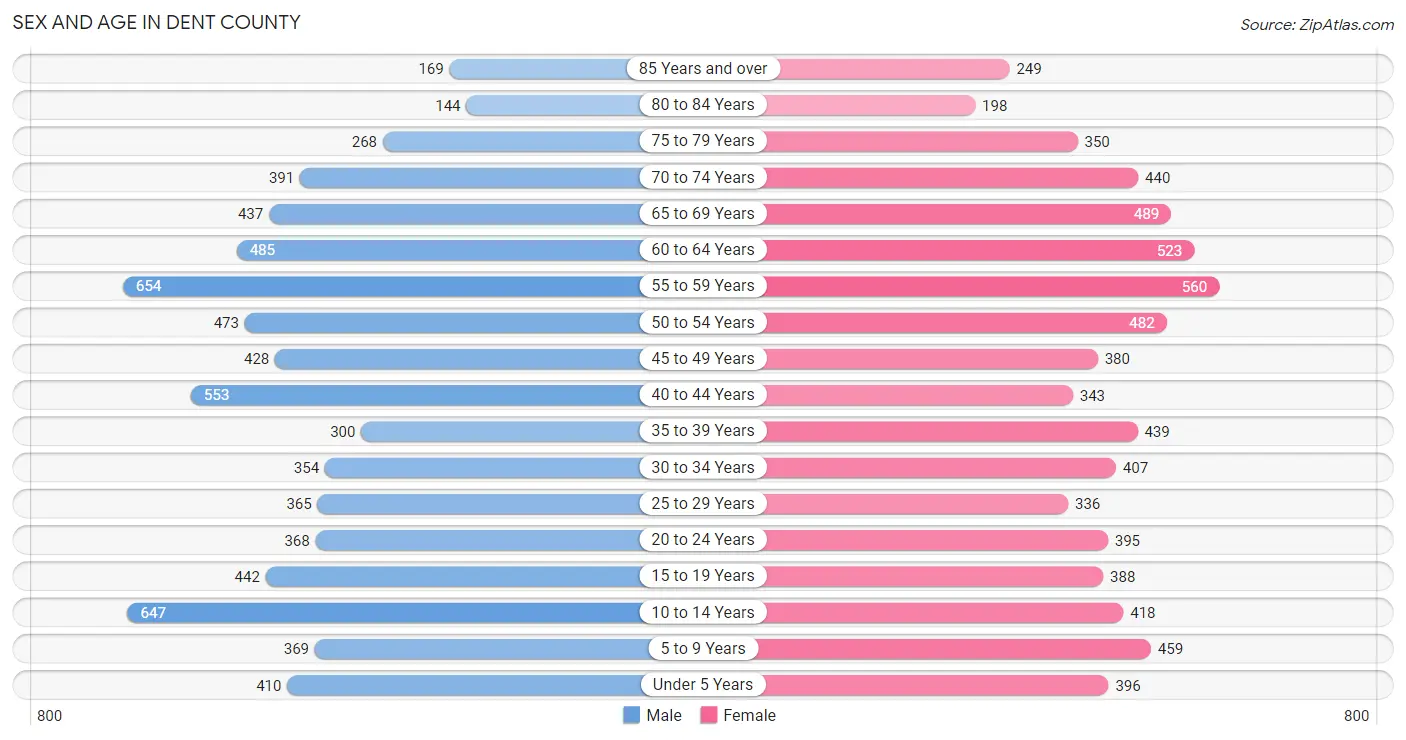
Sex and Age in Dent County
Sex and Age in Dent County
The most populous age groups in Dent County are 55 to 59 Years (654 | 9.0%) for men and 55 to 59 Years (560 | 7.7%) for women.
| Age Bracket | Male | Female |
| Under 5 Years | 410 (5.7%) | 396 (5.5%) |
| 5 to 9 Years | 369 (5.1%) | 459 (6.3%) |
| 10 to 14 Years | 647 (8.9%) | 418 (5.8%) |
| 15 to 19 Years | 442 (6.1%) | 388 (5.3%) |
| 20 to 24 Years | 368 (5.1%) | 395 (5.4%) |
| 25 to 29 Years | 365 (5.0%) | 336 (4.6%) |
| 30 to 34 Years | 354 (4.9%) | 407 (5.6%) |
| 35 to 39 Years | 300 (4.1%) | 439 (6.0%) |
| 40 to 44 Years | 553 (7.6%) | 343 (4.7%) |
| 45 to 49 Years | 428 (5.9%) | 380 (5.2%) |
| 50 to 54 Years | 473 (6.5%) | 482 (6.7%) |
| 55 to 59 Years | 654 (9.0%) | 560 (7.7%) |
| 60 to 64 Years | 485 (6.7%) | 523 (7.2%) |
| 65 to 69 Years | 437 (6.0%) | 489 (6.7%) |
| 70 to 74 Years | 391 (5.4%) | 440 (6.1%) |
| 75 to 79 Years | 268 (3.7%) | 350 (4.8%) |
| 80 to 84 Years | 144 (2.0%) | 198 (2.7%) |
| 85 Years and over | 169 (2.3%) | 249 (3.4%) |
| Total | 7,257 (100.0%) | 7,252 (100.0%) |
Families and Households in Dent County
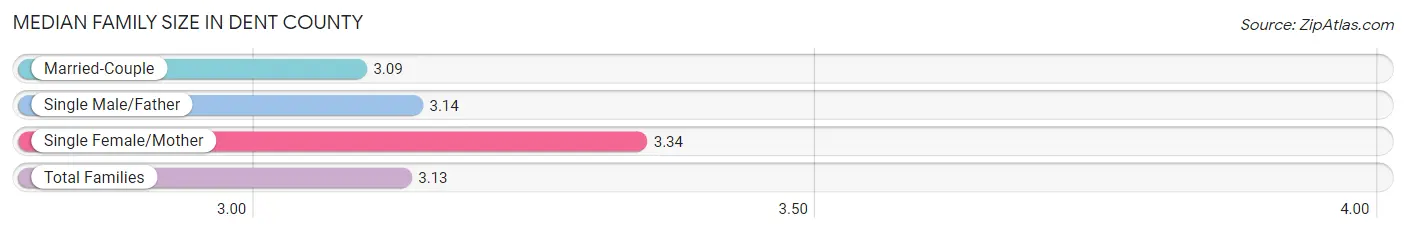
Median Family Size in Dent County
The median family size in Dent County is 3.13 persons per family, with single female/mother families (650 | 17.2%) accounting for the largest median family size of 3.34 persons per family. On the other hand, married-couple families (2,799 | 74.3%) represent the smallest median family size with 3.09 persons per family.
| Family Type | # Families | Family Size |
| Married-Couple | 2,799 (74.3%) | 3.09 |
| Single Male/Father | 320 (8.5%) | 3.14 |
| Single Female/Mother | 650 (17.2%) | 3.34 |
| Total Families | 3,769 (100.0%) | 3.13 |
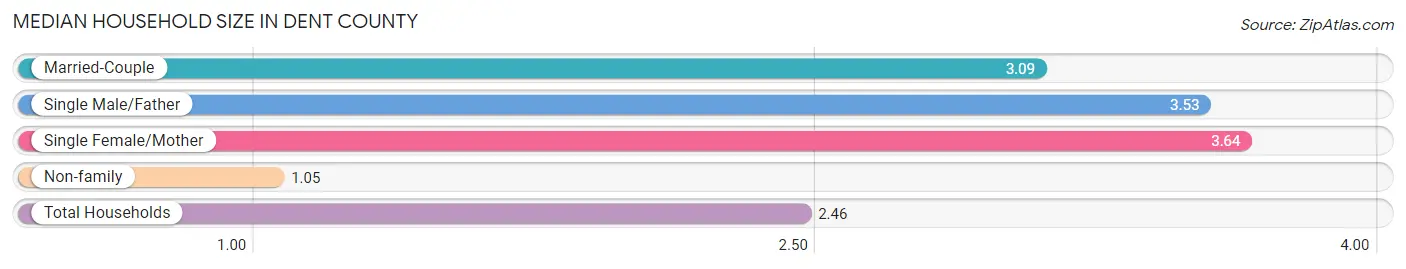
Median Household Size in Dent County
The median household size in Dent County is 2.46 persons per household, with single female/mother households (650 | 11.2%) accounting for the largest median household size of 3.64 persons per household. non-family households (2,056 | 35.3%) represent the smallest median household size with 1.05 persons per household.
| Household Type | # Households | Household Size |
| Married-Couple | 2,799 (48.0%) | 3.09 |
| Single Male/Father | 320 (5.5%) | 3.53 |
| Single Female/Mother | 650 (11.2%) | 3.64 |
| Non-family | 2,056 (35.3%) | 1.05 |
| Total Households | 5,825 (100.0%) | 2.46 |
Household Size by Marriage Status in Dent County
Out of a total of 5,825 households in Dent County, 3,769 (64.7%) are family households, while 2,056 (35.3%) are nonfamily households. The most numerous type of family households are 2-person households, comprising 1,898, and the most common type of nonfamily households are 1-person households, comprising 1,955.
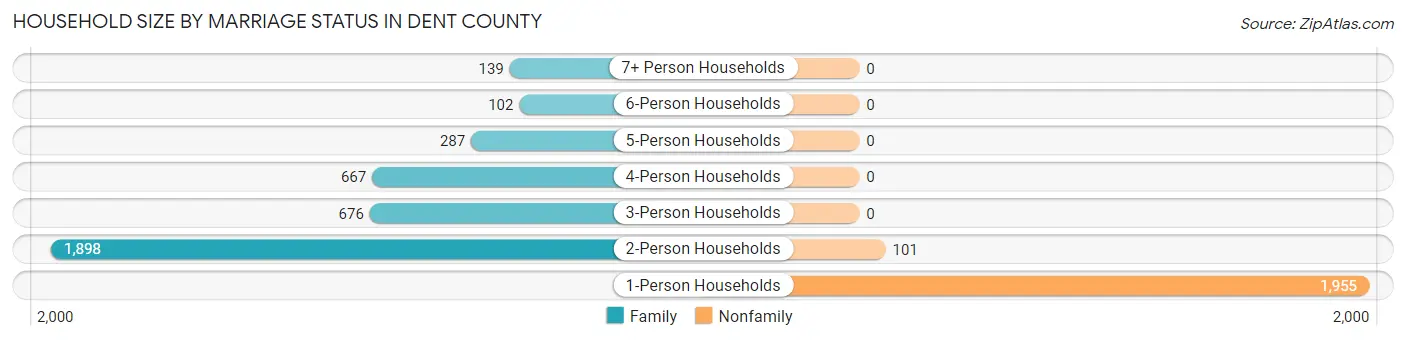
| Household Size | Family Households | Nonfamily Households |
| 1-Person Households | - | 1,955 (33.6%) |
| 2-Person Households | 1,898 (32.6%) | 101 (1.7%) |
| 3-Person Households | 676 (11.6%) | 0 (0.0%) |
| 4-Person Households | 667 (11.5%) | 0 (0.0%) |
| 5-Person Households | 287 (4.9%) | 0 (0.0%) |
| 6-Person Households | 102 (1.8%) | 0 (0.0%) |
| 7+ Person Households | 139 (2.4%) | 0 (0.0%) |
| Total | 3,769 (64.7%) | 2,056 (35.3%) |
Female Fertility in Dent County
Fertility by Age in Dent County
Average fertility rate in Dent County is 61.0 births per 1,000 women. Women in the age bracket of 20 to 34 years have the highest fertility rate with 80.0 births per 1,000 women. Women in the age bracket of 20 to 34 years acount for 52.6% of all women with births.
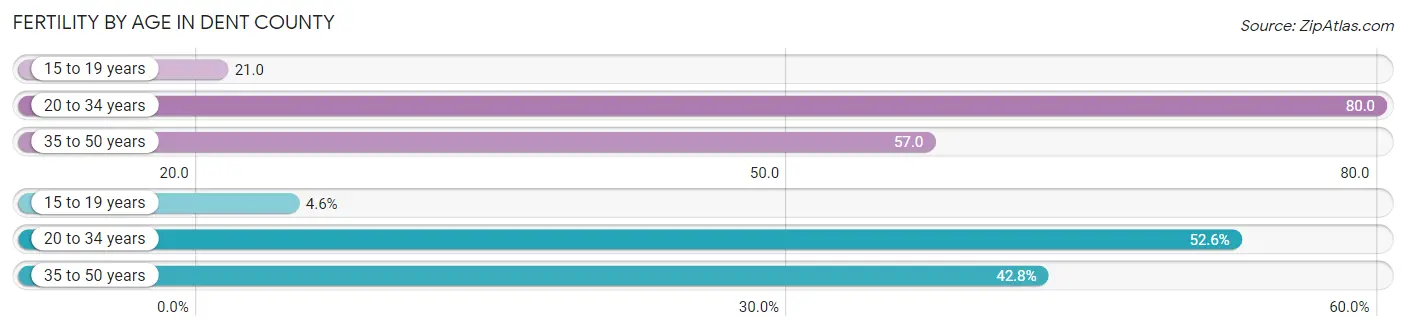
| Age Bracket | Women with Births | Births / 1,000 Women |
| 15 to 19 years | 8 (4.6%) | 21.0 |
| 20 to 34 years | 91 (52.6%) | 80.0 |
| 35 to 50 years | 74 (42.8%) | 57.0 |
| Total | 173 (100.0%) | 61.0 |
Fertility by Age by Marriage Status in Dent County
47.4% of women with births (173) in Dent County are married. The highest percentage of unmarried women with births falls into 15 to 19 years age bracket with 100.0% of them unmarried at the time of birth, while the lowest percentage of unmarried women with births belong to 20 to 34 years age bracket with 22.0% of them unmarried.
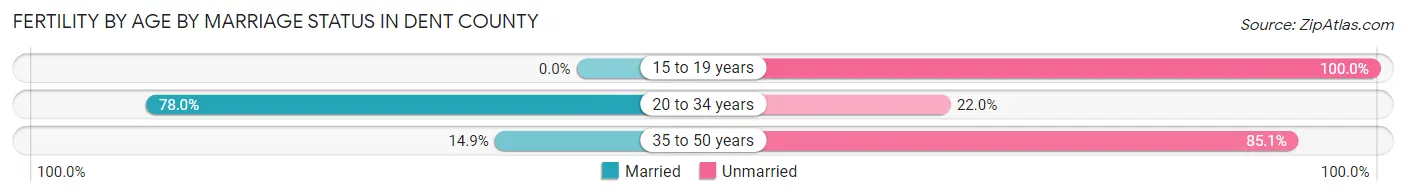
| Age Bracket | Married | Unmarried |
| 15 to 19 years | 0 (0.0%) | 8 (100.0%) |
| 20 to 34 years | 71 (78.0%) | 20 (22.0%) |
| 35 to 50 years | 11 (14.9%) | 63 (85.1%) |
| Total | 82 (47.4%) | 91 (52.6%) |
Fertility by Education in Dent County
Average fertility rate in Dent County is 61.0 births per 1,000 women. Women with the education attainment of high school diploma have the highest fertility rate of 128.0 births per 1,000 women, while women with the education attainment of bachelor's degree have the lowest fertility at 9.0 births per 1,000 women. Women with the education attainment of high school diploma represent 46.8% of all women with births.
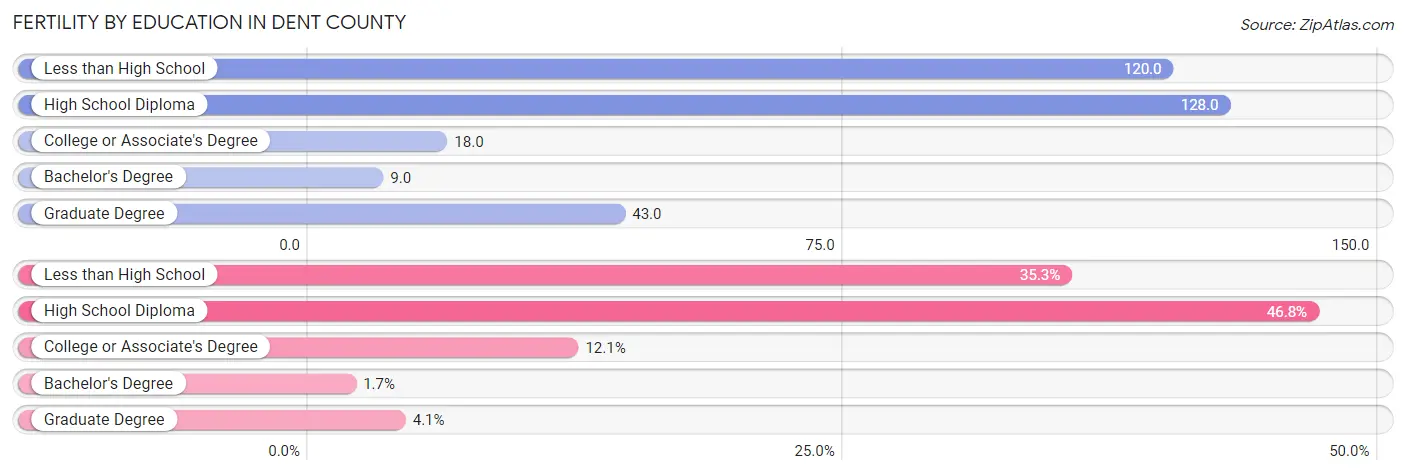
| Educational Attainment | Women with Births | Births / 1,000 Women |
| Less than High School | 61 (35.3%) | 120.0 |
| High School Diploma | 81 (46.8%) | 128.0 |
| College or Associate's Degree | 21 (12.1%) | 18.0 |
| Bachelor's Degree | 3 (1.7%) | 9.0 |
| Graduate Degree | 7 (4.1%) | 43.0 |
| Total | 173 (100.0%) | 61.0 |
Fertility by Education by Marriage Status in Dent County
52.6% of women with births in Dent County are unmarried. Women with the educational attainment of college or associate's degree are most likely to be married with 100.0% of them married at childbirth, while women with the educational attainment of less than high school are least likely to be married with 86.9% of them unmarried at childbirth.
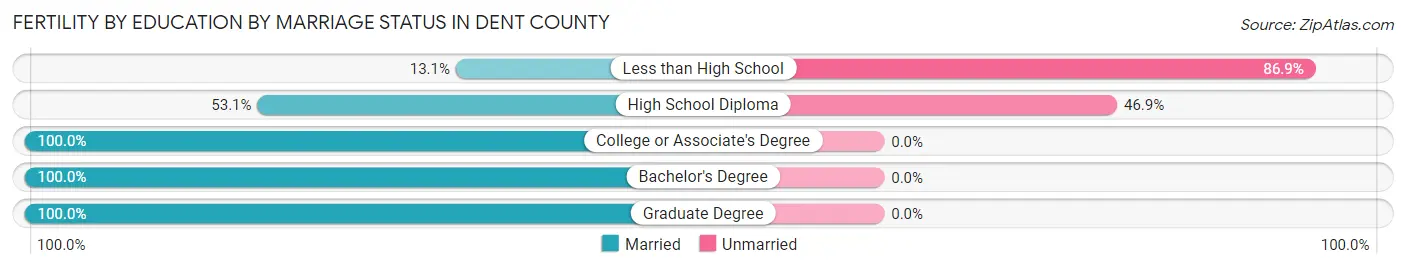
| Educational Attainment | Married | Unmarried |
| Less than High School | 8 (13.1%) | 53 (86.9%) |
| High School Diploma | 43 (53.1%) | 38 (46.9%) |
| College or Associate's Degree | 21 (100.0%) | 0 (0.0%) |
| Bachelor's Degree | 3 (100.0%) | 0 (0.0%) |
| Graduate Degree | 7 (100.0%) | 0 (0.0%) |
| Total | 82 (47.4%) | 91 (52.6%) |
Employment Characteristics in Dent County
Employment by Class of Employer in Dent County
Among the 5,917 employed individuals in Dent County, private company employees (3,589 | 60.7%), local government employees (695 | 11.7%), and not-for-profit organizations (480 | 8.1%) make up the most common classes of employment.
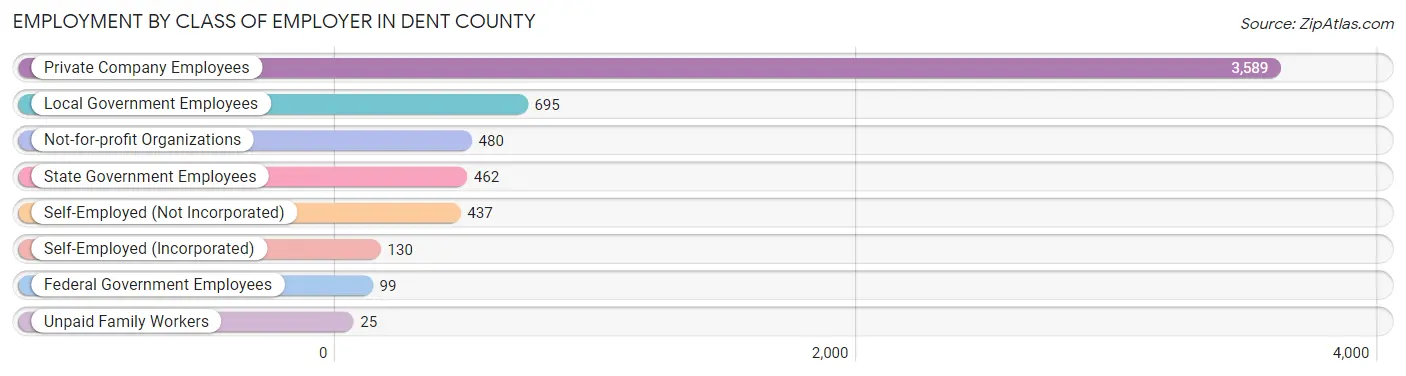
| Employer Class | # Employees | % Employees |
| Private Company Employees | 3,589 | 60.7% |
| Self-Employed (Incorporated) | 130 | 2.2% |
| Self-Employed (Not Incorporated) | 437 | 7.4% |
| Not-for-profit Organizations | 480 | 8.1% |
| Local Government Employees | 695 | 11.7% |
| State Government Employees | 462 | 7.8% |
| Federal Government Employees | 99 | 1.7% |
| Unpaid Family Workers | 25 | 0.4% |
| Total | 5,917 | 100.0% |
Employment Status by Age in Dent County
According to the labor force statistics for Dent County, out of the total population over 16 years of age (11,588), 55.8% or 6,466 individuals are in the labor force, with 4.8% or 310 of them unemployed. The age group with the highest labor force participation rate is 25 to 29 years, with 88.6% or 621 individuals in the labor force. Within the labor force, the 20 to 24 years age range has the highest percentage of unemployed individuals, with 17.4% or 95 of them being unemployed.
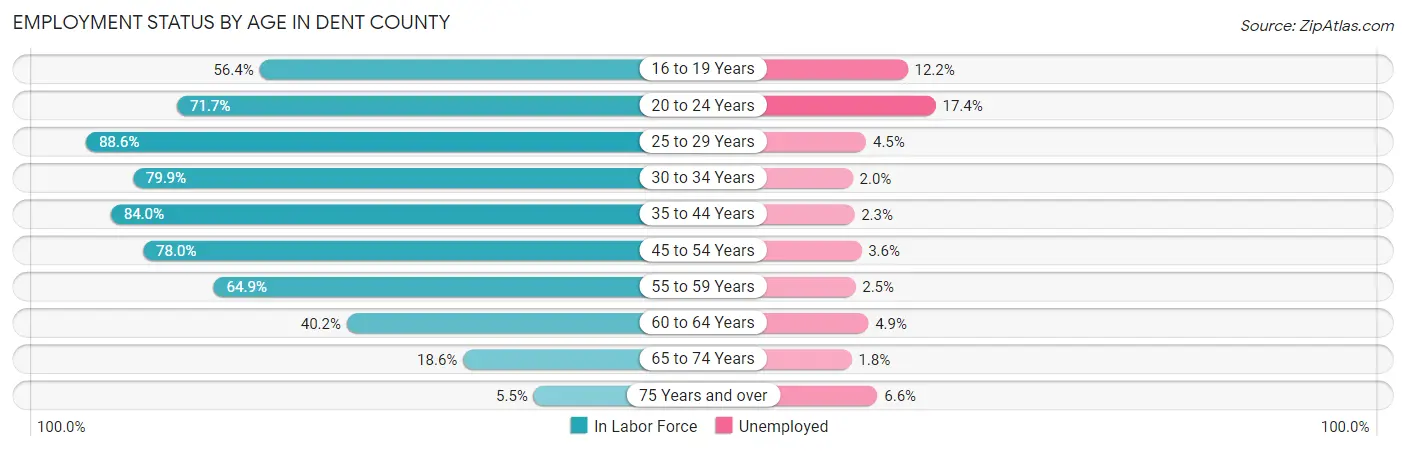
| Age Bracket | In Labor Force | Unemployed |
| 16 to 19 Years | 343 (56.4%) | 42 (12.2%) |
| 20 to 24 Years | 547 (71.7%) | 95 (17.4%) |
| 25 to 29 Years | 621 (88.6%) | 28 (4.5%) |
| 30 to 34 Years | 608 (79.9%) | 12 (2.0%) |
| 35 to 44 Years | 1,373 (84.0%) | 32 (2.3%) |
| 45 to 54 Years | 1,375 (78.0%) | 50 (3.6%) |
| 55 to 59 Years | 788 (64.9%) | 20 (2.5%) |
| 60 to 64 Years | 405 (40.2%) | 20 (4.9%) |
| 65 to 74 Years | 327 (18.6%) | 6 (1.8%) |
| 75 Years and over | 76 (5.5%) | 5 (6.6%) |
| Total | 6,466 (55.8%) | 310 (4.8%) |
Employment Status by Educational Attainment in Dent County
According to labor force statistics for Dent County, 73.0% of individuals (5,170) out of the total population between 25 and 64 years of age (7,082) are in the labor force, with 3.1% or 160 of them being unemployed. The group with the highest labor force participation rate are those with the educational attainment of bachelor's degree or higher, with 87.1% or 1,176 individuals in the labor force. Within the labor force, individuals with less than high school education have the highest percentage of unemployment, with 10.2% or 42 of them being unemployed.
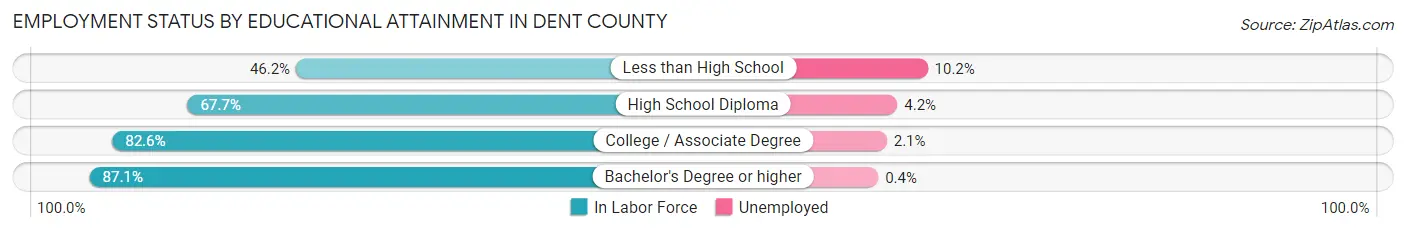
| Educational Attainment | In Labor Force | Unemployed |
| Less than High School | 412 (46.2%) | 91 (10.2%) |
| High School Diploma | 1,881 (67.7%) | 117 (4.2%) |
| College / Associate Degree | 1,703 (82.6%) | 43 (2.1%) |
| Bachelor's Degree or higher | 1,176 (87.1%) | 5 (0.4%) |
| Total | 5,170 (73.0%) | 220 (3.1%) |
Employment Occupations by Sex in Dent County
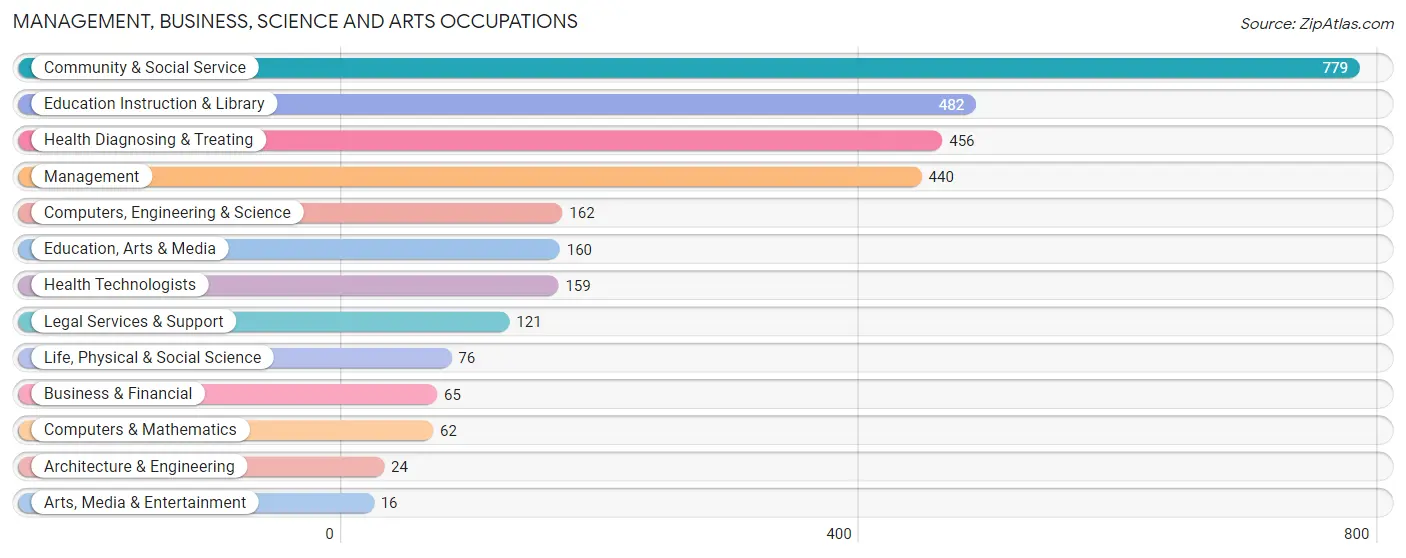
Management, Business, Science and Arts Occupations
The most common Management, Business, Science and Arts occupations in Dent County are Community & Social Service (779 | 12.7%), Education Instruction & Library (482 | 7.8%), Health Diagnosing & Treating (456 | 7.4%), Management (440 | 7.1%), and Computers, Engineering & Science (162 | 2.6%).
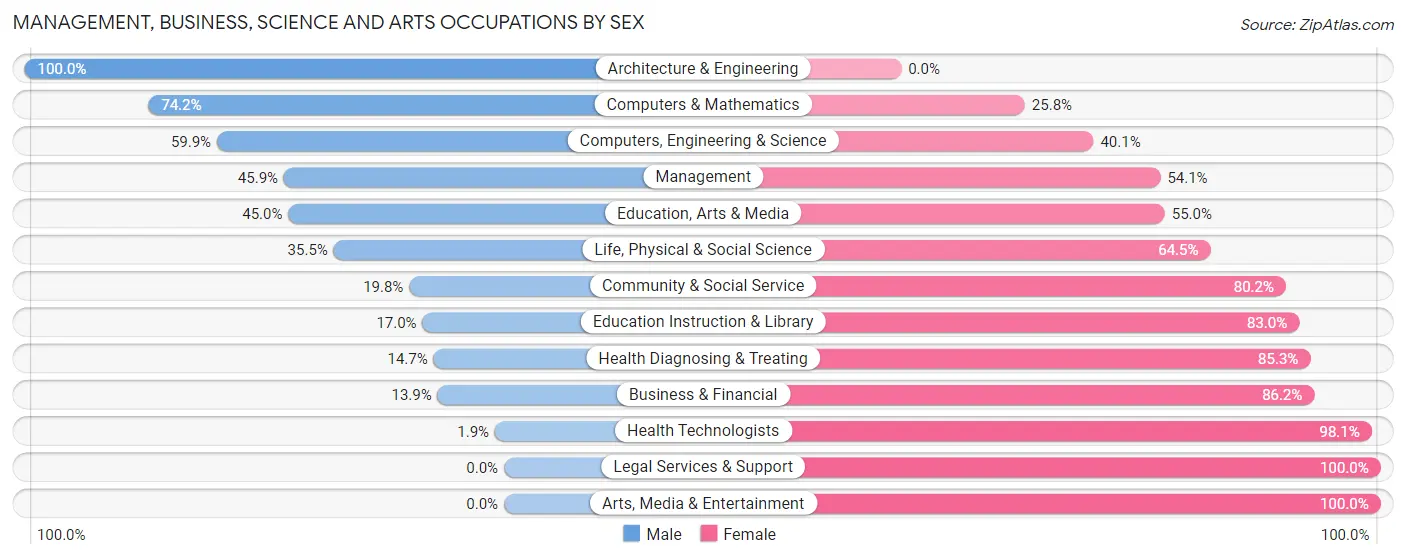
Management, Business, Science and Arts Occupations by Sex
Within the Management, Business, Science and Arts occupations in Dent County, the most male-oriented occupations are Architecture & Engineering (100.0%), Computers & Mathematics (74.2%), and Computers, Engineering & Science (59.9%), while the most female-oriented occupations are Legal Services & Support (100.0%), Arts, Media & Entertainment (100.0%), and Health Technologists (98.1%).
| Occupation | Male | Female |
| Management | 202 (45.9%) | 238 (54.1%) |
| Business & Financial | 9 (13.9%) | 56 (86.2%) |
| Computers, Engineering & Science | 97 (59.9%) | 65 (40.1%) |
| Computers & Mathematics | 46 (74.2%) | 16 (25.8%) |
| Architecture & Engineering | 24 (100.0%) | 0 (0.0%) |
| Life, Physical & Social Science | 27 (35.5%) | 49 (64.5%) |
| Community & Social Service | 154 (19.8%) | 625 (80.2%) |
| Education, Arts & Media | 72 (45.0%) | 88 (55.0%) |
| Legal Services & Support | 0 (0.0%) | 121 (100.0%) |
| Education Instruction & Library | 82 (17.0%) | 400 (83.0%) |
| Arts, Media & Entertainment | 0 (0.0%) | 16 (100.0%) |
| Health Diagnosing & Treating | 67 (14.7%) | 389 (85.3%) |
| Health Technologists | 3 (1.9%) | 156 (98.1%) |
| Total (Category) | 529 (27.8%) | 1,373 (72.2%) |
| Total (Overall) | 3,094 (50.3%) | 3,060 (49.7%) |
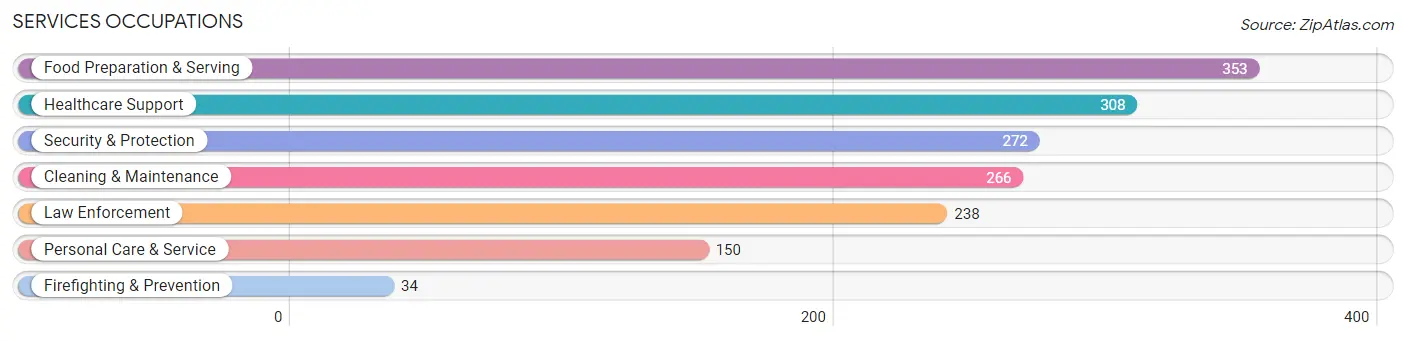
Services Occupations
The most common Services occupations in Dent County are Food Preparation & Serving (353 | 5.7%), Healthcare Support (308 | 5.0%), Security & Protection (272 | 4.4%), Cleaning & Maintenance (266 | 4.3%), and Law Enforcement (238 | 3.9%).
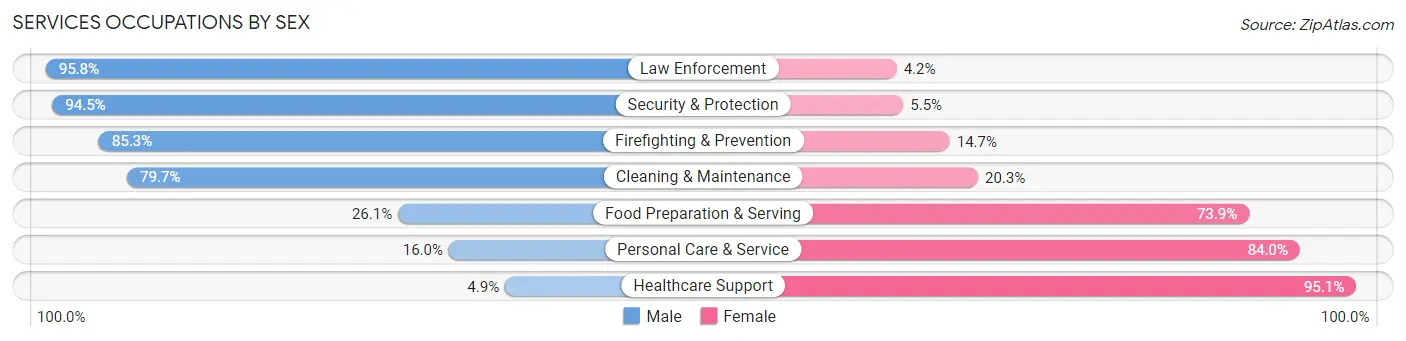
Services Occupations by Sex
Within the Services occupations in Dent County, the most male-oriented occupations are Law Enforcement (95.8%), Security & Protection (94.5%), and Firefighting & Prevention (85.3%), while the most female-oriented occupations are Healthcare Support (95.1%), Personal Care & Service (84.0%), and Food Preparation & Serving (73.9%).
| Occupation | Male | Female |
| Healthcare Support | 15 (4.9%) | 293 (95.1%) |
| Security & Protection | 257 (94.5%) | 15 (5.5%) |
| Firefighting & Prevention | 29 (85.3%) | 5 (14.7%) |
| Law Enforcement | 228 (95.8%) | 10 (4.2%) |
| Food Preparation & Serving | 92 (26.1%) | 261 (73.9%) |
| Cleaning & Maintenance | 212 (79.7%) | 54 (20.3%) |
| Personal Care & Service | 24 (16.0%) | 126 (84.0%) |
| Total (Category) | 600 (44.5%) | 749 (55.5%) |
| Total (Overall) | 3,094 (50.3%) | 3,060 (49.7%) |
Sales and Office Occupations
The most common Sales and Office occupations in Dent County are Office & Administration (709 | 11.5%), and Sales & Related (513 | 8.3%).
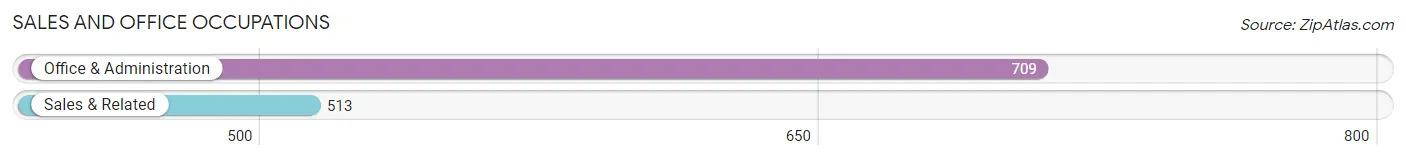
Sales and Office Occupations by Sex
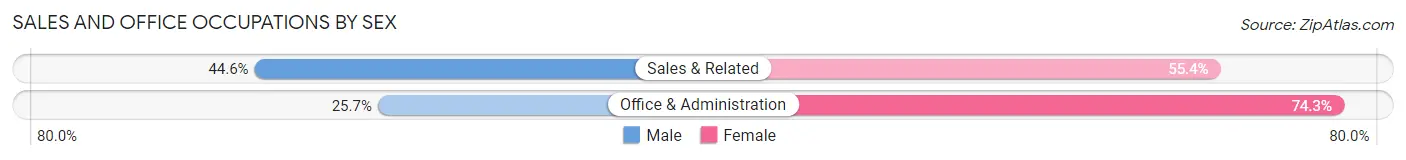
| Occupation | Male | Female |
| Sales & Related | 229 (44.6%) | 284 (55.4%) |
| Office & Administration | 182 (25.7%) | 527 (74.3%) |
| Total (Category) | 411 (33.6%) | 811 (66.4%) |
| Total (Overall) | 3,094 (50.3%) | 3,060 (49.7%) |
Natural Resources, Construction and Maintenance Occupations
The most common Natural Resources, Construction and Maintenance occupations in Dent County are Construction & Extraction (293 | 4.8%), Installation, Maintenance & Repair (128 | 2.1%), and Farming, Fishing & Forestry (38 | 0.6%).
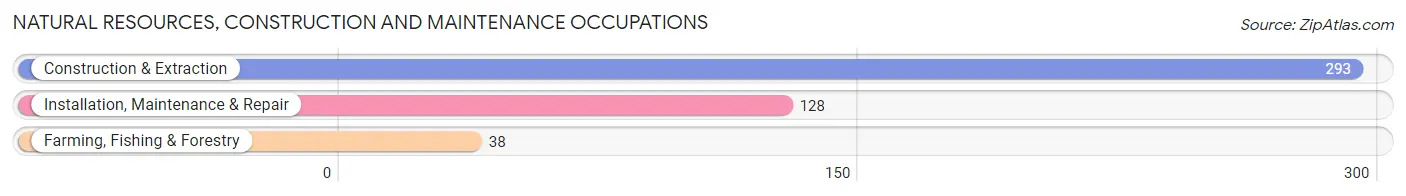
Natural Resources, Construction and Maintenance Occupations by Sex
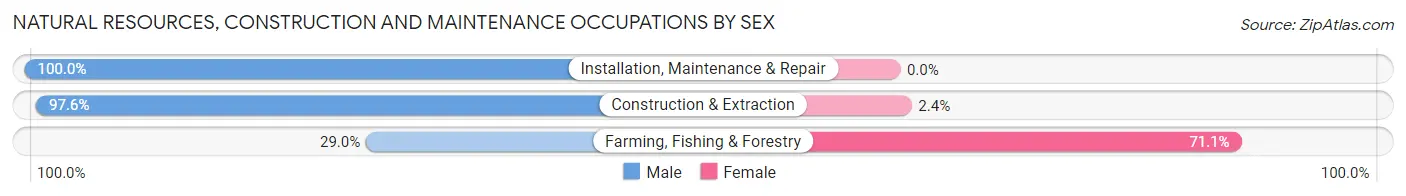
| Occupation | Male | Female |
| Farming, Fishing & Forestry | 11 (28.9%) | 27 (71.1%) |
| Construction & Extraction | 286 (97.6%) | 7 (2.4%) |
| Installation, Maintenance & Repair | 128 (100.0%) | 0 (0.0%) |
| Total (Category) | 425 (92.6%) | 34 (7.4%) |
| Total (Overall) | 3,094 (50.3%) | 3,060 (49.7%) |
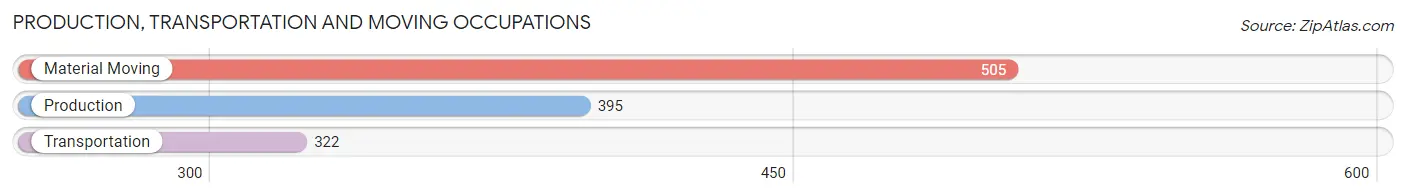
Production, Transportation and Moving Occupations
The most common Production, Transportation and Moving occupations in Dent County are Material Moving (505 | 8.2%), Production (395 | 6.4%), and Transportation (322 | 5.2%).
Production, Transportation and Moving Occupations by Sex
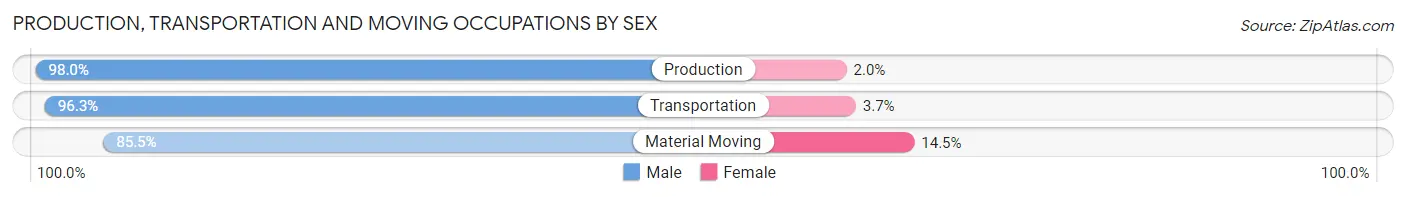
| Occupation | Male | Female |
| Production | 387 (98.0%) | 8 (2.0%) |
| Transportation | 310 (96.3%) | 12 (3.7%) |
| Material Moving | 432 (85.5%) | 73 (14.5%) |
| Total (Category) | 1,129 (92.4%) | 93 (7.6%) |
| Total (Overall) | 3,094 (50.3%) | 3,060 (49.7%) |
Employment Industries by Sex in Dent County
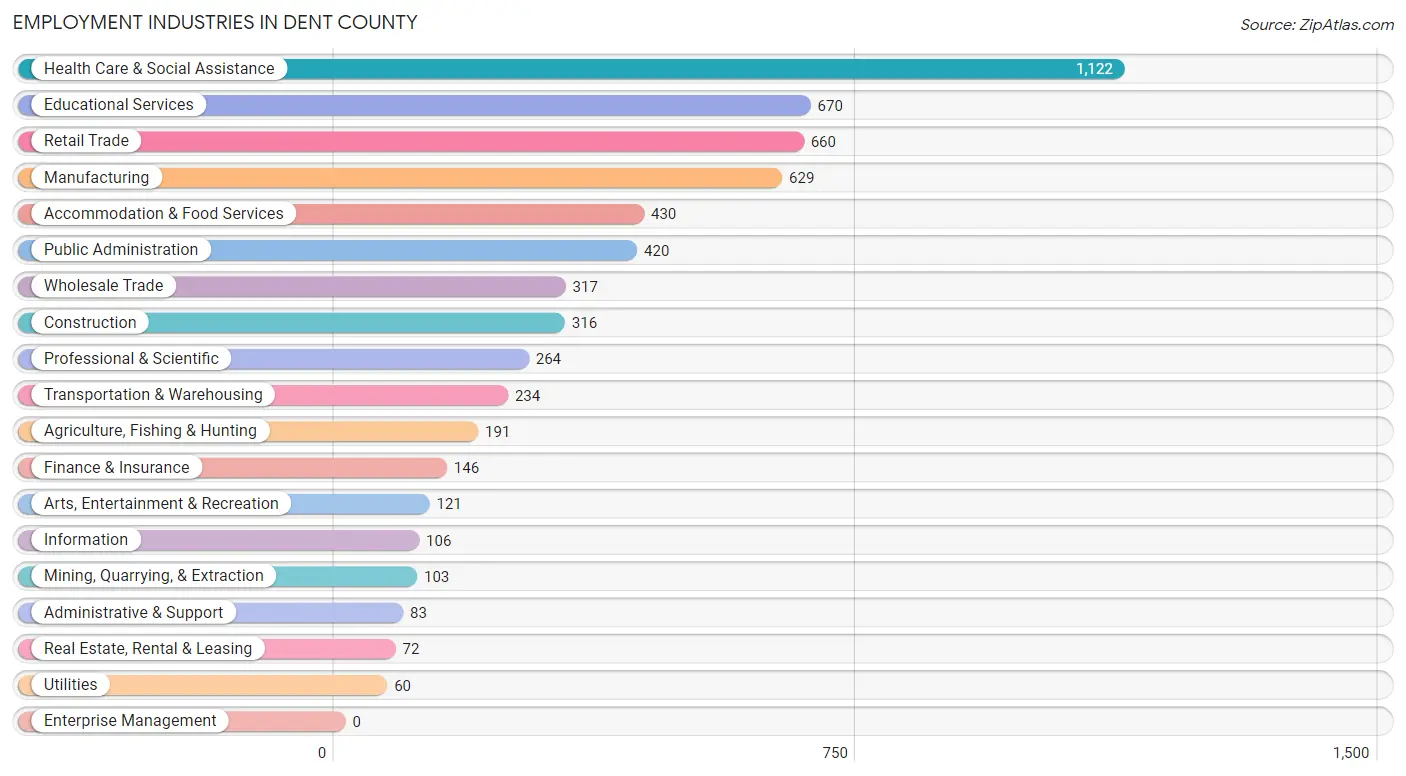
Employment Industries in Dent County
The major employment industries in Dent County include Health Care & Social Assistance (1,122 | 18.2%), Educational Services (670 | 10.9%), Retail Trade (660 | 10.7%), Manufacturing (629 | 10.2%), and Accommodation & Food Services (430 | 7.0%).
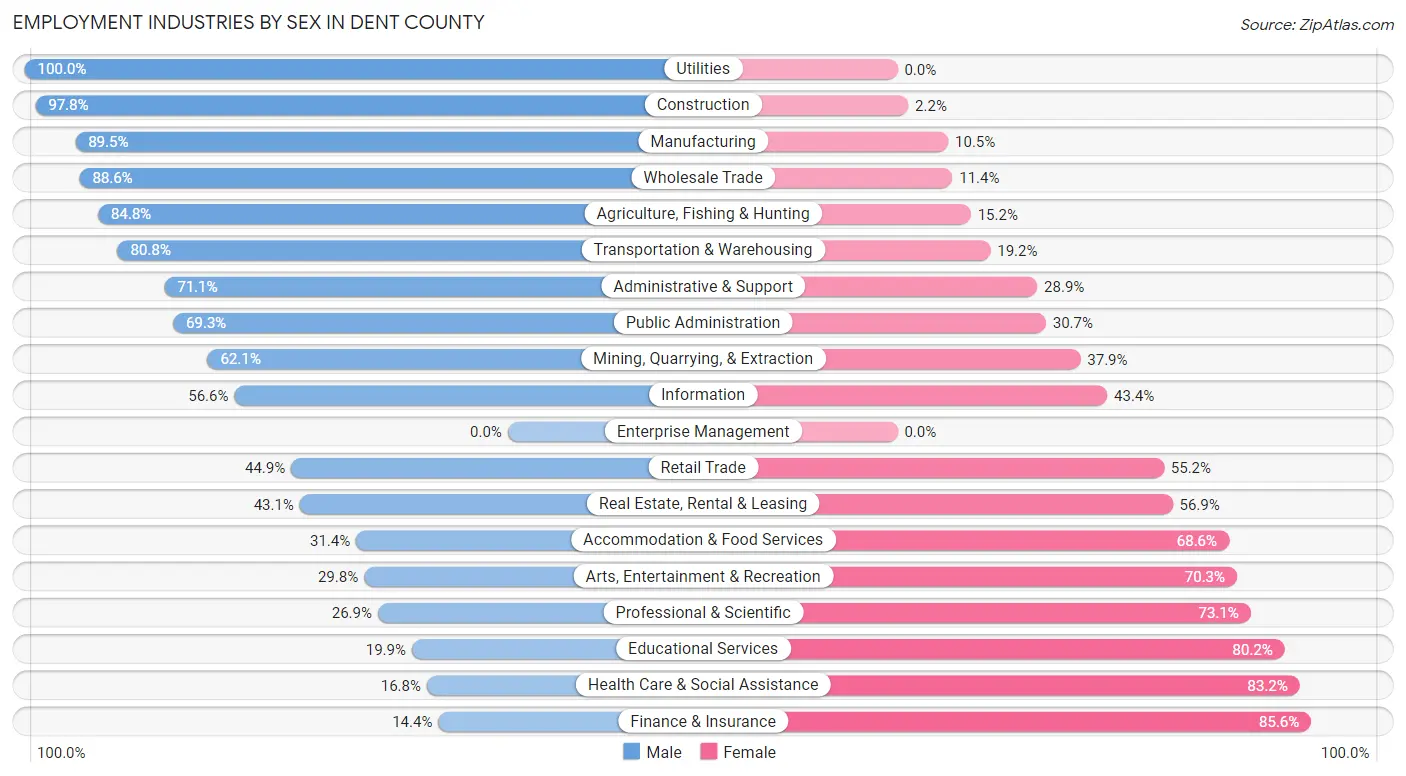
Employment Industries by Sex in Dent County
The Dent County industries that see more men than women are Utilities (100.0%), Construction (97.8%), and Manufacturing (89.5%), whereas the industries that tend to have a higher number of women are Finance & Insurance (85.6%), Health Care & Social Assistance (83.2%), and Educational Services (80.1%).
| Industry | Male | Female |
| Agriculture, Fishing & Hunting | 162 (84.8%) | 29 (15.2%) |
| Mining, Quarrying, & Extraction | 64 (62.1%) | 39 (37.9%) |
| Construction | 309 (97.8%) | 7 (2.2%) |
| Manufacturing | 563 (89.5%) | 66 (10.5%) |
| Wholesale Trade | 281 (88.6%) | 36 (11.4%) |
| Retail Trade | 296 (44.9%) | 364 (55.1%) |
| Transportation & Warehousing | 189 (80.8%) | 45 (19.2%) |
| Utilities | 60 (100.0%) | 0 (0.0%) |
| Information | 60 (56.6%) | 46 (43.4%) |
| Finance & Insurance | 21 (14.4%) | 125 (85.6%) |
| Real Estate, Rental & Leasing | 31 (43.1%) | 41 (56.9%) |
| Professional & Scientific | 71 (26.9%) | 193 (73.1%) |
| Enterprise Management | 0 (0.0%) | 0 (0.0%) |
| Administrative & Support | 59 (71.1%) | 24 (28.9%) |
| Educational Services | 133 (19.9%) | 537 (80.1%) |
| Health Care & Social Assistance | 188 (16.8%) | 934 (83.2%) |
| Arts, Entertainment & Recreation | 36 (29.7%) | 85 (70.3%) |
| Accommodation & Food Services | 135 (31.4%) | 295 (68.6%) |
| Public Administration | 291 (69.3%) | 129 (30.7%) |
| Total | 3,094 (50.3%) | 3,060 (49.7%) |
Education in Dent County
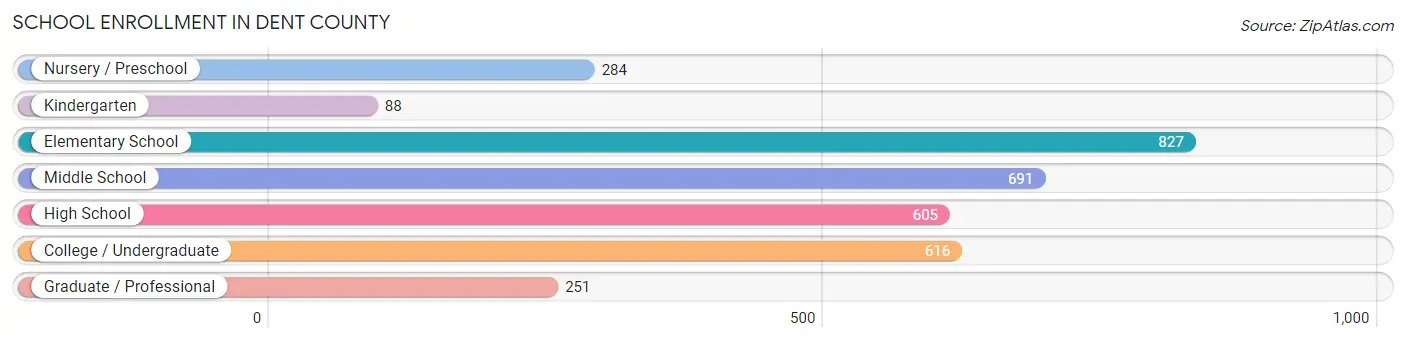
School Enrollment in Dent County
The most common levels of schooling among the 3,362 students in Dent County are elementary school (827 | 24.6%), middle school (691 | 20.5%), and college / undergraduate (616 | 18.3%).
| School Level | # Students | % Students |
| Nursery / Preschool | 284 | 8.5% |
| Kindergarten | 88 | 2.6% |
| Elementary School | 827 | 24.6% |
| Middle School | 691 | 20.5% |
| High School | 605 | 18.0% |
| College / Undergraduate | 616 | 18.3% |
| Graduate / Professional | 251 | 7.5% |
| Total | 3,362 | 100.0% |
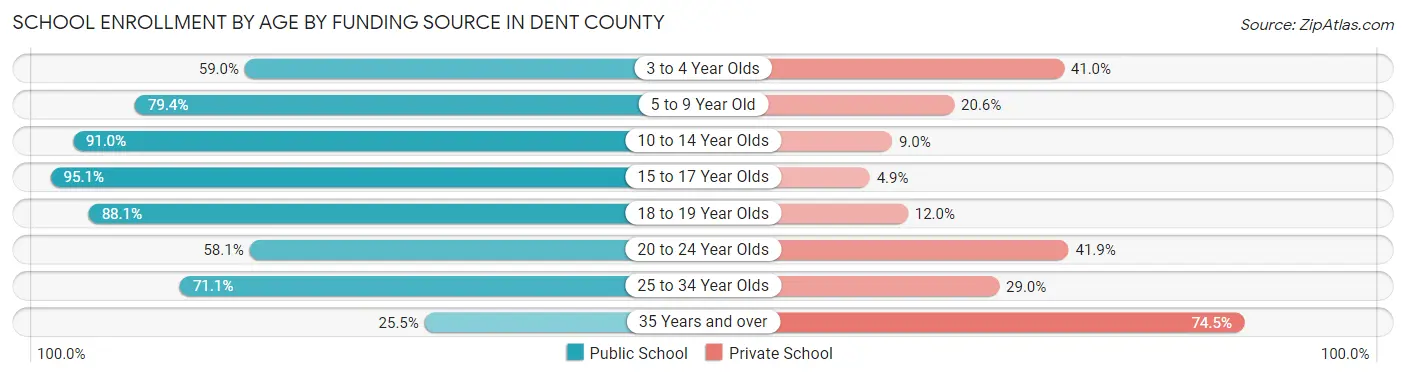
School Enrollment by Age by Funding Source in Dent County
Out of a total of 3,362 students who are enrolled in schools in Dent County, 753 (22.4%) attend a private institution, while the remaining 2,609 (77.6%) are enrolled in public schools. The age group of 35 years and over has the highest likelihood of being enrolled in private schools, with 228 (74.5% in the age bracket) enrolled. Conversely, the age group of 15 to 17 year olds has the lowest likelihood of being enrolled in a private school, with 528 (95.1% in the age bracket) attending a public institution.
| Age Bracket | Public School | Private School |
| 3 to 4 Year Olds | 128 (59.0%) | 89 (41.0%) |
| 5 to 9 Year Old | 610 (79.4%) | 158 (20.6%) |
| 10 to 14 Year Olds | 860 (91.0%) | 85 (9.0%) |
| 15 to 17 Year Olds | 528 (95.1%) | 27 (4.9%) |
| 18 to 19 Year Olds | 140 (88.0%) | 19 (11.9%) |
| 20 to 24 Year Olds | 129 (58.1%) | 93 (41.9%) |
| 25 to 34 Year Olds | 135 (71.1%) | 55 (28.9%) |
| 35 Years and over | 78 (25.5%) | 228 (74.5%) |
| Total | 2,609 (77.6%) | 753 (22.4%) |
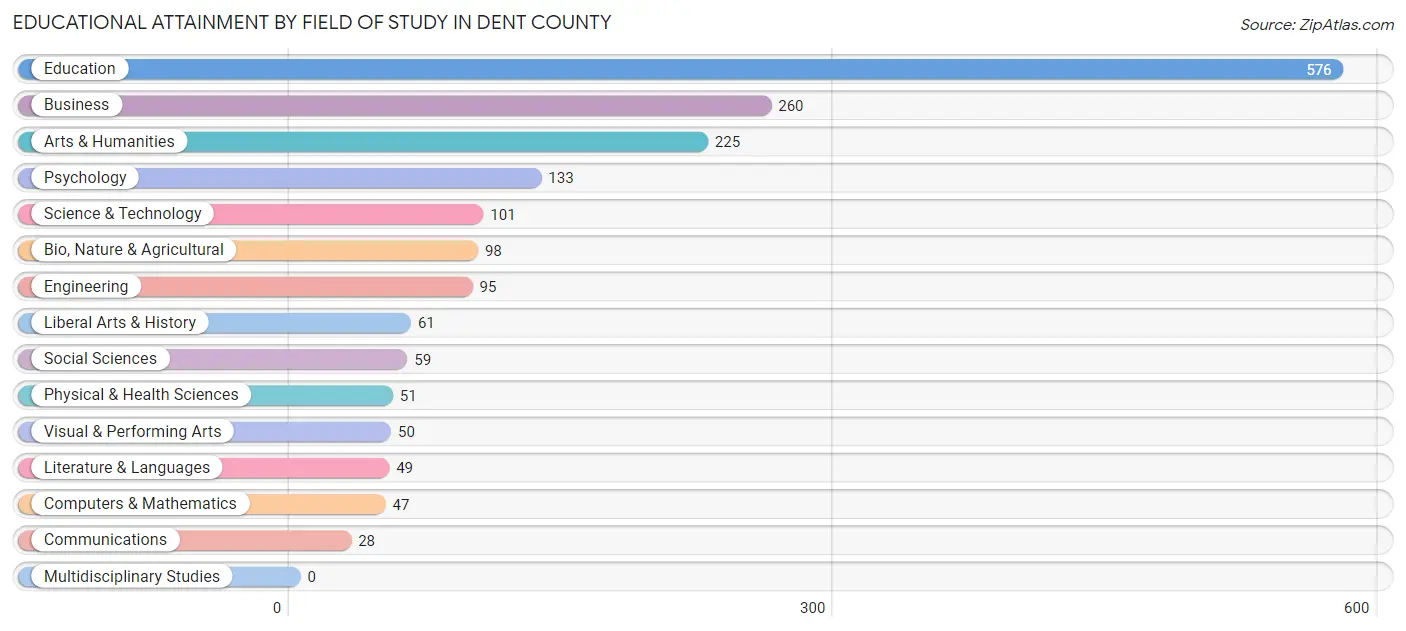
Educational Attainment by Field of Study in Dent County
Education (576 | 31.4%), business (260 | 14.2%), arts & humanities (225 | 12.3%), psychology (133 | 7.3%), and science & technology (101 | 5.5%) are the most common fields of study among 1,833 individuals in Dent County who have obtained a bachelor's degree or higher.
| Field of Study | # Graduates | % Graduates |
| Computers & Mathematics | 47 | 2.6% |
| Bio, Nature & Agricultural | 98 | 5.3% |
| Physical & Health Sciences | 51 | 2.8% |
| Psychology | 133 | 7.3% |
| Social Sciences | 59 | 3.2% |
| Engineering | 95 | 5.2% |
| Multidisciplinary Studies | 0 | 0.0% |
| Science & Technology | 101 | 5.5% |
| Business | 260 | 14.2% |
| Education | 576 | 31.4% |
| Literature & Languages | 49 | 2.7% |
| Liberal Arts & History | 61 | 3.3% |
| Visual & Performing Arts | 50 | 2.7% |
| Communications | 28 | 1.5% |
| Arts & Humanities | 225 | 12.3% |
| Total | 1,833 | 100.0% |
Transportation & Commute in Dent County
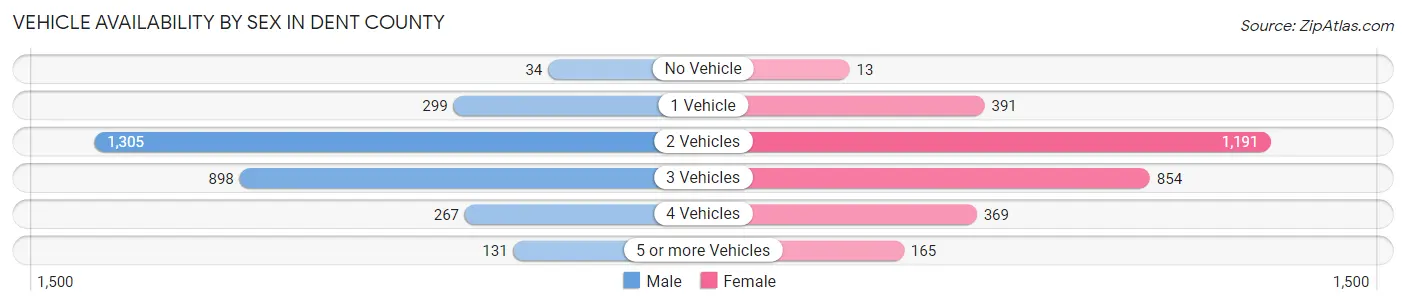
Vehicle Availability by Sex in Dent County
The most prevalent vehicle ownership categories in Dent County are males with 2 vehicles (1,305, accounting for 44.5%) and females with 2 vehicles (1,191, making up 43.8%).
| Vehicles Available | Male | Female |
| No Vehicle | 34 (1.2%) | 13 (0.4%) |
| 1 Vehicle | 299 (10.2%) | 391 (13.1%) |
| 2 Vehicles | 1,305 (44.5%) | 1,191 (39.9%) |
| 3 Vehicles | 898 (30.6%) | 854 (28.6%) |
| 4 Vehicles | 267 (9.1%) | 369 (12.4%) |
| 5 or more Vehicles | 131 (4.5%) | 165 (5.5%) |
| Total | 2,934 (100.0%) | 2,983 (100.0%) |
Commute Time in Dent County
The most frequently occuring commute durations in Dent County are 5 to 9 minutes (1,017 commuters, 18.2%), 10 to 14 minutes (936 commuters, 16.8%), and 15 to 19 minutes (680 commuters, 12.2%).
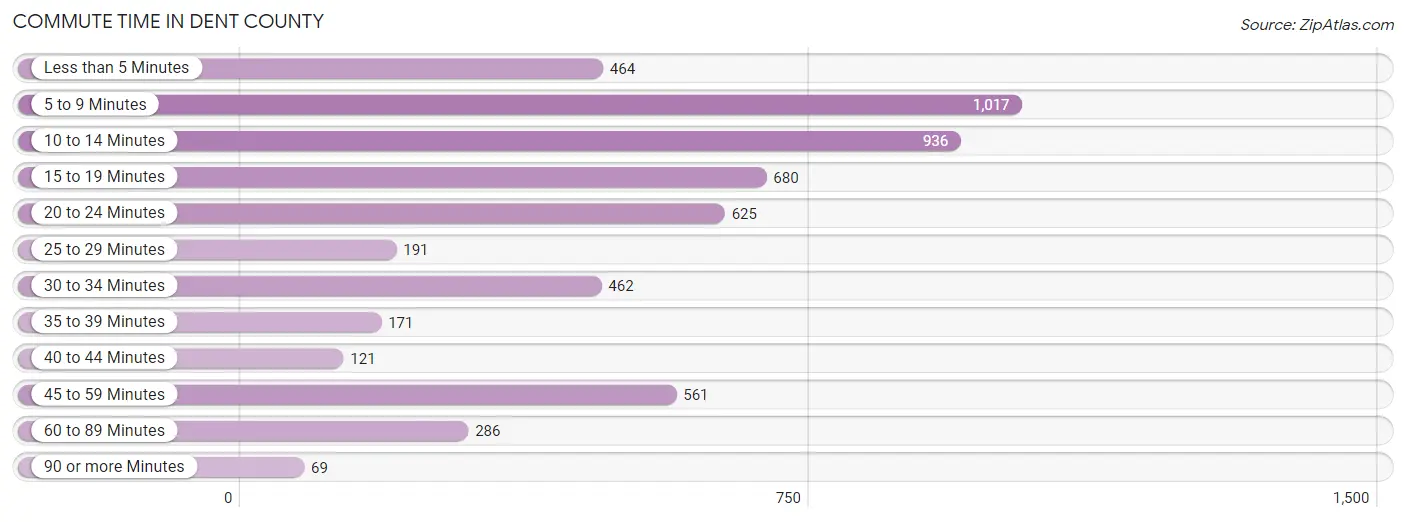
| Commute Time | # Commuters | % Commuters |
| Less than 5 Minutes | 464 | 8.3% |
| 5 to 9 Minutes | 1,017 | 18.2% |
| 10 to 14 Minutes | 936 | 16.8% |
| 15 to 19 Minutes | 680 | 12.2% |
| 20 to 24 Minutes | 625 | 11.2% |
| 25 to 29 Minutes | 191 | 3.4% |
| 30 to 34 Minutes | 462 | 8.3% |
| 35 to 39 Minutes | 171 | 3.1% |
| 40 to 44 Minutes | 121 | 2.2% |
| 45 to 59 Minutes | 561 | 10.1% |
| 60 to 89 Minutes | 286 | 5.1% |
| 90 or more Minutes | 69 | 1.2% |
Commute Time by Sex in Dent County
The most common commute times in Dent County are 10 to 14 minutes (419 commuters, 15.3%) for males and 5 to 9 minutes (648 commuters, 22.8%) for females.
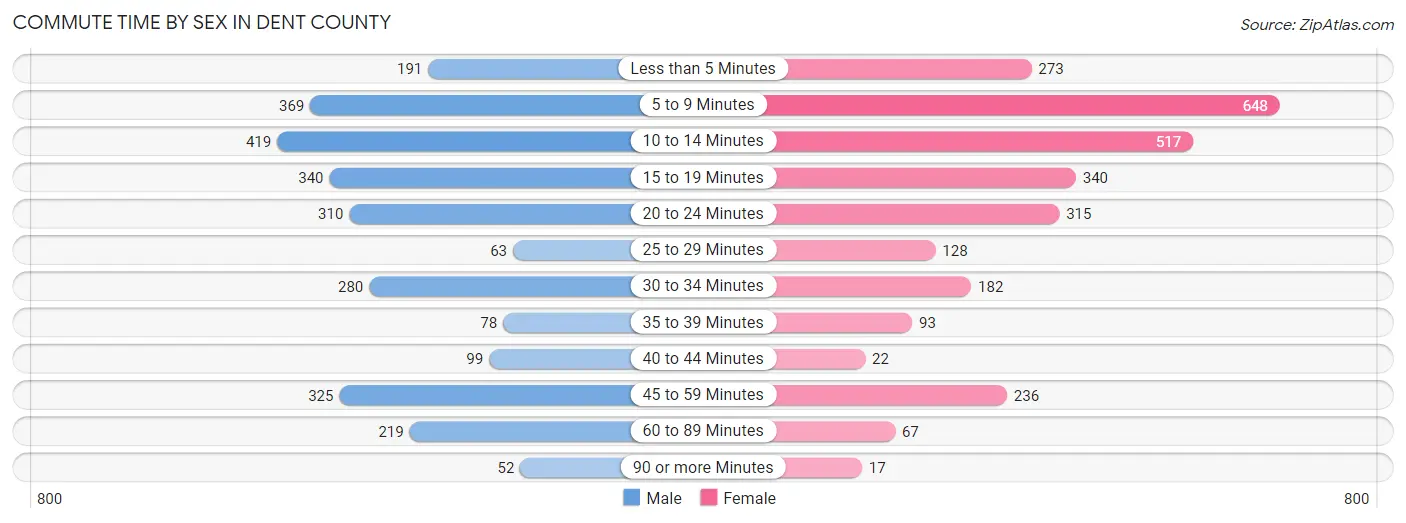
| Commute Time | Male | Female |
| Less than 5 Minutes | 191 (7.0%) | 273 (9.6%) |
| 5 to 9 Minutes | 369 (13.4%) | 648 (22.8%) |
| 10 to 14 Minutes | 419 (15.3%) | 517 (18.2%) |
| 15 to 19 Minutes | 340 (12.4%) | 340 (12.0%) |
| 20 to 24 Minutes | 310 (11.3%) | 315 (11.1%) |
| 25 to 29 Minutes | 63 (2.3%) | 128 (4.5%) |
| 30 to 34 Minutes | 280 (10.2%) | 182 (6.4%) |
| 35 to 39 Minutes | 78 (2.8%) | 93 (3.3%) |
| 40 to 44 Minutes | 99 (3.6%) | 22 (0.8%) |
| 45 to 59 Minutes | 325 (11.8%) | 236 (8.3%) |
| 60 to 89 Minutes | 219 (8.0%) | 67 (2.4%) |
| 90 or more Minutes | 52 (1.9%) | 17 (0.6%) |
Time of Departure to Work by Sex in Dent County
The most frequent times of departure to work in Dent County are 7:30 AM to 7:59 AM (478, 17.4%) for males and 7:30 AM to 7:59 AM (572, 20.2%) for females.
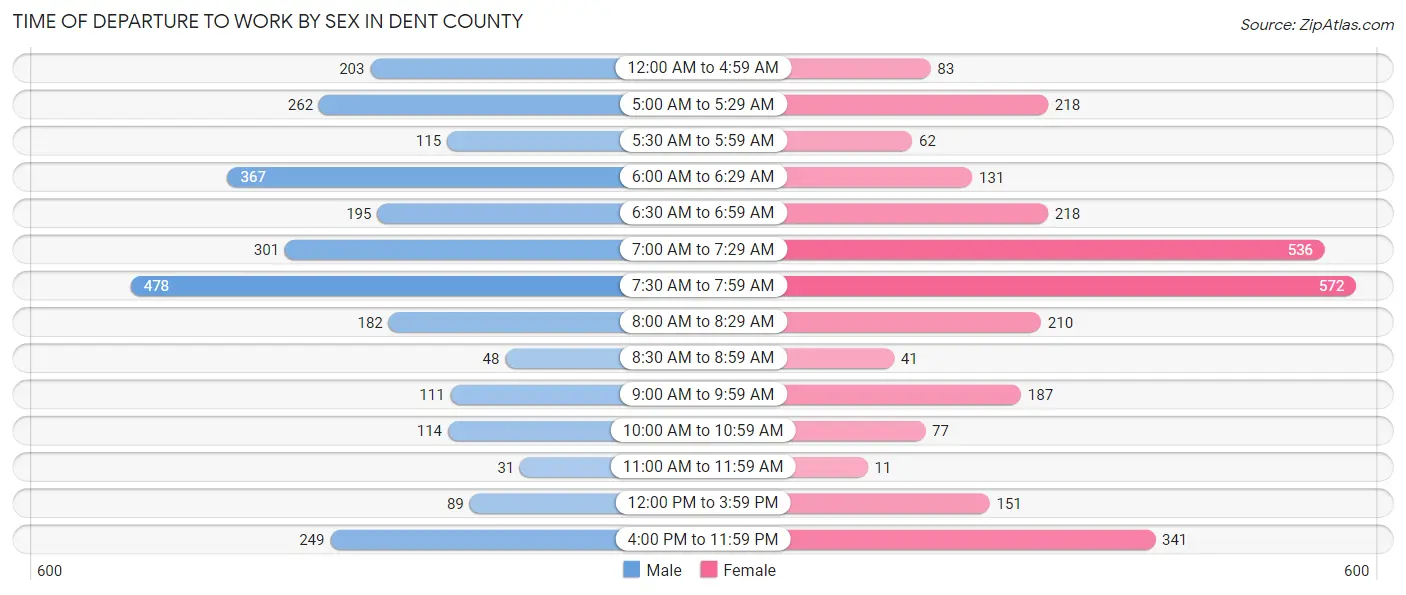
| Time of Departure | Male | Female |
| 12:00 AM to 4:59 AM | 203 (7.4%) | 83 (2.9%) |
| 5:00 AM to 5:29 AM | 262 (9.5%) | 218 (7.7%) |
| 5:30 AM to 5:59 AM | 115 (4.2%) | 62 (2.2%) |
| 6:00 AM to 6:29 AM | 367 (13.4%) | 131 (4.6%) |
| 6:30 AM to 6:59 AM | 195 (7.1%) | 218 (7.7%) |
| 7:00 AM to 7:29 AM | 301 (11.0%) | 536 (18.9%) |
| 7:30 AM to 7:59 AM | 478 (17.4%) | 572 (20.2%) |
| 8:00 AM to 8:29 AM | 182 (6.6%) | 210 (7.4%) |
| 8:30 AM to 8:59 AM | 48 (1.8%) | 41 (1.4%) |
| 9:00 AM to 9:59 AM | 111 (4.0%) | 187 (6.6%) |
| 10:00 AM to 10:59 AM | 114 (4.2%) | 77 (2.7%) |
| 11:00 AM to 11:59 AM | 31 (1.1%) | 11 (0.4%) |
| 12:00 PM to 3:59 PM | 89 (3.2%) | 151 (5.3%) |
| 4:00 PM to 11:59 PM | 249 (9.1%) | 341 (12.0%) |
| Total | 2,745 (100.0%) | 2,838 (100.0%) |
Housing Occupancy in Dent County
Occupancy by Ownership in Dent County
Of the total 5,825 dwellings in Dent County, owner-occupied units account for 4,360 (74.9%), while renter-occupied units make up 1,465 (25.2%).
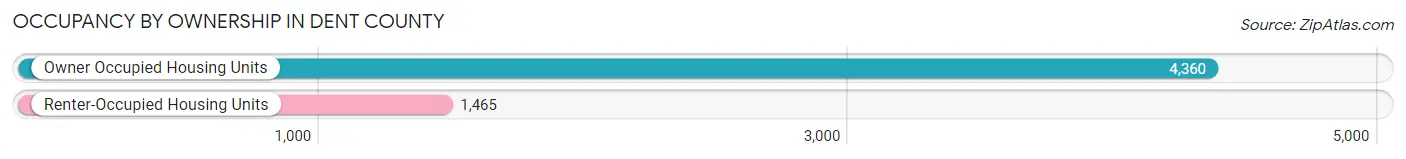
| Occupancy | # Housing Units | % Housing Units |
| Owner Occupied Housing Units | 4,360 | 74.9% |
| Renter-Occupied Housing Units | 1,465 | 25.2% |
| Total Occupied Housing Units | 5,825 | 100.0% |
Occupancy by Household Size in Dent County
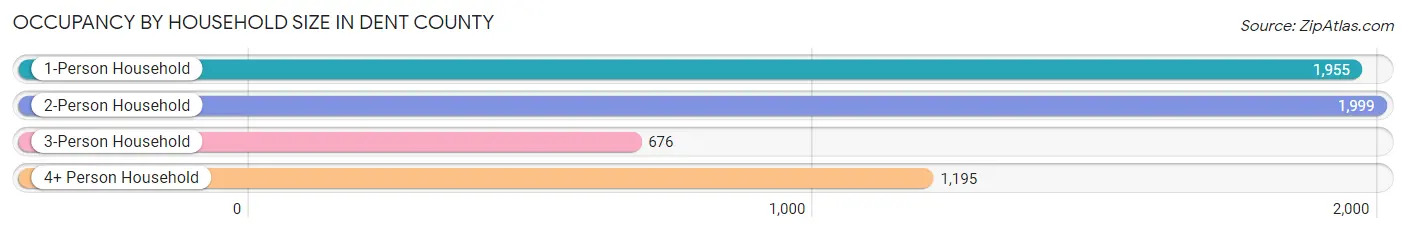
| Household Size | # Housing Units | % Housing Units |
| 1-Person Household | 1,955 | 33.6% |
| 2-Person Household | 1,999 | 34.3% |
| 3-Person Household | 676 | 11.6% |
| 4+ Person Household | 1,195 | 20.5% |
| Total Housing Units | 5,825 | 100.0% |
Occupancy by Ownership by Household Size in Dent County
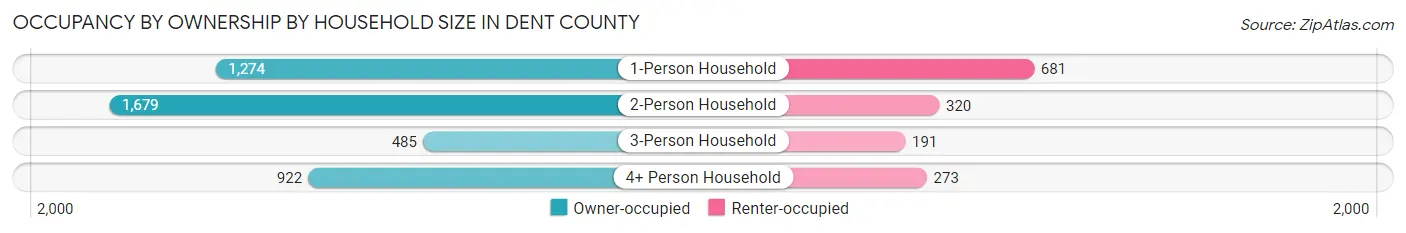
| Household Size | Owner-occupied | Renter-occupied |
| 1-Person Household | 1,274 (65.2%) | 681 (34.8%) |
| 2-Person Household | 1,679 (84.0%) | 320 (16.0%) |
| 3-Person Household | 485 (71.8%) | 191 (28.2%) |
| 4+ Person Household | 922 (77.1%) | 273 (22.9%) |
| Total Housing Units | 4,360 (74.9%) | 1,465 (25.2%) |
Occupancy by Educational Attainment in Dent County
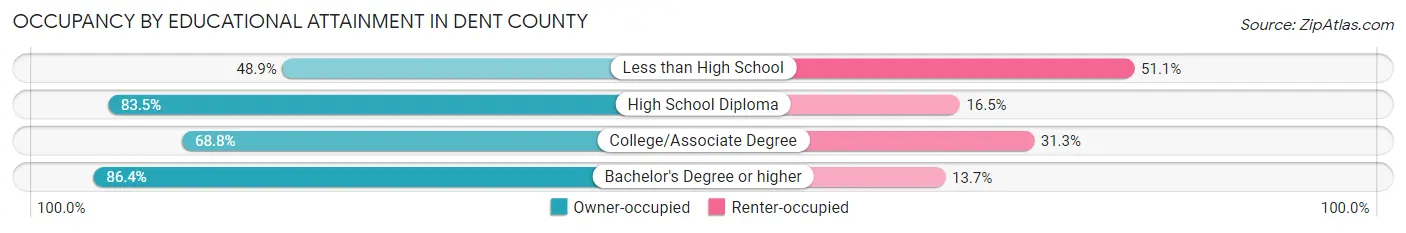
| Household Size | Owner-occupied | Renter-occupied |
| Less than High School | 427 (48.9%) | 447 (51.1%) |
| High School Diploma | 1,917 (83.5%) | 379 (16.5%) |
| College/Associate Degree | 1,080 (68.8%) | 491 (31.2%) |
| Bachelor's Degree or higher | 936 (86.4%) | 148 (13.7%) |
Occupancy by Age of Householder in Dent County
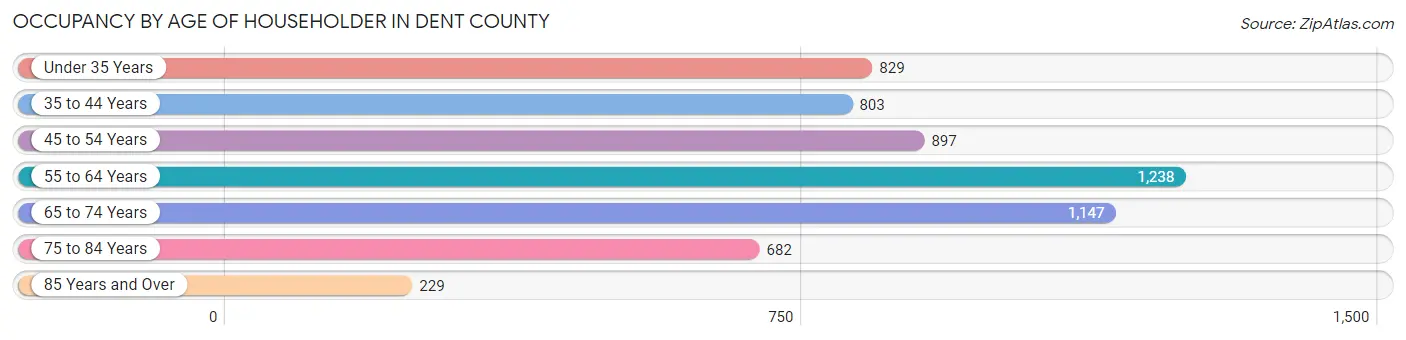
| Age Bracket | # Households | % Households |
| Under 35 Years | 829 | 14.2% |
| 35 to 44 Years | 803 | 13.8% |
| 45 to 54 Years | 897 | 15.4% |
| 55 to 64 Years | 1,238 | 21.2% |
| 65 to 74 Years | 1,147 | 19.7% |
| 75 to 84 Years | 682 | 11.7% |
| 85 Years and Over | 229 | 3.9% |
| Total | 5,825 | 100.0% |
Housing Finances in Dent County
Median Income by Occupancy in Dent County
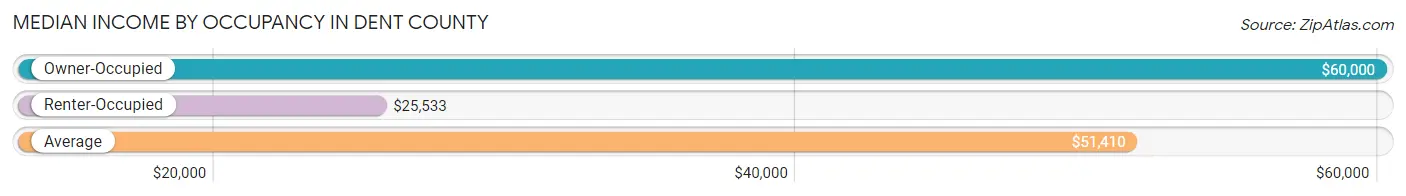
| Occupancy Type | # Households | Median Income |
| Owner-Occupied | 4,360 (74.9%) | $60,000 |
| Renter-Occupied | 1,465 (25.2%) | $25,533 |
| Average | 5,825 (100.0%) | $51,410 |
Occupancy by Householder Income Bracket in Dent County
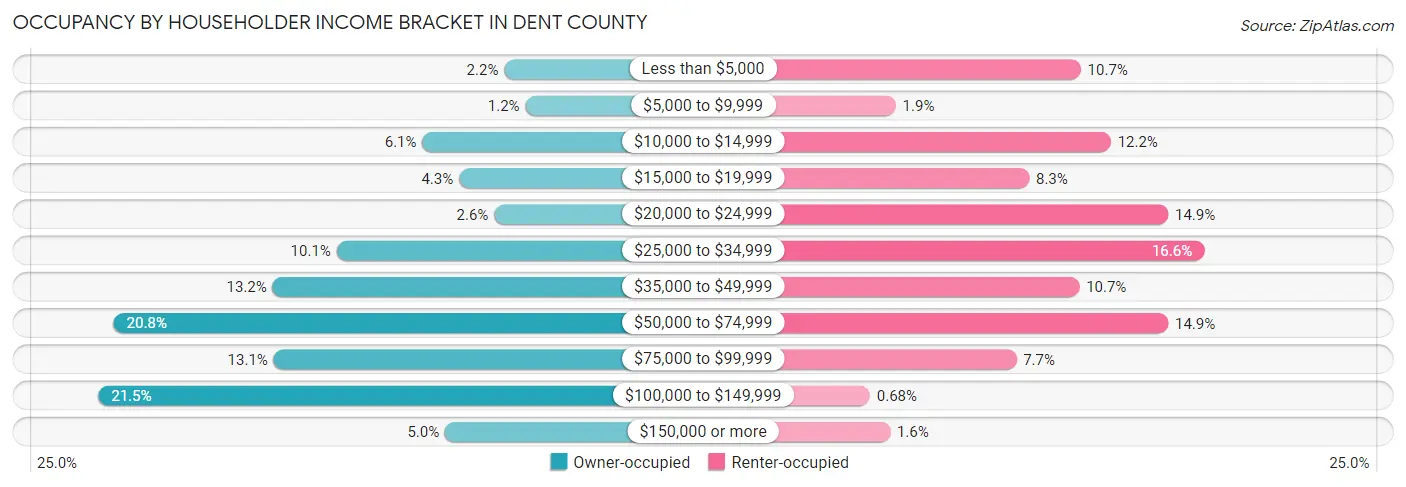
| Income Bracket | Owner-occupied | Renter-occupied |
| Less than $5,000 | 94 (2.2%) | 157 (10.7%) |
| $5,000 to $9,999 | 50 (1.1%) | 28 (1.9%) |
| $10,000 to $14,999 | 264 (6.1%) | 178 (12.1%) |
| $15,000 to $19,999 | 188 (4.3%) | 121 (8.3%) |
| $20,000 to $24,999 | 115 (2.6%) | 218 (14.9%) |
| $25,000 to $34,999 | 442 (10.1%) | 243 (16.6%) |
| $35,000 to $49,999 | 575 (13.2%) | 156 (10.6%) |
| $50,000 to $74,999 | 905 (20.8%) | 218 (14.9%) |
| $75,000 to $99,999 | 573 (13.1%) | 112 (7.6%) |
| $100,000 to $149,999 | 937 (21.5%) | 10 (0.7%) |
| $150,000 or more | 217 (5.0%) | 24 (1.6%) |
| Total | 4,360 (100.0%) | 1,465 (100.0%) |
Monthly Housing Cost Tiers in Dent County
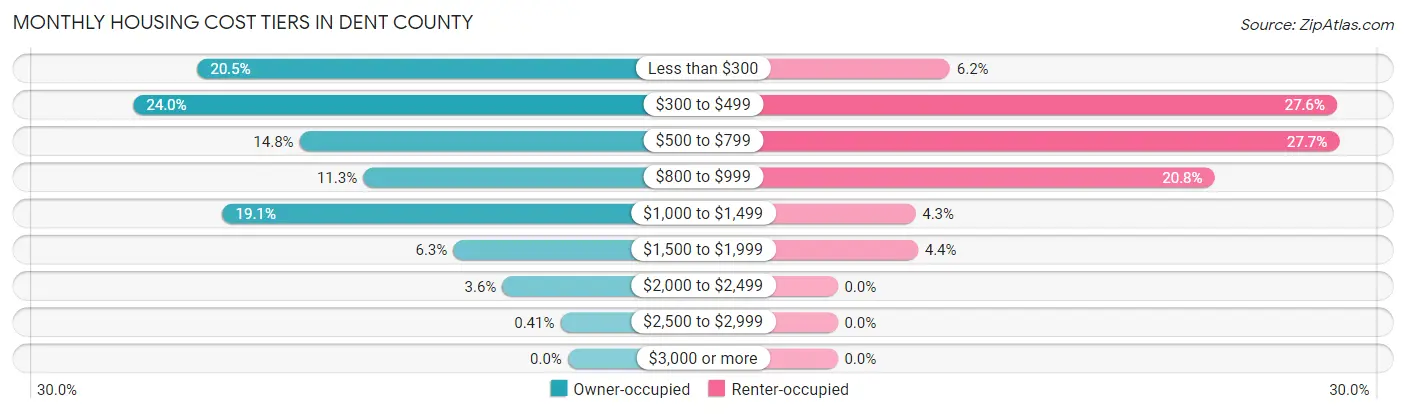
| Monthly Cost | Owner-occupied | Renter-occupied |
| Less than $300 | 892 (20.5%) | 91 (6.2%) |
| $300 to $499 | 1,046 (24.0%) | 404 (27.6%) |
| $500 to $799 | 646 (14.8%) | 406 (27.7%) |
| $800 to $999 | 493 (11.3%) | 305 (20.8%) |
| $1,000 to $1,499 | 831 (19.1%) | 63 (4.3%) |
| $1,500 to $1,999 | 276 (6.3%) | 65 (4.4%) |
| $2,000 to $2,499 | 158 (3.6%) | 0 (0.0%) |
| $2,500 to $2,999 | 18 (0.4%) | 0 (0.0%) |
| $3,000 or more | 0 (0.0%) | 0 (0.0%) |
| Total | 4,360 (100.0%) | 1,465 (100.0%) |
Physical Housing Characteristics in Dent County
Housing Structures in Dent County
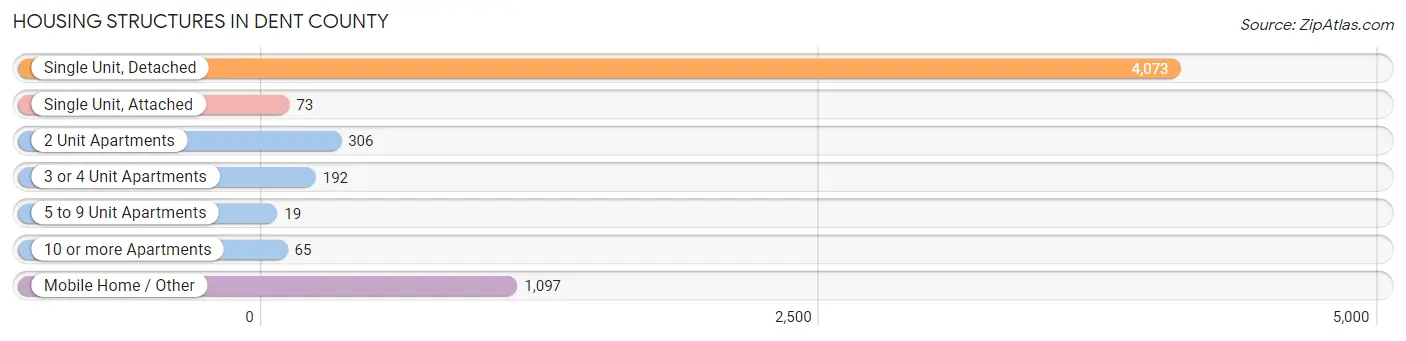
| Structure Type | # Housing Units | % Housing Units |
| Single Unit, Detached | 4,073 | 69.9% |
| Single Unit, Attached | 73 | 1.3% |
| 2 Unit Apartments | 306 | 5.2% |
| 3 or 4 Unit Apartments | 192 | 3.3% |
| 5 to 9 Unit Apartments | 19 | 0.3% |
| 10 or more Apartments | 65 | 1.1% |
| Mobile Home / Other | 1,097 | 18.8% |
| Total | 5,825 | 100.0% |
Housing Structures by Occupancy in Dent County
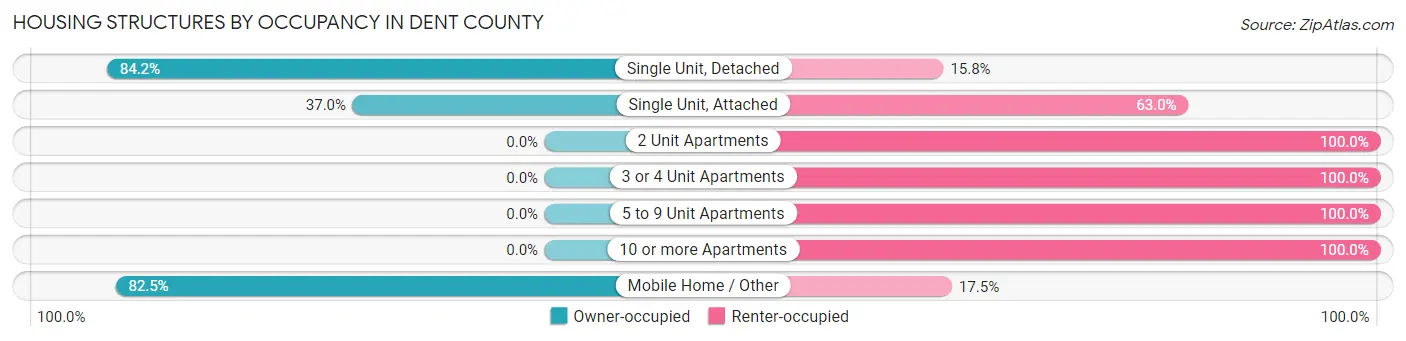
| Structure Type | Owner-occupied | Renter-occupied |
| Single Unit, Detached | 3,428 (84.2%) | 645 (15.8%) |
| Single Unit, Attached | 27 (37.0%) | 46 (63.0%) |
| 2 Unit Apartments | 0 (0.0%) | 306 (100.0%) |
| 3 or 4 Unit Apartments | 0 (0.0%) | 192 (100.0%) |
| 5 to 9 Unit Apartments | 0 (0.0%) | 19 (100.0%) |
| 10 or more Apartments | 0 (0.0%) | 65 (100.0%) |
| Mobile Home / Other | 905 (82.5%) | 192 (17.5%) |
| Total | 4,360 (74.9%) | 1,465 (25.2%) |
Housing Structures by Number of Rooms in Dent County
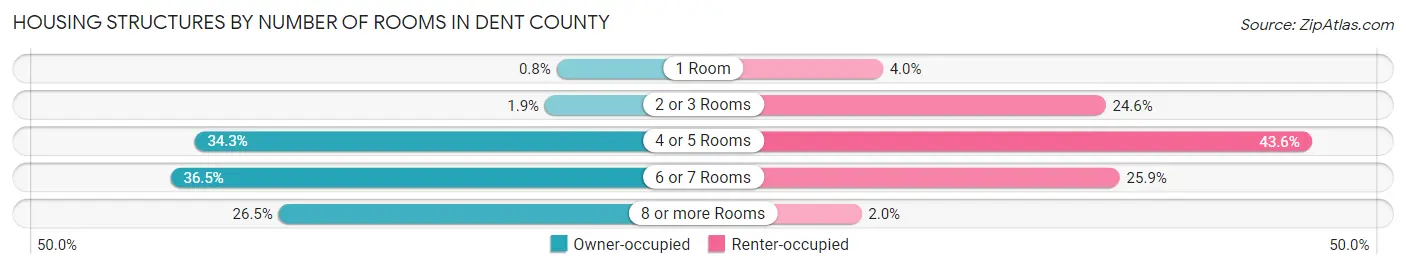
| Number of Rooms | Owner-occupied | Renter-occupied |
| 1 Room | 35 (0.8%) | 58 (4.0%) |
| 2 or 3 Rooms | 82 (1.9%) | 360 (24.6%) |
| 4 or 5 Rooms | 1,495 (34.3%) | 639 (43.6%) |
| 6 or 7 Rooms | 1,592 (36.5%) | 379 (25.9%) |
| 8 or more Rooms | 1,156 (26.5%) | 29 (2.0%) |
| Total | 4,360 (100.0%) | 1,465 (100.0%) |
Housing Structure by Heating Type in Dent County
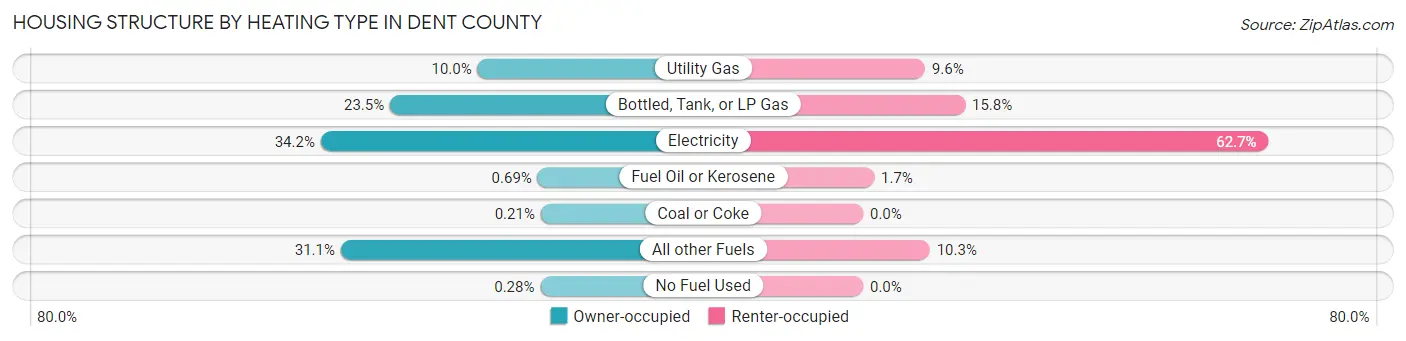
| Heating Type | Owner-occupied | Renter-occupied |
| Utility Gas | 435 (10.0%) | 140 (9.6%) |
| Bottled, Tank, or LP Gas | 1,025 (23.5%) | 231 (15.8%) |
| Electricity | 1,492 (34.2%) | 918 (62.7%) |
| Fuel Oil or Kerosene | 30 (0.7%) | 25 (1.7%) |
| Coal or Coke | 9 (0.2%) | 0 (0.0%) |
| All other Fuels | 1,357 (31.1%) | 151 (10.3%) |
| No Fuel Used | 12 (0.3%) | 0 (0.0%) |
| Total | 4,360 (100.0%) | 1,465 (100.0%) |
Household Vehicle Usage in Dent County
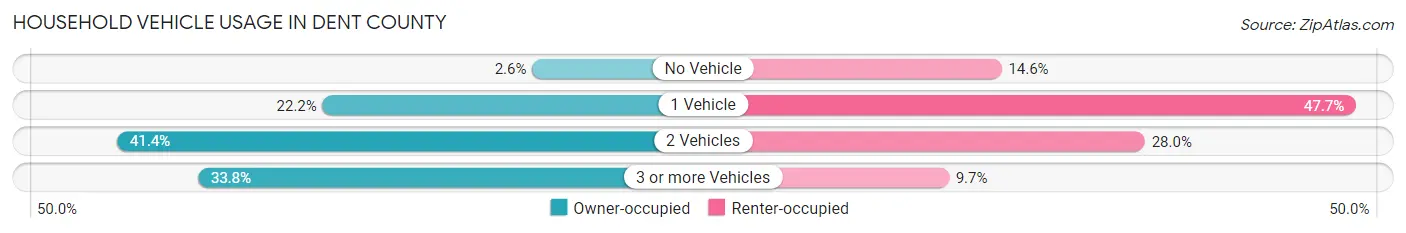
| Vehicles per Household | Owner-occupied | Renter-occupied |
| No Vehicle | 114 (2.6%) | 214 (14.6%) |
| 1 Vehicle | 967 (22.2%) | 699 (47.7%) |
| 2 Vehicles | 1,804 (41.4%) | 410 (28.0%) |
| 3 or more Vehicles | 1,475 (33.8%) | 142 (9.7%) |
| Total | 4,360 (100.0%) | 1,465 (100.0%) |
Real Estate & Mortgages in Dent County
Real Estate and Mortgage Overview in Dent County
| Characteristic | Without Mortgage | With Mortgage |
| Housing Units | 2,204 | 2,156 |
| Median Property Value | $99,600 | $146,300 |
| Median Household Income | $42,821 | $164 |
| Monthly Housing Costs | $330 | $0 |
| Real Estate Taxes | $712 | $31 |
Property Value by Mortgage Status in Dent County
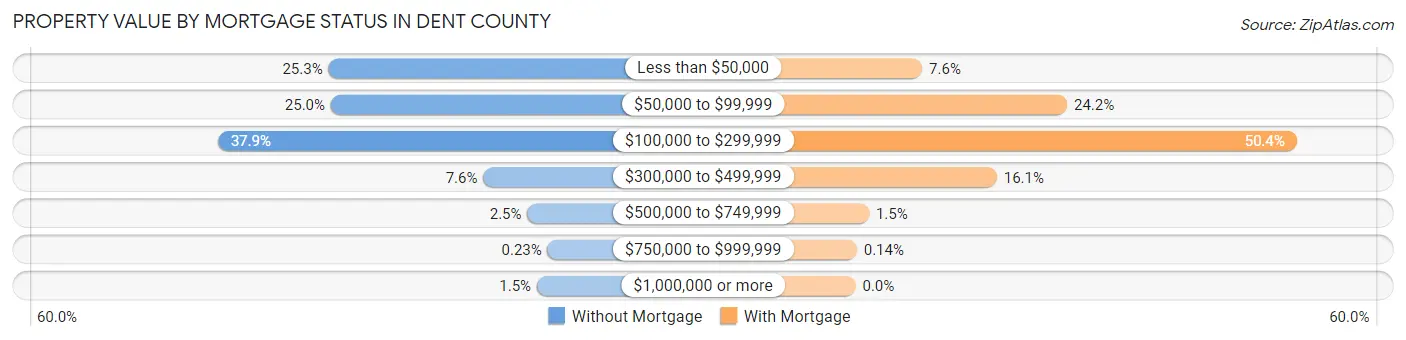
| Property Value | Without Mortgage | With Mortgage |
| Less than $50,000 | 557 (25.3%) | 164 (7.6%) |
| $50,000 to $99,999 | 551 (25.0%) | 521 (24.2%) |
| $100,000 to $299,999 | 836 (37.9%) | 1,087 (50.4%) |
| $300,000 to $499,999 | 167 (7.6%) | 348 (16.1%) |
| $500,000 to $749,999 | 56 (2.5%) | 33 (1.5%) |
| $750,000 to $999,999 | 5 (0.2%) | 3 (0.1%) |
| $1,000,000 or more | 32 (1.5%) | 0 (0.0%) |
| Total | 2,204 (100.0%) | 2,156 (100.0%) |
Household Income by Mortgage Status in Dent County
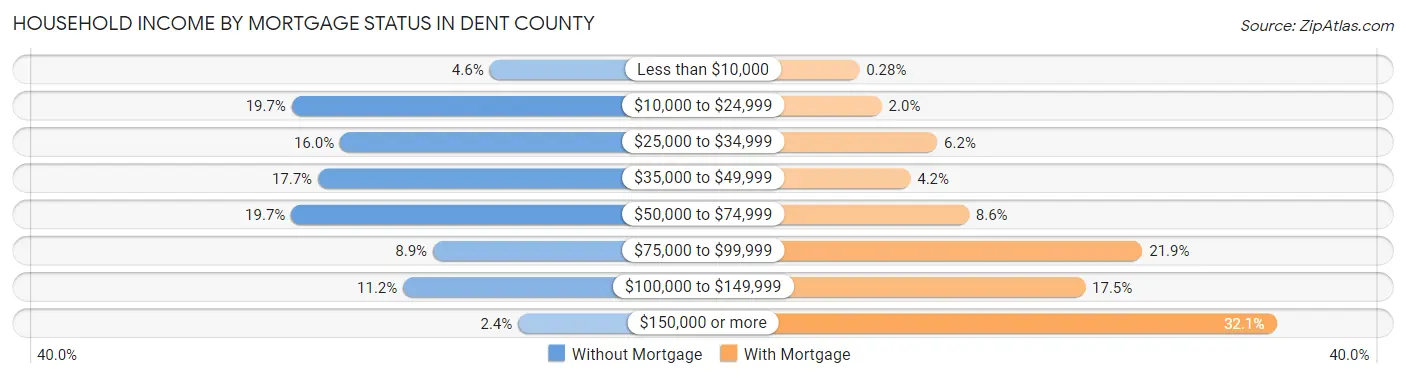
| Household Income | Without Mortgage | With Mortgage |
| Less than $10,000 | 101 (4.6%) | 6 (0.3%) |
| $10,000 to $24,999 | 433 (19.7%) | 43 (2.0%) |
| $25,000 to $34,999 | 352 (16.0%) | 134 (6.2%) |
| $35,000 to $49,999 | 389 (17.6%) | 90 (4.2%) |
| $50,000 to $74,999 | 434 (19.7%) | 186 (8.6%) |
| $75,000 to $99,999 | 196 (8.9%) | 471 (21.8%) |
| $100,000 to $149,999 | 246 (11.2%) | 377 (17.5%) |
| $150,000 or more | 53 (2.4%) | 691 (32.1%) |
| Total | 2,204 (100.0%) | 2,156 (100.0%) |
Property Value to Household Income Ratio in Dent County
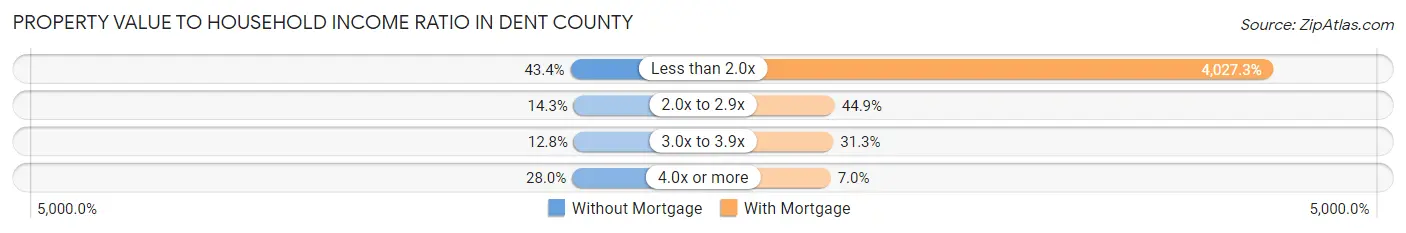
| Value-to-Income Ratio | Without Mortgage | With Mortgage |
| Less than 2.0x | 956 (43.4%) | 86,829 (4,027.3%) |
| 2.0x to 2.9x | 315 (14.3%) | 967 (44.9%) |
| 3.0x to 3.9x | 281 (12.8%) | 675 (31.3%) |
| 4.0x or more | 618 (28.0%) | 151 (7.0%) |
| Total | 2,204 (100.0%) | 2,156 (100.0%) |
Real Estate Taxes by Mortgage Status in Dent County
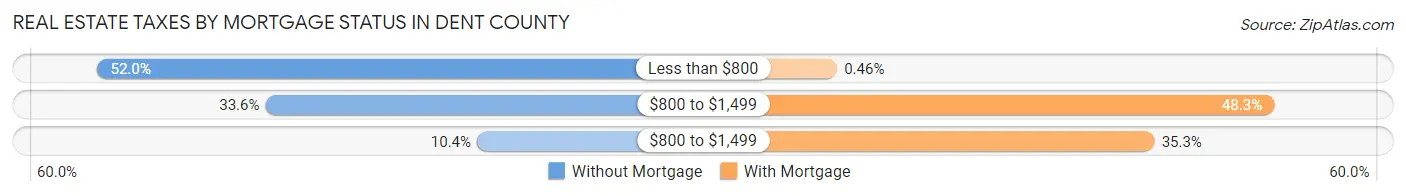
| Property Taxes | Without Mortgage | With Mortgage |
| Less than $800 | 1,146 (52.0%) | 10 (0.5%) |
| $800 to $1,499 | 741 (33.6%) | 1,042 (48.3%) |
| $800 to $1,499 | 230 (10.4%) | 760 (35.2%) |
| Total | 2,204 (100.0%) | 2,156 (100.0%) |
Health & Disability in Dent County
Health Insurance Coverage by Age in Dent County
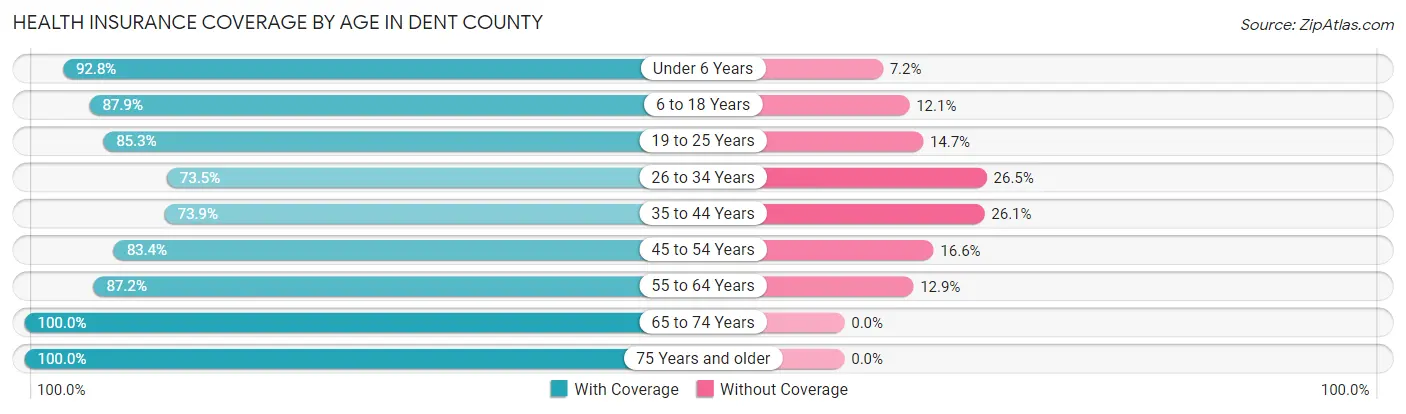
| Age Bracket | With Coverage | Without Coverage |
| Under 6 Years | 895 (92.8%) | 69 (7.2%) |
| 6 to 18 Years | 2,163 (87.9%) | 298 (12.1%) |
| 19 to 25 Years | 820 (85.3%) | 141 (14.7%) |
| 26 to 34 Years | 999 (73.5%) | 361 (26.5%) |
| 35 to 44 Years | 1,205 (73.9%) | 426 (26.1%) |
| 45 to 54 Years | 1,455 (83.4%) | 290 (16.6%) |
| 55 to 64 Years | 1,905 (87.2%) | 281 (12.9%) |
| 65 to 74 Years | 1,752 (100.0%) | 0 (0.0%) |
| 75 Years and older | 1,294 (100.0%) | 0 (0.0%) |
| Total | 12,488 (87.0%) | 1,866 (13.0%) |
Health Insurance Coverage by Citizenship Status in Dent County
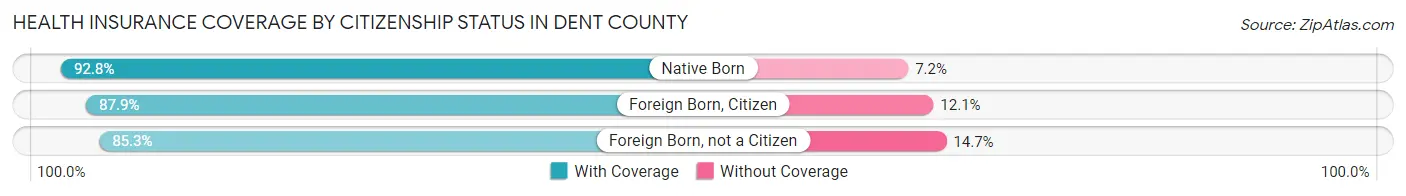
| Citizenship Status | With Coverage | Without Coverage |
| Native Born | 895 (92.8%) | 69 (7.2%) |
| Foreign Born, Citizen | 2,163 (87.9%) | 298 (12.1%) |
| Foreign Born, not a Citizen | 820 (85.3%) | 141 (14.7%) |
Health Insurance Coverage by Household Income in Dent County
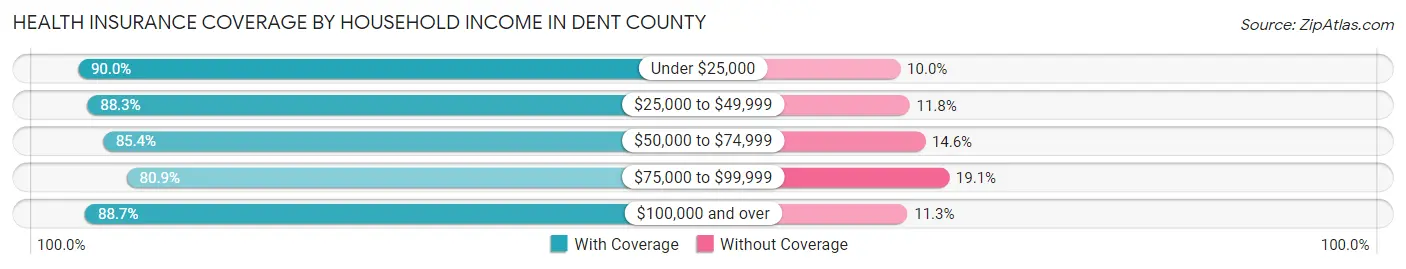
| Household Income | With Coverage | Without Coverage |
| Under $25,000 | 2,007 (90.0%) | 223 (10.0%) |
| $25,000 to $49,999 | 2,749 (88.2%) | 366 (11.7%) |
| $50,000 to $74,999 | 2,961 (85.4%) | 508 (14.6%) |
| $75,000 to $99,999 | 1,501 (80.9%) | 355 (19.1%) |
| $100,000 and over | 3,237 (88.7%) | 414 (11.3%) |
Public vs Private Health Insurance Coverage by Age in Dent County
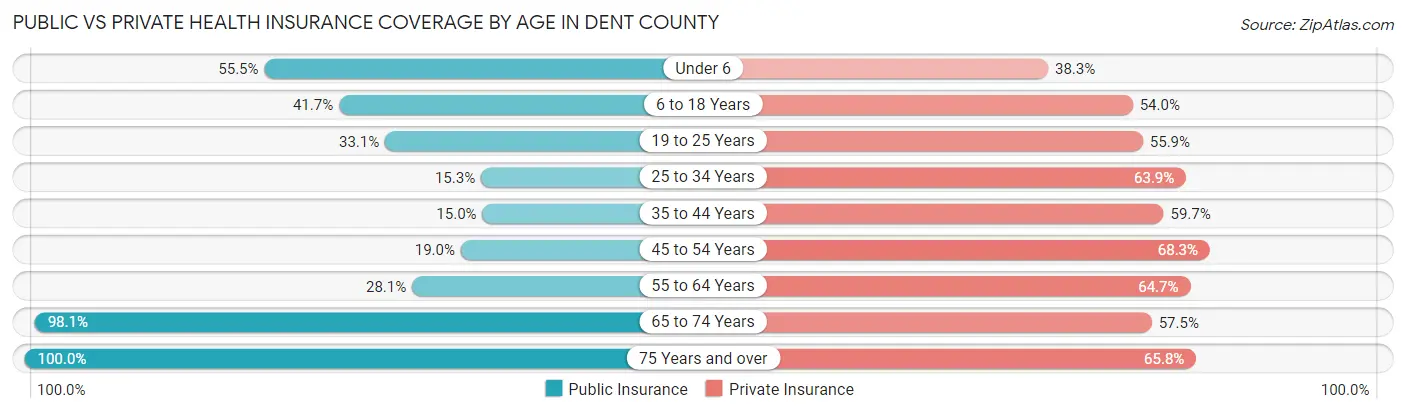
| Age Bracket | Public Insurance | Private Insurance |
| Under 6 | 535 (55.5%) | 369 (38.3%) |
| 6 to 18 Years | 1,025 (41.6%) | 1,329 (54.0%) |
| 19 to 25 Years | 318 (33.1%) | 537 (55.9%) |
| 25 to 34 Years | 208 (15.3%) | 869 (63.9%) |
| 35 to 44 Years | 245 (15.0%) | 974 (59.7%) |
| 45 to 54 Years | 332 (19.0%) | 1,192 (68.3%) |
| 55 to 64 Years | 614 (28.1%) | 1,414 (64.7%) |
| 65 to 74 Years | 1,719 (98.1%) | 1,008 (57.5%) |
| 75 Years and over | 1,294 (100.0%) | 851 (65.8%) |
| Total | 6,290 (43.8%) | 8,543 (59.5%) |
Disability Status by Sex by Age in Dent County
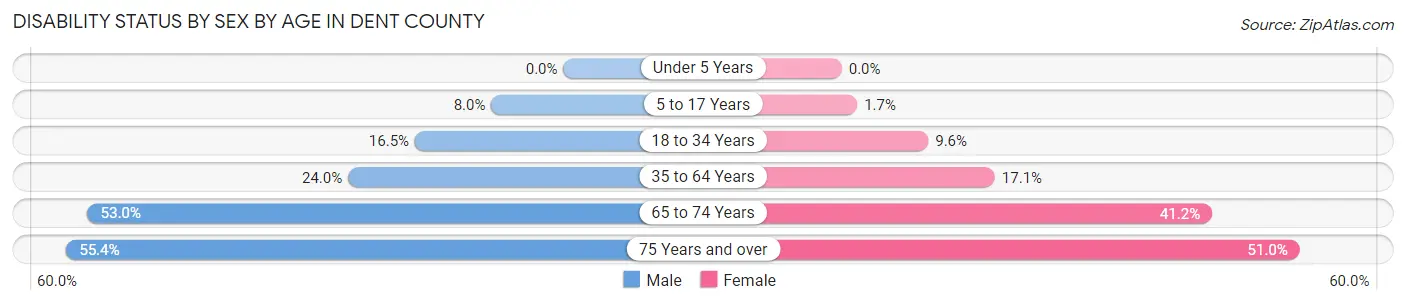
| Age Bracket | Male | Female |
| Under 5 Years | 0 (0.0%) | 0 (0.0%) |
| 5 to 17 Years | 105 (8.0%) | 20 (1.7%) |
| 18 to 34 Years | 203 (16.5%) | 119 (9.6%) |
| 35 to 64 Years | 684 (24.0%) | 462 (17.1%) |
| 65 to 74 Years | 436 (53.0%) | 383 (41.2%) |
| 75 Years and over | 295 (55.3%) | 388 (51.0%) |
Disability Class by Sex by Age in Dent County
Disability Class: Hearing Difficulty
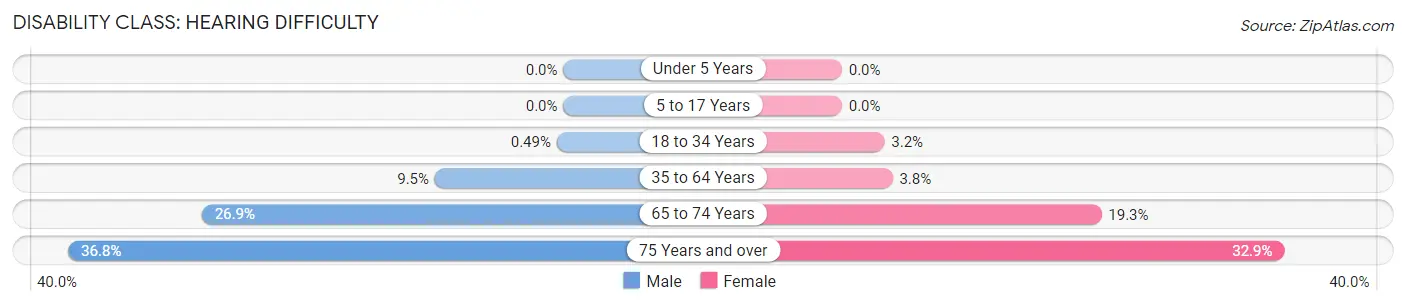
| Age Bracket | Male | Female |
| Under 5 Years | 0 (0.0%) | 0 (0.0%) |
| 5 to 17 Years | 0 (0.0%) | 0 (0.0%) |
| 18 to 34 Years | 6 (0.5%) | 39 (3.2%) |
| 35 to 64 Years | 272 (9.5%) | 102 (3.8%) |
| 65 to 74 Years | 221 (26.9%) | 179 (19.3%) |
| 75 Years and over | 196 (36.8%) | 250 (32.9%) |
Disability Class: Vision Difficulty
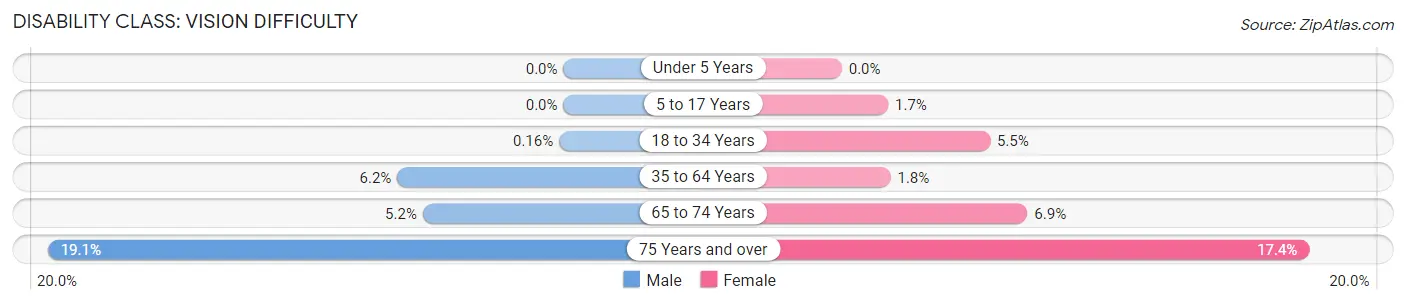
| Age Bracket | Male | Female |
| Under 5 Years | 0 (0.0%) | 0 (0.0%) |
| 5 to 17 Years | 0 (0.0%) | 20 (1.7%) |
| 18 to 34 Years | 2 (0.2%) | 68 (5.5%) |
| 35 to 64 Years | 176 (6.2%) | 49 (1.8%) |
| 65 to 74 Years | 43 (5.2%) | 64 (6.9%) |
| 75 Years and over | 102 (19.1%) | 132 (17.3%) |
Disability Class: Cognitive Difficulty
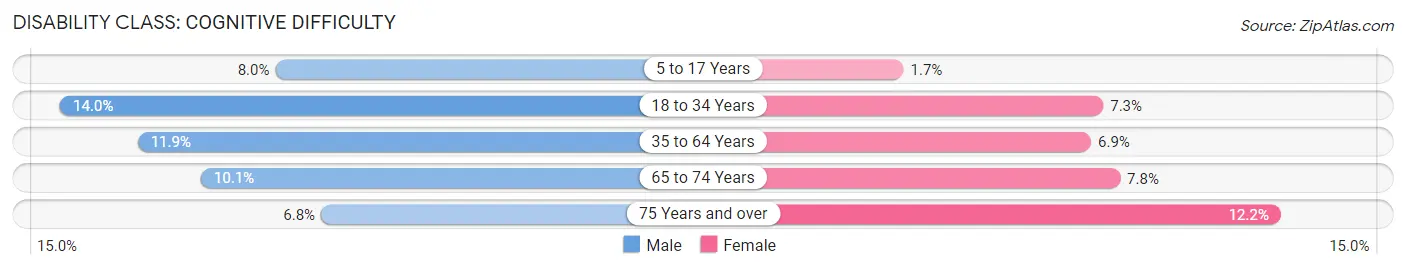
| Age Bracket | Male | Female |
| 5 to 17 Years | 105 (8.0%) | 20 (1.7%) |
| 18 to 34 Years | 172 (14.0%) | 90 (7.3%) |
| 35 to 64 Years | 338 (11.8%) | 188 (6.9%) |
| 65 to 74 Years | 83 (10.1%) | 72 (7.7%) |
| 75 Years and over | 36 (6.8%) | 93 (12.2%) |
Disability Class: Ambulatory Difficulty
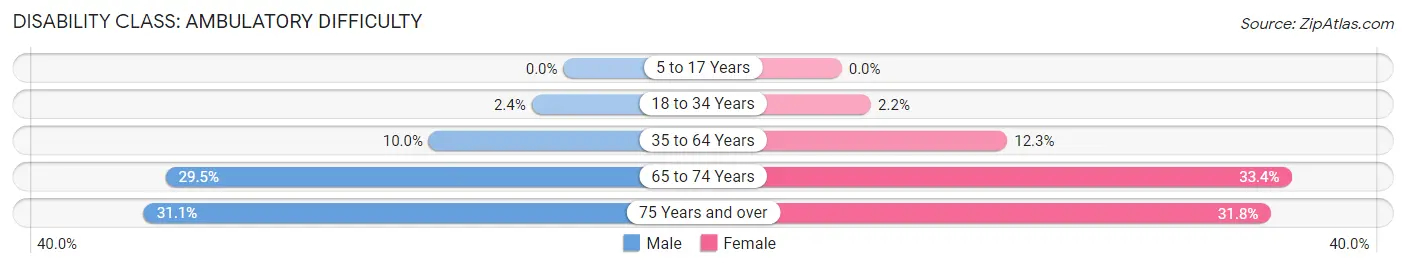
| Age Bracket | Male | Female |
| 5 to 17 Years | 0 (0.0%) | 0 (0.0%) |
| 18 to 34 Years | 29 (2.4%) | 27 (2.2%) |
| 35 to 64 Years | 285 (10.0%) | 333 (12.3%) |
| 65 to 74 Years | 243 (29.5%) | 310 (33.4%) |
| 75 Years and over | 166 (31.1%) | 242 (31.8%) |
Disability Class: Self-Care Difficulty
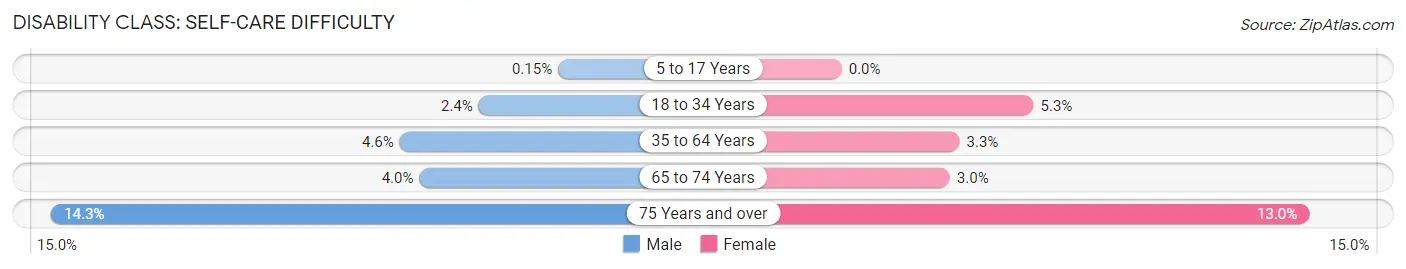
| Age Bracket | Male | Female |
| 5 to 17 Years | 2 (0.2%) | 0 (0.0%) |
| 18 to 34 Years | 29 (2.4%) | 66 (5.3%) |
| 35 to 64 Years | 130 (4.6%) | 89 (3.3%) |
| 65 to 74 Years | 33 (4.0%) | 28 (3.0%) |
| 75 Years and over | 76 (14.3%) | 99 (13.0%) |
Technology Access in Dent County
Computing Device Access in Dent County
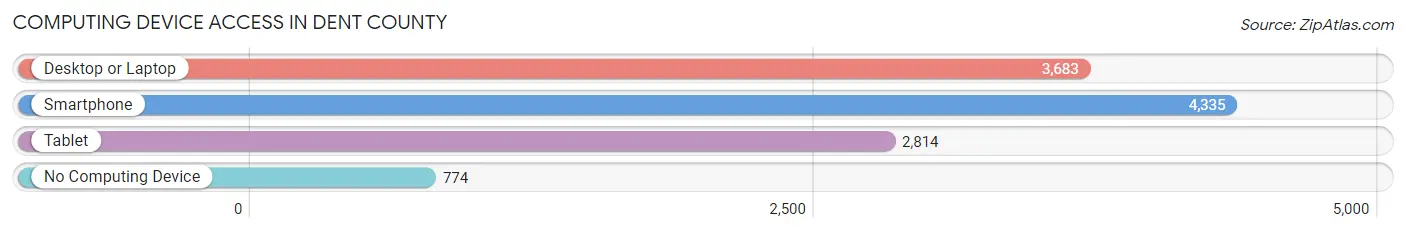
| Device Type | # Households | % Households |
| Desktop or Laptop | 3,683 | 63.2% |
| Smartphone | 4,335 | 74.4% |
| Tablet | 2,814 | 48.3% |
| No Computing Device | 774 | 13.3% |
| Total | 5,825 | 100.0% |
Internet Access in Dent County
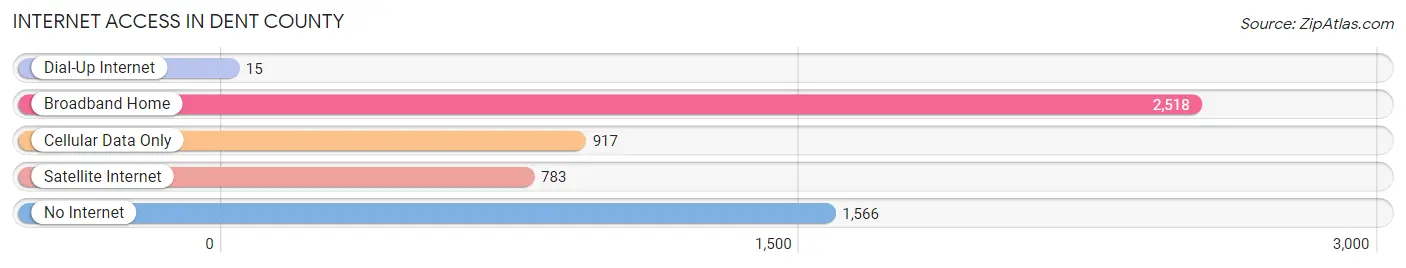
| Internet Type | # Households | % Households |
| Dial-Up Internet | 15 | 0.3% |
| Broadband Home | 2,518 | 43.2% |
| Cellular Data Only | 917 | 15.7% |
| Satellite Internet | 783 | 13.4% |
| No Internet | 1,566 | 26.9% |
| Total | 5,825 | 100.0% |
Dent County Summary
Dent County is located in the south-central region of Missouri, and is part of the Ozark Plateau. It is bordered by Phelps County to the north, Crawford County to the east, Texas County to the south, and Shannon County to the west. The county seat is Salem, and the largest city is Salem. The county was established in 1851 and named after Lewis Dent, a prominent local politician.
History
The area that is now Dent County was originally inhabited by Native American tribes, including the Osage, Shawnee, and Delaware. The first European settlers arrived in the area in the early 1800s, and the county was officially established in 1851. The county was named after Lewis Dent, a prominent local politician.
During the Civil War, Dent County was a divided county, with some residents supporting the Union and some supporting the Confederacy. The county was the site of several skirmishes between Union and Confederate forces.
In the late 1800s, the county experienced a period of economic growth, as the timber industry flourished and the railroad was built. This period of growth was followed by a period of decline in the early 1900s, as the timber industry declined and the railroad was abandoned.
In the mid-1900s, the county experienced a period of economic revival, as the tourism industry began to grow. The county is now home to several popular tourist attractions, including the Meramec Caverns, the Ozark National Scenic Riverways, and the Mark Twain National Forest.
Geography
Dent County is located in the south-central region of Missouri, and is part of the Ozark Plateau. It is bordered by Phelps County to the north, Crawford County to the east, Texas County to the south, and Shannon County to the west. The county has a total area of 576 square miles, of which 574 square miles is land and 2 square miles is water.
The county is mostly hilly and forested, with the highest point being Pilot Knob at 1,092 feet. The county is drained by the Meramec River and its tributaries.
Economy
The economy of Dent County is largely based on tourism, agriculture, and manufacturing. The county is home to several popular tourist attractions, including the Meramec Caverns, the Ozark National Scenic Riverways, and the Mark Twain National Forest.
Agriculture is also an important part of the county’s economy, with the main crops being corn, soybeans, hay, and wheat. The county is also home to several livestock farms, including cattle, hogs, and poultry.
Manufacturing is also an important part of the county’s economy, with the main industries being furniture manufacturing, metal fabrication, and food processing.
Demographics
As of the 2010 census, the population of Dent County was 15,657. The racial makeup of the county was 97.2% White, 0.7% Black or African American, 0.3% Native American, 0.2% Asian, 0.1% Pacific Islander, 0.4% from other races, and 1.1% from two or more races. Hispanic or Latino of any race were 1.3% of the population.
The median household income in the county was $37,945, and the median family income was $45,945. The per capita income was $19,945. About 13.2% of the population was below the poverty line.
Common Questions
What is Per Capita Income in Dent County?
Per Capita income in Dent County is $27,342.
What is the Median Family Income in Dent County?
Median Family Income in Dent County is $59,708.
What is the Median Household income in Dent County?
Median Household Income in Dent County is $51,410.
What is Income or Wage Gap in Dent County?
Income or Wage Gap in Dent County is 27.3%.
Women in Dent County earn 72.7 cents for every dollar earned by a man.
What is Family Income Deficit in Dent County?
Family Income Deficit in Dent County is $10,221.
Families that are below poverty line in Dent County earn $10,221 less on average than the poverty threshold level.
What is Inequality or Gini Index in Dent County?
Inequality or Gini Index in Dent County is 0.45.
What is the Total Population of Dent County?
Total Population of Dent County is 14,509.
What is the Total Male Population of Dent County?
Total Male Population of Dent County is 7,257.
What is the Total Female Population of Dent County?
Total Female Population of Dent County is 7,252.
What is the Ratio of Males per 100 Females in Dent County?
There are 100.07 Males per 100 Females in Dent County.
What is the Ratio of Females per 100 Males in Dent County?
There are 99.93 Females per 100 Males in Dent County.
What is the Median Population Age in Dent County?
Median Population Age in Dent County is 43.7 Years.
What is the Average Family Size in Dent County
Average Family Size in Dent County is 3.1 People.
What is the Average Household Size in Dent County
Average Household Size in Dent County is 2.5 People.
How Large is the Labor Force in Dent County?
There are 6,466 People in the Labor Forcein in Dent County.
What is the Percentage of People in the Labor Force in Dent County?
55.8% of People are in the Labor Force in Dent County.
What is the Unemployment Rate in Dent County?
Unemployment Rate in Dent County is 4.8%.