Cole County, MO Map & Demographics
Cole County Map
Cole County Overview
$35,519
PER CAPITA INCOME
$91,811
AVG FAMILY INCOME
$70,667
AVG HOUSEHOLD INCOME
20.7%
WAGE / INCOME GAP [ % ]
79.3¢/ $1
WAGE / INCOME GAP [ $ ]
$9,651
FAMILY INCOME DEFICIT
0.42
INEQUALITY / GINI INDEX
76,890
TOTAL POPULATION
38,954
MALE POPULATION
37,936
FEMALE POPULATION
102.68
MALES / 100 FEMALES
97.39
FEMALES / 100 MALES
39.6
MEDIAN AGE
3.1
AVG FAMILY SIZE
2.4
AVG HOUSEHOLD SIZE
39,107
LABOR FORCE [ PEOPLE ]
63.2%
PERCENT IN LABOR FORCE
3.1%
UNEMPLOYMENT RATE
Cole County Area Codes
Income in Cole County
Income Overview in Cole County
Per Capita Income in Cole County is $35,519, while median incomes of families and households are $91,811 and $70,667 respectively.
| Characteristic | Number | Measure |
| Per Capita Income | 76,890 | $35,519 |
| Median Family Income | 18,840 | $91,811 |
| Mean Family Income | 18,840 | $106,137 |
| Median Household Income | 30,151 | $70,667 |
| Mean Household Income | 30,151 | $87,298 |
| Income Deficit | 18,840 | $9,651 |
| Wage / Income Gap (%) | 76,890 | 20.71% |
| Wage / Income Gap ($) | 76,890 | 79.29¢ per $1 |
| Gini / Inequality Index | 76,890 | 0.42 |
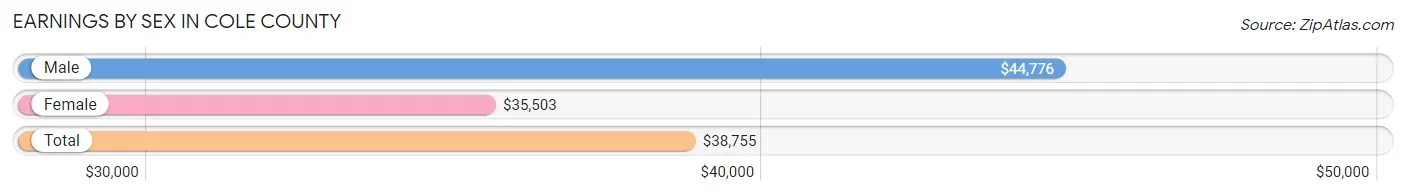
Earnings by Sex in Cole County
Average Earnings in Cole County are $38,755, $44,776 for men and $35,503 for women, a difference of 20.7%.
| Sex | Number | Average Earnings |
| Male | 21,891 (52.2%) | $44,776 |
| Female | 20,023 (47.8%) | $35,503 |
| Total | 41,914 (100.0%) | $38,755 |
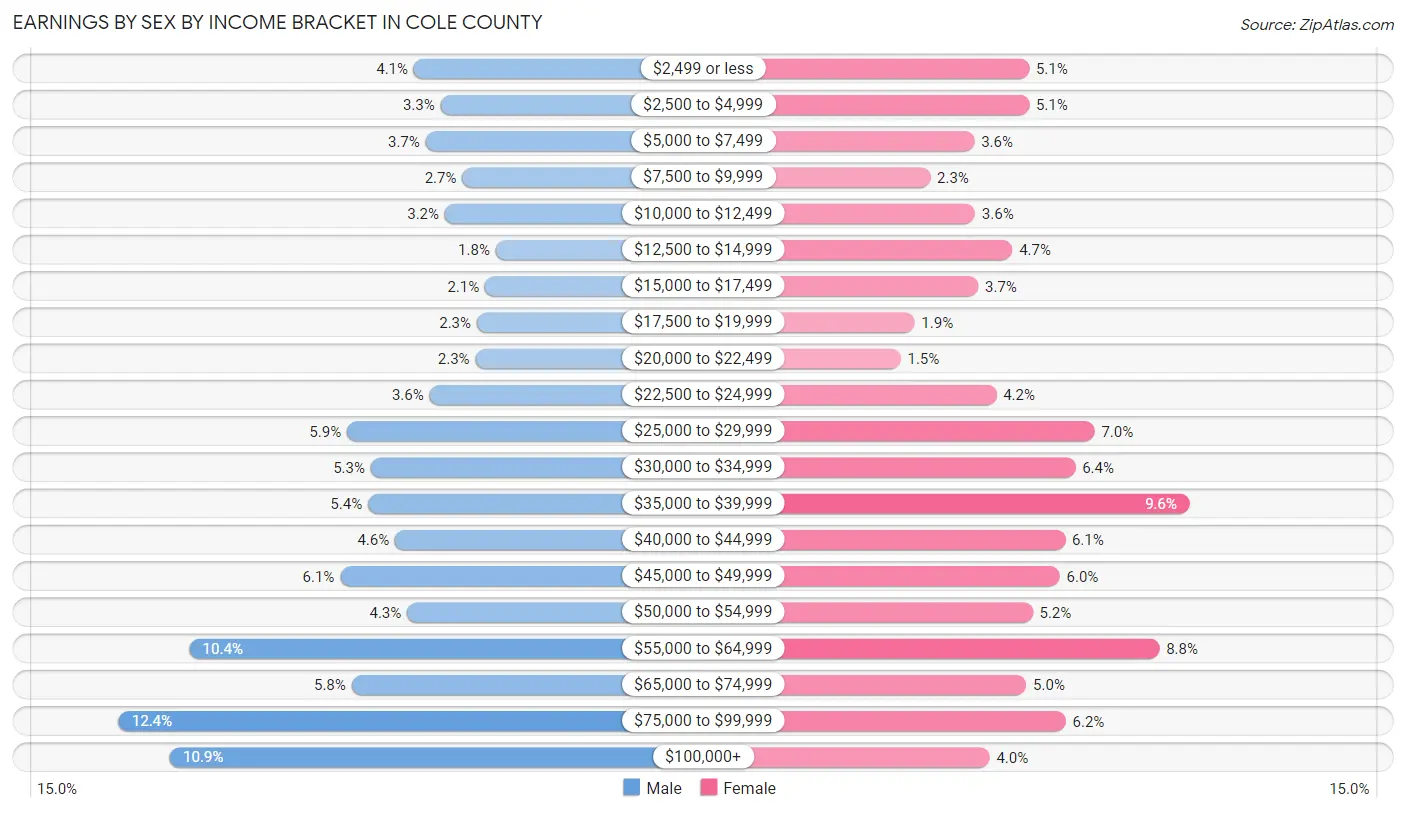
Earnings by Sex by Income Bracket in Cole County
The most common earnings brackets in Cole County are $75,000 to $99,999 for men (2,704 | 12.3%) and $35,000 to $39,999 for women (1,925 | 9.6%).
| Income | Male | Female |
| $2,499 or less | 889 (4.1%) | 1,025 (5.1%) |
| $2,500 to $4,999 | 724 (3.3%) | 1,025 (5.1%) |
| $5,000 to $7,499 | 817 (3.7%) | 716 (3.6%) |
| $7,500 to $9,999 | 591 (2.7%) | 468 (2.3%) |
| $10,000 to $12,499 | 699 (3.2%) | 721 (3.6%) |
| $12,500 to $14,999 | 386 (1.8%) | 932 (4.6%) |
| $15,000 to $17,499 | 450 (2.1%) | 738 (3.7%) |
| $17,500 to $19,999 | 501 (2.3%) | 380 (1.9%) |
| $20,000 to $22,499 | 511 (2.3%) | 303 (1.5%) |
| $22,500 to $24,999 | 792 (3.6%) | 840 (4.2%) |
| $25,000 to $29,999 | 1,300 (5.9%) | 1,393 (7.0%) |
| $30,000 to $34,999 | 1,153 (5.3%) | 1,285 (6.4%) |
| $35,000 to $39,999 | 1,171 (5.3%) | 1,925 (9.6%) |
| $40,000 to $44,999 | 1,005 (4.6%) | 1,227 (6.1%) |
| $45,000 to $49,999 | 1,342 (6.1%) | 1,198 (6.0%) |
| $50,000 to $54,999 | 930 (4.3%) | 1,046 (5.2%) |
| $55,000 to $64,999 | 2,267 (10.4%) | 1,758 (8.8%) |
| $65,000 to $74,999 | 1,271 (5.8%) | 1,010 (5.0%) |
| $75,000 to $99,999 | 2,704 (12.3%) | 1,231 (6.1%) |
| $100,000+ | 2,388 (10.9%) | 802 (4.0%) |
| Total | 21,891 (100.0%) | 20,023 (100.0%) |
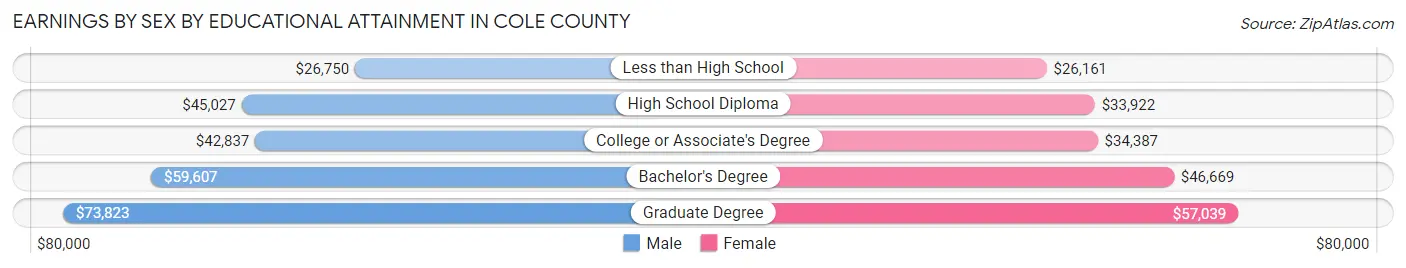
Earnings by Sex by Educational Attainment in Cole County
Average earnings in Cole County are $49,506 for men and $38,848 for women, a difference of 21.5%. Men with an educational attainment of graduate degree enjoy the highest average annual earnings of $73,823, while those with less than high school education earn the least with $26,750. Women with an educational attainment of graduate degree earn the most with the average annual earnings of $57,039, while those with less than high school education have the smallest earnings of $26,161.
| Educational Attainment | Male Income | Female Income |
| Less than High School | $26,750 | $26,161 |
| High School Diploma | $45,027 | $33,922 |
| College or Associate's Degree | $42,837 | $34,387 |
| Bachelor's Degree | $59,607 | $46,669 |
| Graduate Degree | $73,823 | $57,039 |
| Total | $49,506 | $38,848 |
Family Income in Cole County
Family Income Brackets in Cole County
According to the Cole County family income data, there are 4,672 families falling into the $100,000 to $149,999 income range, which is the most common income bracket and makes up 24.8% of all families. Conversely, the $10,000 to $14,999 income bracket is the least frequent group with only 396 families (2.1%) belonging to this category.
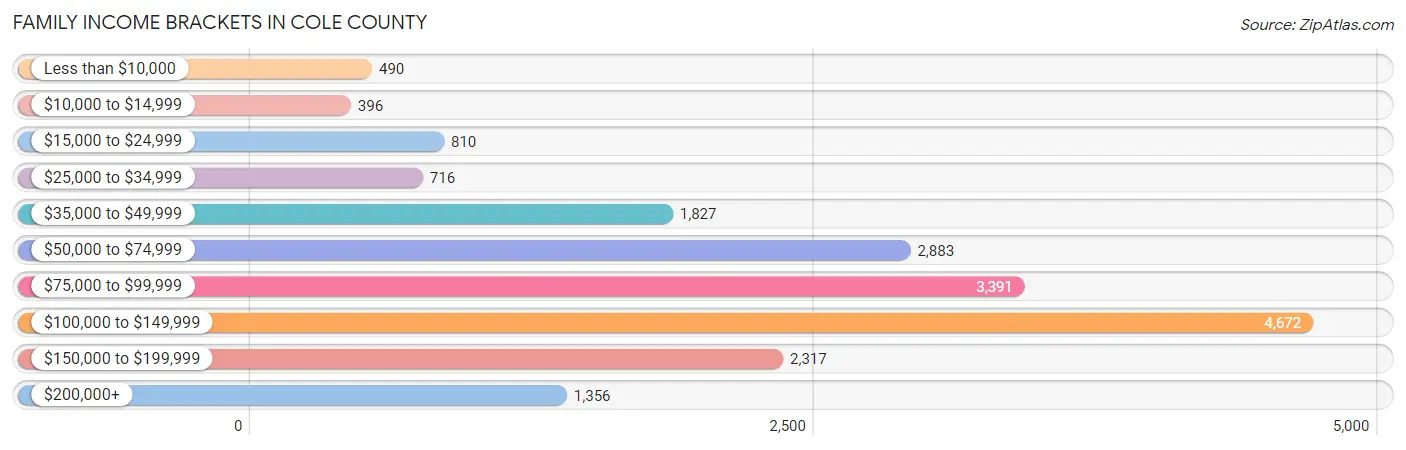
| Income Bracket | # Families | % Families |
| Less than $10,000 | 490 | 2.6% |
| $10,000 to $14,999 | 396 | 2.1% |
| $15,000 to $24,999 | 810 | 4.3% |
| $25,000 to $34,999 | 716 | 3.8% |
| $35,000 to $49,999 | 1,827 | 9.7% |
| $50,000 to $74,999 | 2,883 | 15.3% |
| $75,000 to $99,999 | 3,391 | 18.0% |
| $100,000 to $149,999 | 4,672 | 24.8% |
| $150,000 to $199,999 | 2,317 | 12.3% |
| $200,000+ | 1,356 | 7.2% |
Family Income by Famaliy Size in Cole County
5-person families (1,444 | 7.7%) account for the highest median family income in Cole County with $118,019 per family, while 2-person families (10,108 | 53.6%) have the highest median income of $42,556 per family member.
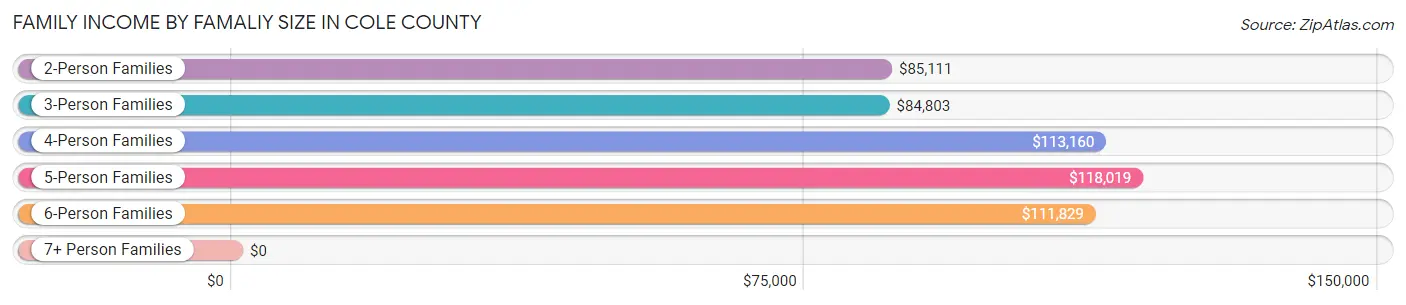
| Income Bracket | # Families | Median Income |
| 2-Person Families | 10,108 (53.6%) | $85,111 |
| 3-Person Families | 3,862 (20.5%) | $84,803 |
| 4-Person Families | 2,967 (15.8%) | $113,160 |
| 5-Person Families | 1,444 (7.7%) | $118,019 |
| 6-Person Families | 418 (2.2%) | $111,829 |
| 7+ Person Families | 41 (0.2%) | $0 |
| Total | 18,840 (100.0%) | $91,811 |
Family Income by Number of Earners in Cole County
The median family income in Cole County is $91,811, with families comprising 3+ earners (2,123) having the highest median family income of $131,971, while families with 1 earner (5,569) have the lowest median family income of $53,762, accounting for 11.3% and 29.6% of families, respectively.
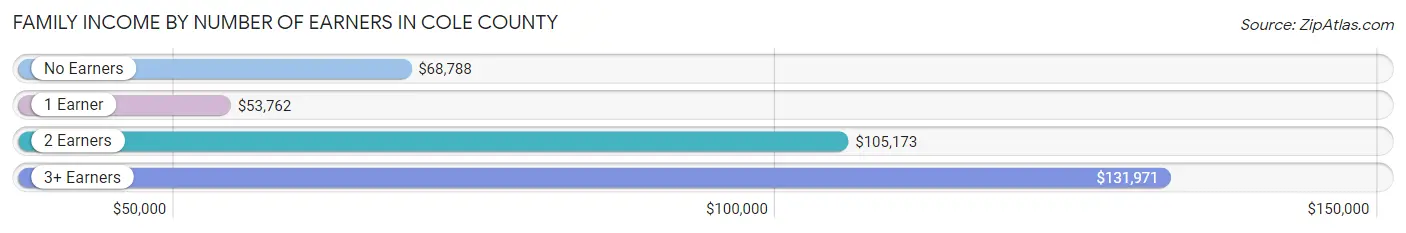
| Number of Earners | # Families | Median Income |
| No Earners | 2,612 (13.9%) | $68,788 |
| 1 Earner | 5,569 (29.6%) | $53,762 |
| 2 Earners | 8,536 (45.3%) | $105,173 |
| 3+ Earners | 2,123 (11.3%) | $131,971 |
| Total | 18,840 (100.0%) | $91,811 |
Household Income in Cole County
Household Income Brackets in Cole County
With 5,668 households falling in the category, the $100,000 to $149,999 income range is the most frequent in Cole County, accounting for 18.8% of all households. In contrast, only 844 households (2.8%) fall into the $10,000 to $14,999 income bracket, making it the least populous group.
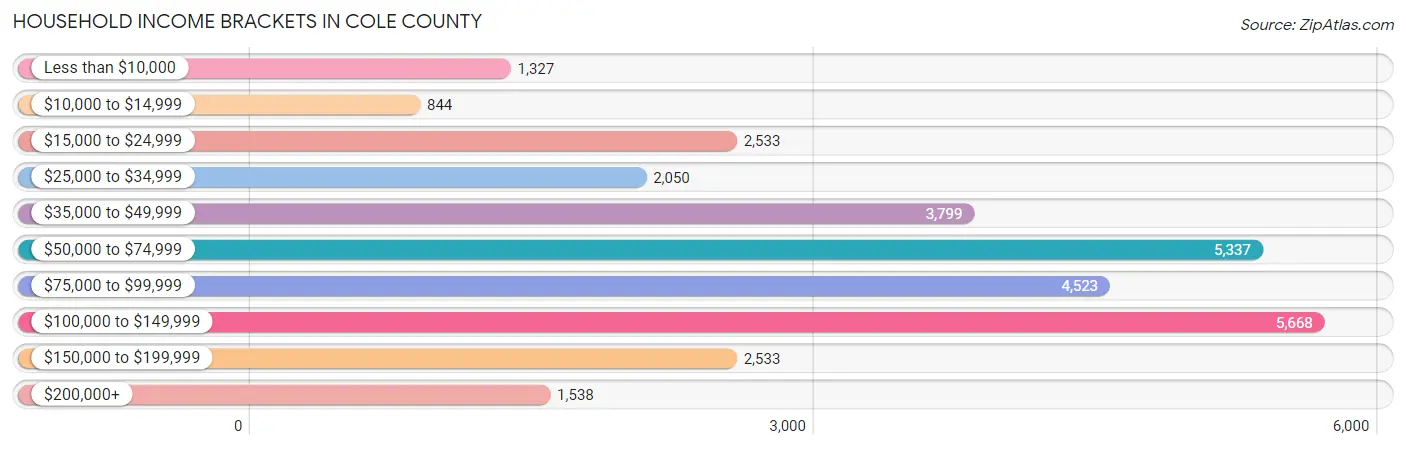
| Income Bracket | # Households | % Households |
| Less than $10,000 | 1,327 | 4.4% |
| $10,000 to $14,999 | 844 | 2.8% |
| $15,000 to $24,999 | 2,533 | 8.4% |
| $25,000 to $34,999 | 2,050 | 6.8% |
| $35,000 to $49,999 | 3,799 | 12.6% |
| $50,000 to $74,999 | 5,337 | 17.7% |
| $75,000 to $99,999 | 4,523 | 15.0% |
| $100,000 to $149,999 | 5,668 | 18.8% |
| $150,000 to $199,999 | 2,533 | 8.4% |
| $200,000+ | 1,538 | 5.1% |
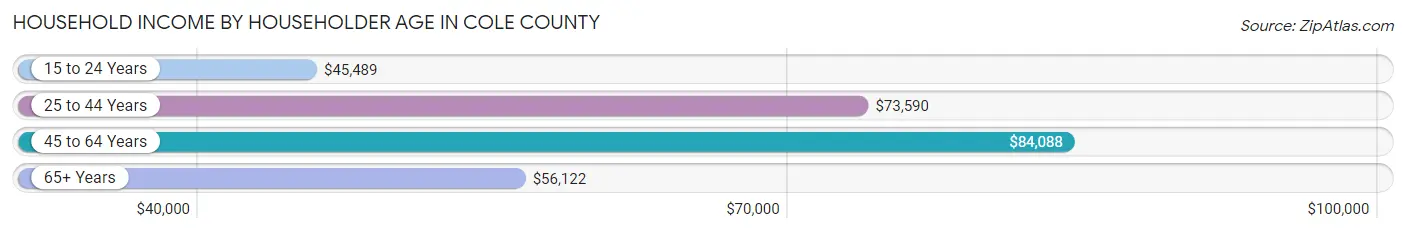
Household Income by Householder Age in Cole County
The median household income in Cole County is $70,667, with the highest median household income of $84,088 found in the 45 to 64 years age bracket for the primary householder. A total of 10,721 households (35.6%) fall into this category. Meanwhile, the 15 to 24 years age bracket for the primary householder has the lowest median household income of $45,489, with 975 households (3.2%) in this group.
| Income Bracket | # Households | Median Income |
| 15 to 24 Years | 975 (3.2%) | $45,489 |
| 25 to 44 Years | 9,789 (32.5%) | $73,590 |
| 45 to 64 Years | 10,721 (35.6%) | $84,088 |
| 65+ Years | 8,666 (28.7%) | $56,122 |
| Total | 30,151 (100.0%) | $70,667 |
Poverty in Cole County
Income Below Poverty by Sex and Age in Cole County
With 7.7% poverty level for males and 11.0% for females among the residents of Cole County, 6 to 11 year old males and 25 to 34 year old females are the most vulnerable to poverty, with 507 males (17.3%) and 980 females (20.1%) in their respective age groups living below the poverty level.
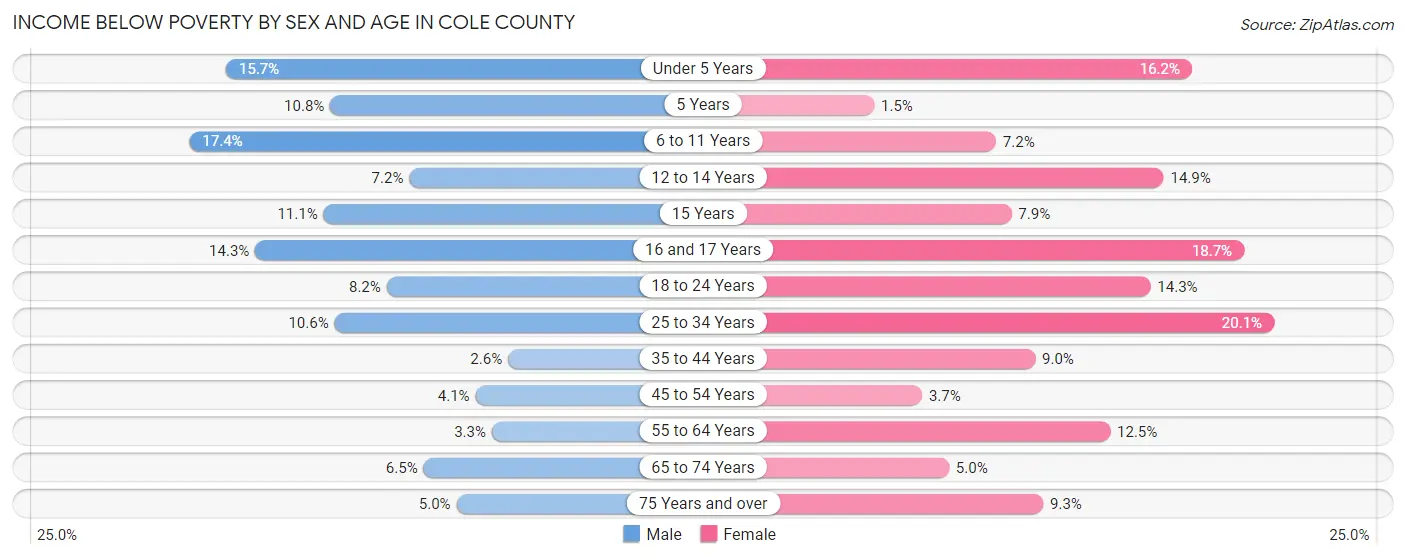
| Age Bracket | Male | Female |
| Under 5 Years | 338 (15.7%) | 352 (16.2%) |
| 5 Years | 49 (10.8%) | 5 (1.5%) |
| 6 to 11 Years | 507 (17.3%) | 197 (7.1%) |
| 12 to 14 Years | 99 (7.1%) | 242 (14.9%) |
| 15 Years | 54 (11.1%) | 40 (7.9%) |
| 16 and 17 Years | 147 (14.3%) | 181 (18.7%) |
| 18 to 24 Years | 240 (8.2%) | 380 (14.3%) |
| 25 to 34 Years | 497 (10.6%) | 980 (20.1%) |
| 35 to 44 Years | 115 (2.6%) | 417 (9.0%) |
| 45 to 54 Years | 184 (4.1%) | 161 (3.7%) |
| 55 to 64 Years | 149 (3.3%) | 635 (12.4%) |
| 65 to 74 Years | 233 (6.5%) | 204 (5.0%) |
| 75 Years and over | 103 (5.0%) | 286 (9.3%) |
| Total | 2,715 (7.7%) | 4,080 (11.0%) |
Income Above Poverty by Sex and Age in Cole County
According to the poverty statistics in Cole County, males aged 35 to 44 years and females aged 5 years are the age groups that are most secure financially, with 97.4% of males and 98.5% of females in these age groups living above the poverty line.
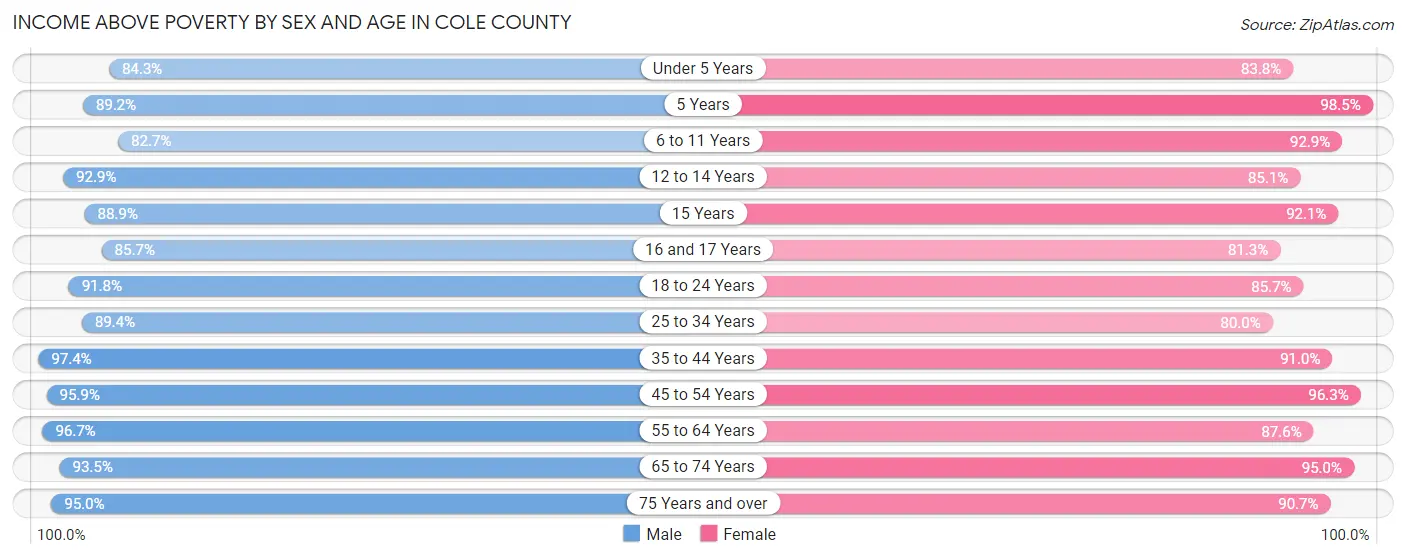
| Age Bracket | Male | Female |
| Under 5 Years | 1,821 (84.3%) | 1,816 (83.8%) |
| 5 Years | 404 (89.2%) | 328 (98.5%) |
| 6 to 11 Years | 2,415 (82.7%) | 2,557 (92.8%) |
| 12 to 14 Years | 1,286 (92.8%) | 1,379 (85.1%) |
| 15 Years | 431 (88.9%) | 468 (92.1%) |
| 16 and 17 Years | 881 (85.7%) | 789 (81.3%) |
| 18 to 24 Years | 2,686 (91.8%) | 2,273 (85.7%) |
| 25 to 34 Years | 4,181 (89.4%) | 3,907 (79.9%) |
| 35 to 44 Years | 4,356 (97.4%) | 4,234 (91.0%) |
| 45 to 54 Years | 4,330 (95.9%) | 4,167 (96.3%) |
| 55 to 64 Years | 4,342 (96.7%) | 4,467 (87.5%) |
| 65 to 74 Years | 3,358 (93.5%) | 3,899 (95.0%) |
| 75 Years and over | 1,972 (95.0%) | 2,777 (90.7%) |
| Total | 32,463 (92.3%) | 33,061 (89.0%) |
Income Below Poverty Among Married-Couple Families in Cole County
The poverty statistics for married-couple families in Cole County show that 2.1% or 311 of the total 14,637 families live below the poverty line. Families with 1 or 2 children have the highest poverty rate of 3.1%, comprising of 134 families. On the other hand, families with 5 or more children have the lowest poverty rate of 0.0%, which includes 0 families.
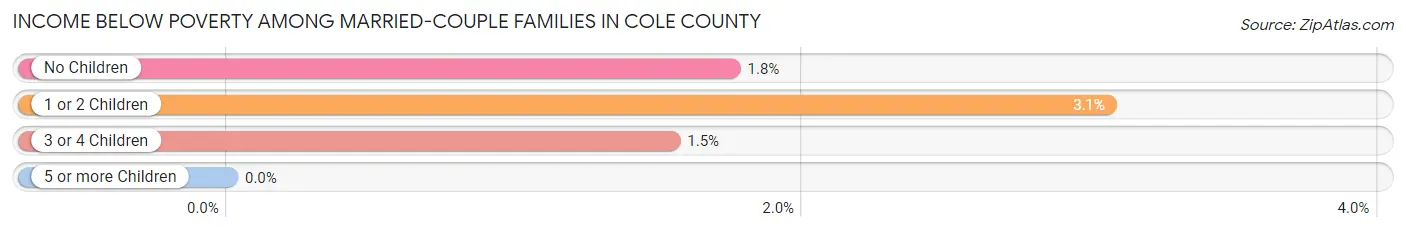
| Children | Above Poverty | Below Poverty |
| No Children | 8,856 (98.3%) | 158 (1.8%) |
| 1 or 2 Children | 4,240 (96.9%) | 134 (3.1%) |
| 3 or 4 Children | 1,215 (98.5%) | 19 (1.5%) |
| 5 or more Children | 15 (100.0%) | 0 (0.0%) |
| Total | 14,326 (97.9%) | 311 (2.1%) |
Income Below Poverty Among Single-Parent Households in Cole County
According to the poverty data in Cole County, 13.3% or 148 single-father households and 31.9% or 984 single-mother households are living below the poverty line. Among single-father households, those with 1 or 2 children have the highest poverty rate, with 143 households (22.4%) experiencing poverty. Likewise, among single-mother households, those with 5 or more children have the highest poverty rate, with 9 households (100.0%) falling below the poverty line.
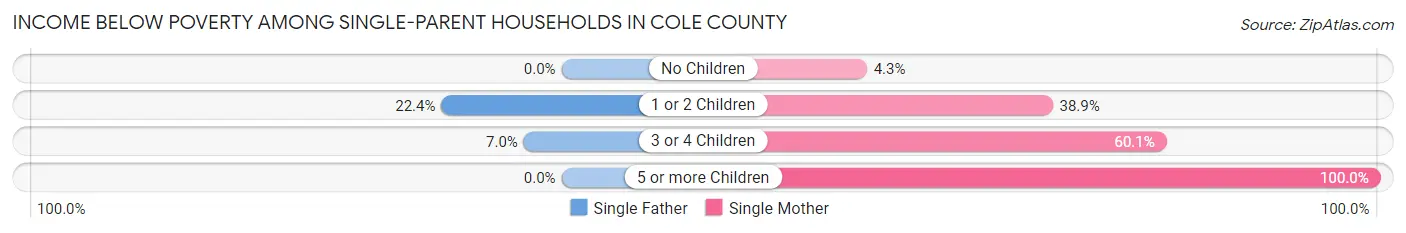
| Children | Single Father | Single Mother |
| No Children | 0 (0.0%) | 36 (4.3%) |
| 1 or 2 Children | 143 (22.4%) | 749 (38.9%) |
| 3 or 4 Children | 5 (7.0%) | 190 (60.1%) |
| 5 or more Children | 0 (0.0%) | 9 (100.0%) |
| Total | 148 (13.3%) | 984 (31.9%) |
Income Below Poverty Among Married-Couple vs Single-Parent Households in Cole County
The poverty data for Cole County shows that 311 of the married-couple family households (2.1%) and 1,132 of the single-parent households (26.9%) are living below the poverty level. Within the married-couple family households, those with 1 or 2 children have the highest poverty rate, with 134 households (3.1%) falling below the poverty line. Among the single-parent households, those with 5 or more children have the highest poverty rate, with 9 household (100.0%) living below poverty.
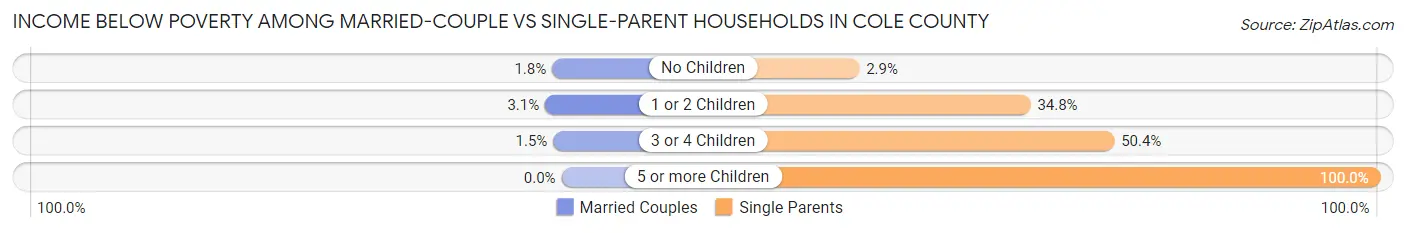
| Children | Married-Couple Families | Single-Parent Households |
| No Children | 158 (1.8%) | 36 (2.9%) |
| 1 or 2 Children | 134 (3.1%) | 892 (34.8%) |
| 3 or 4 Children | 19 (1.5%) | 195 (50.4%) |
| 5 or more Children | 0 (0.0%) | 9 (100.0%) |
| Total | 311 (2.1%) | 1,132 (26.9%) |
Race in Cole County
The most populous races in Cole County are White / Caucasian (63,060 | 82.0%), Black / African American (8,761 | 11.4%), and Two or more Races (3,131 | 4.1%).
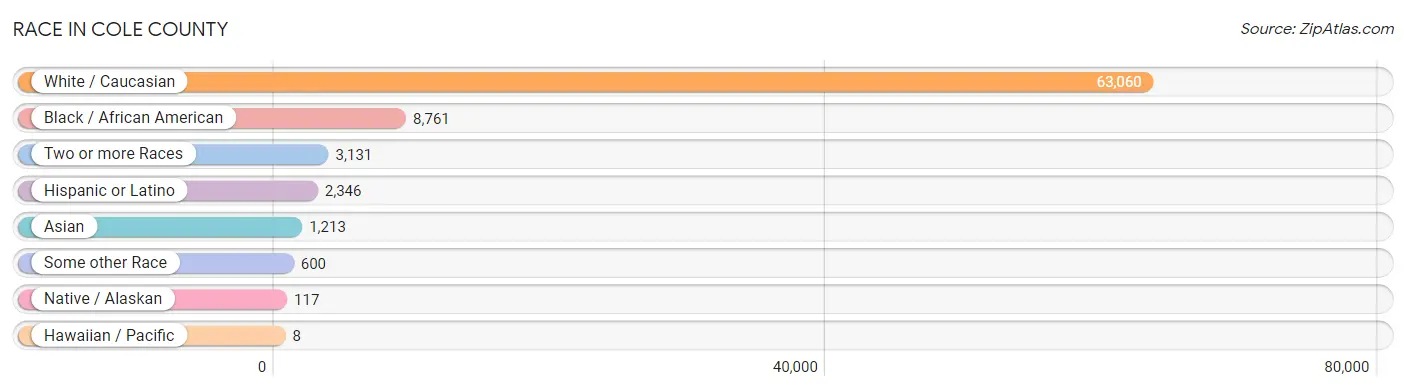
| Race | # Population | % Population |
| Asian | 1,213 | 1.6% |
| Black / African American | 8,761 | 11.4% |
| Hawaiian / Pacific | 8 | 0.0% |
| Hispanic or Latino | 2,346 | 3.0% |
| Native / Alaskan | 117 | 0.2% |
| White / Caucasian | 63,060 | 82.0% |
| Two or more Races | 3,131 | 4.1% |
| Some other Race | 600 | 0.8% |
| Total | 76,890 | 100.0% |
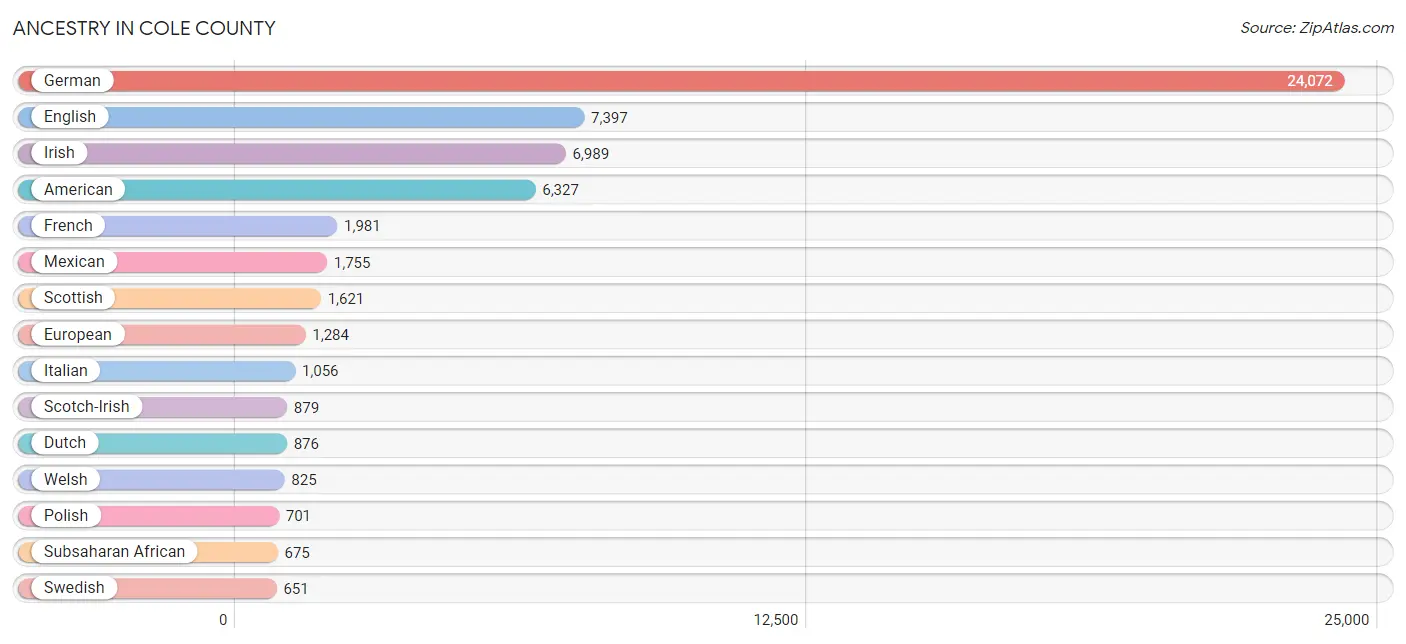
Ancestry in Cole County
The most populous ancestries reported in Cole County are German (24,072 | 31.3%), English (7,397 | 9.6%), Irish (6,989 | 9.1%), American (6,327 | 8.2%), and French (1,981 | 2.6%), together accounting for 60.8% of all Cole County residents.
| Ancestry | # Population | % Population |
| African | 537 | 0.7% |
| American | 6,327 | 8.2% |
| Apache | 23 | 0.0% |
| Arab | 174 | 0.2% |
| Argentinean | 6 | 0.0% |
| Austrian | 77 | 0.1% |
| Belgian | 16 | 0.0% |
| Bhutanese | 68 | 0.1% |
| Blackfeet | 26 | 0.0% |
| Brazilian | 140 | 0.2% |
| British | 463 | 0.6% |
| British West Indian | 23 | 0.0% |
| Burmese | 45 | 0.1% |
| Canadian | 89 | 0.1% |
| Celtic | 15 | 0.0% |
| Central American | 217 | 0.3% |
| Central American Indian | 51 | 0.1% |
| Cherokee | 144 | 0.2% |
| Chilean | 21 | 0.0% |
| Choctaw | 4 | 0.0% |
| Cree | 3 | 0.0% |
| Croatian | 61 | 0.1% |
| Czech | 234 | 0.3% |
| Danish | 83 | 0.1% |
| Delaware | 3 | 0.0% |
| Dominican | 15 | 0.0% |
| Dutch | 876 | 1.1% |
| Eastern European | 222 | 0.3% |
| English | 7,397 | 9.6% |
| European | 1,284 | 1.7% |
| Filipino | 206 | 0.3% |
| Finnish | 3 | 0.0% |
| French | 1,981 | 2.6% |
| French American Indian | 45 | 0.1% |
| French Canadian | 119 | 0.2% |
| German | 24,072 | 31.3% |
| Ghanaian | 13 | 0.0% |
| Greek | 74 | 0.1% |
| Guatemalan | 79 | 0.1% |
| Haitian | 41 | 0.1% |
| Honduran | 12 | 0.0% |
| Hungarian | 115 | 0.2% |
| Indian (Asian) | 93 | 0.1% |
| Iranian | 60 | 0.1% |
| Irish | 6,989 | 9.1% |
| Israeli | 72 | 0.1% |
| Italian | 1,056 | 1.4% |
| Jamaican | 381 | 0.5% |
| Japanese | 17 | 0.0% |
| Korean | 239 | 0.3% |
| Lebanese | 107 | 0.1% |
| Lithuanian | 27 | 0.0% |
| Mexican | 1,755 | 2.3% |
| Moroccan | 11 | 0.0% |
| Native Hawaiian | 5 | 0.0% |
| Nicaraguan | 67 | 0.1% |
| Nigerian | 58 | 0.1% |
| Northern European | 74 | 0.1% |
| Norwegian | 604 | 0.8% |
| Osage | 10 | 0.0% |
| Pakistani | 48 | 0.1% |
| Palestinian | 28 | 0.0% |
| Panamanian | 8 | 0.0% |
| Pennsylvania German | 6 | 0.0% |
| Polish | 701 | 0.9% |
| Portuguese | 28 | 0.0% |
| Potawatomi | 44 | 0.1% |
| Puerto Rican | 202 | 0.3% |
| Romanian | 44 | 0.1% |
| Russian | 216 | 0.3% |
| Salvadoran | 51 | 0.1% |
| Samoan | 32 | 0.0% |
| Scandinavian | 472 | 0.6% |
| Scotch-Irish | 879 | 1.1% |
| Scottish | 1,621 | 2.1% |
| Seminole | 4 | 0.0% |
| Serbian | 9 | 0.0% |
| Sioux | 9 | 0.0% |
| Slovak | 33 | 0.0% |
| Slovene | 19 | 0.0% |
| South American | 27 | 0.0% |
| South American Indian | 29 | 0.0% |
| Spaniard | 41 | 0.1% |
| Spanish | 7 | 0.0% |
| Sri Lankan | 150 | 0.2% |
| Subsaharan African | 675 | 0.9% |
| Sudanese | 55 | 0.1% |
| Swedish | 651 | 0.9% |
| Swiss | 286 | 0.4% |
| Syrian | 1 | 0.0% |
| Thai | 455 | 0.6% |
| Ukrainian | 74 | 0.1% |
| Vietnamese | 27 | 0.0% |
| Welsh | 825 | 1.1% |
| West Indian | 22 | 0.0% | View All 95 Rows |
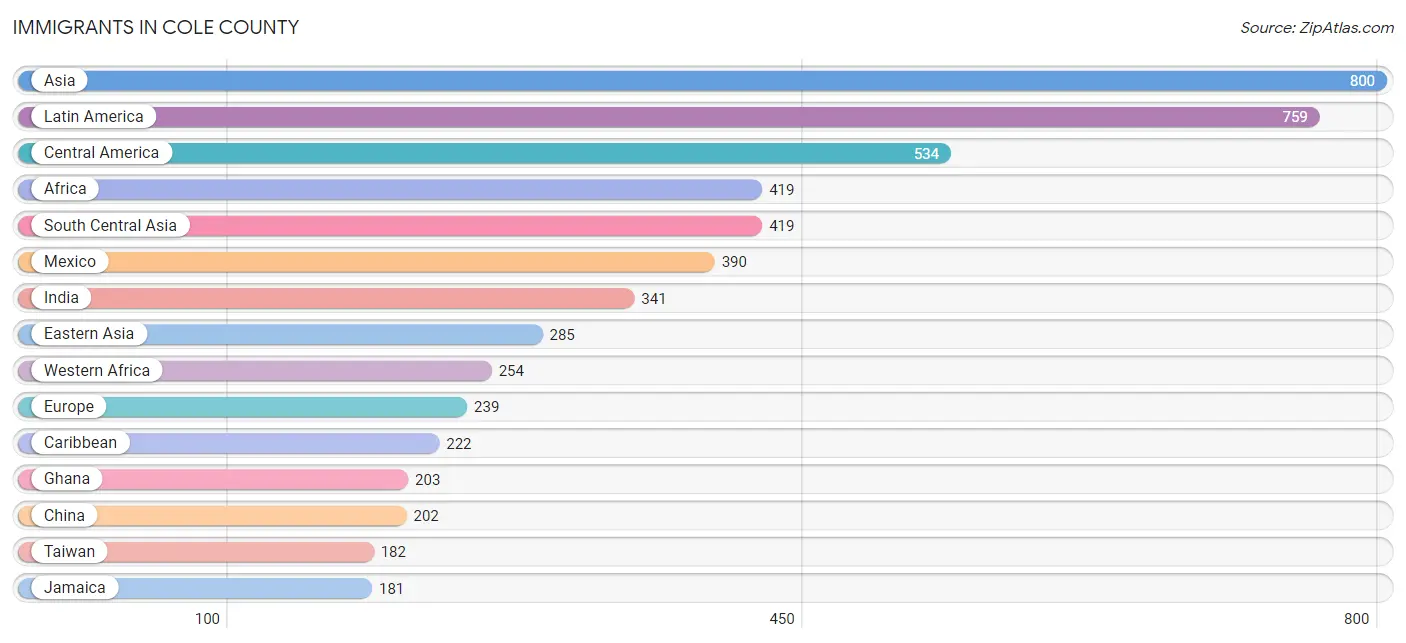
Immigrants in Cole County
The most numerous immigrant groups reported in Cole County came from Asia (800 | 1.0%), Latin America (759 | 1.0%), Central America (534 | 0.7%), Africa (419 | 0.5%), and South Central Asia (419 | 0.5%), together accounting for 3.8% of all Cole County residents.
| Immigration Origin | # Population | % Population |
| Africa | 419 | 0.5% |
| Asia | 800 | 1.0% |
| Bahamas | 18 | 0.0% |
| Bangladesh | 10 | 0.0% |
| Brazil | 3 | 0.0% |
| Cambodia | 3 | 0.0% |
| Canada | 19 | 0.0% |
| Caribbean | 222 | 0.3% |
| Central America | 534 | 0.7% |
| China | 202 | 0.3% |
| Eastern Africa | 130 | 0.2% |
| Eastern Asia | 285 | 0.4% |
| Eastern Europe | 69 | 0.1% |
| El Salvador | 18 | 0.0% |
| England | 22 | 0.0% |
| Ethiopia | 9 | 0.0% |
| Europe | 239 | 0.3% |
| Germany | 146 | 0.2% |
| Ghana | 203 | 0.3% |
| Guatemala | 77 | 0.1% |
| Hungary | 3 | 0.0% |
| India | 341 | 0.4% |
| Iran | 27 | 0.0% |
| Ireland | 2 | 0.0% |
| Jamaica | 181 | 0.2% |
| Japan | 45 | 0.1% |
| Kenya | 121 | 0.2% |
| Korea | 38 | 0.1% |
| Latin America | 759 | 1.0% |
| Malaysia | 30 | 0.0% |
| Mexico | 390 | 0.5% |
| Middle Africa | 35 | 0.1% |
| Nepal | 41 | 0.1% |
| Nicaragua | 49 | 0.1% |
| Nigeria | 30 | 0.0% |
| Northern Europe | 24 | 0.0% |
| Russia | 28 | 0.0% |
| Sierra Leone | 21 | 0.0% |
| South America | 3 | 0.0% |
| South Central Asia | 419 | 0.5% |
| South Eastern Asia | 96 | 0.1% |
| Taiwan | 182 | 0.2% |
| Thailand | 1 | 0.0% |
| Ukraine | 38 | 0.1% |
| Vietnam | 62 | 0.1% |
| Western Africa | 254 | 0.3% |
| Western Europe | 146 | 0.2% | View All 47 Rows |
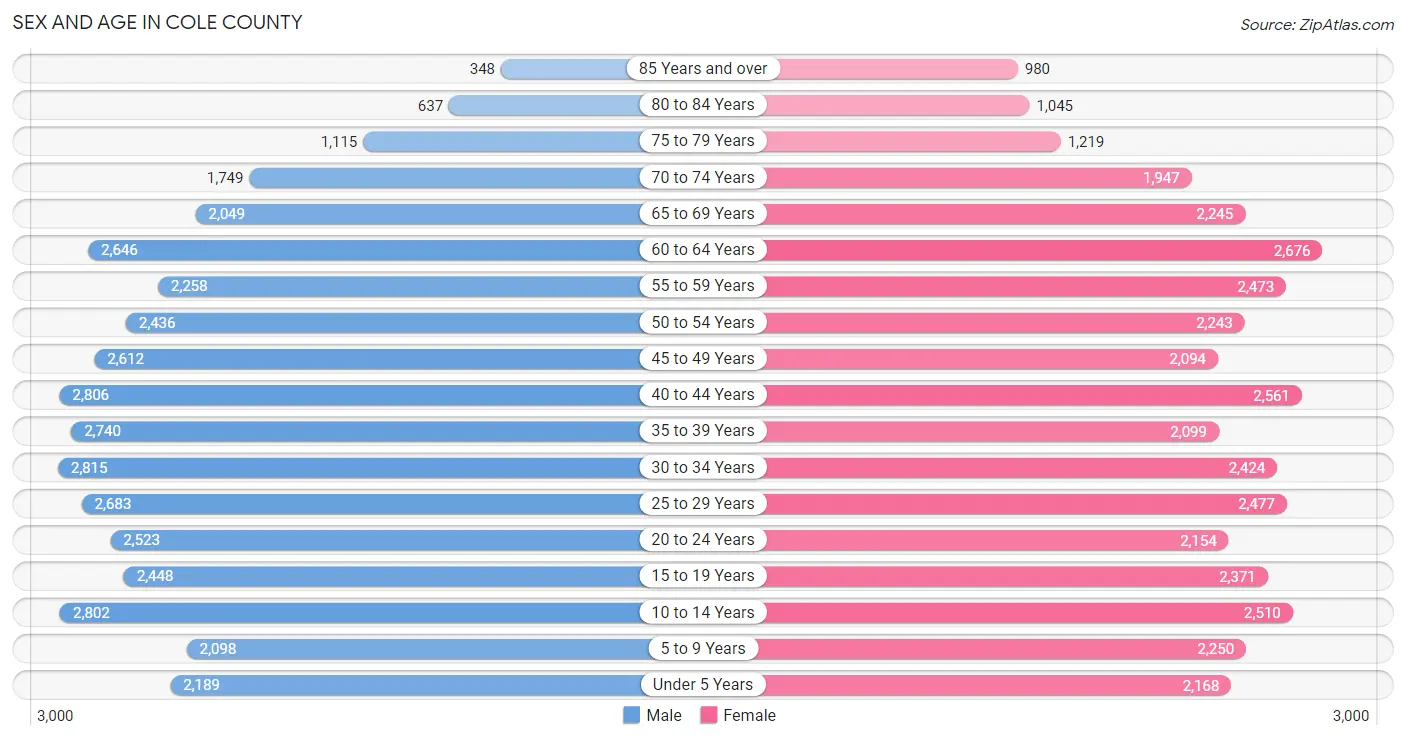
Sex and Age in Cole County
Sex and Age in Cole County
The most populous age groups in Cole County are 30 to 34 Years (2,815 | 7.2%) for men and 60 to 64 Years (2,676 | 7.0%) for women.
| Age Bracket | Male | Female |
| Under 5 Years | 2,189 (5.6%) | 2,168 (5.7%) |
| 5 to 9 Years | 2,098 (5.4%) | 2,250 (5.9%) |
| 10 to 14 Years | 2,802 (7.2%) | 2,510 (6.6%) |
| 15 to 19 Years | 2,448 (6.3%) | 2,371 (6.2%) |
| 20 to 24 Years | 2,523 (6.5%) | 2,154 (5.7%) |
| 25 to 29 Years | 2,683 (6.9%) | 2,477 (6.5%) |
| 30 to 34 Years | 2,815 (7.2%) | 2,424 (6.4%) |
| 35 to 39 Years | 2,740 (7.0%) | 2,099 (5.5%) |
| 40 to 44 Years | 2,806 (7.2%) | 2,561 (6.8%) |
| 45 to 49 Years | 2,612 (6.7%) | 2,094 (5.5%) |
| 50 to 54 Years | 2,436 (6.2%) | 2,243 (5.9%) |
| 55 to 59 Years | 2,258 (5.8%) | 2,473 (6.5%) |
| 60 to 64 Years | 2,646 (6.8%) | 2,676 (7.0%) |
| 65 to 69 Years | 2,049 (5.3%) | 2,245 (5.9%) |
| 70 to 74 Years | 1,749 (4.5%) | 1,947 (5.1%) |
| 75 to 79 Years | 1,115 (2.9%) | 1,219 (3.2%) |
| 80 to 84 Years | 637 (1.6%) | 1,045 (2.8%) |
| 85 Years and over | 348 (0.9%) | 980 (2.6%) |
| Total | 38,954 (100.0%) | 37,936 (100.0%) |
Families and Households in Cole County
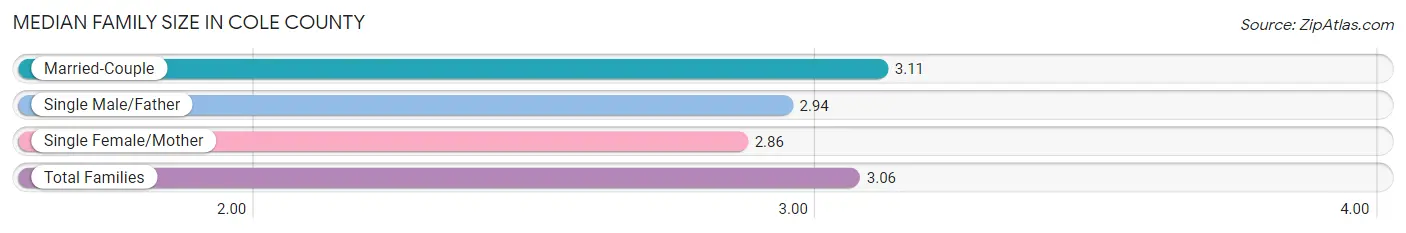
Median Family Size in Cole County
The median family size in Cole County is 3.06 persons per family, with married-couple families (14,637 | 77.7%) accounting for the largest median family size of 3.11 persons per family. On the other hand, single female/mother families (3,089 | 16.4%) represent the smallest median family size with 2.86 persons per family.
| Family Type | # Families | Family Size |
| Married-Couple | 14,637 (77.7%) | 3.11 |
| Single Male/Father | 1,114 (5.9%) | 2.94 |
| Single Female/Mother | 3,089 (16.4%) | 2.86 |
| Total Families | 18,840 (100.0%) | 3.06 |
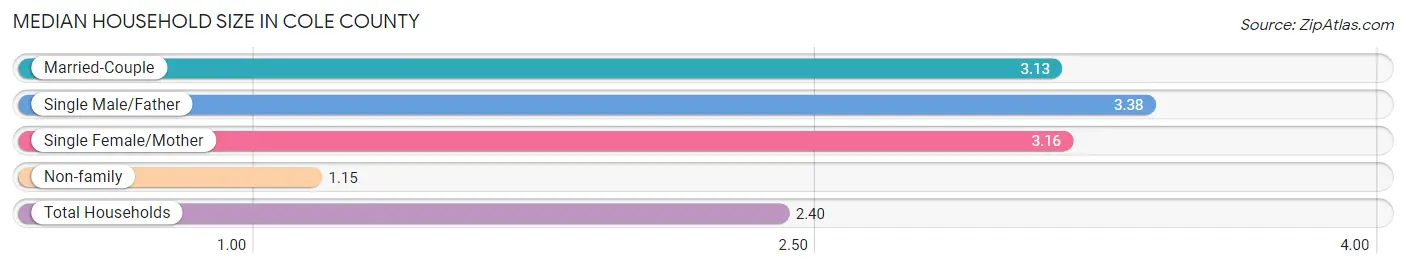
Median Household Size in Cole County
The median household size in Cole County is 2.40 persons per household, with single male/father households (1,114 | 3.7%) accounting for the largest median household size of 3.38 persons per household. non-family households (11,311 | 37.5%) represent the smallest median household size with 1.15 persons per household.
| Household Type | # Households | Household Size |
| Married-Couple | 14,637 (48.5%) | 3.13 |
| Single Male/Father | 1,114 (3.7%) | 3.38 |
| Single Female/Mother | 3,089 (10.2%) | 3.16 |
| Non-family | 11,311 (37.5%) | 1.15 |
| Total Households | 30,151 (100.0%) | 2.40 |
Household Size by Marriage Status in Cole County
Out of a total of 30,151 households in Cole County, 18,840 (62.5%) are family households, while 11,311 (37.5%) are nonfamily households. The most numerous type of family households are 2-person households, comprising 9,320, and the most common type of nonfamily households are 1-person households, comprising 9,985.
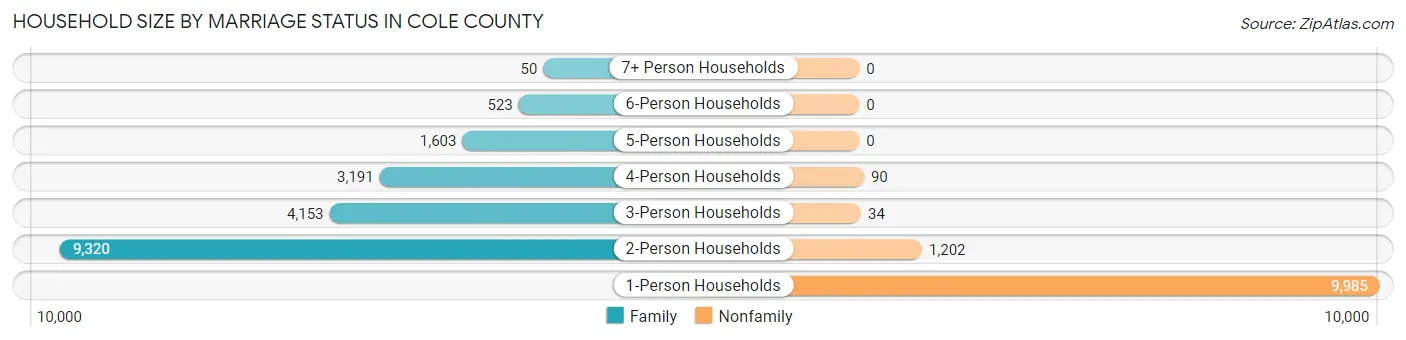
| Household Size | Family Households | Nonfamily Households |
| 1-Person Households | - | 9,985 (33.1%) |
| 2-Person Households | 9,320 (30.9%) | 1,202 (4.0%) |
| 3-Person Households | 4,153 (13.8%) | 34 (0.1%) |
| 4-Person Households | 3,191 (10.6%) | 90 (0.3%) |
| 5-Person Households | 1,603 (5.3%) | 0 (0.0%) |
| 6-Person Households | 523 (1.7%) | 0 (0.0%) |
| 7+ Person Households | 50 (0.2%) | 0 (0.0%) |
| Total | 18,840 (62.5%) | 11,311 (37.5%) |
Female Fertility in Cole County
Fertility by Age in Cole County
Average fertility rate in Cole County is 54.0 births per 1,000 women. Women in the age bracket of 20 to 34 years have the highest fertility rate with 103.0 births per 1,000 women. Women in the age bracket of 20 to 34 years acount for 81.9% of all women with births.
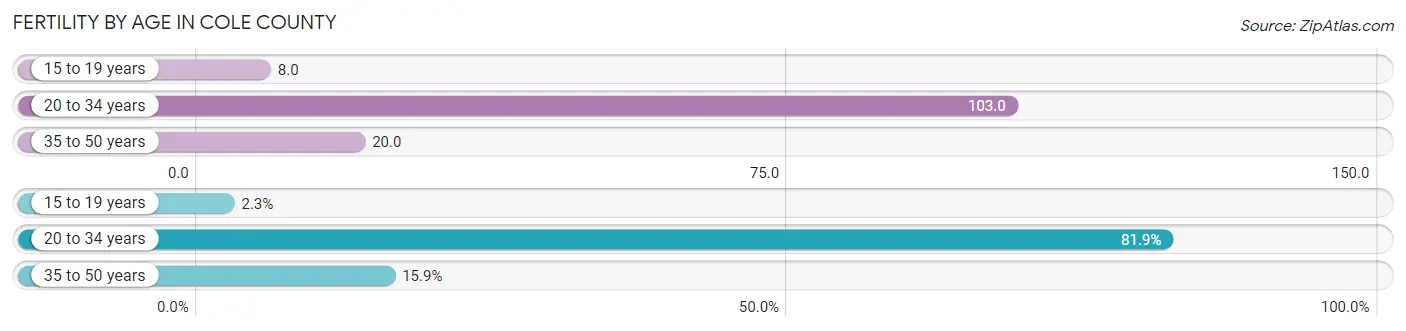
| Age Bracket | Women with Births | Births / 1,000 Women |
| 15 to 19 years | 20 (2.2%) | 8.0 |
| 20 to 34 years | 727 (81.9%) | 103.0 |
| 35 to 50 years | 141 (15.9%) | 20.0 |
| Total | 888 (100.0%) | 54.0 |
Fertility by Age by Marriage Status in Cole County
60.5% of women with births (888) in Cole County are married. The highest percentage of unmarried women with births falls into 15 to 19 years age bracket with 90.0% of them unmarried at the time of birth, while the lowest percentage of unmarried women with births belong to 35 to 50 years age bracket with 19.9% of them unmarried.
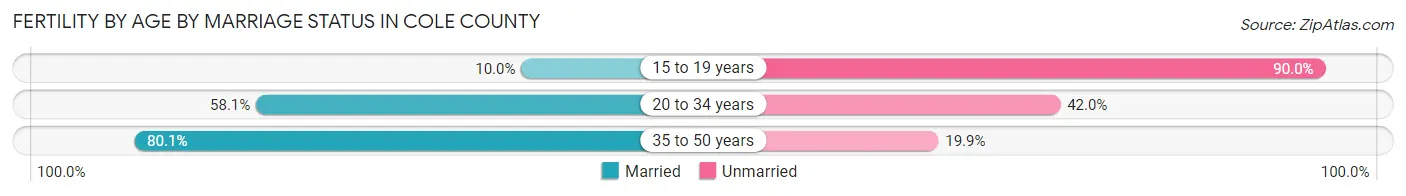
| Age Bracket | Married | Unmarried |
| 15 to 19 years | 2 (10.0%) | 18 (90.0%) |
| 20 to 34 years | 422 (58.1%) | 305 (41.9%) |
| 35 to 50 years | 113 (80.1%) | 28 (19.9%) |
| Total | 537 (60.5%) | 351 (39.5%) |
Fertility by Education in Cole County
Average fertility rate in Cole County is 54.0 births per 1,000 women. Women with the education attainment of college or associate's degree have the highest fertility rate of 74.0 births per 1,000 women, while women with the education attainment of less than high school have the lowest fertility at 5.0 births per 1,000 women. Women with the education attainment of college or associate's degree represent 40.2% of all women with births.
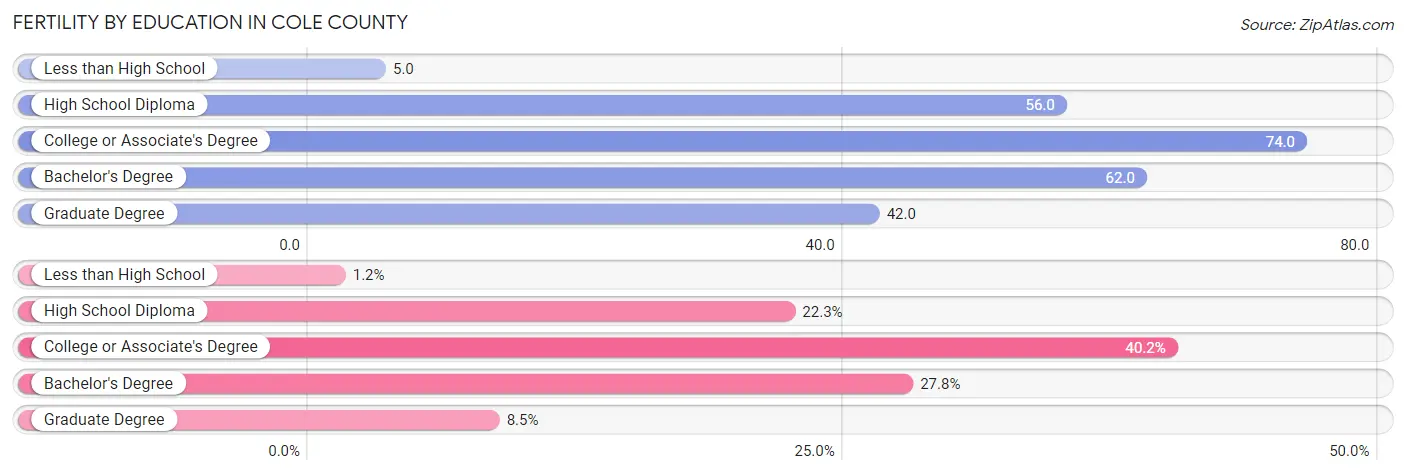
| Educational Attainment | Women with Births | Births / 1,000 Women |
| Less than High School | 11 (1.2%) | 5.0 |
| High School Diploma | 198 (22.3%) | 56.0 |
| College or Associate's Degree | 357 (40.2%) | 74.0 |
| Bachelor's Degree | 247 (27.8%) | 62.0 |
| Graduate Degree | 75 (8.5%) | 42.0 |
| Total | 888 (100.0%) | 54.0 |
Fertility by Education by Marriage Status in Cole County
39.5% of women with births in Cole County are unmarried. Women with the educational attainment of graduate degree are most likely to be married with 100.0% of them married at childbirth, while women with the educational attainment of less than high school are least likely to be married with 100.0% of them unmarried at childbirth.
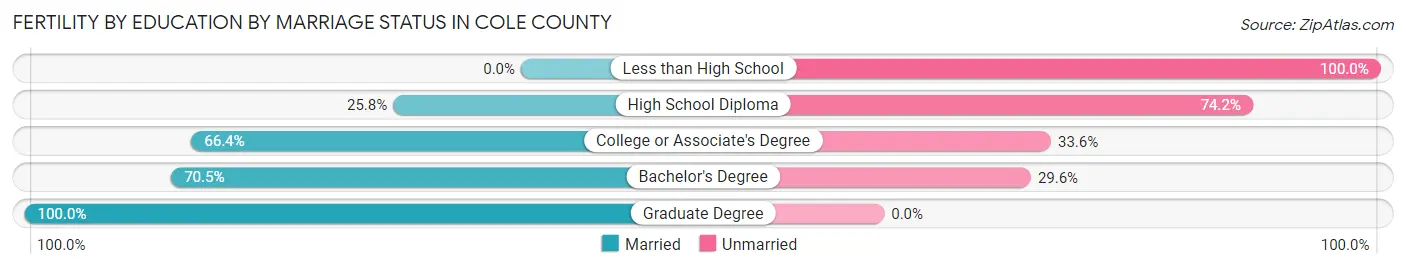
| Educational Attainment | Married | Unmarried |
| Less than High School | 0 (0.0%) | 11 (100.0%) |
| High School Diploma | 51 (25.8%) | 147 (74.2%) |
| College or Associate's Degree | 237 (66.4%) | 120 (33.6%) |
| Bachelor's Degree | 174 (70.5%) | 73 (29.5%) |
| Graduate Degree | 75 (100.0%) | 0 (0.0%) |
| Total | 537 (60.5%) | 351 (39.5%) |
Employment Characteristics in Cole County
Employment by Class of Employer in Cole County
Among the 37,693 employed individuals in Cole County, private company employees (21,908 | 58.1%), state government employees (6,702 | 17.8%), and not-for-profit organizations (3,287 | 8.7%) make up the most common classes of employment.
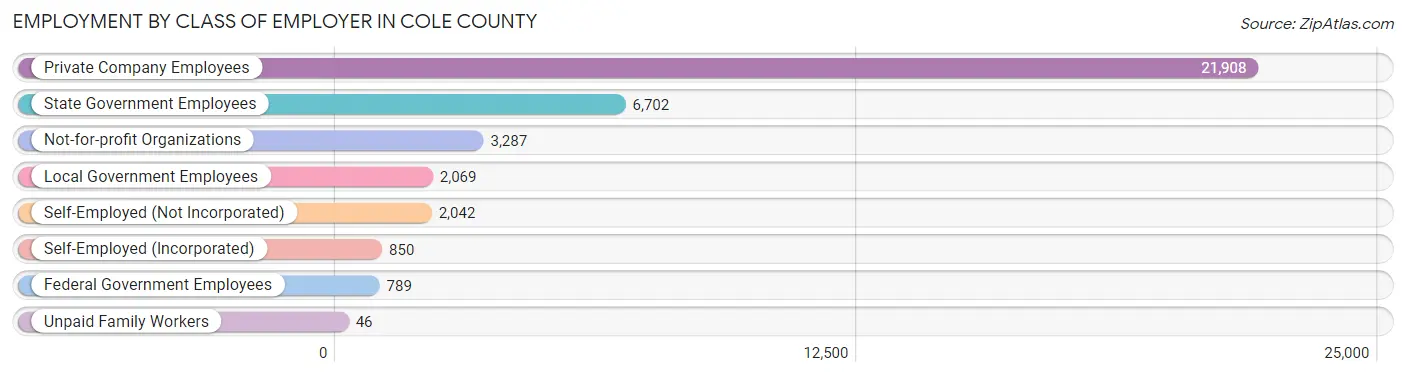
| Employer Class | # Employees | % Employees |
| Private Company Employees | 21,908 | 58.1% |
| Self-Employed (Incorporated) | 850 | 2.3% |
| Self-Employed (Not Incorporated) | 2,042 | 5.4% |
| Not-for-profit Organizations | 3,287 | 8.7% |
| Local Government Employees | 2,069 | 5.5% |
| State Government Employees | 6,702 | 17.8% |
| Federal Government Employees | 789 | 2.1% |
| Unpaid Family Workers | 46 | 0.1% |
| Total | 37,693 | 100.0% |
Employment Status by Age in Cole County
According to the labor force statistics for Cole County, out of the total population over 16 years of age (61,878), 63.2% or 39,107 individuals are in the labor force, with 3.1% or 1,212 of them unemployed. The age group with the highest labor force participation rate is 25 to 29 years, with 87.5% or 4,515 individuals in the labor force. Within the labor force, the 16 to 19 years age range has the highest percentage of unemployed individuals, with 13.3% or 245 of them being unemployed.
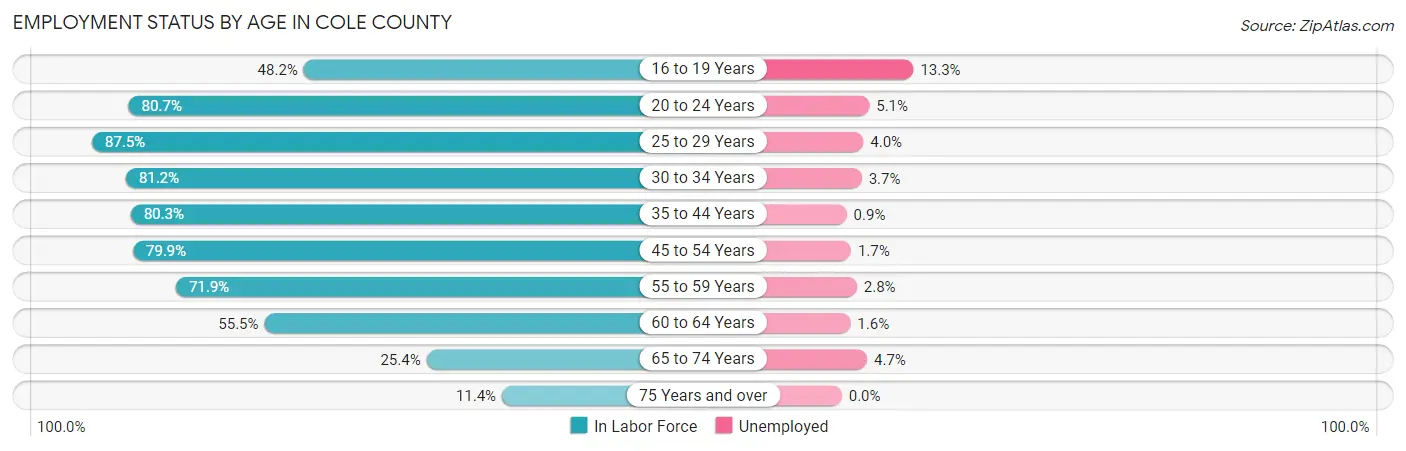
| Age Bracket | In Labor Force | Unemployed |
| 16 to 19 Years | 1,843 (48.2%) | 245 (13.3%) |
| 20 to 24 Years | 3,774 (80.7%) | 192 (5.1%) |
| 25 to 29 Years | 4,515 (87.5%) | 181 (4.0%) |
| 30 to 34 Years | 4,254 (81.2%) | 157 (3.7%) |
| 35 to 44 Years | 8,195 (80.3%) | 74 (0.9%) |
| 45 to 54 Years | 7,499 (79.9%) | 127 (1.7%) |
| 55 to 59 Years | 3,402 (71.9%) | 95 (2.8%) |
| 60 to 64 Years | 2,954 (55.5%) | 47 (1.6%) |
| 65 to 74 Years | 2,029 (25.4%) | 95 (4.7%) |
| 75 Years and over | 609 (11.4%) | 0 (0.0%) |
| Total | 39,107 (63.2%) | 1,212 (3.1%) |
Employment Status by Educational Attainment in Cole County
According to labor force statistics for Cole County, 77.0% of individuals (30,833) out of the total population between 25 and 64 years of age (40,043) are in the labor force, with 2.2% or 678 of them being unemployed. The group with the highest labor force participation rate are those with the educational attainment of bachelor's degree or higher, with 88.4% or 12,831 individuals in the labor force. Within the labor force, individuals with college / associate degree education have the highest percentage of unemployment, with 3.2% or 281 of them being unemployed.
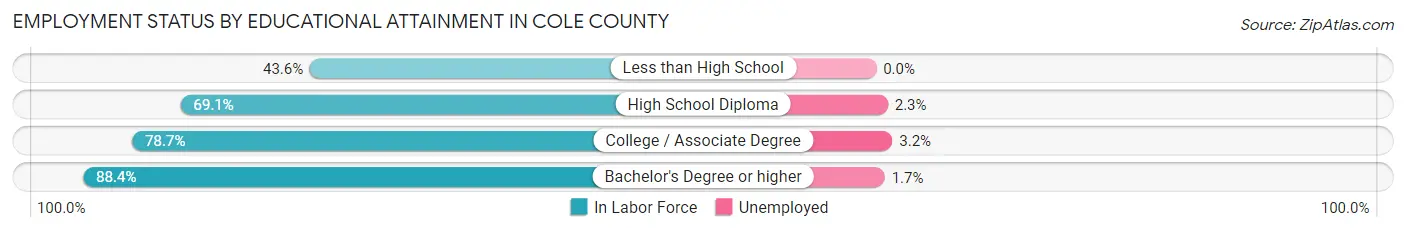
| Educational Attainment | In Labor Force | Unemployed |
| Less than High School | 1,236 (43.6%) | 0 (0.0%) |
| High School Diploma | 7,982 (69.1%) | 266 (2.3%) |
| College / Associate Degree | 8,768 (78.7%) | 357 (3.2%) |
| Bachelor's Degree or higher | 12,831 (88.4%) | 247 (1.7%) |
| Total | 30,833 (77.0%) | 881 (2.2%) |
Employment Occupations by Sex in Cole County
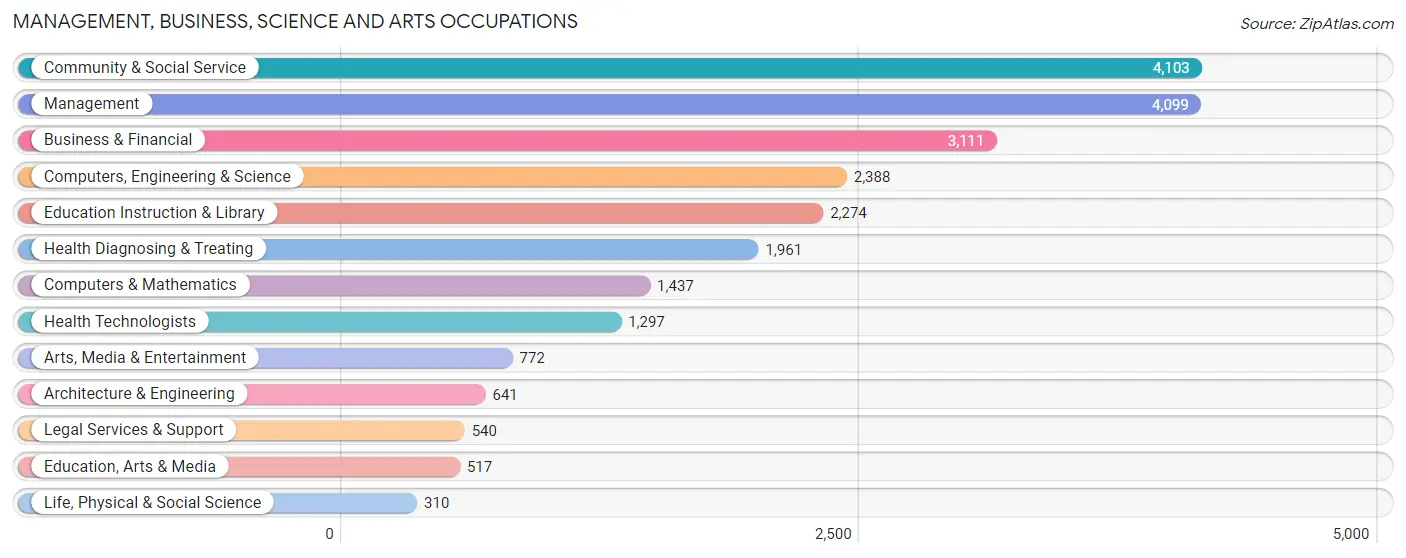
Management, Business, Science and Arts Occupations
The most common Management, Business, Science and Arts occupations in Cole County are Community & Social Service (4,103 | 10.9%), Management (4,099 | 10.9%), Business & Financial (3,111 | 8.3%), Computers, Engineering & Science (2,388 | 6.3%), and Education Instruction & Library (2,274 | 6.0%).
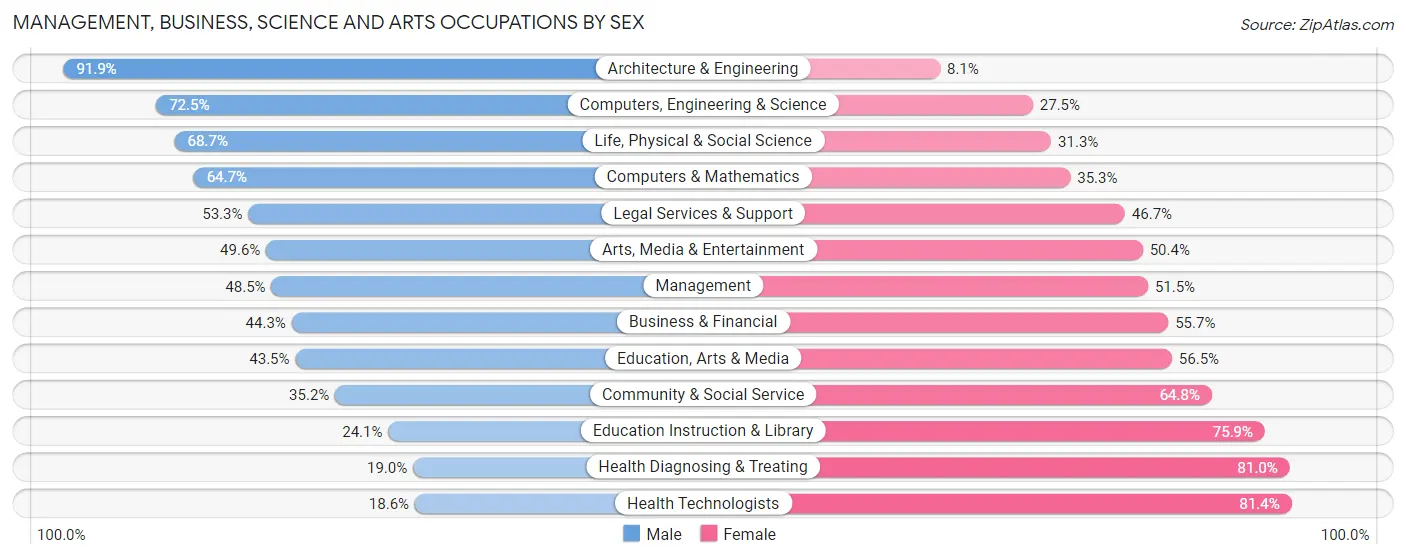
Management, Business, Science and Arts Occupations by Sex
Within the Management, Business, Science and Arts occupations in Cole County, the most male-oriented occupations are Architecture & Engineering (91.9%), Computers, Engineering & Science (72.5%), and Life, Physical & Social Science (68.7%), while the most female-oriented occupations are Health Technologists (81.4%), Health Diagnosing & Treating (81.0%), and Education Instruction & Library (75.9%).
| Occupation | Male | Female |
| Management | 1,989 (48.5%) | 2,110 (51.5%) |
| Business & Financial | 1,378 (44.3%) | 1,733 (55.7%) |
| Computers, Engineering & Science | 1,732 (72.5%) | 656 (27.5%) |
| Computers & Mathematics | 930 (64.7%) | 507 (35.3%) |
| Architecture & Engineering | 589 (91.9%) | 52 (8.1%) |
| Life, Physical & Social Science | 213 (68.7%) | 97 (31.3%) |
| Community & Social Service | 1,445 (35.2%) | 2,658 (64.8%) |
| Education, Arts & Media | 225 (43.5%) | 292 (56.5%) |
| Legal Services & Support | 288 (53.3%) | 252 (46.7%) |
| Education Instruction & Library | 549 (24.1%) | 1,725 (75.9%) |
| Arts, Media & Entertainment | 383 (49.6%) | 389 (50.4%) |
| Health Diagnosing & Treating | 372 (19.0%) | 1,589 (81.0%) |
| Health Technologists | 241 (18.6%) | 1,056 (81.4%) |
| Total (Category) | 6,916 (44.2%) | 8,746 (55.8%) |
| Total (Overall) | 19,156 (50.8%) | 18,567 (49.2%) |
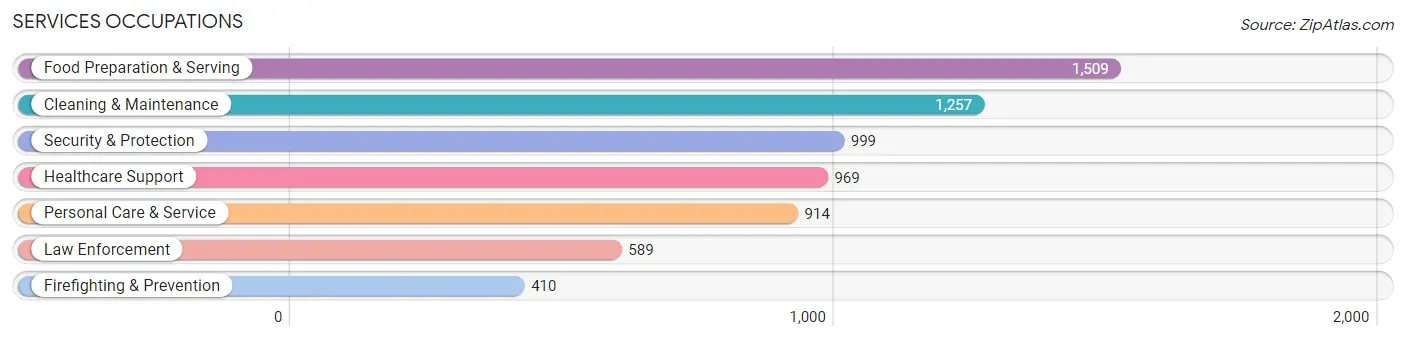
Services Occupations
The most common Services occupations in Cole County are Food Preparation & Serving (1,509 | 4.0%), Cleaning & Maintenance (1,257 | 3.3%), Security & Protection (999 | 2.6%), Healthcare Support (969 | 2.6%), and Personal Care & Service (914 | 2.4%).
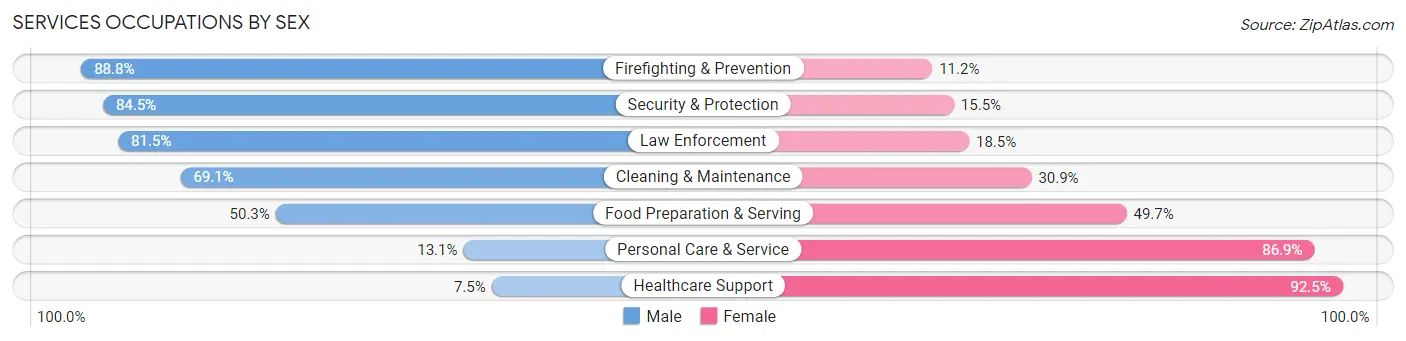
Services Occupations by Sex
Within the Services occupations in Cole County, the most male-oriented occupations are Firefighting & Prevention (88.8%), Security & Protection (84.5%), and Law Enforcement (81.5%), while the most female-oriented occupations are Healthcare Support (92.5%), Personal Care & Service (86.9%), and Food Preparation & Serving (49.7%).
| Occupation | Male | Female |
| Healthcare Support | 73 (7.5%) | 896 (92.5%) |
| Security & Protection | 844 (84.5%) | 155 (15.5%) |
| Firefighting & Prevention | 364 (88.8%) | 46 (11.2%) |
| Law Enforcement | 480 (81.5%) | 109 (18.5%) |
| Food Preparation & Serving | 759 (50.3%) | 750 (49.7%) |
| Cleaning & Maintenance | 869 (69.1%) | 388 (30.9%) |
| Personal Care & Service | 120 (13.1%) | 794 (86.9%) |
| Total (Category) | 2,665 (47.2%) | 2,983 (52.8%) |
| Total (Overall) | 19,156 (50.8%) | 18,567 (49.2%) |
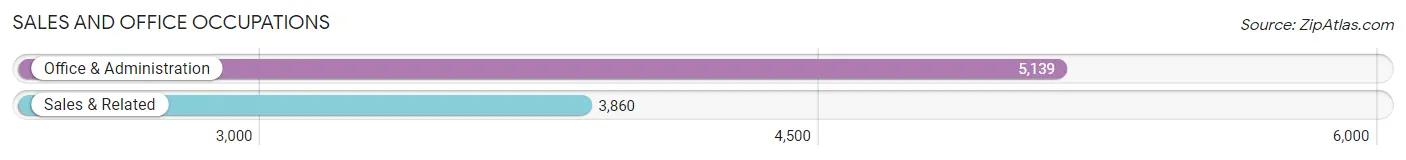
Sales and Office Occupations
The most common Sales and Office occupations in Cole County are Office & Administration (5,139 | 13.6%), and Sales & Related (3,860 | 10.2%).
Sales and Office Occupations by Sex
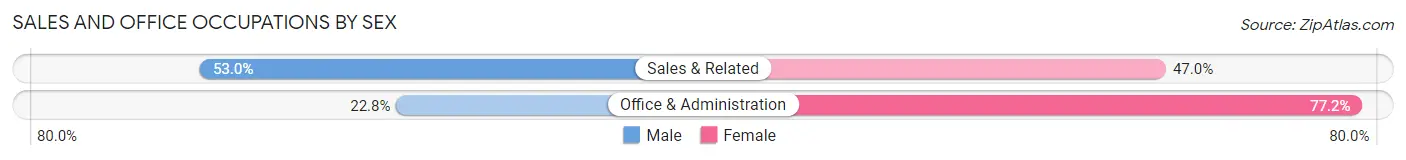
| Occupation | Male | Female |
| Sales & Related | 2,046 (53.0%) | 1,814 (47.0%) |
| Office & Administration | 1,172 (22.8%) | 3,967 (77.2%) |
| Total (Category) | 3,218 (35.8%) | 5,781 (64.2%) |
| Total (Overall) | 19,156 (50.8%) | 18,567 (49.2%) |
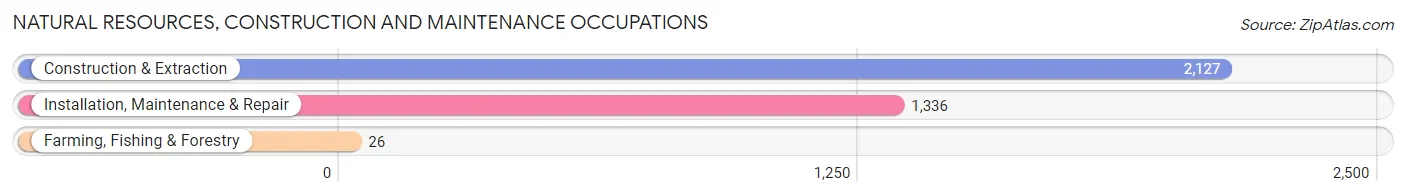
Natural Resources, Construction and Maintenance Occupations
The most common Natural Resources, Construction and Maintenance occupations in Cole County are Construction & Extraction (2,127 | 5.6%), Installation, Maintenance & Repair (1,336 | 3.5%), and Farming, Fishing & Forestry (26 | 0.1%).
Natural Resources, Construction and Maintenance Occupations by Sex
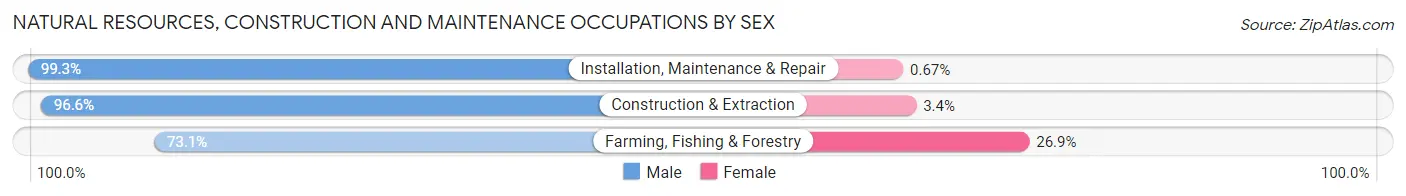
| Occupation | Male | Female |
| Farming, Fishing & Forestry | 19 (73.1%) | 7 (26.9%) |
| Construction & Extraction | 2,055 (96.6%) | 72 (3.4%) |
| Installation, Maintenance & Repair | 1,327 (99.3%) | 9 (0.7%) |
| Total (Category) | 3,401 (97.5%) | 88 (2.5%) |
| Total (Overall) | 19,156 (50.8%) | 18,567 (49.2%) |
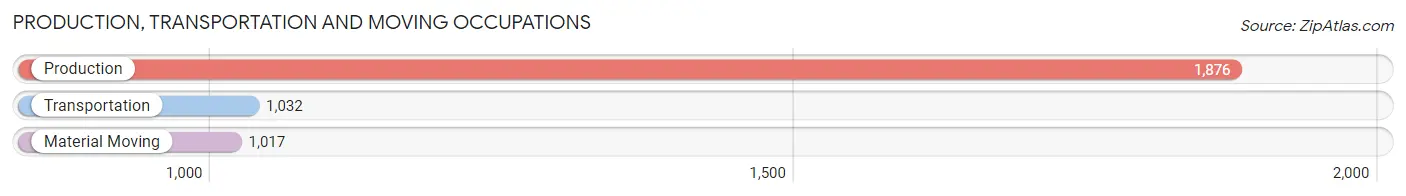
Production, Transportation and Moving Occupations
The most common Production, Transportation and Moving occupations in Cole County are Production (1,876 | 5.0%), Transportation (1,032 | 2.7%), and Material Moving (1,017 | 2.7%).
Production, Transportation and Moving Occupations by Sex
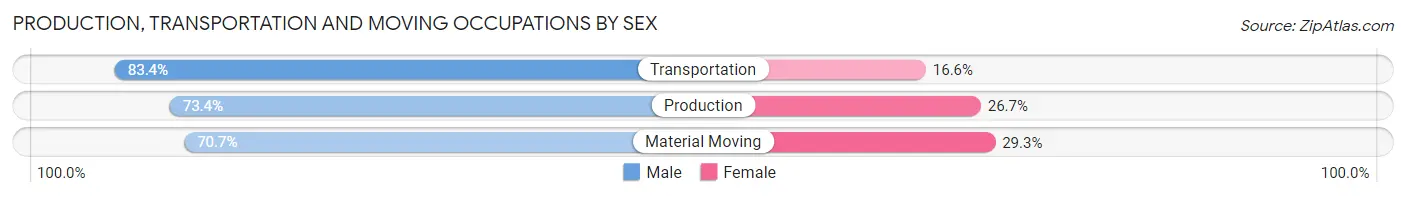
| Occupation | Male | Female |
| Production | 1,376 (73.4%) | 500 (26.7%) |
| Transportation | 861 (83.4%) | 171 (16.6%) |
| Material Moving | 719 (70.7%) | 298 (29.3%) |
| Total (Category) | 2,956 (75.3%) | 969 (24.7%) |
| Total (Overall) | 19,156 (50.8%) | 18,567 (49.2%) |
Employment Industries by Sex in Cole County
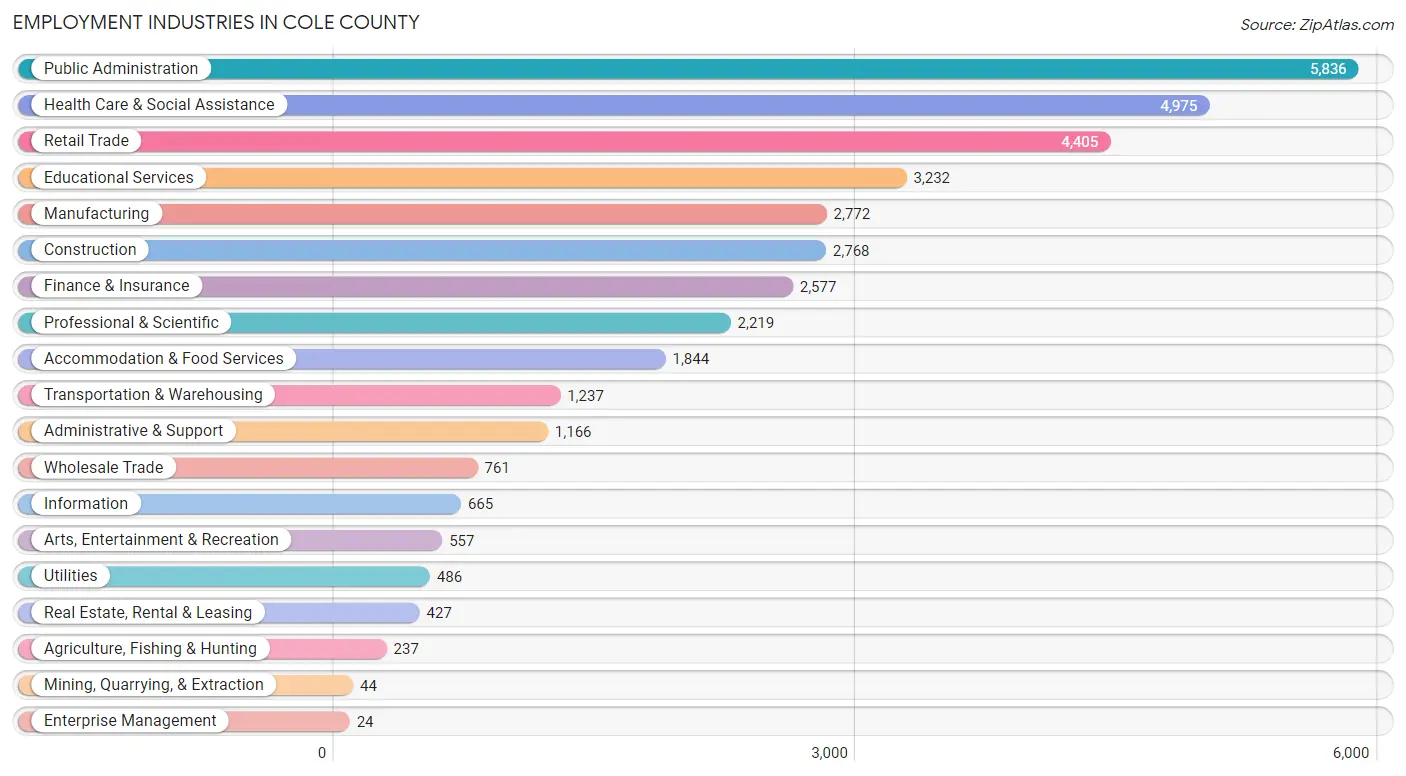
Employment Industries in Cole County
The major employment industries in Cole County include Public Administration (5,836 | 15.5%), Health Care & Social Assistance (4,975 | 13.2%), Retail Trade (4,405 | 11.7%), Educational Services (3,232 | 8.6%), and Manufacturing (2,772 | 7.3%).
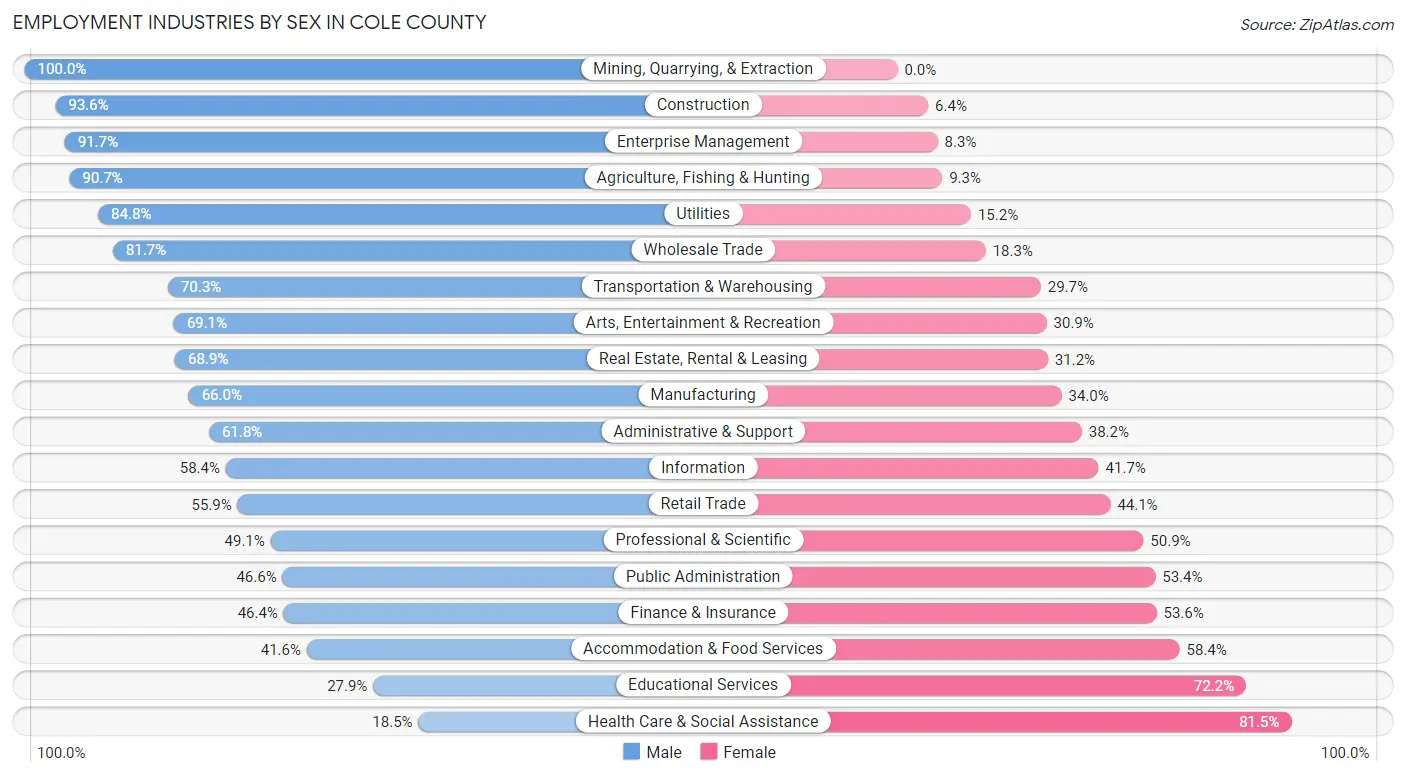
Employment Industries by Sex in Cole County
The Cole County industries that see more men than women are Mining, Quarrying, & Extraction (100.0%), Construction (93.6%), and Enterprise Management (91.7%), whereas the industries that tend to have a higher number of women are Health Care & Social Assistance (81.5%), Educational Services (72.2%), and Accommodation & Food Services (58.4%).
| Industry | Male | Female |
| Agriculture, Fishing & Hunting | 215 (90.7%) | 22 (9.3%) |
| Mining, Quarrying, & Extraction | 44 (100.0%) | 0 (0.0%) |
| Construction | 2,592 (93.6%) | 176 (6.4%) |
| Manufacturing | 1,830 (66.0%) | 942 (34.0%) |
| Wholesale Trade | 622 (81.7%) | 139 (18.3%) |
| Retail Trade | 2,463 (55.9%) | 1,942 (44.1%) |
| Transportation & Warehousing | 870 (70.3%) | 367 (29.7%) |
| Utilities | 412 (84.8%) | 74 (15.2%) |
| Information | 388 (58.4%) | 277 (41.6%) |
| Finance & Insurance | 1,195 (46.4%) | 1,382 (53.6%) |
| Real Estate, Rental & Leasing | 294 (68.9%) | 133 (31.1%) |
| Professional & Scientific | 1,089 (49.1%) | 1,130 (50.9%) |
| Enterprise Management | 22 (91.7%) | 2 (8.3%) |
| Administrative & Support | 721 (61.8%) | 445 (38.2%) |
| Educational Services | 900 (27.9%) | 2,332 (72.2%) |
| Health Care & Social Assistance | 920 (18.5%) | 4,055 (81.5%) |
| Arts, Entertainment & Recreation | 385 (69.1%) | 172 (30.9%) |
| Accommodation & Food Services | 767 (41.6%) | 1,077 (58.4%) |
| Public Administration | 2,721 (46.6%) | 3,115 (53.4%) |
| Total | 19,156 (50.8%) | 18,567 (49.2%) |
Education in Cole County
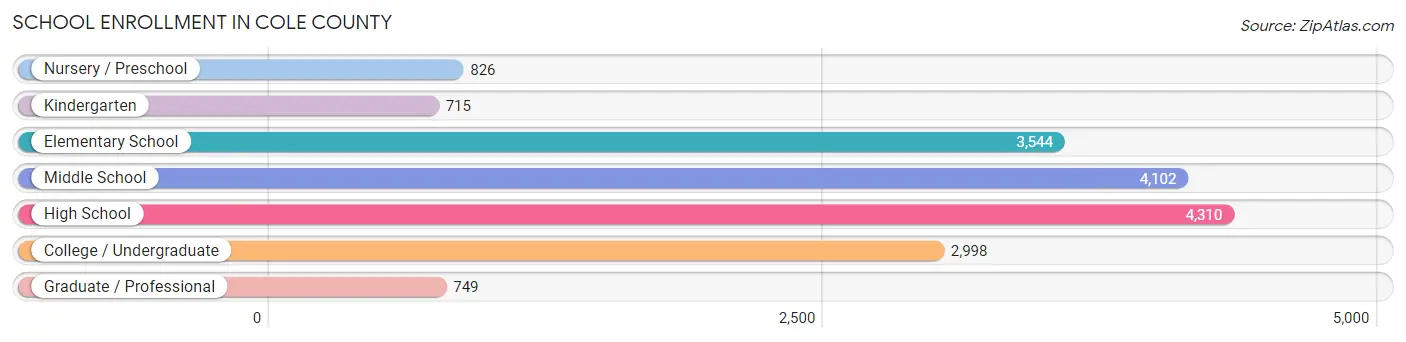
School Enrollment in Cole County
The most common levels of schooling among the 17,244 students in Cole County are high school (4,310 | 25.0%), middle school (4,102 | 23.8%), and elementary school (3,544 | 20.5%).
| School Level | # Students | % Students |
| Nursery / Preschool | 826 | 4.8% |
| Kindergarten | 715 | 4.2% |
| Elementary School | 3,544 | 20.5% |
| Middle School | 4,102 | 23.8% |
| High School | 4,310 | 25.0% |
| College / Undergraduate | 2,998 | 17.4% |
| Graduate / Professional | 749 | 4.3% |
| Total | 17,244 | 100.0% |
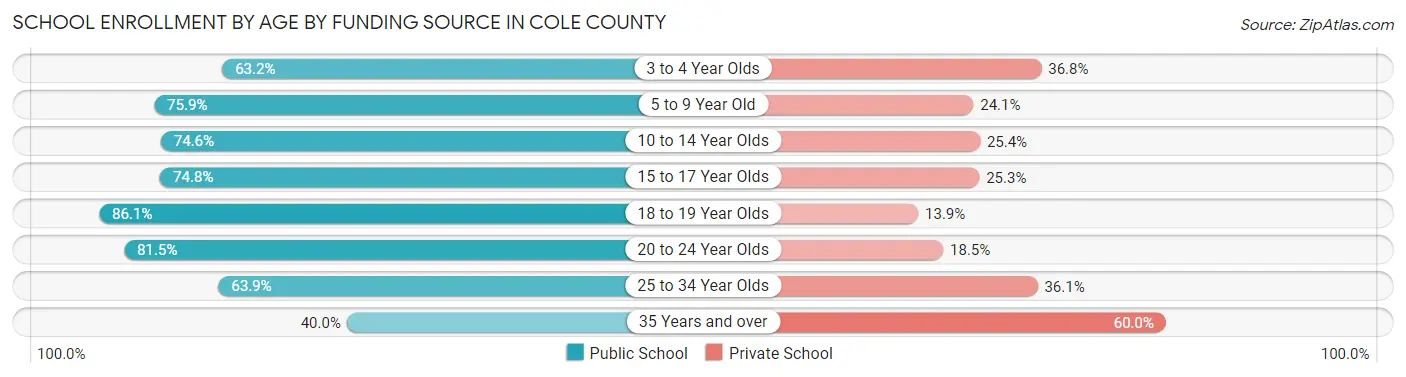
School Enrollment by Age by Funding Source in Cole County
Out of a total of 17,244 students who are enrolled in schools in Cole County, 4,570 (26.5%) attend a private institution, while the remaining 12,674 (73.5%) are enrolled in public schools. The age group of 35 years and over has the highest likelihood of being enrolled in private schools, with 594 (60.0% in the age bracket) enrolled. Conversely, the age group of 18 to 19 year olds has the lowest likelihood of being enrolled in a private school, with 1,074 (86.1% in the age bracket) attending a public institution.
| Age Bracket | Public School | Private School |
| 3 to 4 Year Olds | 388 (63.2%) | 226 (36.8%) |
| 5 to 9 Year Old | 2,967 (75.9%) | 944 (24.1%) |
| 10 to 14 Year Olds | 3,808 (74.6%) | 1,295 (25.4%) |
| 15 to 17 Year Olds | 2,185 (74.8%) | 738 (25.3%) |
| 18 to 19 Year Olds | 1,074 (86.1%) | 173 (13.9%) |
| 20 to 24 Year Olds | 1,333 (81.5%) | 303 (18.5%) |
| 25 to 34 Year Olds | 524 (63.9%) | 296 (36.1%) |
| 35 Years and over | 396 (40.0%) | 594 (60.0%) |
| Total | 12,674 (73.5%) | 4,570 (26.5%) |
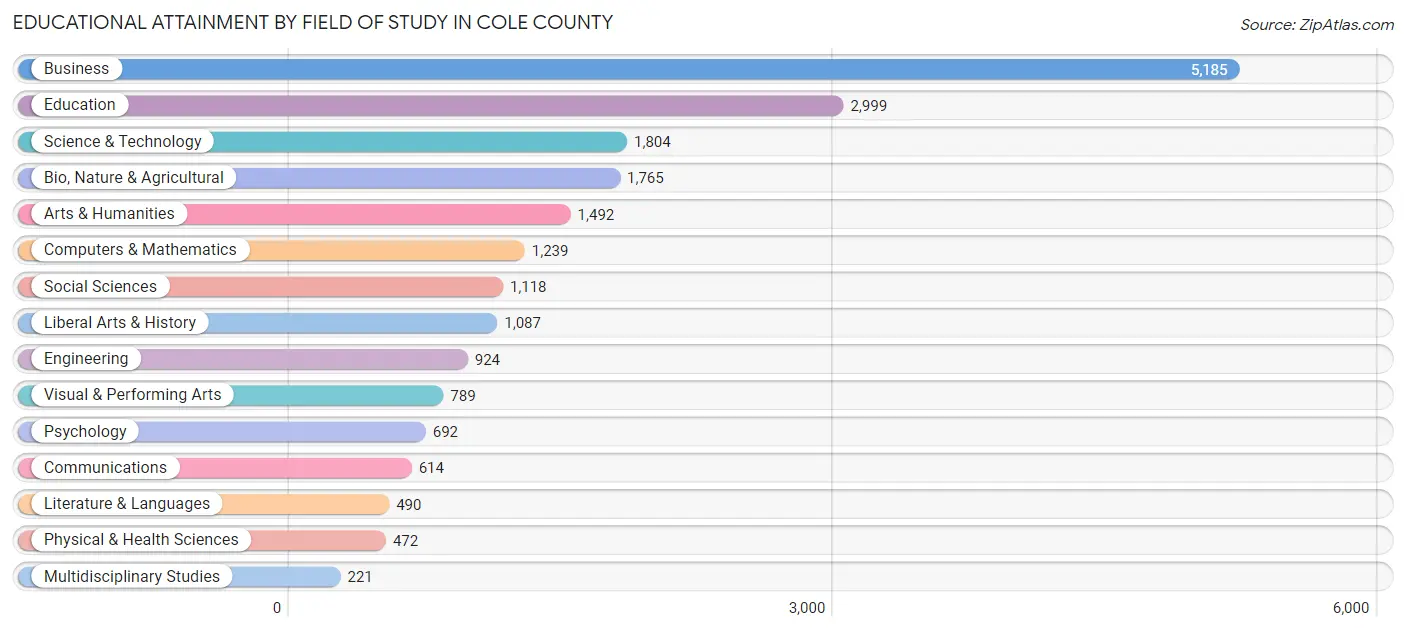
Educational Attainment by Field of Study in Cole County
Business (5,185 | 24.8%), education (2,999 | 14.4%), science & technology (1,804 | 8.6%), bio, nature & agricultural (1,765 | 8.5%), and arts & humanities (1,492 | 7.1%) are the most common fields of study among 20,891 individuals in Cole County who have obtained a bachelor's degree or higher.
| Field of Study | # Graduates | % Graduates |
| Computers & Mathematics | 1,239 | 5.9% |
| Bio, Nature & Agricultural | 1,765 | 8.5% |
| Physical & Health Sciences | 472 | 2.3% |
| Psychology | 692 | 3.3% |
| Social Sciences | 1,118 | 5.3% |
| Engineering | 924 | 4.4% |
| Multidisciplinary Studies | 221 | 1.1% |
| Science & Technology | 1,804 | 8.6% |
| Business | 5,185 | 24.8% |
| Education | 2,999 | 14.4% |
| Literature & Languages | 490 | 2.4% |
| Liberal Arts & History | 1,087 | 5.2% |
| Visual & Performing Arts | 789 | 3.8% |
| Communications | 614 | 2.9% |
| Arts & Humanities | 1,492 | 7.1% |
| Total | 20,891 | 100.0% |
Transportation & Commute in Cole County
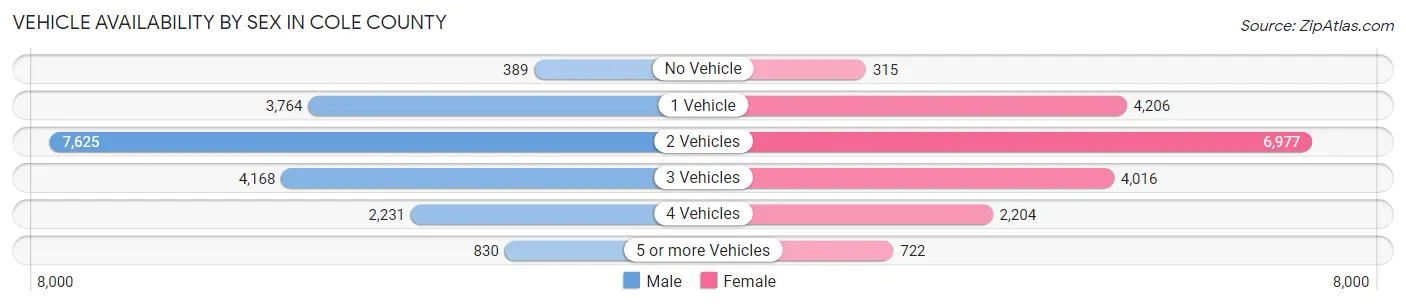
Vehicle Availability by Sex in Cole County
The most prevalent vehicle ownership categories in Cole County are males with 2 vehicles (7,625, accounting for 40.1%) and females with 2 vehicles (6,977, making up 41.3%).
| Vehicles Available | Male | Female |
| No Vehicle | 389 (2.1%) | 315 (1.7%) |
| 1 Vehicle | 3,764 (19.8%) | 4,206 (22.8%) |
| 2 Vehicles | 7,625 (40.1%) | 6,977 (37.8%) |
| 3 Vehicles | 4,168 (21.9%) | 4,016 (21.8%) |
| 4 Vehicles | 2,231 (11.7%) | 2,204 (11.9%) |
| 5 or more Vehicles | 830 (4.4%) | 722 (3.9%) |
| Total | 19,007 (100.0%) | 18,440 (100.0%) |
Commute Time in Cole County
The most frequently occuring commute durations in Cole County are 15 to 19 minutes (8,748 commuters, 24.6%), 10 to 14 minutes (8,201 commuters, 23.1%), and 5 to 9 minutes (5,452 commuters, 15.4%).
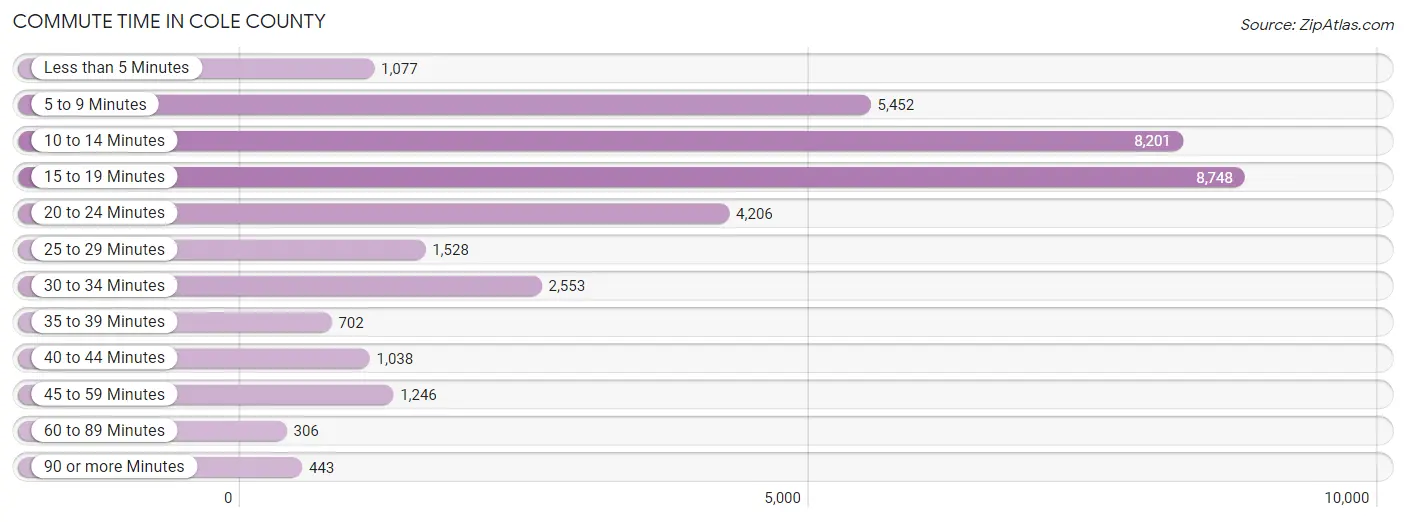
| Commute Time | # Commuters | % Commuters |
| Less than 5 Minutes | 1,077 | 3.0% |
| 5 to 9 Minutes | 5,452 | 15.4% |
| 10 to 14 Minutes | 8,201 | 23.1% |
| 15 to 19 Minutes | 8,748 | 24.6% |
| 20 to 24 Minutes | 4,206 | 11.8% |
| 25 to 29 Minutes | 1,528 | 4.3% |
| 30 to 34 Minutes | 2,553 | 7.2% |
| 35 to 39 Minutes | 702 | 2.0% |
| 40 to 44 Minutes | 1,038 | 2.9% |
| 45 to 59 Minutes | 1,246 | 3.5% |
| 60 to 89 Minutes | 306 | 0.9% |
| 90 or more Minutes | 443 | 1.3% |
Commute Time by Sex in Cole County
The most common commute times in Cole County are 15 to 19 minutes (3,951 commuters, 21.6%) for males and 15 to 19 minutes (4,797 commuters, 27.8%) for females.
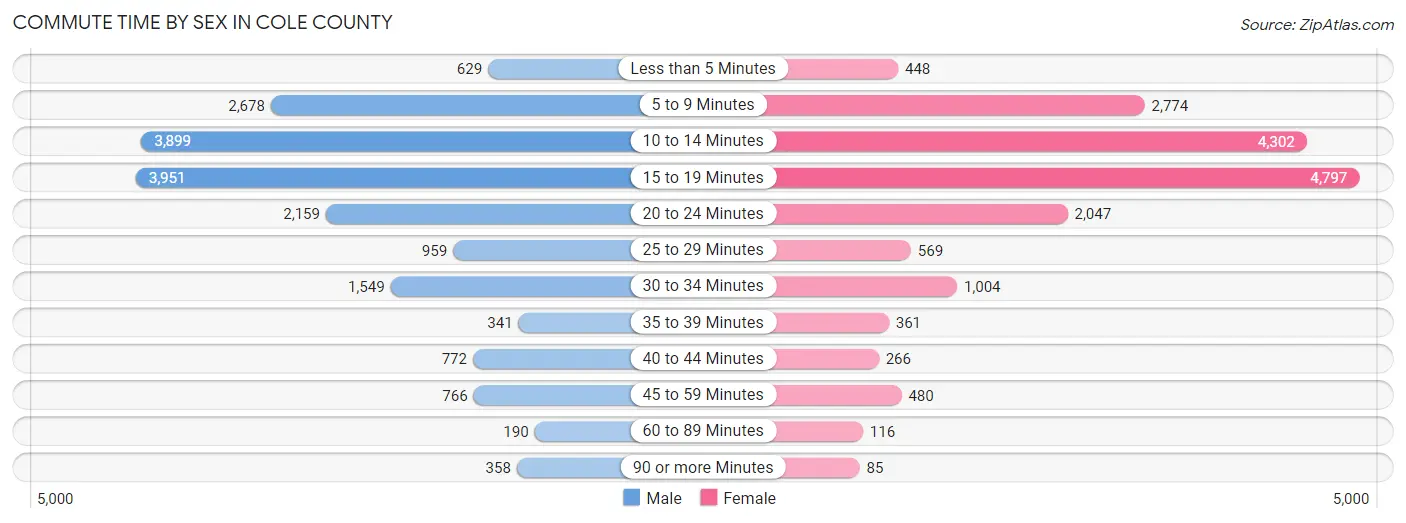
| Commute Time | Male | Female |
| Less than 5 Minutes | 629 (3.5%) | 448 (2.6%) |
| 5 to 9 Minutes | 2,678 (14.7%) | 2,774 (16.1%) |
| 10 to 14 Minutes | 3,899 (21.4%) | 4,302 (24.9%) |
| 15 to 19 Minutes | 3,951 (21.6%) | 4,797 (27.8%) |
| 20 to 24 Minutes | 2,159 (11.8%) | 2,047 (11.9%) |
| 25 to 29 Minutes | 959 (5.2%) | 569 (3.3%) |
| 30 to 34 Minutes | 1,549 (8.5%) | 1,004 (5.8%) |
| 35 to 39 Minutes | 341 (1.9%) | 361 (2.1%) |
| 40 to 44 Minutes | 772 (4.2%) | 266 (1.5%) |
| 45 to 59 Minutes | 766 (4.2%) | 480 (2.8%) |
| 60 to 89 Minutes | 190 (1.0%) | 116 (0.7%) |
| 90 or more Minutes | 358 (2.0%) | 85 (0.5%) |
Time of Departure to Work by Sex in Cole County
The most frequent times of departure to work in Cole County are 7:00 AM to 7:29 AM (3,971, 21.8%) for males and 7:00 AM to 7:29 AM (3,603, 20.9%) for females.
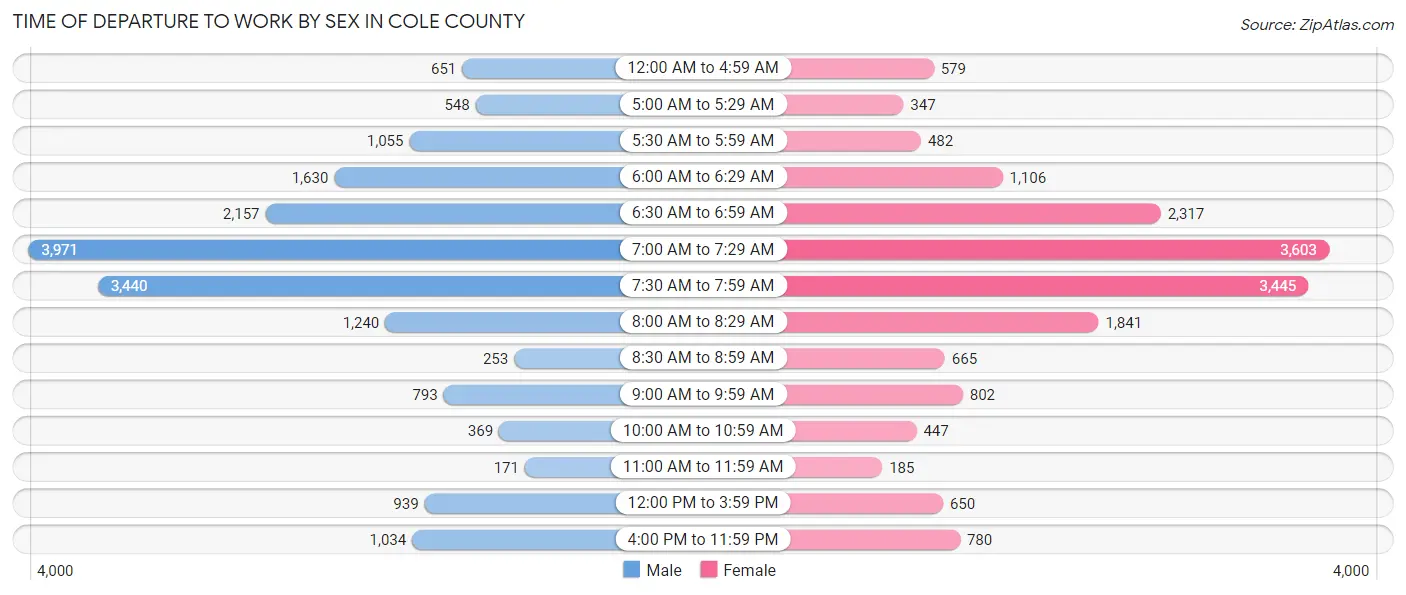
| Time of Departure | Male | Female |
| 12:00 AM to 4:59 AM | 651 (3.6%) | 579 (3.4%) |
| 5:00 AM to 5:29 AM | 548 (3.0%) | 347 (2.0%) |
| 5:30 AM to 5:59 AM | 1,055 (5.8%) | 482 (2.8%) |
| 6:00 AM to 6:29 AM | 1,630 (8.9%) | 1,106 (6.4%) |
| 6:30 AM to 6:59 AM | 2,157 (11.8%) | 2,317 (13.4%) |
| 7:00 AM to 7:29 AM | 3,971 (21.8%) | 3,603 (20.9%) |
| 7:30 AM to 7:59 AM | 3,440 (18.9%) | 3,445 (20.0%) |
| 8:00 AM to 8:29 AM | 1,240 (6.8%) | 1,841 (10.7%) |
| 8:30 AM to 8:59 AM | 253 (1.4%) | 665 (3.9%) |
| 9:00 AM to 9:59 AM | 793 (4.3%) | 802 (4.6%) |
| 10:00 AM to 10:59 AM | 369 (2.0%) | 447 (2.6%) |
| 11:00 AM to 11:59 AM | 171 (0.9%) | 185 (1.1%) |
| 12:00 PM to 3:59 PM | 939 (5.1%) | 650 (3.8%) |
| 4:00 PM to 11:59 PM | 1,034 (5.7%) | 780 (4.5%) |
| Total | 18,251 (100.0%) | 17,249 (100.0%) |
Housing Occupancy in Cole County
Occupancy by Ownership in Cole County
Of the total 30,151 dwellings in Cole County, owner-occupied units account for 20,279 (67.3%), while renter-occupied units make up 9,872 (32.7%).
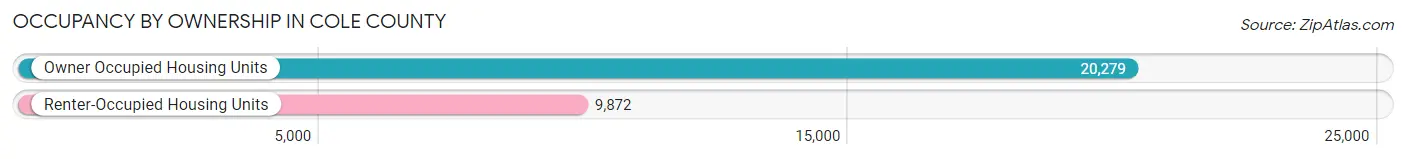
| Occupancy | # Housing Units | % Housing Units |
| Owner Occupied Housing Units | 20,279 | 67.3% |
| Renter-Occupied Housing Units | 9,872 | 32.7% |
| Total Occupied Housing Units | 30,151 | 100.0% |
Occupancy by Household Size in Cole County
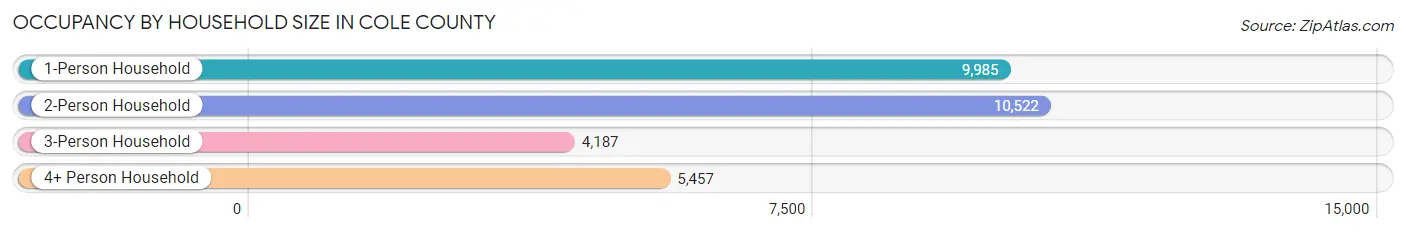
| Household Size | # Housing Units | % Housing Units |
| 1-Person Household | 9,985 | 33.1% |
| 2-Person Household | 10,522 | 34.9% |
| 3-Person Household | 4,187 | 13.9% |
| 4+ Person Household | 5,457 | 18.1% |
| Total Housing Units | 30,151 | 100.0% |
Occupancy by Ownership by Household Size in Cole County
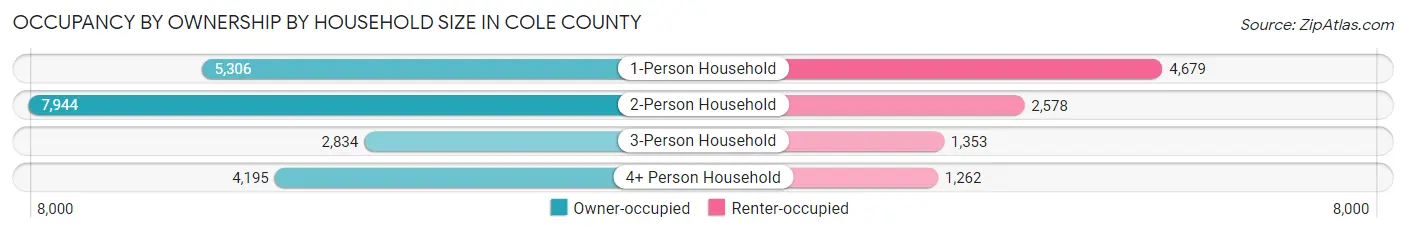
| Household Size | Owner-occupied | Renter-occupied |
| 1-Person Household | 5,306 (53.1%) | 4,679 (46.9%) |
| 2-Person Household | 7,944 (75.5%) | 2,578 (24.5%) |
| 3-Person Household | 2,834 (67.7%) | 1,353 (32.3%) |
| 4+ Person Household | 4,195 (76.9%) | 1,262 (23.1%) |
| Total Housing Units | 20,279 (67.3%) | 9,872 (32.7%) |
Occupancy by Educational Attainment in Cole County
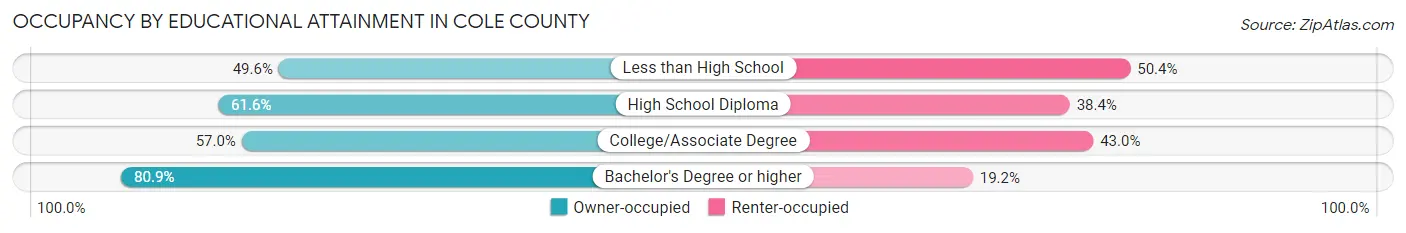
| Household Size | Owner-occupied | Renter-occupied |
| Less than High School | 819 (49.6%) | 832 (50.4%) |
| High School Diploma | 4,801 (61.6%) | 2,989 (38.4%) |
| College/Associate Degree | 4,972 (57.0%) | 3,757 (43.0%) |
| Bachelor's Degree or higher | 9,687 (80.8%) | 2,294 (19.2%) |
Occupancy by Age of Householder in Cole County
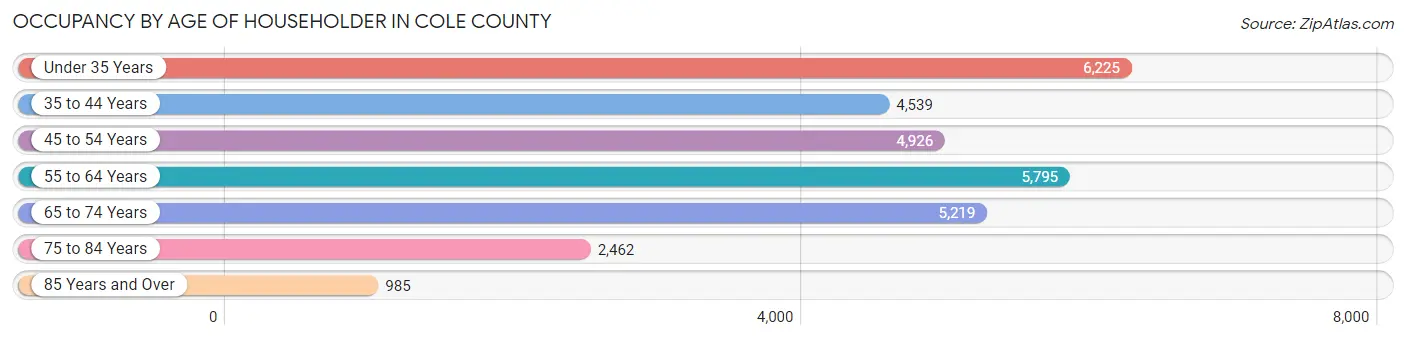
| Age Bracket | # Households | % Households |
| Under 35 Years | 6,225 | 20.6% |
| 35 to 44 Years | 4,539 | 15.0% |
| 45 to 54 Years | 4,926 | 16.3% |
| 55 to 64 Years | 5,795 | 19.2% |
| 65 to 74 Years | 5,219 | 17.3% |
| 75 to 84 Years | 2,462 | 8.2% |
| 85 Years and Over | 985 | 3.3% |
| Total | 30,151 | 100.0% |
Housing Finances in Cole County
Median Income by Occupancy in Cole County
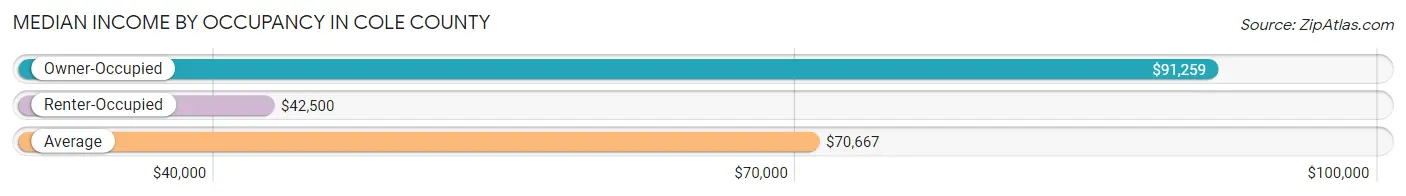
| Occupancy Type | # Households | Median Income |
| Owner-Occupied | 20,279 (67.3%) | $91,259 |
| Renter-Occupied | 9,872 (32.7%) | $42,500 |
| Average | 30,151 (100.0%) | $70,667 |
Occupancy by Householder Income Bracket in Cole County
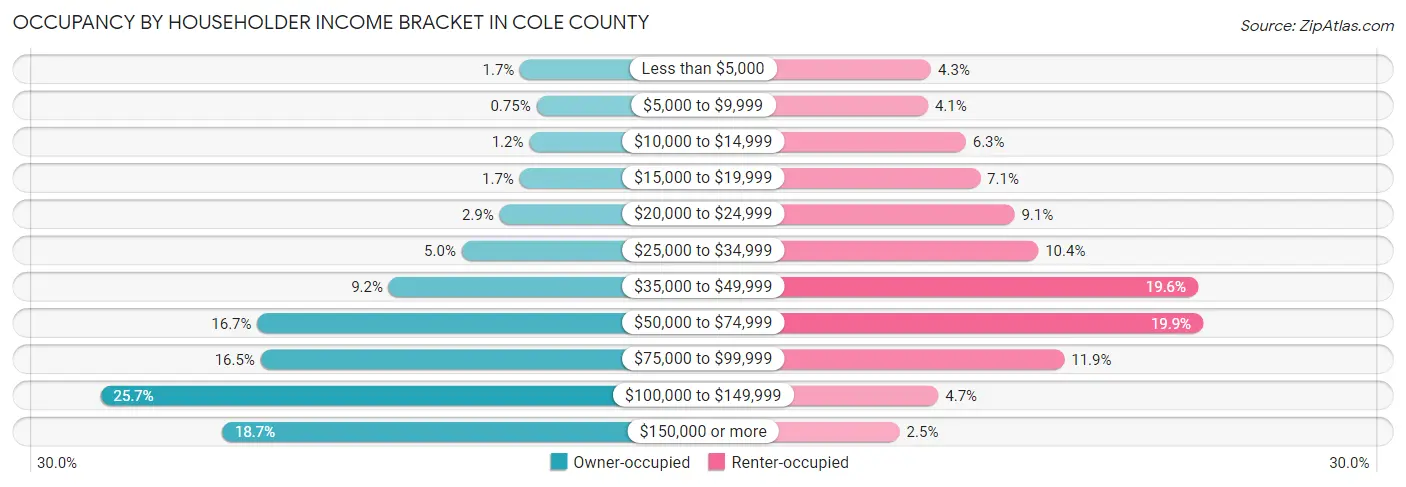
| Income Bracket | Owner-occupied | Renter-occupied |
| Less than $5,000 | 340 (1.7%) | 426 (4.3%) |
| $5,000 to $9,999 | 153 (0.7%) | 409 (4.1%) |
| $10,000 to $14,999 | 236 (1.2%) | 622 (6.3%) |
| $15,000 to $19,999 | 347 (1.7%) | 703 (7.1%) |
| $20,000 to $24,999 | 579 (2.9%) | 896 (9.1%) |
| $25,000 to $34,999 | 1,019 (5.0%) | 1,031 (10.4%) |
| $35,000 to $49,999 | 1,864 (9.2%) | 1,931 (19.6%) |
| $50,000 to $74,999 | 3,387 (16.7%) | 1,960 (19.9%) |
| $75,000 to $99,999 | 3,349 (16.5%) | 1,178 (11.9%) |
| $100,000 to $149,999 | 5,206 (25.7%) | 467 (4.7%) |
| $150,000 or more | 3,799 (18.7%) | 249 (2.5%) |
| Total | 20,279 (100.0%) | 9,872 (100.0%) |
Monthly Housing Cost Tiers in Cole County
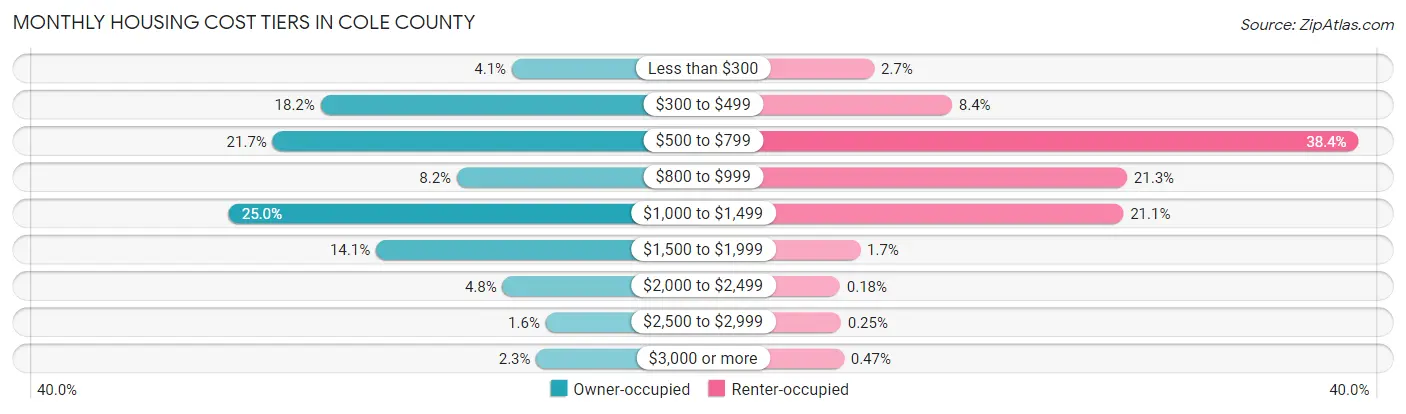
| Monthly Cost | Owner-occupied | Renter-occupied |
| Less than $300 | 834 (4.1%) | 266 (2.7%) |
| $300 to $499 | 3,690 (18.2%) | 832 (8.4%) |
| $500 to $799 | 4,406 (21.7%) | 3,788 (38.4%) |
| $800 to $999 | 1,655 (8.2%) | 2,105 (21.3%) |
| $1,000 to $1,499 | 5,061 (25.0%) | 2,078 (21.0%) |
| $1,500 to $1,999 | 2,864 (14.1%) | 165 (1.7%) |
| $2,000 to $2,499 | 973 (4.8%) | 18 (0.2%) |
| $2,500 to $2,999 | 328 (1.6%) | 25 (0.3%) |
| $3,000 or more | 468 (2.3%) | 46 (0.5%) |
| Total | 20,279 (100.0%) | 9,872 (100.0%) |
Physical Housing Characteristics in Cole County
Housing Structures in Cole County
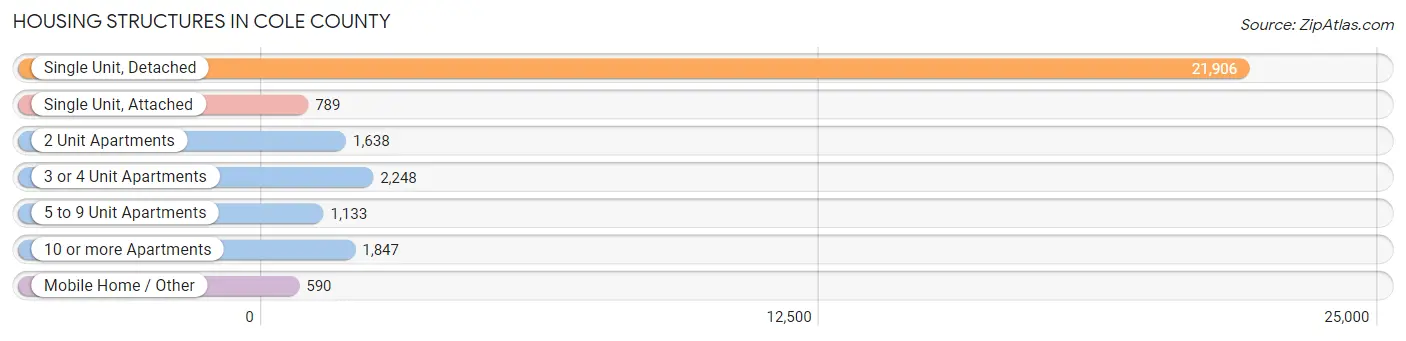
| Structure Type | # Housing Units | % Housing Units |
| Single Unit, Detached | 21,906 | 72.7% |
| Single Unit, Attached | 789 | 2.6% |
| 2 Unit Apartments | 1,638 | 5.4% |
| 3 or 4 Unit Apartments | 2,248 | 7.5% |
| 5 to 9 Unit Apartments | 1,133 | 3.8% |
| 10 or more Apartments | 1,847 | 6.1% |
| Mobile Home / Other | 590 | 2.0% |
| Total | 30,151 | 100.0% |
Housing Structures by Occupancy in Cole County
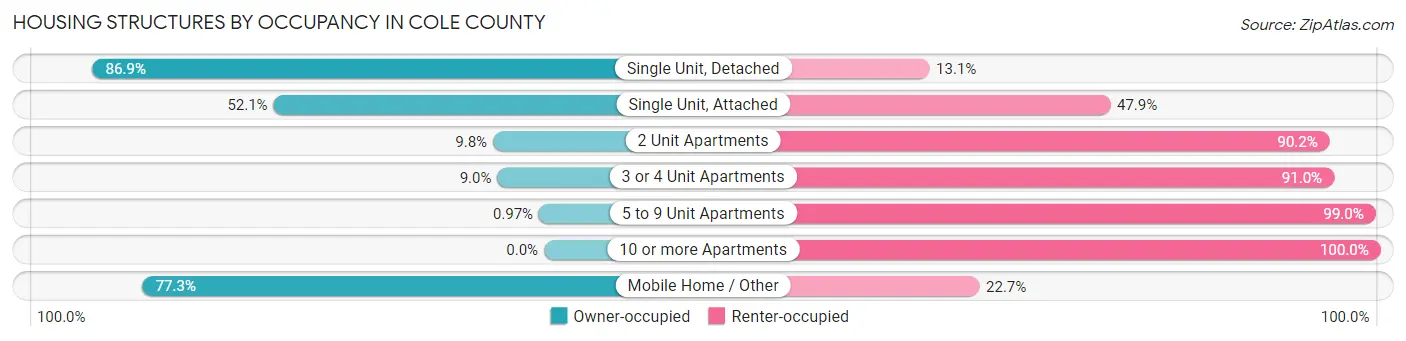
| Structure Type | Owner-occupied | Renter-occupied |
| Single Unit, Detached | 19,038 (86.9%) | 2,868 (13.1%) |
| Single Unit, Attached | 411 (52.1%) | 378 (47.9%) |
| 2 Unit Apartments | 161 (9.8%) | 1,477 (90.2%) |
| 3 or 4 Unit Apartments | 202 (9.0%) | 2,046 (91.0%) |
| 5 to 9 Unit Apartments | 11 (1.0%) | 1,122 (99.0%) |
| 10 or more Apartments | 0 (0.0%) | 1,847 (100.0%) |
| Mobile Home / Other | 456 (77.3%) | 134 (22.7%) |
| Total | 20,279 (67.3%) | 9,872 (32.7%) |
Housing Structures by Number of Rooms in Cole County
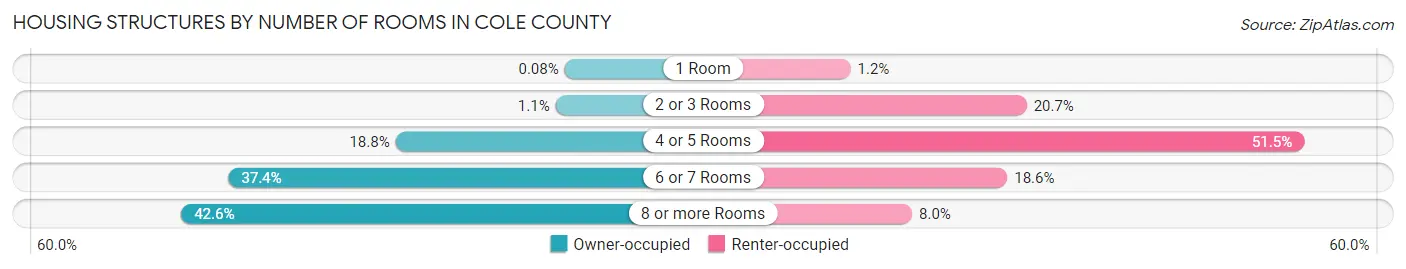
| Number of Rooms | Owner-occupied | Renter-occupied |
| 1 Room | 17 (0.1%) | 117 (1.2%) |
| 2 or 3 Rooms | 220 (1.1%) | 2,046 (20.7%) |
| 4 or 5 Rooms | 3,820 (18.8%) | 5,084 (51.5%) |
| 6 or 7 Rooms | 7,581 (37.4%) | 1,834 (18.6%) |
| 8 or more Rooms | 8,641 (42.6%) | 791 (8.0%) |
| Total | 20,279 (100.0%) | 9,872 (100.0%) |
Housing Structure by Heating Type in Cole County
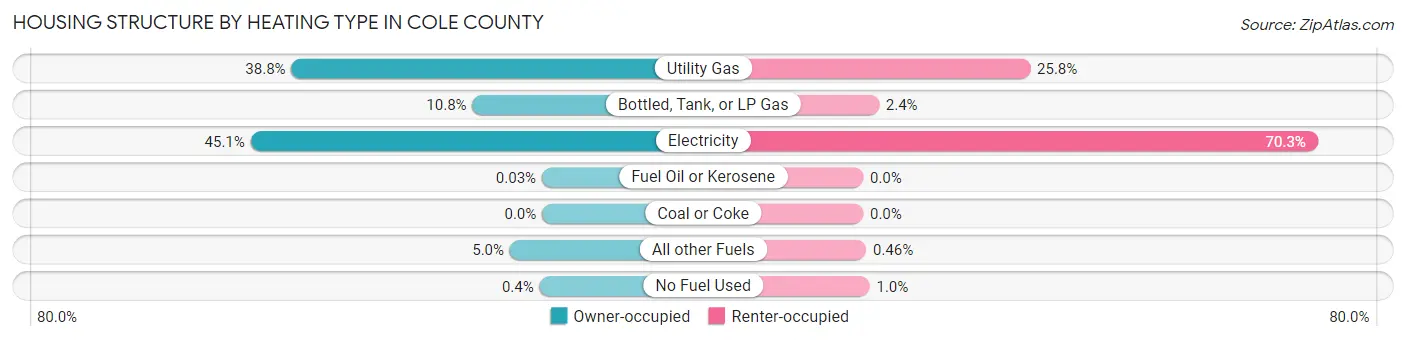
| Heating Type | Owner-occupied | Renter-occupied |
| Utility Gas | 7,859 (38.8%) | 2,550 (25.8%) |
| Bottled, Tank, or LP Gas | 2,185 (10.8%) | 241 (2.4%) |
| Electricity | 9,137 (45.1%) | 6,937 (70.3%) |
| Fuel Oil or Kerosene | 7 (0.0%) | 0 (0.0%) |
| Coal or Coke | 0 (0.0%) | 0 (0.0%) |
| All other Fuels | 1,010 (5.0%) | 45 (0.5%) |
| No Fuel Used | 81 (0.4%) | 99 (1.0%) |
| Total | 20,279 (100.0%) | 9,872 (100.0%) |
Household Vehicle Usage in Cole County
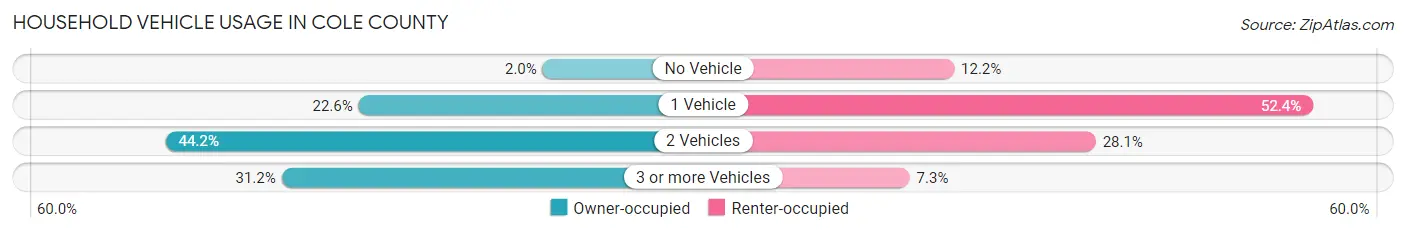
| Vehicles per Household | Owner-occupied | Renter-occupied |
| No Vehicle | 400 (2.0%) | 1,207 (12.2%) |
| 1 Vehicle | 4,582 (22.6%) | 5,176 (52.4%) |
| 2 Vehicles | 8,966 (44.2%) | 2,773 (28.1%) |
| 3 or more Vehicles | 6,331 (31.2%) | 716 (7.2%) |
| Total | 20,279 (100.0%) | 9,872 (100.0%) |
Real Estate & Mortgages in Cole County
Real Estate and Mortgage Overview in Cole County
| Characteristic | Without Mortgage | With Mortgage |
| Housing Units | 8,460 | 11,819 |
| Median Property Value | $203,200 | $196,500 |
| Median Household Income | $75,182 | $2,453 |
| Monthly Housing Costs | $490 | $468 |
| Real Estate Taxes | $1,730 | $246 |
Property Value by Mortgage Status in Cole County
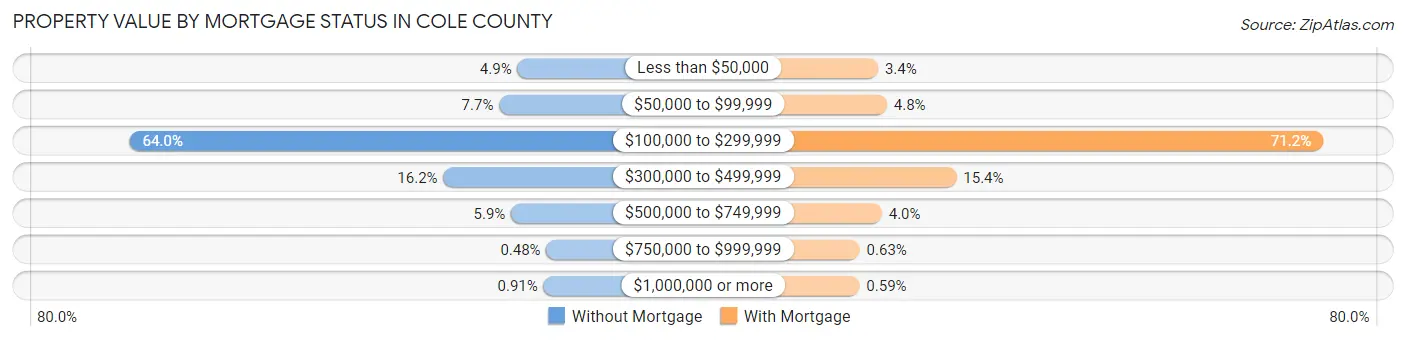
| Property Value | Without Mortgage | With Mortgage |
| Less than $50,000 | 414 (4.9%) | 404 (3.4%) |
| $50,000 to $99,999 | 649 (7.7%) | 564 (4.8%) |
| $100,000 to $299,999 | 5,414 (64.0%) | 8,419 (71.2%) |
| $300,000 to $499,999 | 1,369 (16.2%) | 1,815 (15.4%) |
| $500,000 to $749,999 | 496 (5.9%) | 473 (4.0%) |
| $750,000 to $999,999 | 41 (0.5%) | 74 (0.6%) |
| $1,000,000 or more | 77 (0.9%) | 70 (0.6%) |
| Total | 8,460 (100.0%) | 11,819 (100.0%) |
Household Income by Mortgage Status in Cole County
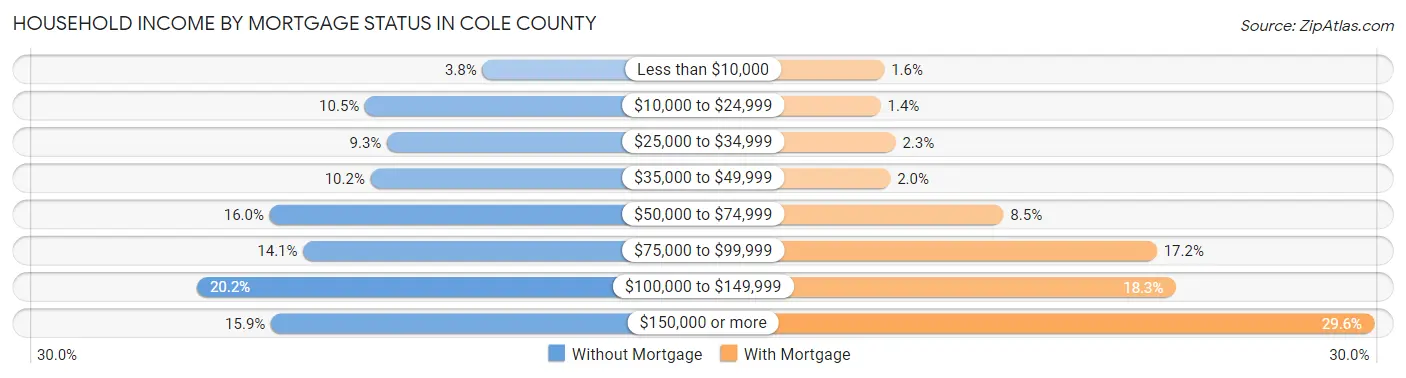
| Household Income | Without Mortgage | With Mortgage |
| Less than $10,000 | 324 (3.8%) | 194 (1.6%) |
| $10,000 to $24,999 | 892 (10.5%) | 169 (1.4%) |
| $25,000 to $34,999 | 785 (9.3%) | 270 (2.3%) |
| $35,000 to $49,999 | 865 (10.2%) | 234 (2.0%) |
| $50,000 to $74,999 | 1,353 (16.0%) | 999 (8.5%) |
| $75,000 to $99,999 | 1,190 (14.1%) | 2,034 (17.2%) |
| $100,000 to $149,999 | 1,705 (20.2%) | 2,159 (18.3%) |
| $150,000 or more | 1,346 (15.9%) | 3,501 (29.6%) |
| Total | 8,460 (100.0%) | 11,819 (100.0%) |
Property Value to Household Income Ratio in Cole County
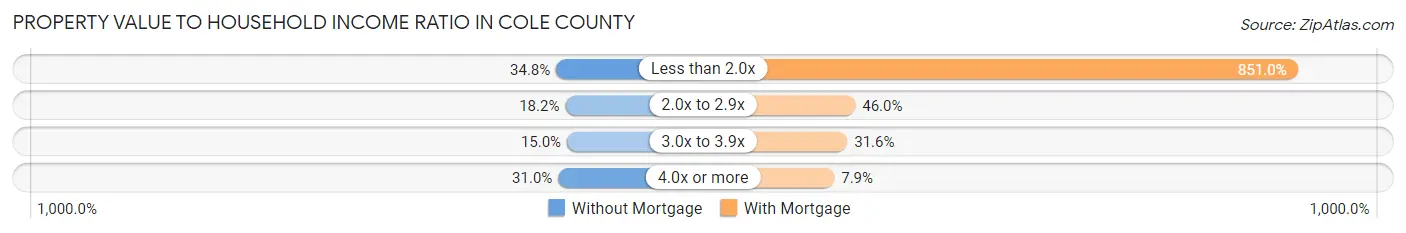
| Value-to-Income Ratio | Without Mortgage | With Mortgage |
| Less than 2.0x | 2,941 (34.8%) | 100,579 (851.0%) |
| 2.0x to 2.9x | 1,537 (18.2%) | 5,439 (46.0%) |
| 3.0x to 3.9x | 1,271 (15.0%) | 3,737 (31.6%) |
| 4.0x or more | 2,625 (31.0%) | 936 (7.9%) |
| Total | 8,460 (100.0%) | 11,819 (100.0%) |
Real Estate Taxes by Mortgage Status in Cole County
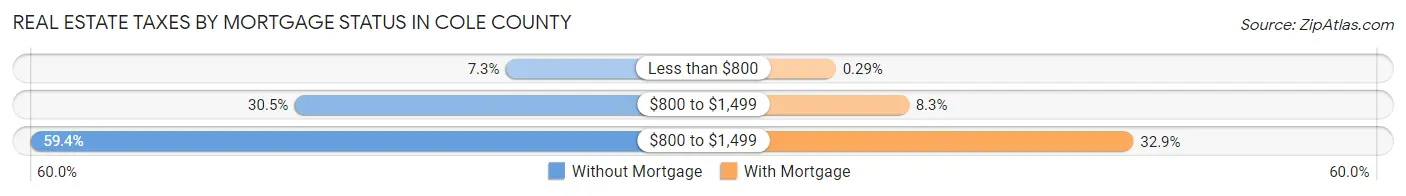
| Property Taxes | Without Mortgage | With Mortgage |
| Less than $800 | 619 (7.3%) | 34 (0.3%) |
| $800 to $1,499 | 2,577 (30.5%) | 980 (8.3%) |
| $800 to $1,499 | 5,023 (59.4%) | 3,890 (32.9%) |
| Total | 8,460 (100.0%) | 11,819 (100.0%) |
Health & Disability in Cole County
Health Insurance Coverage by Age in Cole County
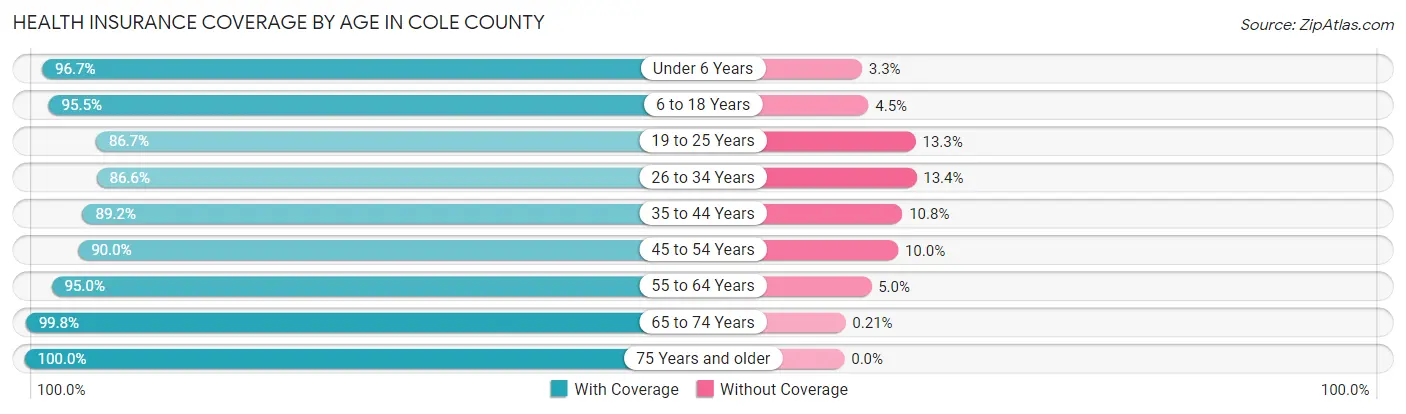
| Age Bracket | With Coverage | Without Coverage |
| Under 6 Years | 4,983 (96.7%) | 169 (3.3%) |
| 6 to 18 Years | 12,225 (95.5%) | 575 (4.5%) |
| 19 to 25 Years | 5,294 (86.7%) | 811 (13.3%) |
| 26 to 34 Years | 7,626 (86.6%) | 1,182 (13.4%) |
| 35 to 44 Years | 8,057 (89.2%) | 977 (10.8%) |
| 45 to 54 Years | 7,948 (90.0%) | 884 (10.0%) |
| 55 to 64 Years | 9,087 (95.0%) | 480 (5.0%) |
| 65 to 74 Years | 7,678 (99.8%) | 16 (0.2%) |
| 75 Years and older | 5,138 (100.0%) | 0 (0.0%) |
| Total | 68,036 (93.0%) | 5,094 (7.0%) |
Health Insurance Coverage by Citizenship Status in Cole County
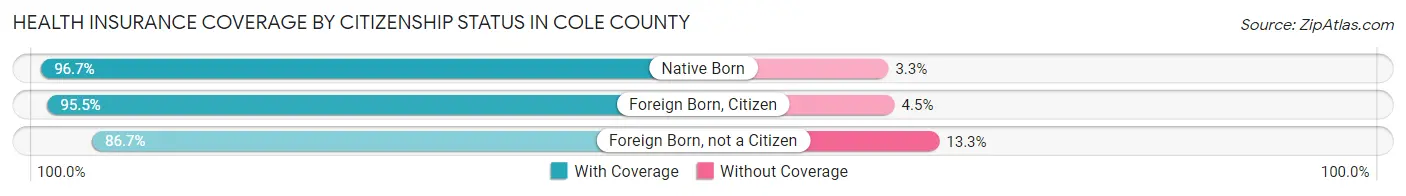
| Citizenship Status | With Coverage | Without Coverage |
| Native Born | 4,983 (96.7%) | 169 (3.3%) |
| Foreign Born, Citizen | 12,225 (95.5%) | 575 (4.5%) |
| Foreign Born, not a Citizen | 5,294 (86.7%) | 811 (13.3%) |
Health Insurance Coverage by Household Income in Cole County
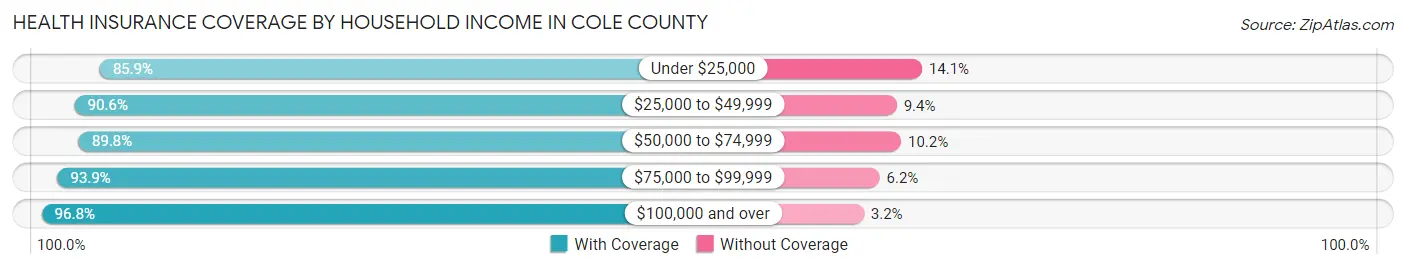
| Household Income | With Coverage | Without Coverage |
| Under $25,000 | 5,857 (85.9%) | 960 (14.1%) |
| $25,000 to $49,999 | 9,127 (90.6%) | 943 (9.4%) |
| $50,000 to $74,999 | 10,982 (89.8%) | 1,243 (10.2%) |
| $75,000 to $99,999 | 11,587 (93.9%) | 759 (6.1%) |
| $100,000 and over | 29,724 (96.8%) | 982 (3.2%) |
Public vs Private Health Insurance Coverage by Age in Cole County
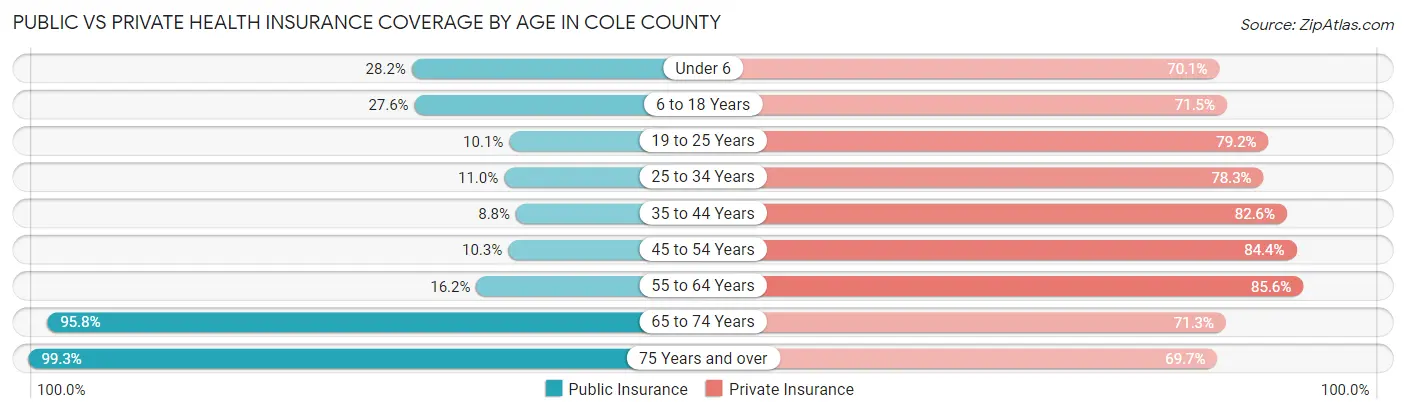
| Age Bracket | Public Insurance | Private Insurance |
| Under 6 | 1,451 (28.2%) | 3,610 (70.1%) |
| 6 to 18 Years | 3,538 (27.6%) | 9,148 (71.5%) |
| 19 to 25 Years | 614 (10.1%) | 4,834 (79.2%) |
| 25 to 34 Years | 970 (11.0%) | 6,893 (78.3%) |
| 35 to 44 Years | 796 (8.8%) | 7,462 (82.6%) |
| 45 to 54 Years | 906 (10.3%) | 7,451 (84.4%) |
| 55 to 64 Years | 1,546 (16.2%) | 8,191 (85.6%) |
| 65 to 74 Years | 7,370 (95.8%) | 5,484 (71.3%) |
| 75 Years and over | 5,101 (99.3%) | 3,581 (69.7%) |
| Total | 22,292 (30.5%) | 56,654 (77.5%) |
Disability Status by Sex by Age in Cole County
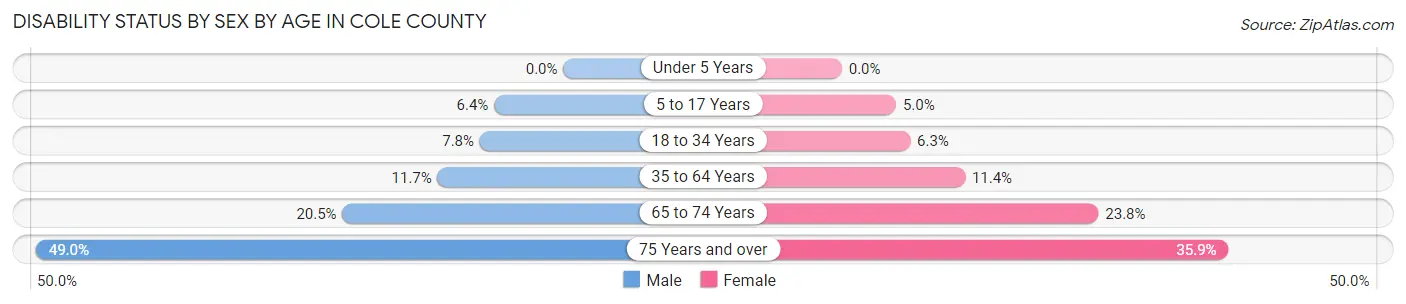
| Age Bracket | Male | Female |
| Under 5 Years | 0 (0.0%) | 0 (0.0%) |
| 5 to 17 Years | 412 (6.4%) | 314 (5.0%) |
| 18 to 34 Years | 619 (7.7%) | 499 (6.3%) |
| 35 to 64 Years | 1,564 (11.7%) | 1,603 (11.4%) |
| 65 to 74 Years | 736 (20.5%) | 977 (23.8%) |
| 75 Years and over | 1,016 (49.0%) | 1,099 (35.9%) |
Disability Class by Sex by Age in Cole County
Disability Class: Hearing Difficulty
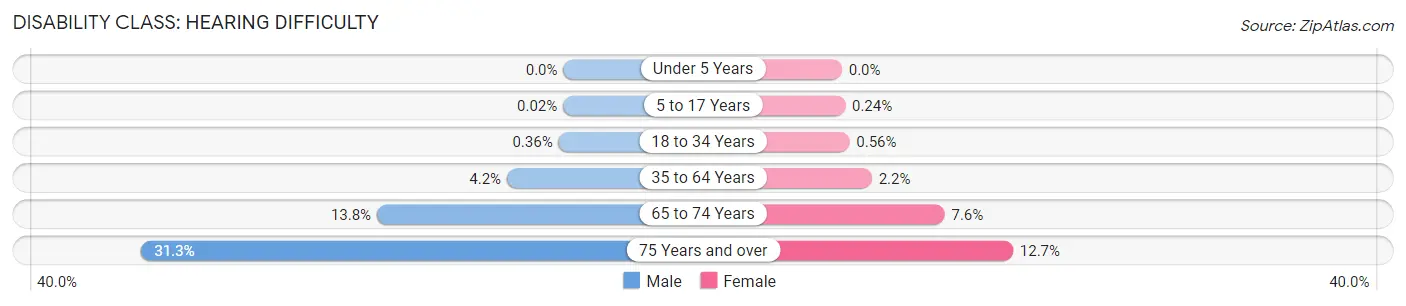
| Age Bracket | Male | Female |
| Under 5 Years | 0 (0.0%) | 0 (0.0%) |
| 5 to 17 Years | 1 (0.0%) | 15 (0.2%) |
| 18 to 34 Years | 29 (0.4%) | 44 (0.6%) |
| 35 to 64 Years | 562 (4.2%) | 311 (2.2%) |
| 65 to 74 Years | 497 (13.8%) | 313 (7.6%) |
| 75 Years and over | 650 (31.3%) | 389 (12.7%) |
Disability Class: Vision Difficulty
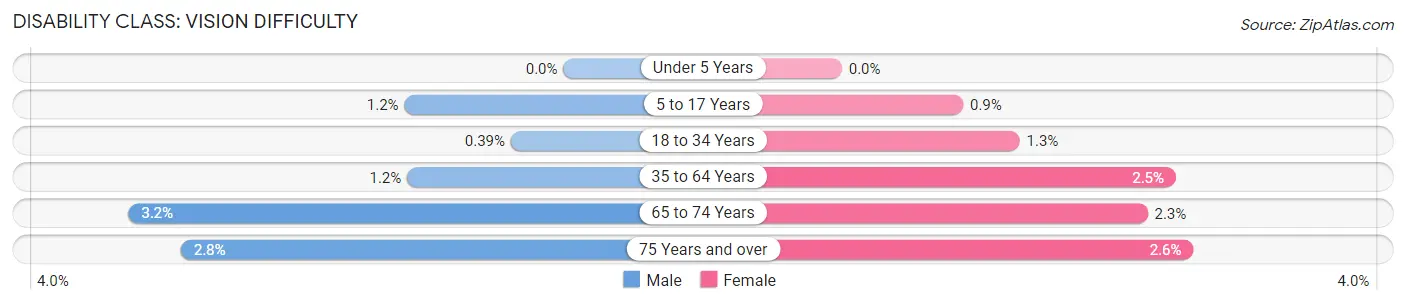
| Age Bracket | Male | Female |
| Under 5 Years | 0 (0.0%) | 0 (0.0%) |
| 5 to 17 Years | 76 (1.2%) | 56 (0.9%) |
| 18 to 34 Years | 31 (0.4%) | 104 (1.3%) |
| 35 to 64 Years | 155 (1.2%) | 348 (2.5%) |
| 65 to 74 Years | 116 (3.2%) | 93 (2.3%) |
| 75 Years and over | 59 (2.8%) | 80 (2.6%) |
Disability Class: Cognitive Difficulty
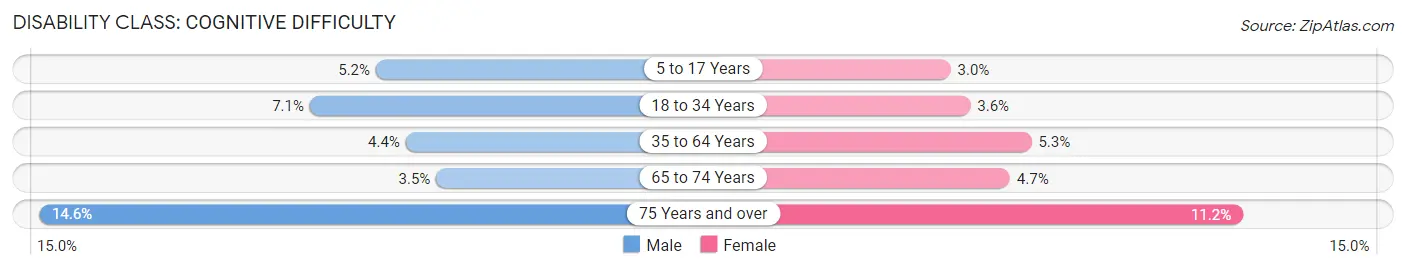
| Age Bracket | Male | Female |
| 5 to 17 Years | 335 (5.2%) | 189 (3.0%) |
| 18 to 34 Years | 564 (7.1%) | 282 (3.6%) |
| 35 to 64 Years | 589 (4.4%) | 741 (5.3%) |
| 65 to 74 Years | 127 (3.5%) | 192 (4.7%) |
| 75 Years and over | 303 (14.6%) | 342 (11.2%) |
Disability Class: Ambulatory Difficulty
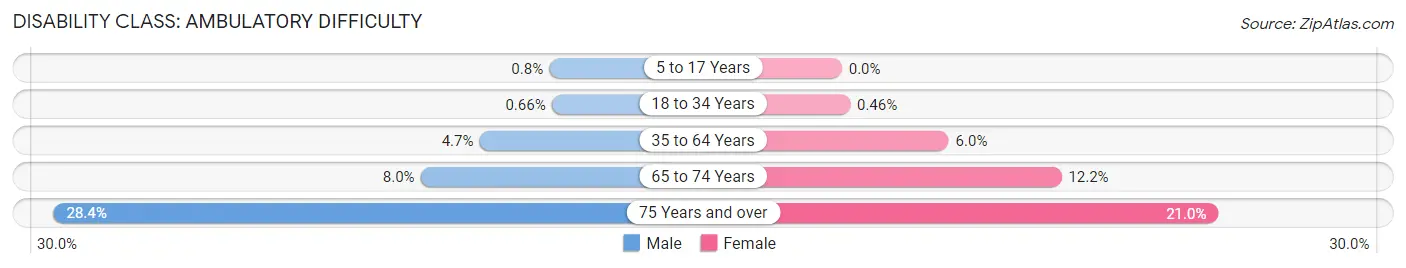
| Age Bracket | Male | Female |
| 5 to 17 Years | 51 (0.8%) | 0 (0.0%) |
| 18 to 34 Years | 53 (0.7%) | 36 (0.5%) |
| 35 to 64 Years | 627 (4.7%) | 835 (5.9%) |
| 65 to 74 Years | 286 (8.0%) | 502 (12.2%) |
| 75 Years and over | 589 (28.4%) | 642 (21.0%) |
Disability Class: Self-Care Difficulty
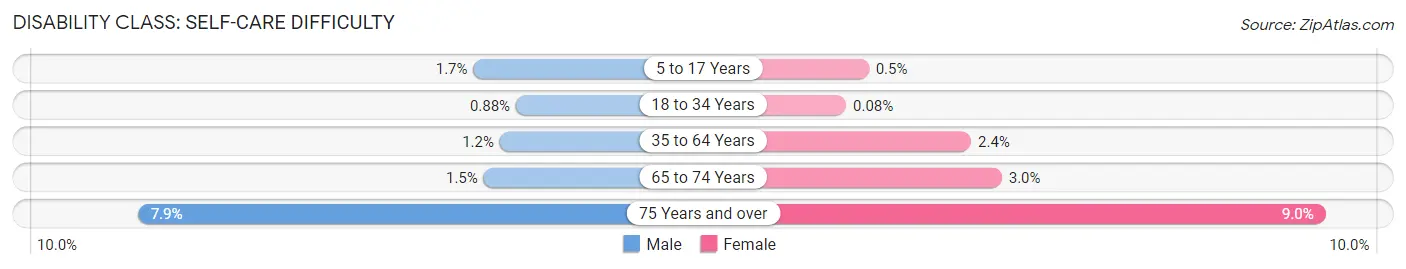
| Age Bracket | Male | Female |
| 5 to 17 Years | 107 (1.7%) | 31 (0.5%) |
| 18 to 34 Years | 70 (0.9%) | 6 (0.1%) |
| 35 to 64 Years | 158 (1.2%) | 337 (2.4%) |
| 65 to 74 Years | 53 (1.5%) | 122 (3.0%) |
| 75 Years and over | 164 (7.9%) | 275 (9.0%) |
Technology Access in Cole County
Computing Device Access in Cole County
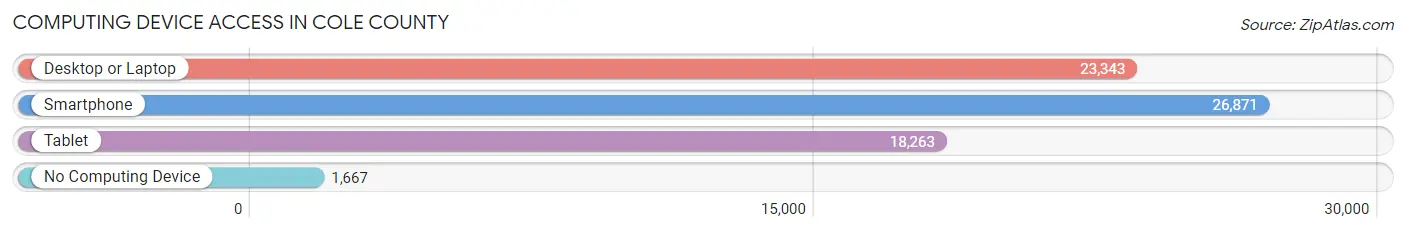
| Device Type | # Households | % Households |
| Desktop or Laptop | 23,343 | 77.4% |
| Smartphone | 26,871 | 89.1% |
| Tablet | 18,263 | 60.6% |
| No Computing Device | 1,667 | 5.5% |
| Total | 30,151 | 100.0% |
Internet Access in Cole County
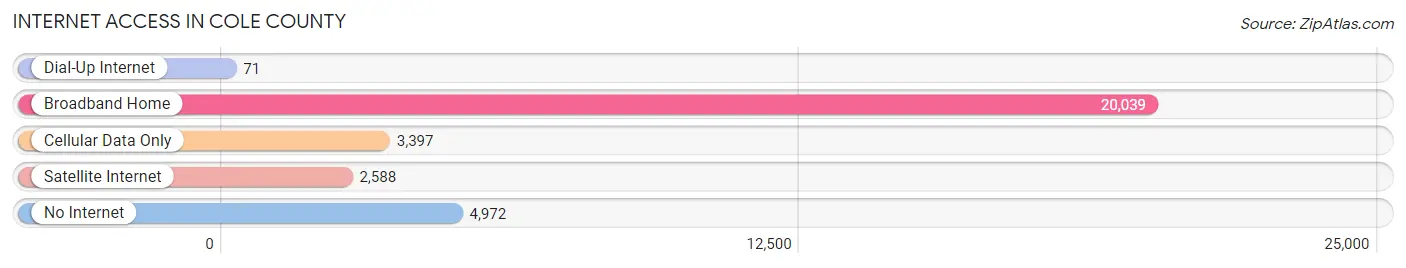
| Internet Type | # Households | % Households |
| Dial-Up Internet | 71 | 0.2% |
| Broadband Home | 20,039 | 66.5% |
| Cellular Data Only | 3,397 | 11.3% |
| Satellite Internet | 2,588 | 8.6% |
| No Internet | 4,972 | 16.5% |
| Total | 30,151 | 100.0% |
Cole County Summary
Cole County is located in the central part of the state of Missouri, and is part of the Jefferson City, MO Metropolitan Statistical Area. The county was established in 1820 and named after Captain Stephen Cole, a pioneer settler in the area. As of the 2010 census, the population of Cole County was 75,990, making it the fourth most populous county in the state.
Geography
Cole County is located in the central part of Missouri, and is bordered by Callaway County to the north, Osage County to the east, Miller County to the south, and Moniteau County to the west. The county covers an area of 576 square miles, of which 574 square miles is land and 2 square miles is water. The county is located in the Ozark Plateau region of the state, and is characterized by rolling hills and valleys. The highest point in the county is located at the intersection of Highway 54 and Highway 179, at an elevation of 1,039 feet. The county is drained by the Osage River, which flows through the center of the county.
Economy
The economy of Cole County is largely based on agriculture, manufacturing, and services. The county is home to several large agricultural operations, including cattle, poultry, and dairy farms. The county is also home to several manufacturing companies, including a large paper mill and a large food processing plant. The county is also home to several service-based businesses, including healthcare, retail, and hospitality.
Demographics
As of the 2010 census, the population of Cole County was 75,990, making it the fourth most populous county in the state. The population was spread out, with 24.3% under the age of 18, 8.7% from 18 to 24, 28.2% from 25 to 44, 24.2% from 45 to 64, and 14.6% who were 65 years of age or older. The median age was 37.4 years. The gender makeup of the county was 49.2% male and 50.8% female.
The racial makeup of the county was 92.2% White, 4.2% African American, 0.3% Native American, 0.7% Asian, 0.1% Pacific Islander, 1.2% from other races, and 1.3% from two or more races. Hispanic or Latino of any race were 2.7% of the population.
The median income for a household in the county was $45,945, and the median income for a family was $54,945. The per capita income for the county was $22,945. About 8.7% of families and 11.2% of the population were below the poverty line, including 15.2% of those under age 18 and 8.2% of those age 65 or over.
Conclusion
Cole County is located in the central part of Missouri, and is part of the Jefferson City, MO Metropolitan Statistical Area. The county was established in 1820 and named after Captain Stephen Cole, a pioneer settler in the area. As of the 2010 census, the population of Cole County was 75,990, making it the fourth most populous county in the state. The economy of Cole County is largely based on agriculture, manufacturing, and services. The racial makeup of the county was 92.2% White, 4.2% African American, 0.3% Native American, 0.7% Asian, 0.1% Pacific Islander, 1.2% from other races, and 1.3% from two or more races. The median income for a household in the county was $45,945, and the median income for a family was $54,945. Cole County is a diverse and vibrant county with a strong economy and a rich history.
Common Questions
What is Per Capita Income in Cole County?
Per Capita income in Cole County is $35,519.
What is the Median Family Income in Cole County?
Median Family Income in Cole County is $91,811.
What is the Median Household income in Cole County?
Median Household Income in Cole County is $70,667.
What is Income or Wage Gap in Cole County?
Income or Wage Gap in Cole County is 20.7%.
Women in Cole County earn 79.3 cents for every dollar earned by a man.
What is Family Income Deficit in Cole County?
Family Income Deficit in Cole County is $9,651.
Families that are below poverty line in Cole County earn $9,651 less on average than the poverty threshold level.
What is Inequality or Gini Index in Cole County?
Inequality or Gini Index in Cole County is 0.42.
What is the Total Population of Cole County?
Total Population of Cole County is 76,890.
What is the Total Male Population of Cole County?
Total Male Population of Cole County is 38,954.
What is the Total Female Population of Cole County?
Total Female Population of Cole County is 37,936.
What is the Ratio of Males per 100 Females in Cole County?
There are 102.68 Males per 100 Females in Cole County.
What is the Ratio of Females per 100 Males in Cole County?
There are 97.39 Females per 100 Males in Cole County.
What is the Median Population Age in Cole County?
Median Population Age in Cole County is 39.6 Years.
What is the Average Family Size in Cole County
Average Family Size in Cole County is 3.1 People.
What is the Average Household Size in Cole County
Average Household Size in Cole County is 2.4 People.
How Large is the Labor Force in Cole County?
There are 39,107 People in the Labor Forcein in Cole County.
What is the Percentage of People in the Labor Force in Cole County?
63.2% of People are in the Labor Force in Cole County.
What is the Unemployment Rate in Cole County?
Unemployment Rate in Cole County is 3.1%.