Carter County, MO Map & Demographics
Carter County Map
Carter County Overview
$27,150
PER CAPITA INCOME
$77,281
AVG FAMILY INCOME
$45,737
AVG HOUSEHOLD INCOME
36.0%
WAGE / INCOME GAP [ % ]
64.0¢/ $1
WAGE / INCOME GAP [ $ ]
$8,492
FAMILY INCOME DEFICIT
0.45
INEQUALITY / GINI INDEX
5,299
TOTAL POPULATION
2,591
MALE POPULATION
2,708
FEMALE POPULATION
95.68
MALES / 100 FEMALES
104.52
FEMALES / 100 MALES
42.0
MEDIAN AGE
3.5
AVG FAMILY SIZE
2.7
AVG HOUSEHOLD SIZE
2,357
LABOR FORCE [ PEOPLE ]
54.5%
PERCENT IN LABOR FORCE
1.2%
UNEMPLOYMENT RATE
Carter County Area Codes
Income in Carter County
Income Overview in Carter County
Per Capita Income in Carter County is $27,150, while median incomes of families and households are $77,281 and $45,737 respectively.
| Characteristic | Number | Measure |
| Per Capita Income | 5,299 | $27,150 |
| Median Family Income | 1,212 | $77,281 |
| Mean Family Income | 1,212 | $85,126 |
| Median Household Income | 1,925 | $45,737 |
| Mean Household Income | 1,925 | $67,440 |
| Income Deficit | 1,212 | $8,492 |
| Wage / Income Gap (%) | 5,299 | 36.04% |
| Wage / Income Gap ($) | 5,299 | 63.96¢ per $1 |
| Gini / Inequality Index | 5,299 | 0.45 |
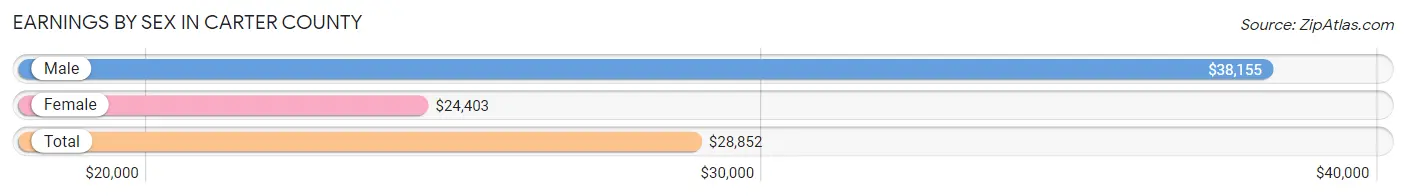
Earnings by Sex in Carter County
Average Earnings in Carter County are $28,852, $38,155 for men and $24,403 for women, a difference of 36.0%.
| Sex | Number | Average Earnings |
| Male | 1,436 (55.3%) | $38,155 |
| Female | 1,162 (44.7%) | $24,403 |
| Total | 2,598 (100.0%) | $28,852 |
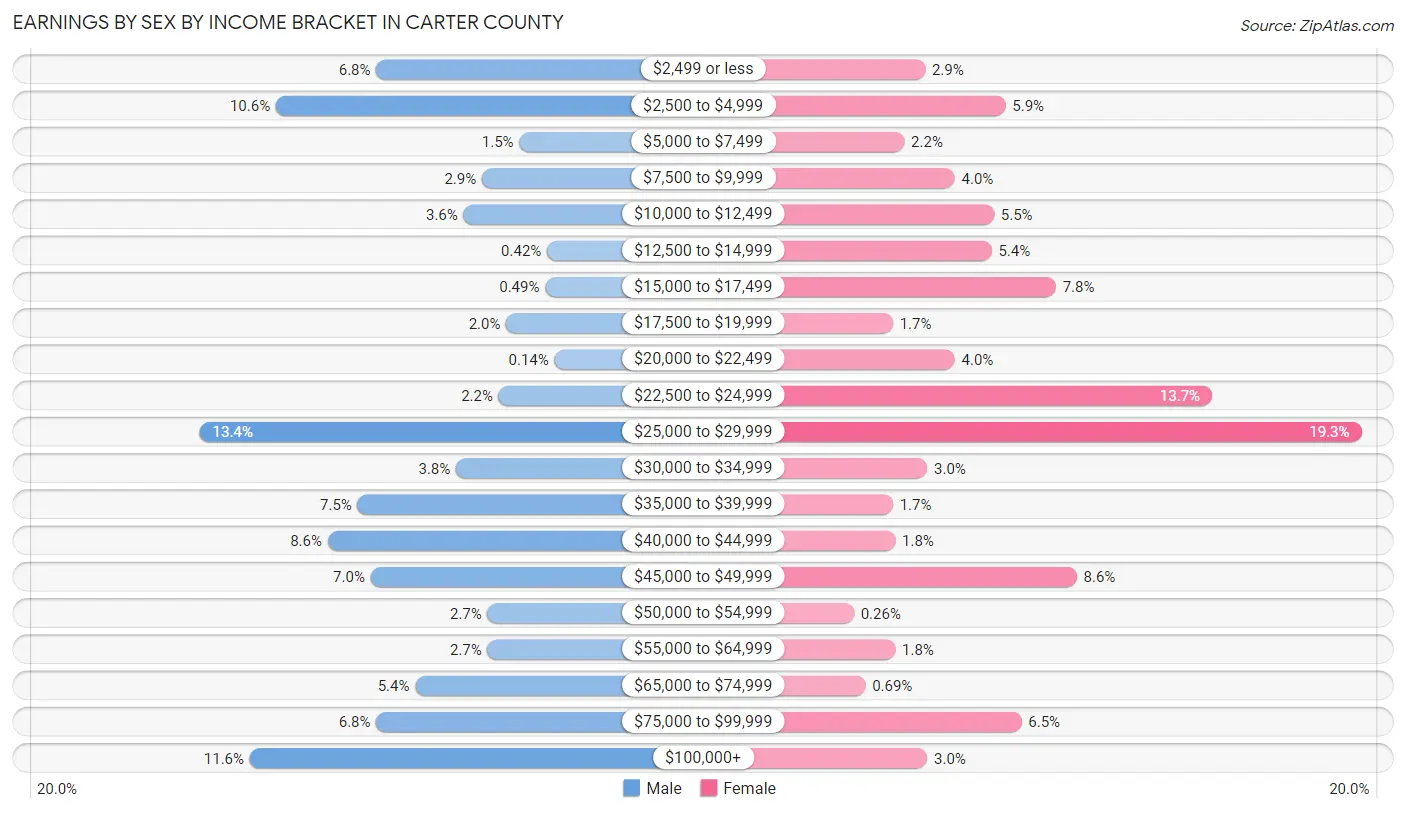
Earnings by Sex by Income Bracket in Carter County
The most common earnings brackets in Carter County are $25,000 to $29,999 for men (193 | 13.4%) and $25,000 to $29,999 for women (224 | 19.3%).
| Income | Male | Female |
| $2,499 or less | 98 (6.8%) | 34 (2.9%) |
| $2,500 to $4,999 | 152 (10.6%) | 69 (5.9%) |
| $5,000 to $7,499 | 21 (1.5%) | 25 (2.1%) |
| $7,500 to $9,999 | 41 (2.9%) | 47 (4.0%) |
| $10,000 to $12,499 | 51 (3.5%) | 64 (5.5%) |
| $12,500 to $14,999 | 6 (0.4%) | 63 (5.4%) |
| $15,000 to $17,499 | 7 (0.5%) | 91 (7.8%) |
| $17,500 to $19,999 | 28 (1.9%) | 20 (1.7%) |
| $20,000 to $22,499 | 2 (0.1%) | 47 (4.0%) |
| $22,500 to $24,999 | 32 (2.2%) | 159 (13.7%) |
| $25,000 to $29,999 | 193 (13.4%) | 224 (19.3%) |
| $30,000 to $34,999 | 55 (3.8%) | 35 (3.0%) |
| $35,000 to $39,999 | 108 (7.5%) | 20 (1.7%) |
| $40,000 to $44,999 | 124 (8.6%) | 21 (1.8%) |
| $45,000 to $49,999 | 101 (7.0%) | 100 (8.6%) |
| $50,000 to $54,999 | 38 (2.6%) | 3 (0.3%) |
| $55,000 to $64,999 | 38 (2.6%) | 21 (1.8%) |
| $65,000 to $74,999 | 77 (5.4%) | 8 (0.7%) |
| $75,000 to $99,999 | 98 (6.8%) | 76 (6.5%) |
| $100,000+ | 166 (11.6%) | 35 (3.0%) |
| Total | 1,436 (100.0%) | 1,162 (100.0%) |
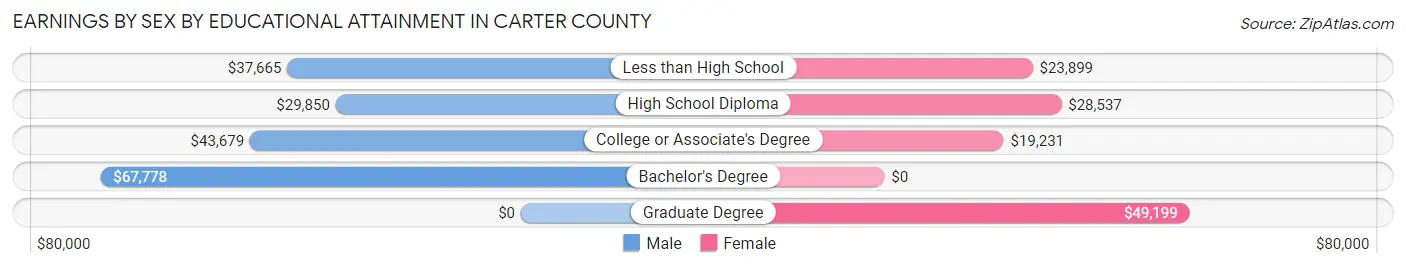
Earnings by Sex by Educational Attainment in Carter County
Average earnings in Carter County are $40,895 for men and $28,118 for women, a difference of 31.2%. Men with an educational attainment of bachelor's degree enjoy the highest average annual earnings of $67,778, while those with high school diploma education earn the least with $29,850. Women with an educational attainment of graduate degree earn the most with the average annual earnings of $49,199, while those with college or associate's degree education have the smallest earnings of $19,231.
| Educational Attainment | Male Income | Female Income |
| Less than High School | $37,665 | $23,899 |
| High School Diploma | $29,850 | $28,537 |
| College or Associate's Degree | $43,679 | $19,231 |
| Bachelor's Degree | $67,778 | $0 |
| Graduate Degree | - | - |
| Total | $40,895 | $28,118 |
Family Income in Carter County
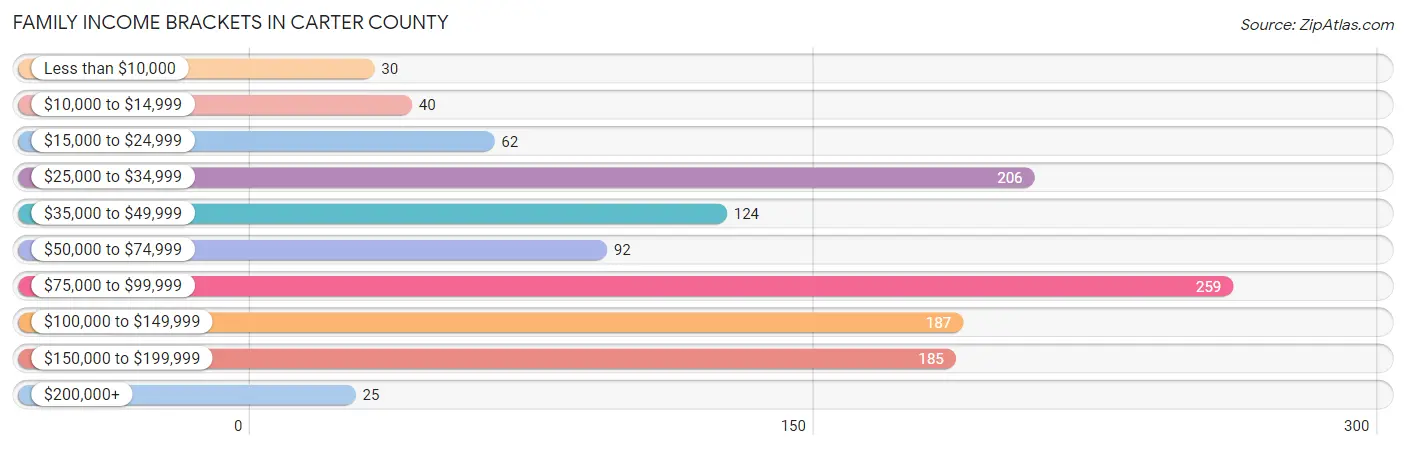
Family Income Brackets in Carter County
According to the Carter County family income data, there are 259 families falling into the $75,000 to $99,999 income range, which is the most common income bracket and makes up 21.4% of all families. Conversely, the $200,000+ income bracket is the least frequent group with only 25 families (2.1%) belonging to this category.
| Income Bracket | # Families | % Families |
| Less than $10,000 | 30 | 2.5% |
| $10,000 to $14,999 | 40 | 3.3% |
| $15,000 to $24,999 | 62 | 5.1% |
| $25,000 to $34,999 | 206 | 17.0% |
| $35,000 to $49,999 | 124 | 10.2% |
| $50,000 to $74,999 | 92 | 7.6% |
| $75,000 to $99,999 | 259 | 21.4% |
| $100,000 to $149,999 | 187 | 15.4% |
| $150,000 to $199,999 | 185 | 15.3% |
| $200,000+ | 25 | 2.1% |
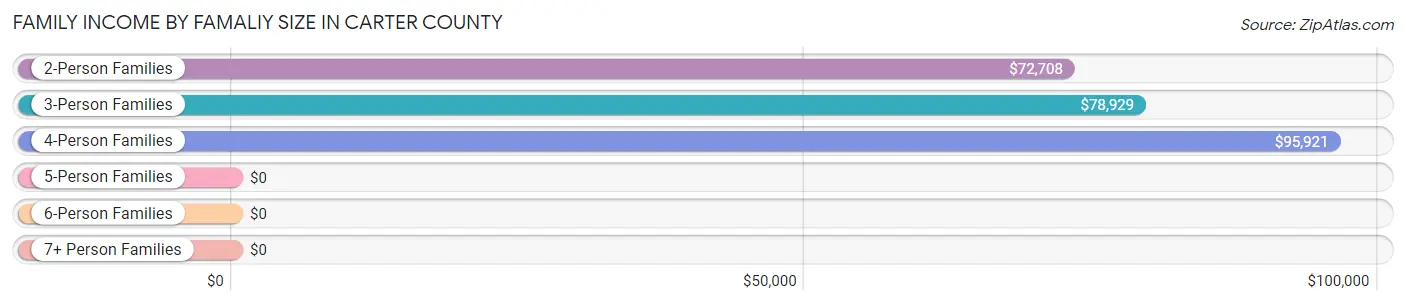
Family Income by Famaliy Size in Carter County
4-person families (162 | 13.4%) account for the highest median family income in Carter County with $95,921 per family, while 2-person families (779 | 64.3%) have the highest median income of $36,354 per family member.
| Income Bracket | # Families | Median Income |
| 2-Person Families | 779 (64.3%) | $72,708 |
| 3-Person Families | 202 (16.7%) | $78,929 |
| 4-Person Families | 162 (13.4%) | $95,921 |
| 5-Person Families | 55 (4.5%) | $0 |
| 6-Person Families | 9 (0.7%) | $0 |
| 7+ Person Families | 5 (0.4%) | $0 |
| Total | 1,212 (100.0%) | $77,281 |
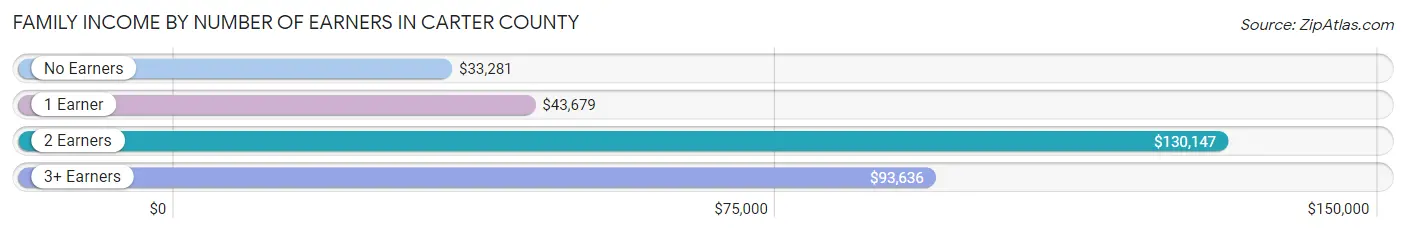
Family Income by Number of Earners in Carter County
The median family income in Carter County is $77,281, with families comprising 2 earners (468) having the highest median family income of $130,147, while families with no earners (328) have the lowest median family income of $33,281, accounting for 38.6% and 27.1% of families, respectively.
| Number of Earners | # Families | Median Income |
| No Earners | 328 (27.1%) | $33,281 |
| 1 Earner | 324 (26.7%) | $43,679 |
| 2 Earners | 468 (38.6%) | $130,147 |
| 3+ Earners | 92 (7.6%) | $93,636 |
| Total | 1,212 (100.0%) | $77,281 |
Household Income in Carter County
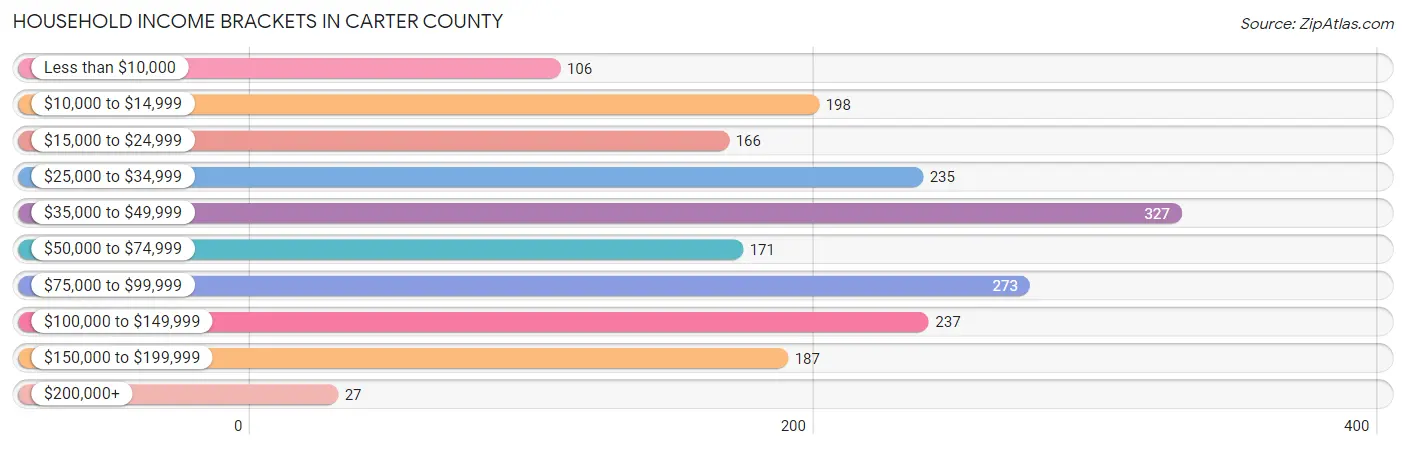
Household Income Brackets in Carter County
With 327 households falling in the category, the $35,000 to $49,999 income range is the most frequent in Carter County, accounting for 17.0% of all households. In contrast, only 27 households (1.4%) fall into the $200,000+ income bracket, making it the least populous group.
| Income Bracket | # Households | % Households |
| Less than $10,000 | 106 | 5.5% |
| $10,000 to $14,999 | 198 | 10.3% |
| $15,000 to $24,999 | 166 | 8.6% |
| $25,000 to $34,999 | 235 | 12.2% |
| $35,000 to $49,999 | 327 | 17.0% |
| $50,000 to $74,999 | 171 | 8.9% |
| $75,000 to $99,999 | 273 | 14.2% |
| $100,000 to $149,999 | 237 | 12.3% |
| $150,000 to $199,999 | 187 | 9.7% |
| $200,000+ | 27 | 1.4% |
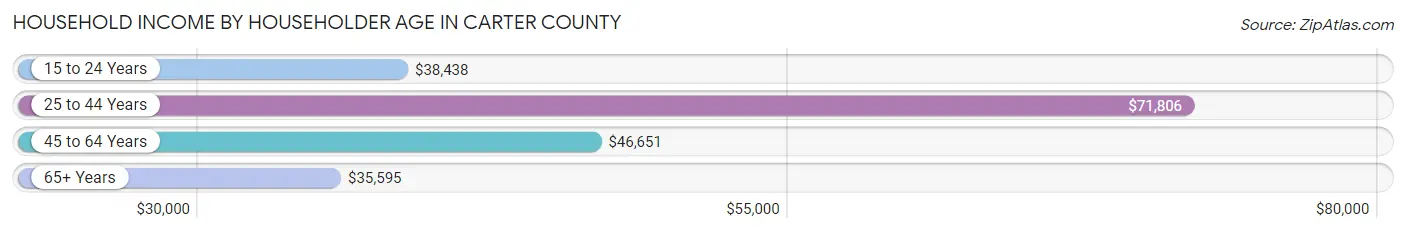
Household Income by Householder Age in Carter County
The median household income in Carter County is $45,737, with the highest median household income of $71,806 found in the 25 to 44 years age bracket for the primary householder. A total of 365 households (19.0%) fall into this category. Meanwhile, the 65+ years age bracket for the primary householder has the lowest median household income of $35,595, with 672 households (34.9%) in this group.
| Income Bracket | # Households | Median Income |
| 15 to 24 Years | 118 (6.1%) | $38,438 |
| 25 to 44 Years | 365 (19.0%) | $71,806 |
| 45 to 64 Years | 770 (40.0%) | $46,651 |
| 65+ Years | 672 (34.9%) | $35,595 |
| Total | 1,925 (100.0%) | $45,737 |
Poverty in Carter County
Income Below Poverty by Sex and Age in Carter County
With 18.0% poverty level for males and 23.1% for females among the residents of Carter County, 16 and 17 year old males and 16 and 17 year old females are the most vulnerable to poverty, with 35 males (58.3%) and 96 females (74.4%) in their respective age groups living below the poverty level.
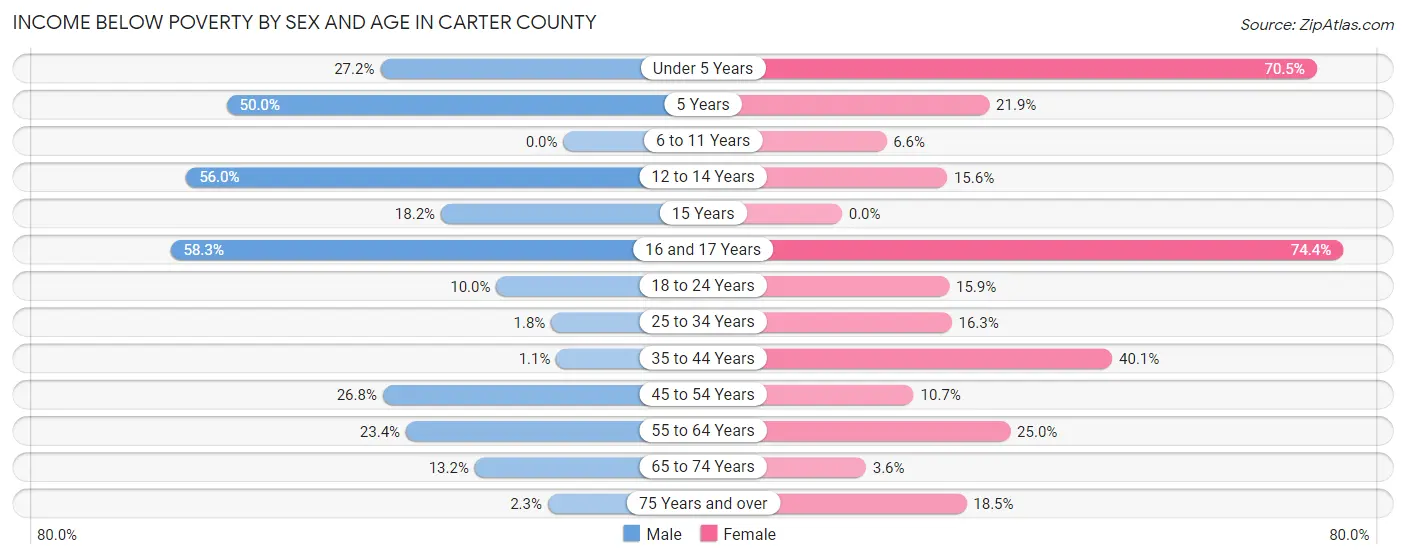
| Age Bracket | Male | Female |
| Under 5 Years | 31 (27.2%) | 98 (70.5%) |
| 5 Years | 2 (50.0%) | 7 (21.9%) |
| 6 to 11 Years | 0 (0.0%) | 14 (6.6%) |
| 12 to 14 Years | 126 (56.0%) | 10 (15.6%) |
| 15 Years | 4 (18.2%) | 0 (0.0%) |
| 16 and 17 Years | 35 (58.3%) | 96 (74.4%) |
| 18 to 24 Years | 26 (10.0%) | 46 (15.9%) |
| 25 to 34 Years | 5 (1.8%) | 30 (16.3%) |
| 35 to 44 Years | 3 (1.1%) | 114 (40.1%) |
| 45 to 54 Years | 70 (26.8%) | 35 (10.7%) |
| 55 to 64 Years | 112 (23.4%) | 103 (25.0%) |
| 65 to 74 Years | 40 (13.2%) | 11 (3.6%) |
| 75 Years and over | 4 (2.3%) | 47 (18.5%) |
| Total | 458 (18.0%) | 611 (23.1%) |
Income Above Poverty by Sex and Age in Carter County
According to the poverty statistics in Carter County, males aged 6 to 11 years and females aged 15 years are the age groups that are most secure financially, with 100.0% of males and 100.0% of females in these age groups living above the poverty line.
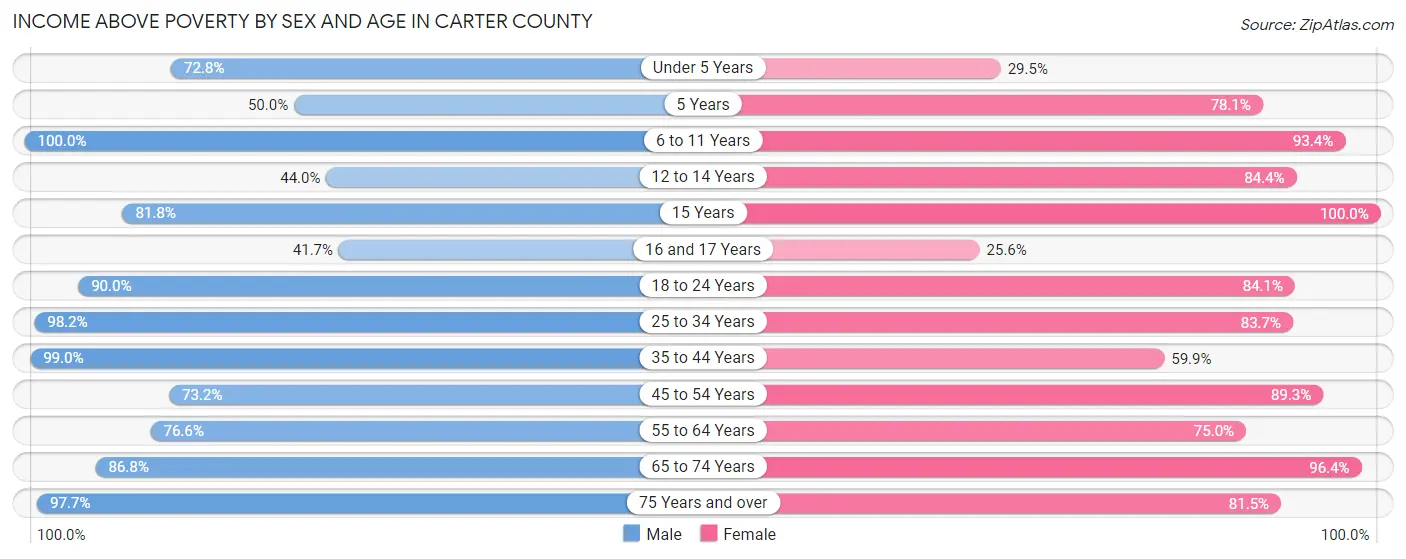
| Age Bracket | Male | Female |
| Under 5 Years | 83 (72.8%) | 41 (29.5%) |
| 5 Years | 2 (50.0%) | 25 (78.1%) |
| 6 to 11 Years | 77 (100.0%) | 198 (93.4%) |
| 12 to 14 Years | 99 (44.0%) | 54 (84.4%) |
| 15 Years | 18 (81.8%) | 10 (100.0%) |
| 16 and 17 Years | 25 (41.7%) | 33 (25.6%) |
| 18 to 24 Years | 235 (90.0%) | 243 (84.1%) |
| 25 to 34 Years | 272 (98.2%) | 154 (83.7%) |
| 35 to 44 Years | 284 (99.0%) | 170 (59.9%) |
| 45 to 54 Years | 191 (73.2%) | 293 (89.3%) |
| 55 to 64 Years | 367 (76.6%) | 309 (75.0%) |
| 65 to 74 Years | 264 (86.8%) | 298 (96.4%) |
| 75 Years and over | 169 (97.7%) | 207 (81.5%) |
| Total | 2,086 (82.0%) | 2,035 (76.9%) |
Income Below Poverty Among Married-Couple Families in Carter County
The poverty statistics for married-couple families in Carter County show that 4.0% or 35 of the total 871 families live below the poverty line. Families with 3 or 4 children have the highest poverty rate of 8.0%, comprising of 2 families. On the other hand, families with 5 or more children have the lowest poverty rate of 0.0%, which includes 0 families.
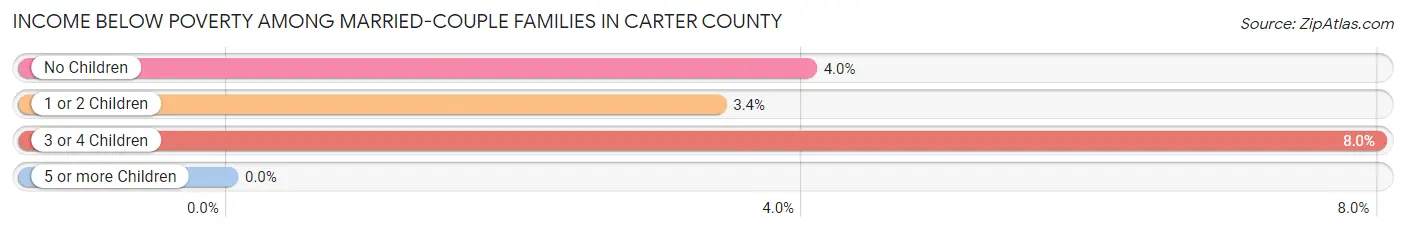
| Children | Above Poverty | Below Poverty |
| No Children | 666 (96.0%) | 28 (4.0%) |
| 1 or 2 Children | 142 (96.6%) | 5 (3.4%) |
| 3 or 4 Children | 23 (92.0%) | 2 (8.0%) |
| 5 or more Children | 5 (100.0%) | 0 (0.0%) |
| Total | 836 (96.0%) | 35 (4.0%) |
Income Below Poverty Among Single-Parent Households in Carter County
According to the poverty data in Carter County, 33.3% or 34 single-father households and 22.2% or 53 single-mother households are living below the poverty line. Among single-father households, those with 1 or 2 children have the highest poverty rate, with 29 households (52.7%) experiencing poverty. Likewise, among single-mother households, those with 3 or 4 children have the highest poverty rate, with 17 households (30.9%) falling below the poverty line.
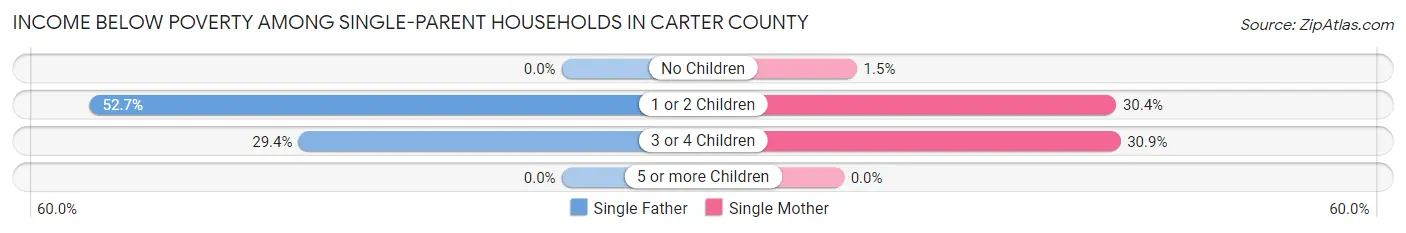
| Children | Single Father | Single Mother |
| No Children | 0 (0.0%) | 1 (1.5%) |
| 1 or 2 Children | 29 (52.7%) | 35 (30.4%) |
| 3 or 4 Children | 5 (29.4%) | 17 (30.9%) |
| 5 or more Children | 0 (0.0%) | 0 (0.0%) |
| Total | 34 (33.3%) | 53 (22.2%) |
Income Below Poverty Among Married-Couple vs Single-Parent Households in Carter County
The poverty data for Carter County shows that 35 of the married-couple family households (4.0%) and 87 of the single-parent households (25.5%) are living below the poverty level. Within the married-couple family households, those with 3 or 4 children have the highest poverty rate, with 2 households (8.0%) falling below the poverty line. Among the single-parent households, those with 1 or 2 children have the highest poverty rate, with 64 household (37.7%) living below poverty.
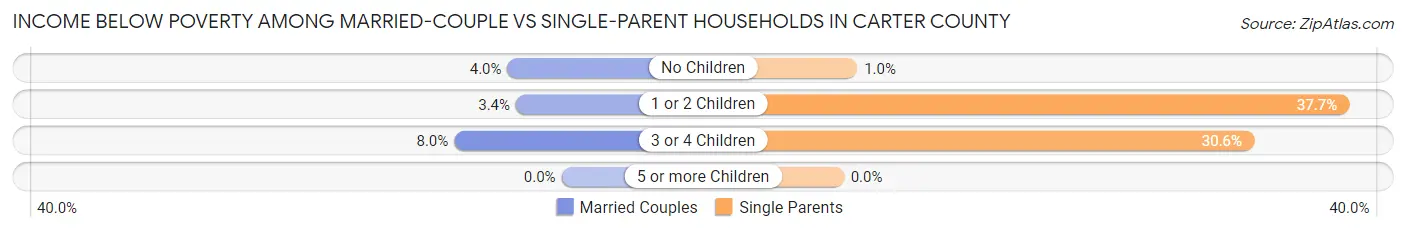
| Children | Married-Couple Families | Single-Parent Households |
| No Children | 28 (4.0%) | 1 (1.0%) |
| 1 or 2 Children | 5 (3.4%) | 64 (37.7%) |
| 3 or 4 Children | 2 (8.0%) | 22 (30.6%) |
| 5 or more Children | 0 (0.0%) | 0 (0.0%) |
| Total | 35 (4.0%) | 87 (25.5%) |
Race in Carter County
The most populous races in Carter County are White / Caucasian (4,984 | 94.1%), Two or more Races (252 | 4.8%), and Hispanic or Latino (123 | 2.3%).
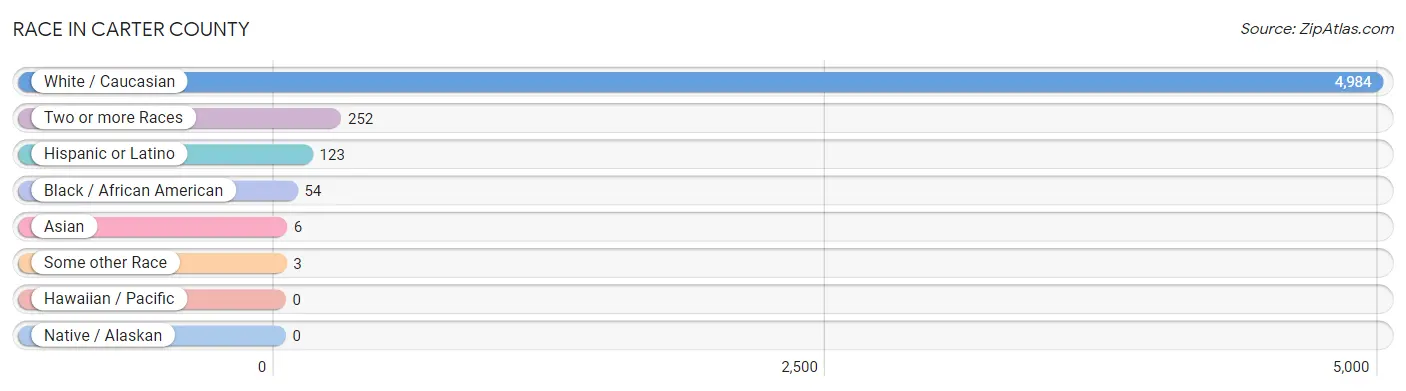
| Race | # Population | % Population |
| Asian | 6 | 0.1% |
| Black / African American | 54 | 1.0% |
| Hawaiian / Pacific | 0 | 0.0% |
| Hispanic or Latino | 123 | 2.3% |
| Native / Alaskan | 0 | 0.0% |
| White / Caucasian | 4,984 | 94.1% |
| Two or more Races | 252 | 4.8% |
| Some other Race | 3 | 0.1% |
| Total | 5,299 | 100.0% |
Ancestry in Carter County
The most populous ancestries reported in Carter County are German (899 | 17.0%), Irish (797 | 15.0%), American (684 | 12.9%), English (259 | 4.9%), and European (150 | 2.8%), together accounting for 52.6% of all Carter County residents.
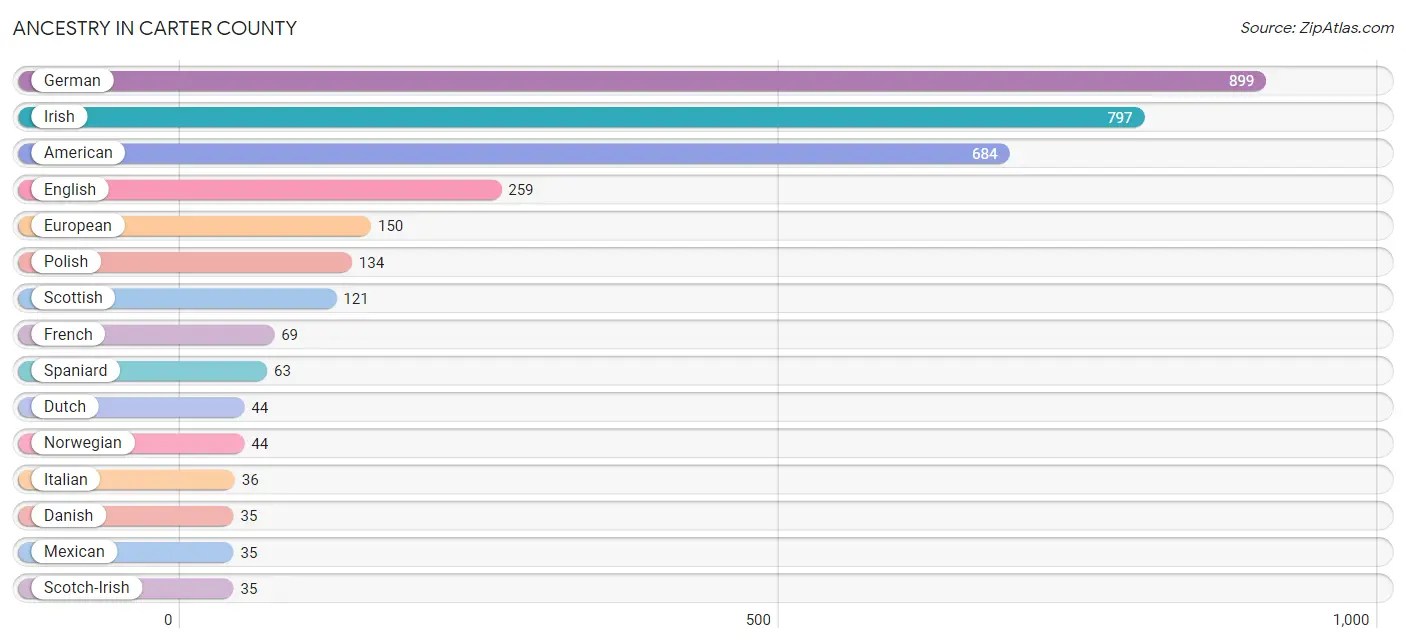
| Ancestry | # Population | % Population |
| African | 20 | 0.4% |
| American | 684 | 12.9% |
| British | 19 | 0.4% |
| Cherokee | 34 | 0.6% |
| Danish | 35 | 0.7% |
| Dutch | 44 | 0.8% |
| English | 259 | 4.9% |
| European | 150 | 2.8% |
| French | 69 | 1.3% |
| German | 899 | 17.0% |
| Irish | 797 | 15.0% |
| Italian | 36 | 0.7% |
| Mexican | 35 | 0.7% |
| Norwegian | 44 | 0.8% |
| Pakistani | 6 | 0.1% |
| Peruvian | 18 | 0.3% |
| Polish | 134 | 2.5% |
| Scandinavian | 10 | 0.2% |
| Scotch-Irish | 35 | 0.7% |
| Scottish | 121 | 2.3% |
| Seminole | 30 | 0.6% |
| South American | 18 | 0.3% |
| Spaniard | 63 | 1.2% |
| Spanish | 7 | 0.1% |
| Subsaharan African | 20 | 0.4% |
| Swedish | 26 | 0.5% |
| Welsh | 16 | 0.3% |
| Yugoslavian | 8 | 0.2% | View All 28 Rows |
Immigrants in Carter County
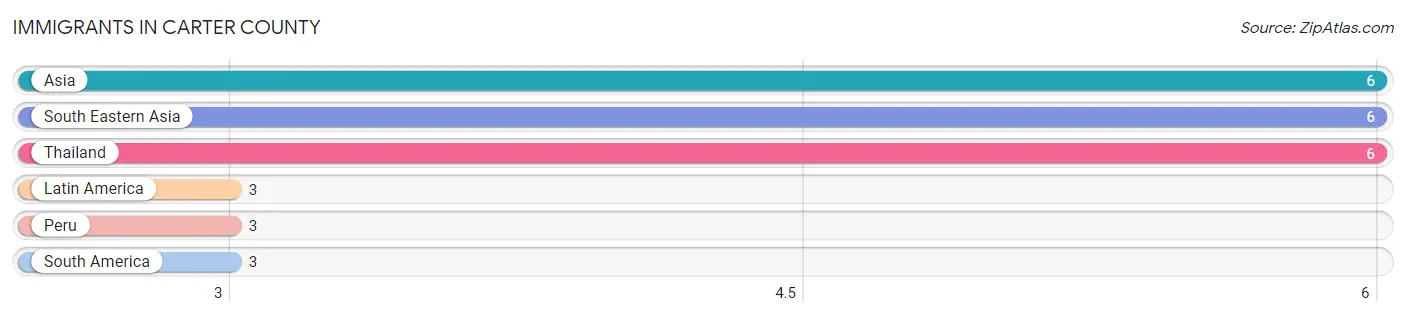
The most numerous immigrant groups reported in Carter County came from Asia (6 | 0.1%), South Eastern Asia (6 | 0.1%), Thailand (6 | 0.1%), Latin America (3 | 0.1%), and Peru (3 | 0.1%), together accounting for 0.4% of all Carter County residents.
| Immigration Origin | # Population | % Population |
| Asia | 6 | 0.1% |
| Latin America | 3 | 0.1% |
| Peru | 3 | 0.1% |
| South America | 3 | 0.1% |
| South Eastern Asia | 6 | 0.1% |
| Thailand | 6 | 0.1% | View All 6 Rows |
Sex and Age in Carter County
Sex and Age in Carter County
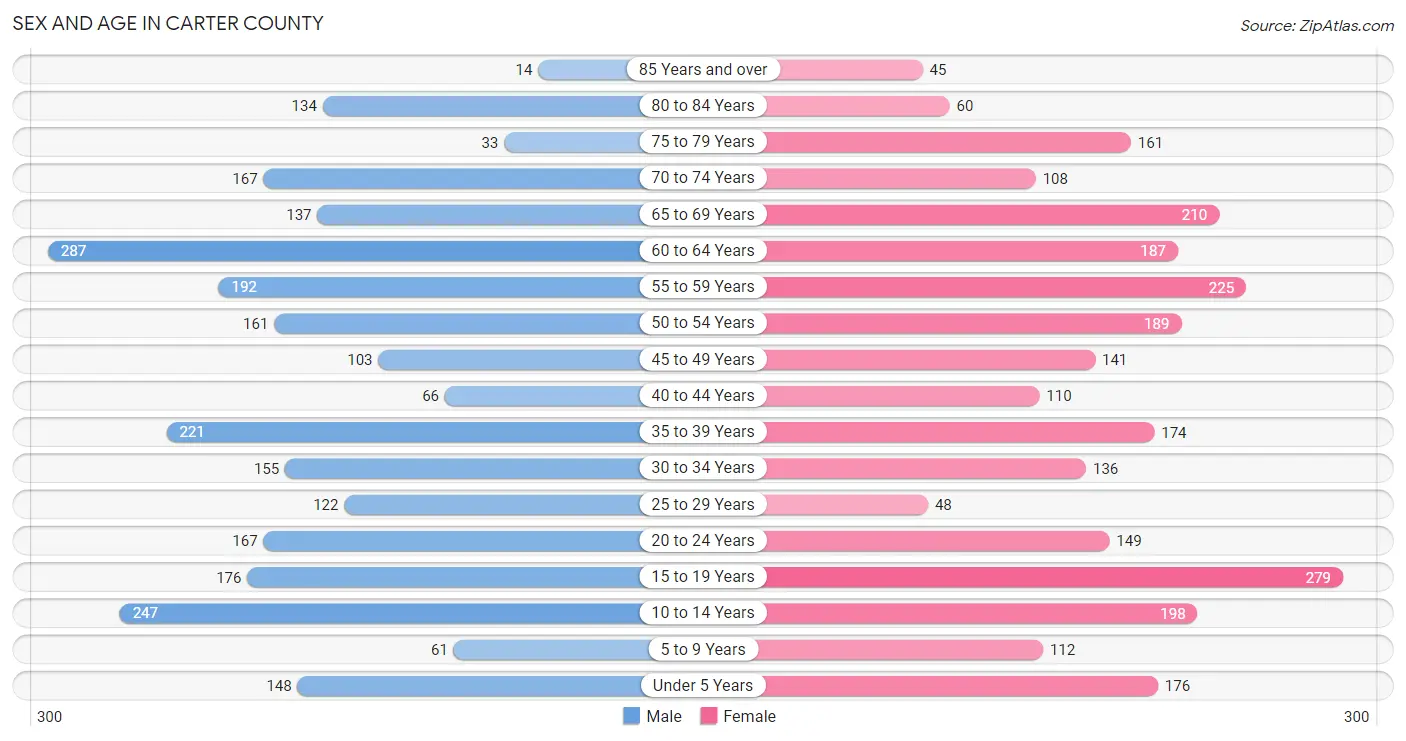
The most populous age groups in Carter County are 60 to 64 Years (287 | 11.1%) for men and 15 to 19 Years (279 | 10.3%) for women.
| Age Bracket | Male | Female |
| Under 5 Years | 148 (5.7%) | 176 (6.5%) |
| 5 to 9 Years | 61 (2.4%) | 112 (4.1%) |
| 10 to 14 Years | 247 (9.5%) | 198 (7.3%) |
| 15 to 19 Years | 176 (6.8%) | 279 (10.3%) |
| 20 to 24 Years | 167 (6.5%) | 149 (5.5%) |
| 25 to 29 Years | 122 (4.7%) | 48 (1.8%) |
| 30 to 34 Years | 155 (6.0%) | 136 (5.0%) |
| 35 to 39 Years | 221 (8.5%) | 174 (6.4%) |
| 40 to 44 Years | 66 (2.5%) | 110 (4.1%) |
| 45 to 49 Years | 103 (4.0%) | 141 (5.2%) |
| 50 to 54 Years | 161 (6.2%) | 189 (7.0%) |
| 55 to 59 Years | 192 (7.4%) | 225 (8.3%) |
| 60 to 64 Years | 287 (11.1%) | 187 (6.9%) |
| 65 to 69 Years | 137 (5.3%) | 210 (7.7%) |
| 70 to 74 Years | 167 (6.5%) | 108 (4.0%) |
| 75 to 79 Years | 33 (1.3%) | 161 (5.9%) |
| 80 to 84 Years | 134 (5.2%) | 60 (2.2%) |
| 85 Years and over | 14 (0.5%) | 45 (1.7%) |
| Total | 2,591 (100.0%) | 2,708 (100.0%) |
Families and Households in Carter County
Median Family Size in Carter County
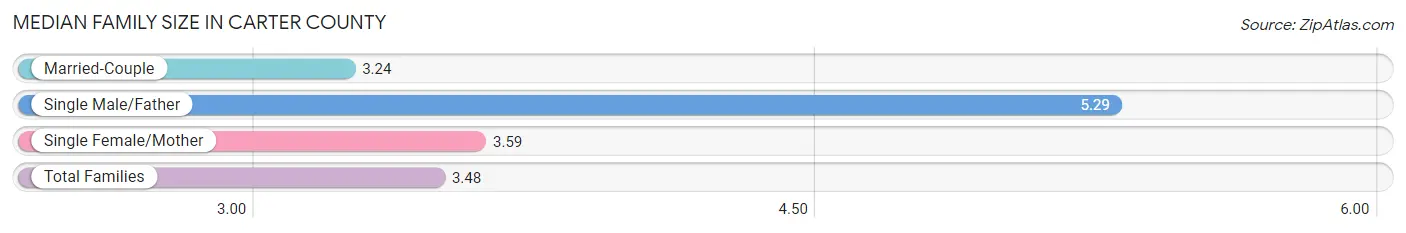
The median family size in Carter County is 3.48 persons per family, with single male/father families (102 | 8.4%) accounting for the largest median family size of 5.29 persons per family. On the other hand, married-couple families (871 | 71.9%) represent the smallest median family size with 3.24 persons per family.
| Family Type | # Families | Family Size |
| Married-Couple | 871 (71.9%) | 3.24 |
| Single Male/Father | 102 (8.4%) | 5.29 |
| Single Female/Mother | 239 (19.7%) | 3.59 |
| Total Families | 1,212 (100.0%) | 3.48 |
Median Household Size in Carter County
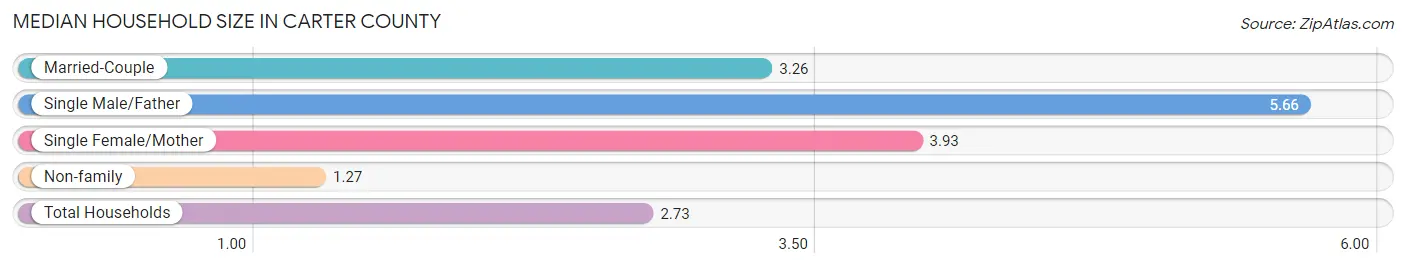
The median household size in Carter County is 2.73 persons per household, with single male/father households (102 | 5.3%) accounting for the largest median household size of 5.66 persons per household. non-family households (713 | 37.0%) represent the smallest median household size with 1.27 persons per household.
| Household Type | # Households | Household Size |
| Married-Couple | 871 (45.3%) | 3.26 |
| Single Male/Father | 102 (5.3%) | 5.66 |
| Single Female/Mother | 239 (12.4%) | 3.93 |
| Non-family | 713 (37.0%) | 1.27 |
| Total Households | 1,925 (100.0%) | 2.73 |
Household Size by Marriage Status in Carter County
Out of a total of 1,925 households in Carter County, 1,212 (63.0%) are family households, while 713 (37.0%) are nonfamily households. The most numerous type of family households are 2-person households, comprising 709, and the most common type of nonfamily households are 1-person households, comprising 669.
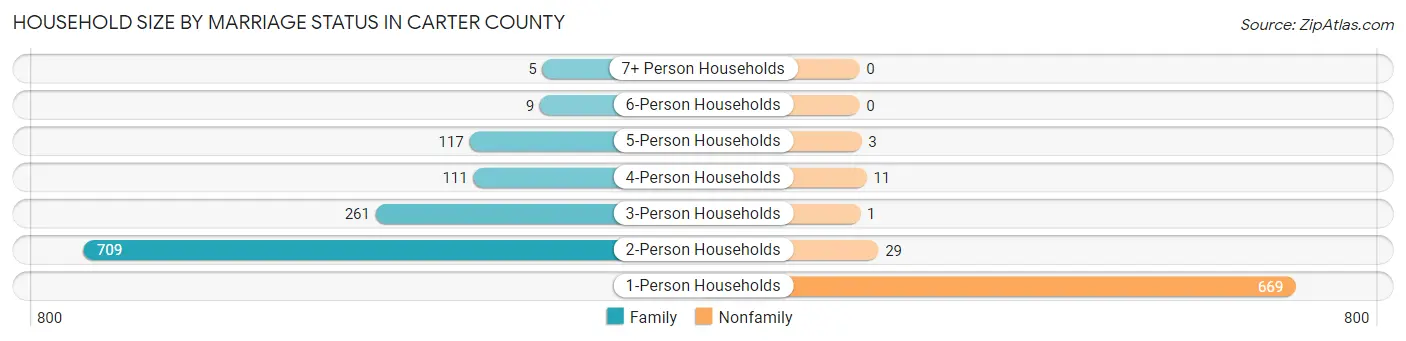
| Household Size | Family Households | Nonfamily Households |
| 1-Person Households | - | 669 (34.7%) |
| 2-Person Households | 709 (36.8%) | 29 (1.5%) |
| 3-Person Households | 261 (13.6%) | 1 (0.1%) |
| 4-Person Households | 111 (5.8%) | 11 (0.6%) |
| 5-Person Households | 117 (6.1%) | 3 (0.2%) |
| 6-Person Households | 9 (0.5%) | 0 (0.0%) |
| 7+ Person Households | 5 (0.3%) | 0 (0.0%) |
| Total | 1,212 (63.0%) | 713 (37.0%) |
Female Fertility in Carter County
Fertility by Age in Carter County
Average fertility rate in Carter County is 19.0 births per 1,000 women. Women in the age bracket of 20 to 34 years have the highest fertility rate with 66.0 births per 1,000 women. Women in the age bracket of 20 to 34 years acount for 100.0% of all women with births.
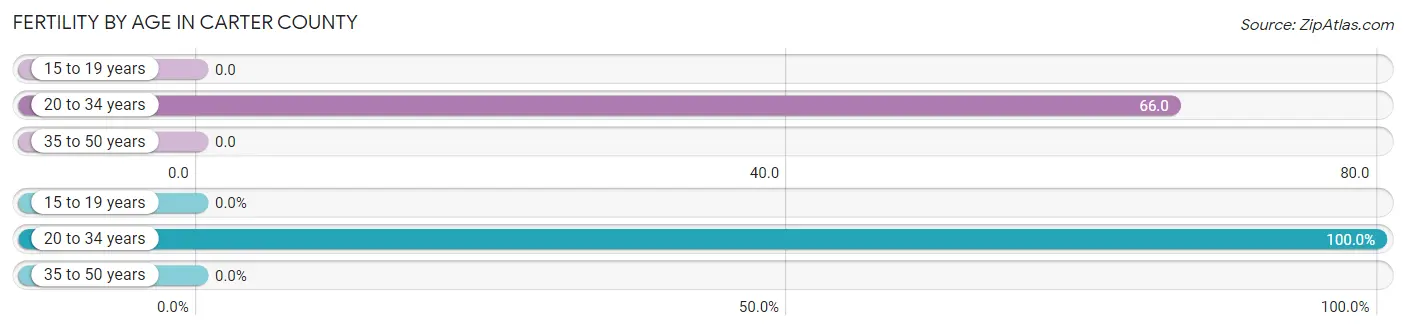
| Age Bracket | Women with Births | Births / 1,000 Women |
| 15 to 19 years | 0 (0.0%) | 0.0 |
| 20 to 34 years | 22 (100.0%) | 66.0 |
| 35 to 50 years | 0 (0.0%) | 0.0 |
| Total | 22 (100.0%) | 19.0 |
Fertility by Age by Marriage Status in Carter County
68.2% of women with births (22) in Carter County are married. The highest percentage of unmarried women with births falls into 20 to 34 years age bracket with 31.8% of them unmarried at the time of birth, while the lowest percentage of unmarried women with births belong to 20 to 34 years age bracket with 31.8% of them unmarried.
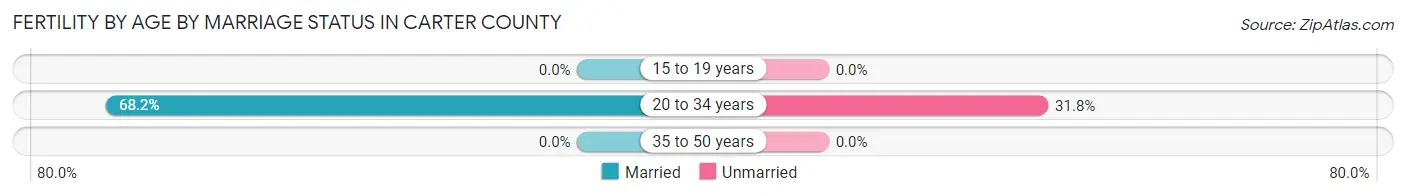
| Age Bracket | Married | Unmarried |
| 15 to 19 years | 0 (0.0%) | 0 (0.0%) |
| 20 to 34 years | 15 (68.2%) | 7 (31.8%) |
| 35 to 50 years | 0 (0.0%) | 0 (0.0%) |
| Total | 15 (68.2%) | 7 (31.8%) |
Fertility by Education in Carter County
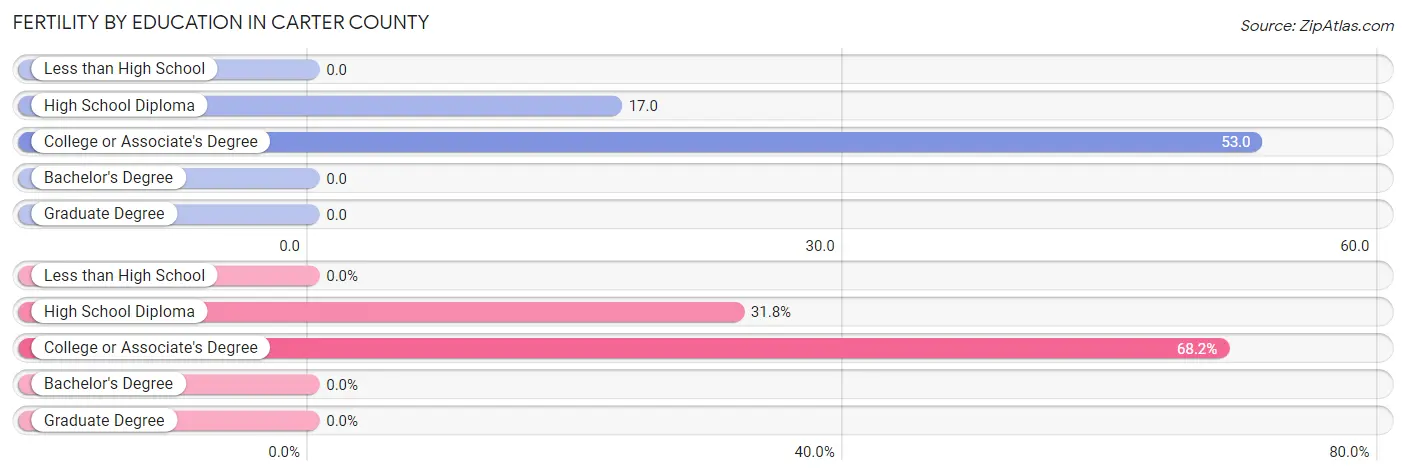
| Educational Attainment | Women with Births | Births / 1,000 Women |
| Less than High School | 0 (0.0%) | 0.0 |
| High School Diploma | 7 (31.8%) | 17.0 |
| College or Associate's Degree | 15 (68.2%) | 53.0 |
| Bachelor's Degree | 0 (0.0%) | 0.0 |
| Graduate Degree | 0 (0.0%) | 0.0 |
| Total | 22 (100.0%) | 19.0 |
Fertility by Education by Marriage Status in Carter County
31.8% of women with births in Carter County are unmarried. Women with the educational attainment of college or associate's degree are most likely to be married with 100.0% of them married at childbirth, while women with the educational attainment of high school diploma are least likely to be married with 100.0% of them unmarried at childbirth.
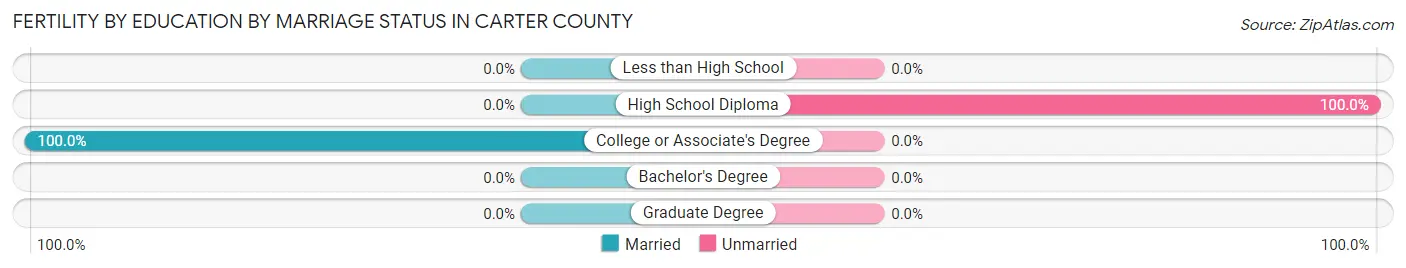
| Educational Attainment | Married | Unmarried |
| Less than High School | 0 (0.0%) | 0 (0.0%) |
| High School Diploma | 0 (0.0%) | 7 (100.0%) |
| College or Associate's Degree | 15 (100.0%) | 0 (0.0%) |
| Bachelor's Degree | 0 (0.0%) | 0 (0.0%) |
| Graduate Degree | 0 (0.0%) | 0 (0.0%) |
| Total | 15 (68.2%) | 7 (31.8%) |
Employment Characteristics in Carter County
Employment by Class of Employer in Carter County
Among the 2,311 employed individuals in Carter County, private company employees (1,503 | 65.0%), self-employed (not incorporated) (295 | 12.8%), and self-employed (incorporated) (159 | 6.9%) make up the most common classes of employment.
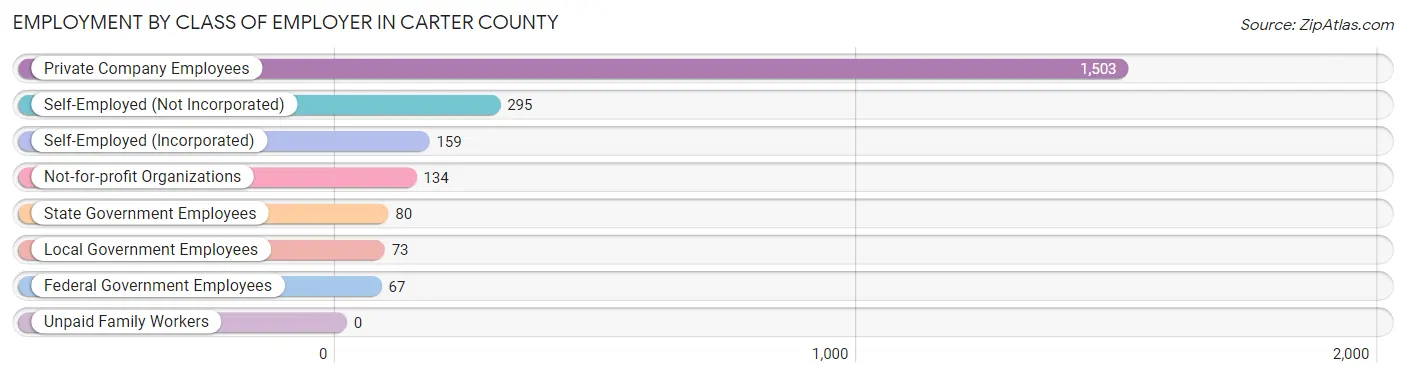
| Employer Class | # Employees | % Employees |
| Private Company Employees | 1,503 | 65.0% |
| Self-Employed (Incorporated) | 159 | 6.9% |
| Self-Employed (Not Incorporated) | 295 | 12.8% |
| Not-for-profit Organizations | 134 | 5.8% |
| Local Government Employees | 73 | 3.2% |
| State Government Employees | 80 | 3.5% |
| Federal Government Employees | 67 | 2.9% |
| Unpaid Family Workers | 0 | 0.0% |
| Total | 2,311 | 100.0% |
Employment Status by Age in Carter County
According to the labor force statistics for Carter County, out of the total population over 16 years of age (4,325), 54.5% or 2,357 individuals are in the labor force, with 1.2% or 28 of them unemployed. The age group with the highest labor force participation rate is 25 to 29 years, with 87.6% or 149 individuals in the labor force. Within the labor force, the 16 to 19 years age range has the highest percentage of unemployed individuals, with 14.6% or 24 of them being unemployed.
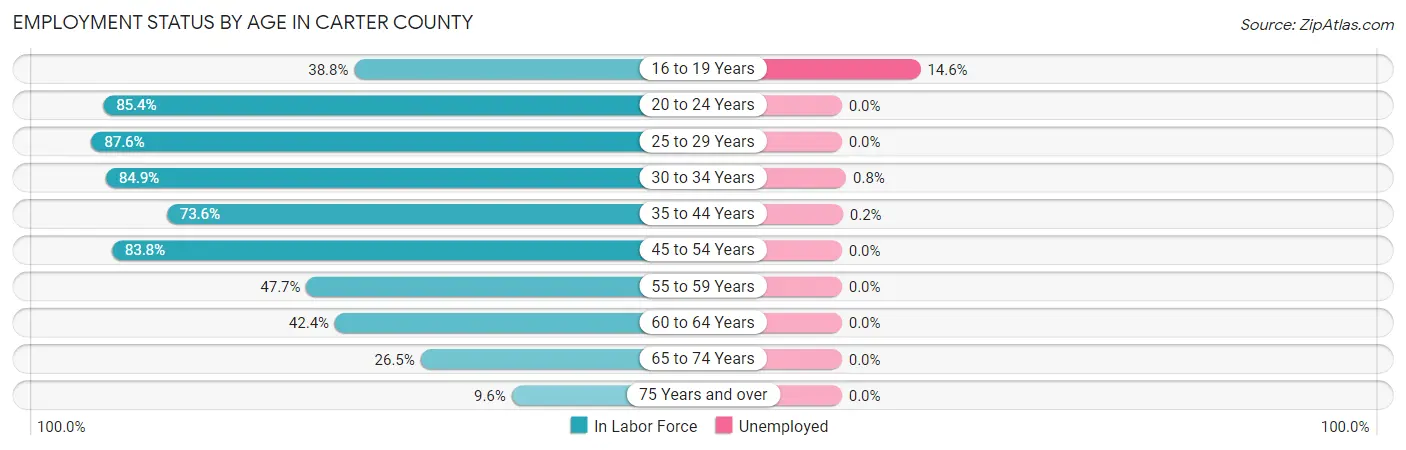
| Age Bracket | In Labor Force | Unemployed |
| 16 to 19 Years | 164 (38.8%) | 24 (14.6%) |
| 20 to 24 Years | 270 (85.4%) | 0 (0.0%) |
| 25 to 29 Years | 149 (87.6%) | 0 (0.0%) |
| 30 to 34 Years | 247 (84.9%) | 2 (0.8%) |
| 35 to 44 Years | 420 (73.6%) | 1 (0.2%) |
| 45 to 54 Years | 498 (83.8%) | 0 (0.0%) |
| 55 to 59 Years | 199 (47.7%) | 0 (0.0%) |
| 60 to 64 Years | 201 (42.4%) | 0 (0.0%) |
| 65 to 74 Years | 165 (26.5%) | 0 (0.0%) |
| 75 Years and over | 43 (9.6%) | 0 (0.0%) |
| Total | 2,357 (54.5%) | 28 (1.2%) |
Employment Status by Educational Attainment in Carter County
According to labor force statistics for Carter County, 68.1% of individuals (1,714) out of the total population between 25 and 64 years of age (2,517) are in the labor force, with 0.2% or 3 of them being unemployed. The group with the highest labor force participation rate are those with the educational attainment of bachelor's degree or higher, with 84.4% or 367 individuals in the labor force. Within the labor force, individuals with less than high school education have the highest percentage of unemployment, with 0.3% or 1 of them being unemployed.
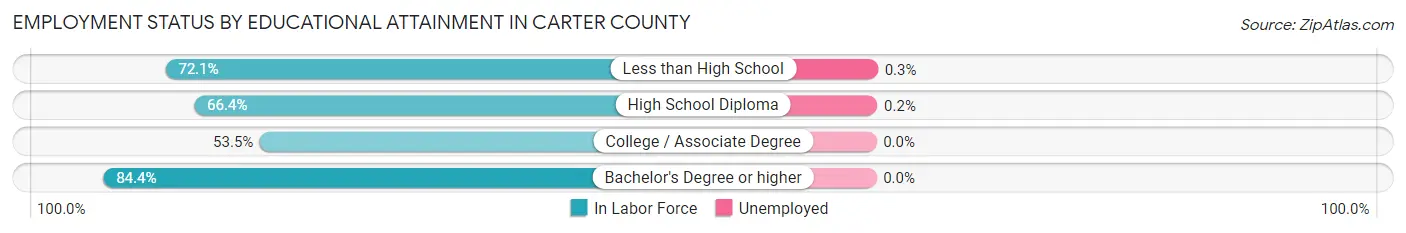
| Educational Attainment | In Labor Force | Unemployed |
| Less than High School | 295 (72.1%) | 1 (0.3%) |
| High School Diploma | 807 (66.4%) | 2 (0.2%) |
| College / Associate Degree | 245 (53.5%) | 0 (0.0%) |
| Bachelor's Degree or higher | 367 (84.4%) | 0 (0.0%) |
| Total | 1,714 (68.1%) | 5 (0.2%) |
Employment Occupations by Sex in Carter County
Management, Business, Science and Arts Occupations
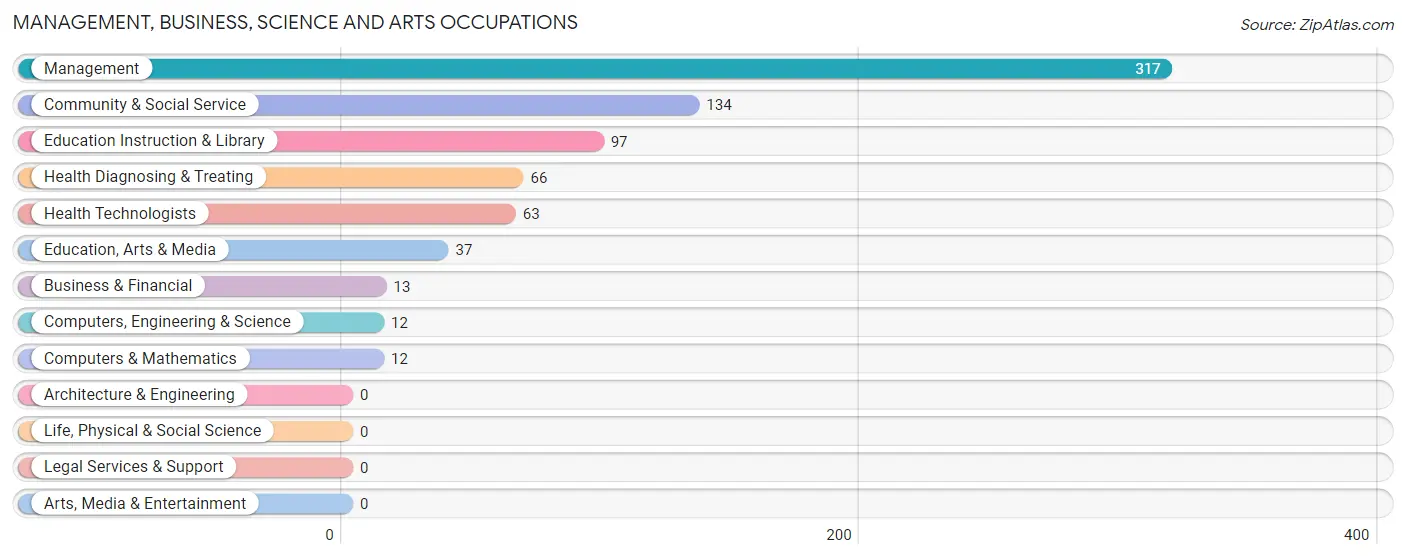
The most common Management, Business, Science and Arts occupations in Carter County are Management (317 | 13.7%), Community & Social Service (134 | 5.8%), Education Instruction & Library (97 | 4.2%), Health Diagnosing & Treating (66 | 2.9%), and Health Technologists (63 | 2.7%).
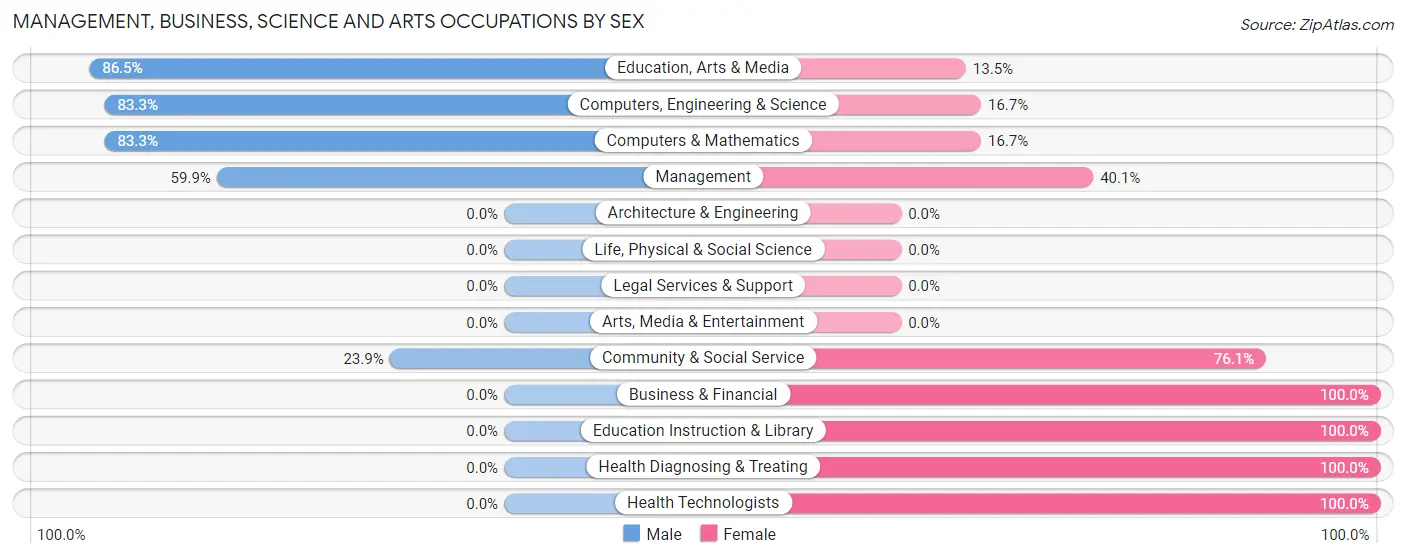
Management, Business, Science and Arts Occupations by Sex
Within the Management, Business, Science and Arts occupations in Carter County, the most male-oriented occupations are Education, Arts & Media (86.5%), Computers, Engineering & Science (83.3%), and Computers & Mathematics (83.3%), while the most female-oriented occupations are Business & Financial (100.0%), Education Instruction & Library (100.0%), and Health Diagnosing & Treating (100.0%).
| Occupation | Male | Female |
| Management | 190 (59.9%) | 127 (40.1%) |
| Business & Financial | 0 (0.0%) | 13 (100.0%) |
| Computers, Engineering & Science | 10 (83.3%) | 2 (16.7%) |
| Computers & Mathematics | 10 (83.3%) | 2 (16.7%) |
| Architecture & Engineering | 0 (0.0%) | 0 (0.0%) |
| Life, Physical & Social Science | 0 (0.0%) | 0 (0.0%) |
| Community & Social Service | 32 (23.9%) | 102 (76.1%) |
| Education, Arts & Media | 32 (86.5%) | 5 (13.5%) |
| Legal Services & Support | 0 (0.0%) | 0 (0.0%) |
| Education Instruction & Library | 0 (0.0%) | 97 (100.0%) |
| Arts, Media & Entertainment | 0 (0.0%) | 0 (0.0%) |
| Health Diagnosing & Treating | 0 (0.0%) | 66 (100.0%) |
| Health Technologists | 0 (0.0%) | 63 (100.0%) |
| Total (Category) | 232 (42.8%) | 310 (57.2%) |
| Total (Overall) | 1,307 (56.5%) | 1,008 (43.5%) |
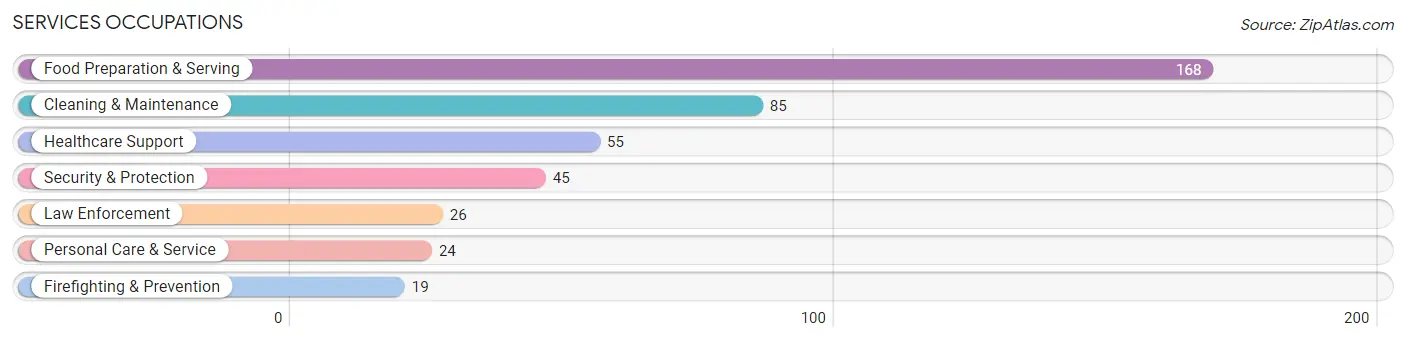
Services Occupations
The most common Services occupations in Carter County are Food Preparation & Serving (168 | 7.3%), Cleaning & Maintenance (85 | 3.7%), Healthcare Support (55 | 2.4%), Security & Protection (45 | 1.9%), and Law Enforcement (26 | 1.1%).
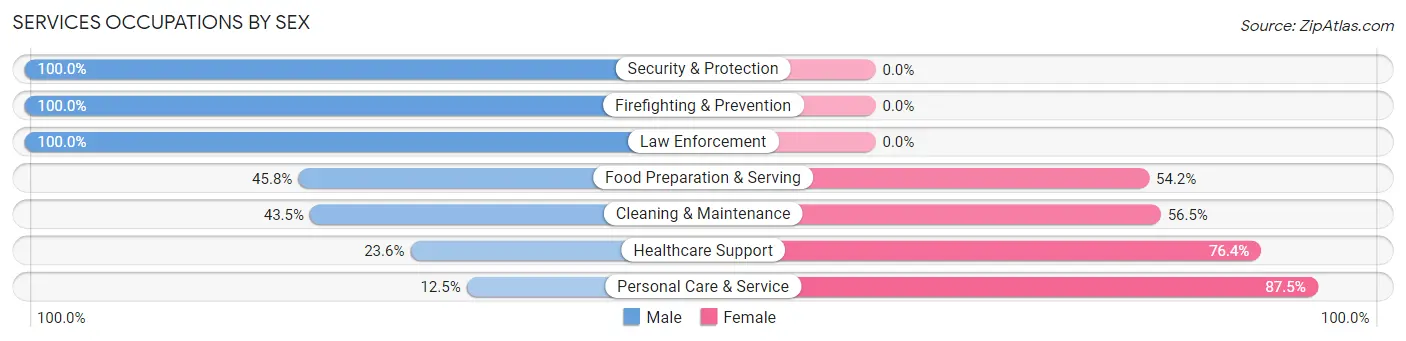
Services Occupations by Sex
Within the Services occupations in Carter County, the most male-oriented occupations are Security & Protection (100.0%), Firefighting & Prevention (100.0%), and Law Enforcement (100.0%), while the most female-oriented occupations are Personal Care & Service (87.5%), Healthcare Support (76.4%), and Cleaning & Maintenance (56.5%).
| Occupation | Male | Female |
| Healthcare Support | 13 (23.6%) | 42 (76.4%) |
| Security & Protection | 45 (100.0%) | 0 (0.0%) |
| Firefighting & Prevention | 19 (100.0%) | 0 (0.0%) |
| Law Enforcement | 26 (100.0%) | 0 (0.0%) |
| Food Preparation & Serving | 77 (45.8%) | 91 (54.2%) |
| Cleaning & Maintenance | 37 (43.5%) | 48 (56.5%) |
| Personal Care & Service | 3 (12.5%) | 21 (87.5%) |
| Total (Category) | 175 (46.4%) | 202 (53.6%) |
| Total (Overall) | 1,307 (56.5%) | 1,008 (43.5%) |
Sales and Office Occupations
The most common Sales and Office occupations in Carter County are Sales & Related (352 | 15.2%), and Office & Administration (254 | 11.0%).
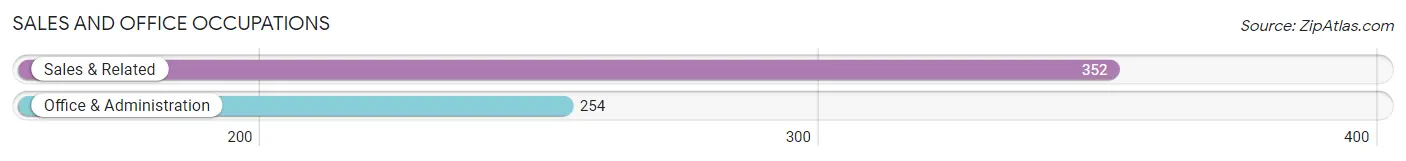
Sales and Office Occupations by Sex
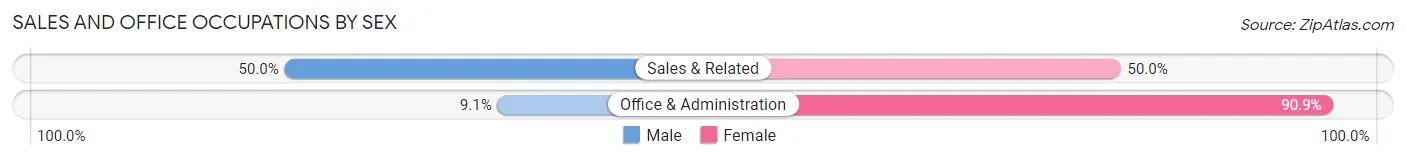
| Occupation | Male | Female |
| Sales & Related | 176 (50.0%) | 176 (50.0%) |
| Office & Administration | 23 (9.1%) | 231 (90.9%) |
| Total (Category) | 199 (32.8%) | 407 (67.2%) |
| Total (Overall) | 1,307 (56.5%) | 1,008 (43.5%) |
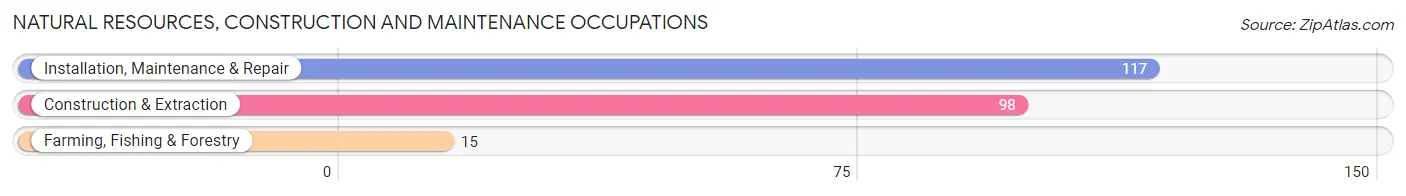
Natural Resources, Construction and Maintenance Occupations
The most common Natural Resources, Construction and Maintenance occupations in Carter County are Installation, Maintenance & Repair (117 | 5.1%), Construction & Extraction (98 | 4.2%), and Farming, Fishing & Forestry (15 | 0.6%).
Natural Resources, Construction and Maintenance Occupations by Sex
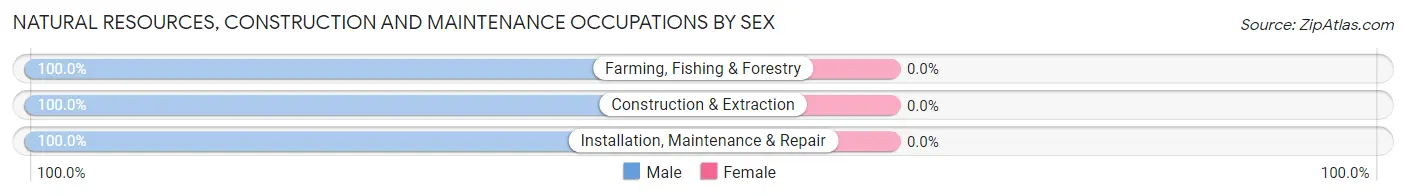
| Occupation | Male | Female |
| Farming, Fishing & Forestry | 15 (100.0%) | 0 (0.0%) |
| Construction & Extraction | 98 (100.0%) | 0 (0.0%) |
| Installation, Maintenance & Repair | 117 (100.0%) | 0 (0.0%) |
| Total (Category) | 230 (100.0%) | 0 (0.0%) |
| Total (Overall) | 1,307 (56.5%) | 1,008 (43.5%) |
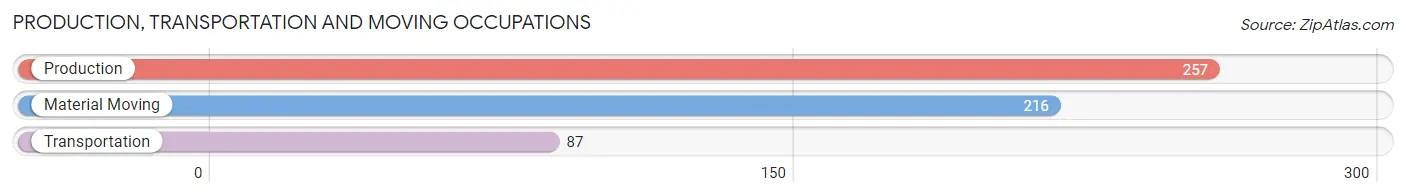
Production, Transportation and Moving Occupations
The most common Production, Transportation and Moving occupations in Carter County are Production (257 | 11.1%), Material Moving (216 | 9.3%), and Transportation (87 | 3.8%).
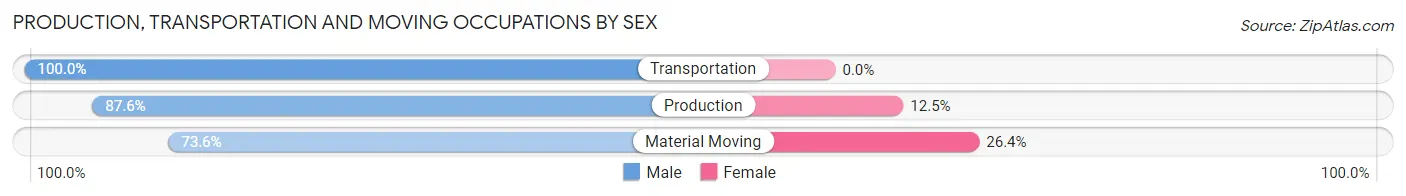
Production, Transportation and Moving Occupations by Sex
| Occupation | Male | Female |
| Production | 225 (87.5%) | 32 (12.4%) |
| Transportation | 87 (100.0%) | 0 (0.0%) |
| Material Moving | 159 (73.6%) | 57 (26.4%) |
| Total (Category) | 471 (84.1%) | 89 (15.9%) |
| Total (Overall) | 1,307 (56.5%) | 1,008 (43.5%) |
Employment Industries by Sex in Carter County
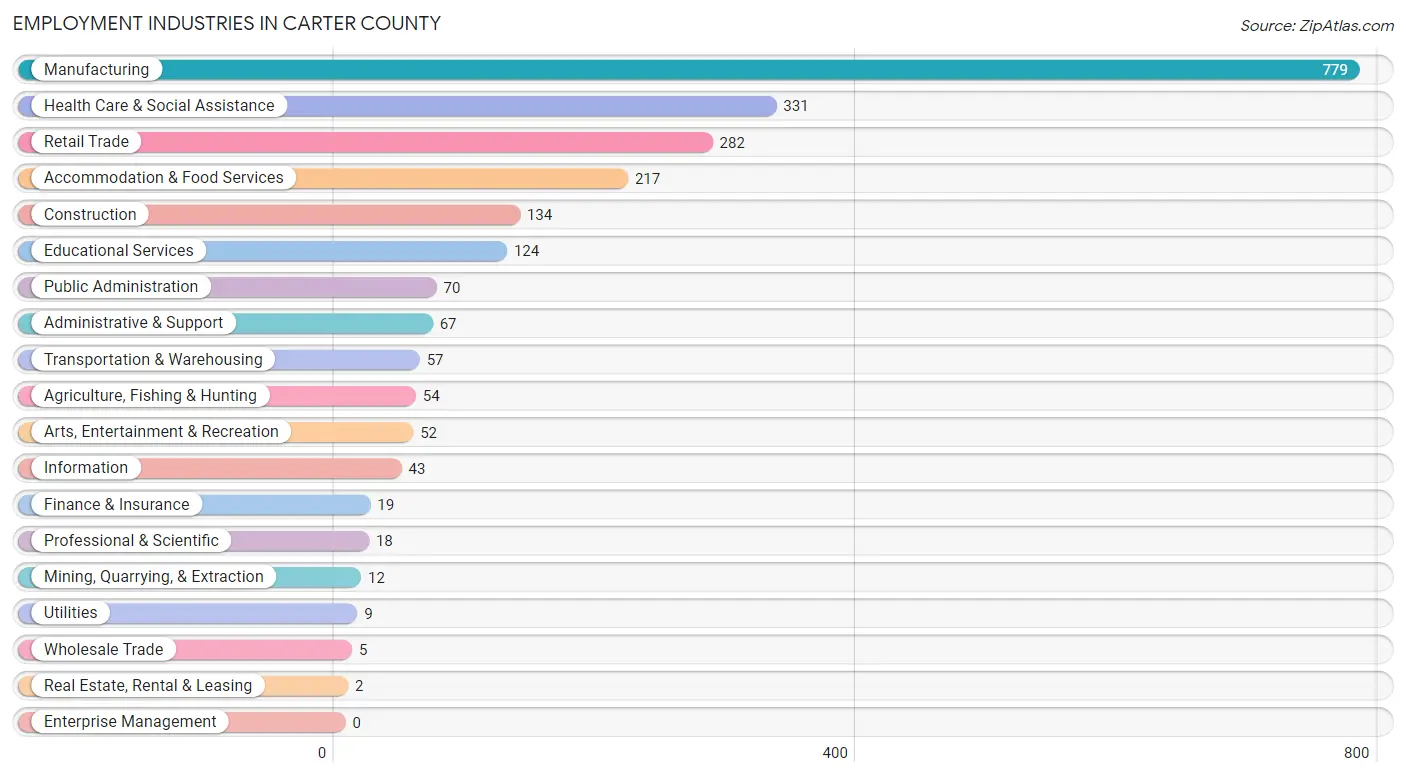
Employment Industries in Carter County
The major employment industries in Carter County include Manufacturing (779 | 33.7%), Health Care & Social Assistance (331 | 14.3%), Retail Trade (282 | 12.2%), Accommodation & Food Services (217 | 9.4%), and Construction (134 | 5.8%).
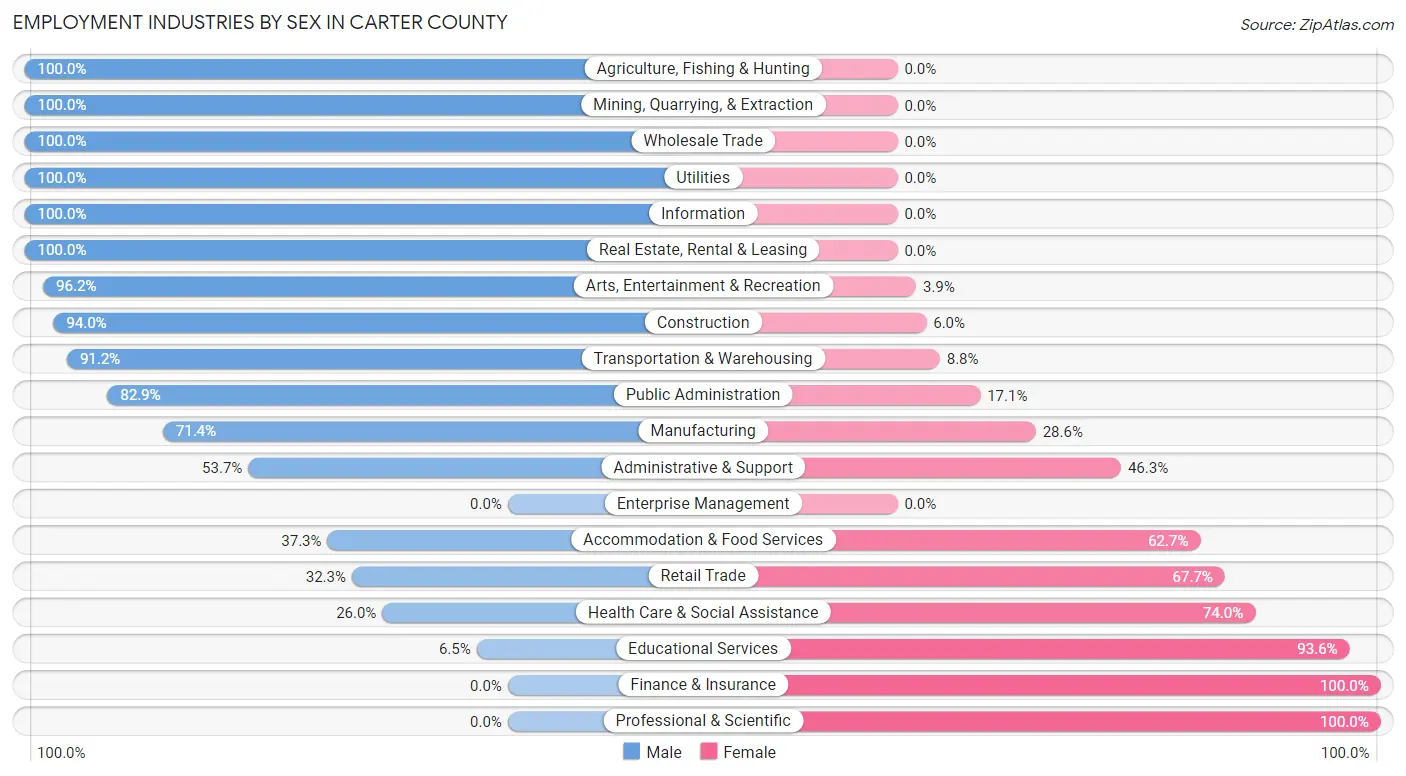
Employment Industries by Sex in Carter County
The Carter County industries that see more men than women are Agriculture, Fishing & Hunting (100.0%), Mining, Quarrying, & Extraction (100.0%), and Wholesale Trade (100.0%), whereas the industries that tend to have a higher number of women are Finance & Insurance (100.0%), Professional & Scientific (100.0%), and Educational Services (93.5%).
| Industry | Male | Female |
| Agriculture, Fishing & Hunting | 54 (100.0%) | 0 (0.0%) |
| Mining, Quarrying, & Extraction | 12 (100.0%) | 0 (0.0%) |
| Construction | 126 (94.0%) | 8 (6.0%) |
| Manufacturing | 556 (71.4%) | 223 (28.6%) |
| Wholesale Trade | 5 (100.0%) | 0 (0.0%) |
| Retail Trade | 91 (32.3%) | 191 (67.7%) |
| Transportation & Warehousing | 52 (91.2%) | 5 (8.8%) |
| Utilities | 9 (100.0%) | 0 (0.0%) |
| Information | 43 (100.0%) | 0 (0.0%) |
| Finance & Insurance | 0 (0.0%) | 19 (100.0%) |
| Real Estate, Rental & Leasing | 2 (100.0%) | 0 (0.0%) |
| Professional & Scientific | 0 (0.0%) | 18 (100.0%) |
| Enterprise Management | 0 (0.0%) | 0 (0.0%) |
| Administrative & Support | 36 (53.7%) | 31 (46.3%) |
| Educational Services | 8 (6.5%) | 116 (93.5%) |
| Health Care & Social Assistance | 86 (26.0%) | 245 (74.0%) |
| Arts, Entertainment & Recreation | 50 (96.2%) | 2 (3.8%) |
| Accommodation & Food Services | 81 (37.3%) | 136 (62.7%) |
| Public Administration | 58 (82.9%) | 12 (17.1%) |
| Total | 1,307 (56.5%) | 1,008 (43.5%) |
Education in Carter County
School Enrollment in Carter County
The most common levels of schooling among the 1,248 students in Carter County are high school (426 | 34.1%), middle school (286 | 22.9%), and elementary school (219 | 17.5%).
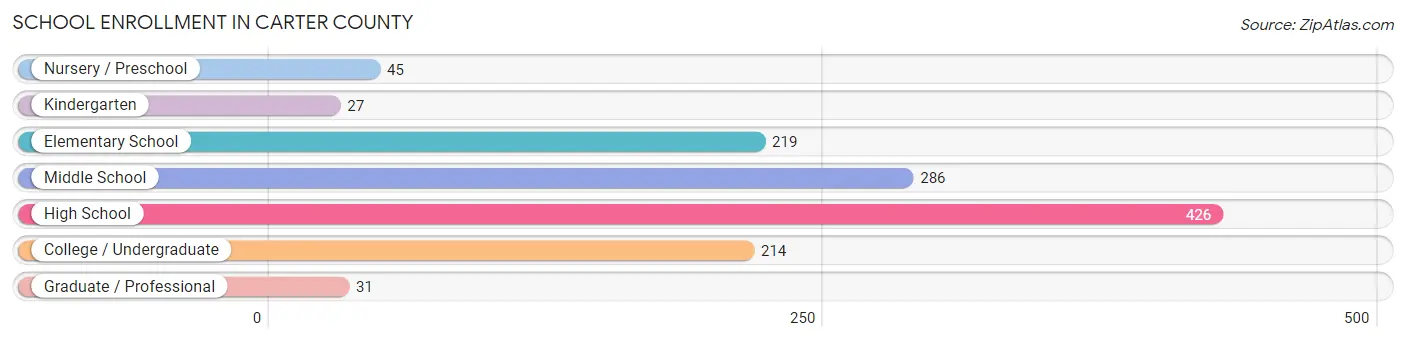
| School Level | # Students | % Students |
| Nursery / Preschool | 45 | 3.6% |
| Kindergarten | 27 | 2.2% |
| Elementary School | 219 | 17.5% |
| Middle School | 286 | 22.9% |
| High School | 426 | 34.1% |
| College / Undergraduate | 214 | 17.2% |
| Graduate / Professional | 31 | 2.5% |
| Total | 1,248 | 100.0% |
School Enrollment by Age by Funding Source in Carter County
Out of a total of 1,248 students who are enrolled in schools in Carter County, 149 (11.9%) attend a private institution, while the remaining 1,099 (88.1%) are enrolled in public schools. The age group of 18 to 19 year olds has the highest likelihood of being enrolled in private schools, with 107 (57.8% in the age bracket) enrolled. Conversely, the age group of 3 to 4 year olds has the lowest likelihood of being enrolled in a private school, with 40 (100.0% in the age bracket) attending a public institution.
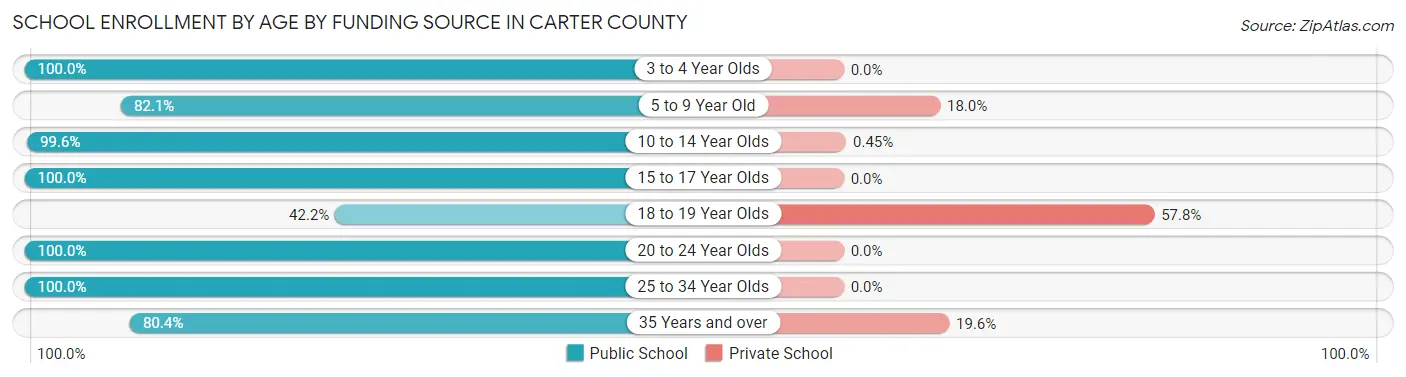
| Age Bracket | Public School | Private School |
| 3 to 4 Year Olds | 40 (100.0%) | 0 (0.0%) |
| 5 to 9 Year Old | 128 (82.1%) | 28 (17.9%) |
| 10 to 14 Year Olds | 441 (99.6%) | 2 (0.4%) |
| 15 to 17 Year Olds | 219 (100.0%) | 0 (0.0%) |
| 18 to 19 Year Olds | 78 (42.2%) | 107 (57.8%) |
| 20 to 24 Year Olds | 114 (100.0%) | 0 (0.0%) |
| 25 to 34 Year Olds | 35 (100.0%) | 0 (0.0%) |
| 35 Years and over | 45 (80.4%) | 11 (19.6%) |
| Total | 1,099 (88.1%) | 149 (11.9%) |
Educational Attainment by Field of Study in Carter County
Education (125 | 23.2%), business (123 | 22.8%), science & technology (117 | 21.7%), arts & humanities (92 | 17.1%), and communications (21 | 3.9%) are the most common fields of study among 539 individuals in Carter County who have obtained a bachelor's degree or higher.
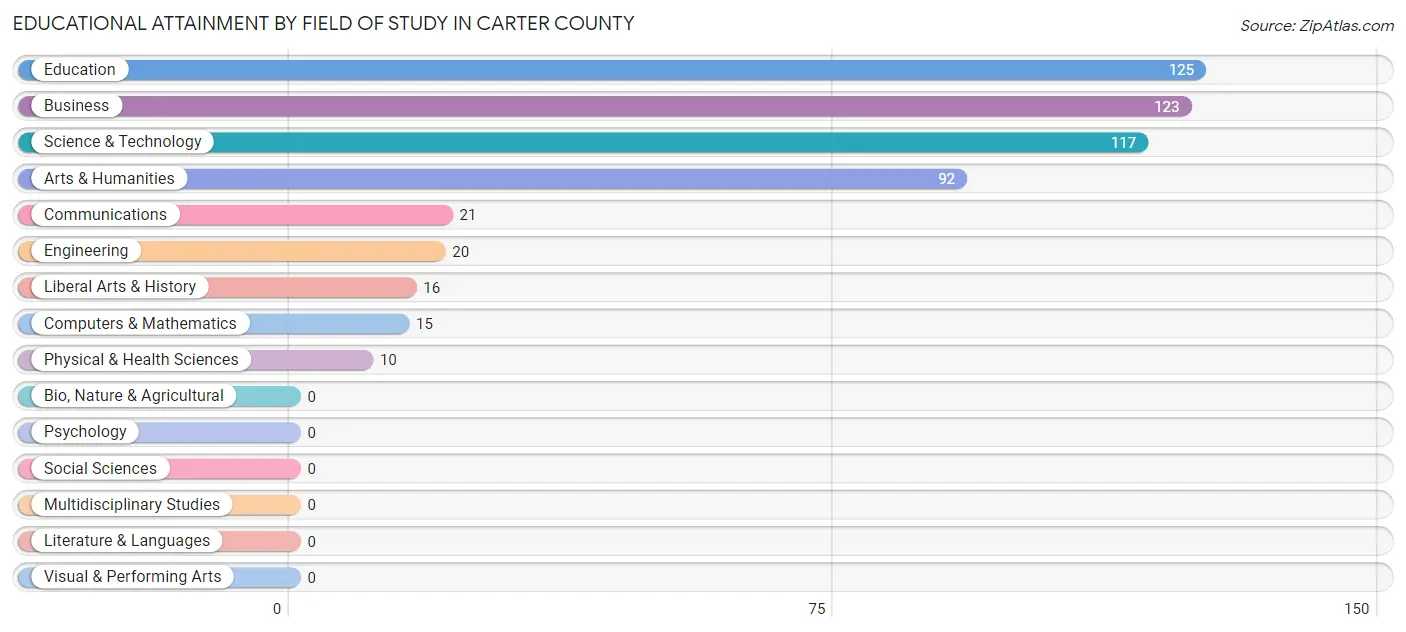
| Field of Study | # Graduates | % Graduates |
| Computers & Mathematics | 15 | 2.8% |
| Bio, Nature & Agricultural | 0 | 0.0% |
| Physical & Health Sciences | 10 | 1.9% |
| Psychology | 0 | 0.0% |
| Social Sciences | 0 | 0.0% |
| Engineering | 20 | 3.7% |
| Multidisciplinary Studies | 0 | 0.0% |
| Science & Technology | 117 | 21.7% |
| Business | 123 | 22.8% |
| Education | 125 | 23.2% |
| Literature & Languages | 0 | 0.0% |
| Liberal Arts & History | 16 | 3.0% |
| Visual & Performing Arts | 0 | 0.0% |
| Communications | 21 | 3.9% |
| Arts & Humanities | 92 | 17.1% |
| Total | 539 | 100.0% |
Transportation & Commute in Carter County
Vehicle Availability by Sex in Carter County
The most prevalent vehicle ownership categories in Carter County are males with 2 vehicles (351, accounting for 26.9%) and females with 2 vehicles (355, making up 34.8%).
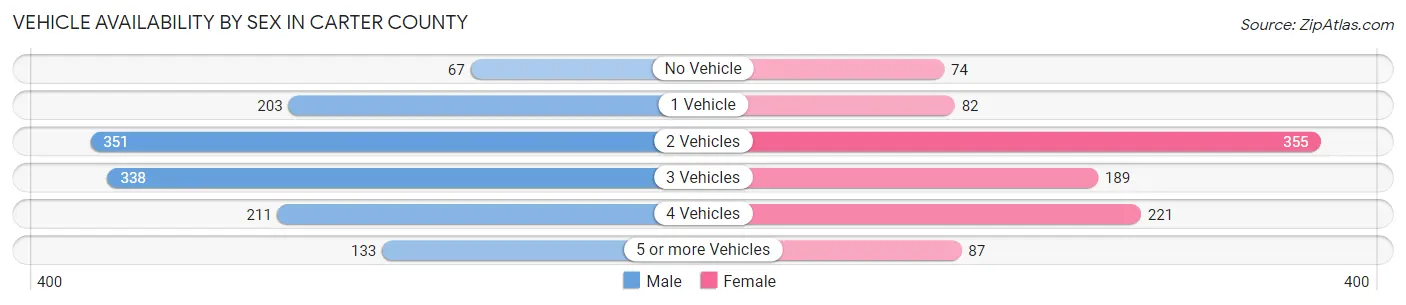
| Vehicles Available | Male | Female |
| No Vehicle | 67 (5.1%) | 74 (7.3%) |
| 1 Vehicle | 203 (15.6%) | 82 (8.1%) |
| 2 Vehicles | 351 (26.9%) | 355 (35.2%) |
| 3 Vehicles | 338 (25.9%) | 189 (18.8%) |
| 4 Vehicles | 211 (16.2%) | 221 (21.9%) |
| 5 or more Vehicles | 133 (10.2%) | 87 (8.6%) |
| Total | 1,303 (100.0%) | 1,008 (100.0%) |
Commute Time in Carter County
The most frequently occuring commute durations in Carter County are 5 to 9 minutes (333 commuters, 16.3%), 15 to 19 minutes (308 commuters, 15.1%), and less than 5 minutes (248 commuters, 12.2%).
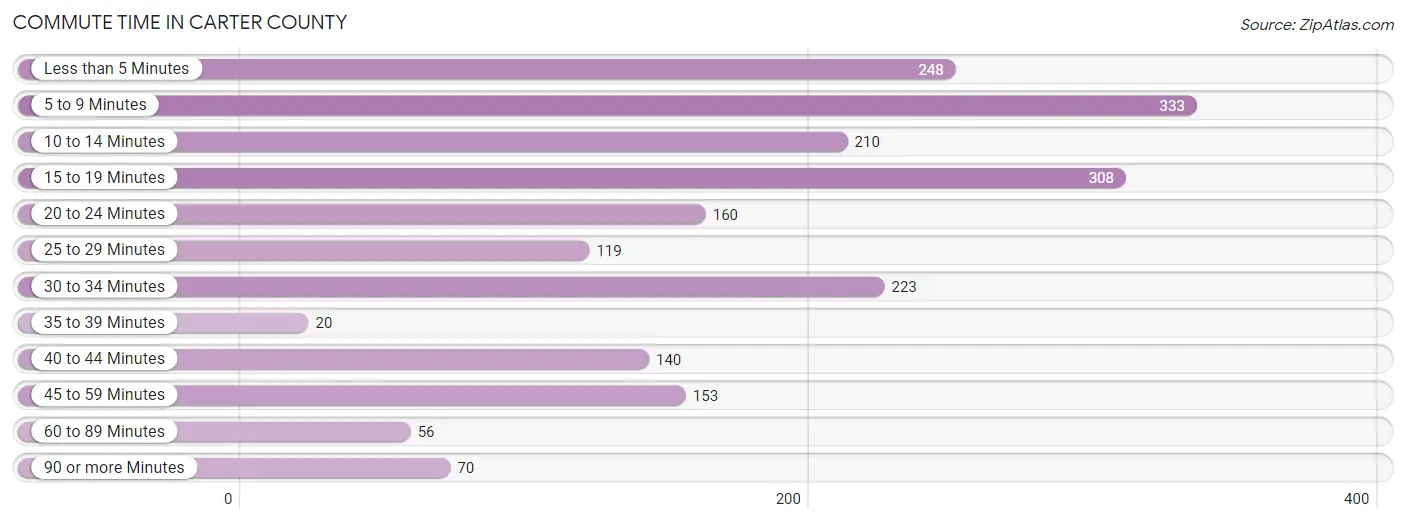
| Commute Time | # Commuters | % Commuters |
| Less than 5 Minutes | 248 | 12.2% |
| 5 to 9 Minutes | 333 | 16.3% |
| 10 to 14 Minutes | 210 | 10.3% |
| 15 to 19 Minutes | 308 | 15.1% |
| 20 to 24 Minutes | 160 | 7.8% |
| 25 to 29 Minutes | 119 | 5.8% |
| 30 to 34 Minutes | 223 | 10.9% |
| 35 to 39 Minutes | 20 | 1.0% |
| 40 to 44 Minutes | 140 | 6.9% |
| 45 to 59 Minutes | 153 | 7.5% |
| 60 to 89 Minutes | 56 | 2.8% |
| 90 or more Minutes | 70 | 3.4% |
Commute Time by Sex in Carter County
The most common commute times in Carter County are 5 to 9 minutes (251 commuters, 23.0%) for males and less than 5 minutes (208 commuters, 21.9%) for females.
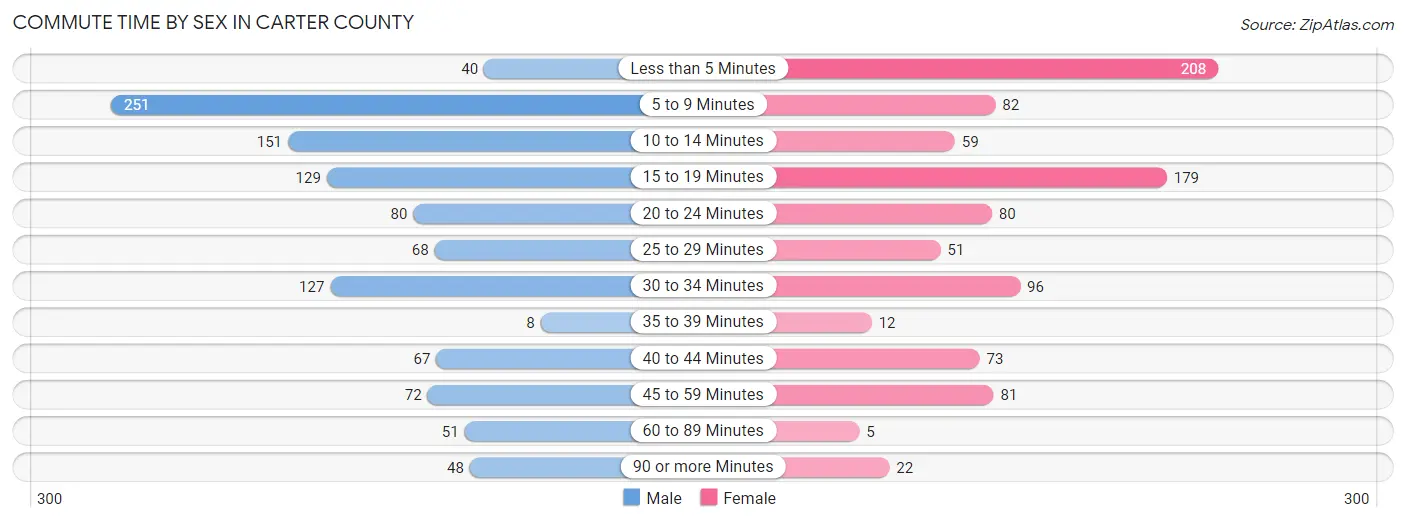
| Commute Time | Male | Female |
| Less than 5 Minutes | 40 (3.7%) | 208 (21.9%) |
| 5 to 9 Minutes | 251 (23.0%) | 82 (8.6%) |
| 10 to 14 Minutes | 151 (13.8%) | 59 (6.2%) |
| 15 to 19 Minutes | 129 (11.8%) | 179 (18.9%) |
| 20 to 24 Minutes | 80 (7.3%) | 80 (8.4%) |
| 25 to 29 Minutes | 68 (6.2%) | 51 (5.4%) |
| 30 to 34 Minutes | 127 (11.6%) | 96 (10.1%) |
| 35 to 39 Minutes | 8 (0.7%) | 12 (1.3%) |
| 40 to 44 Minutes | 67 (6.1%) | 73 (7.7%) |
| 45 to 59 Minutes | 72 (6.6%) | 81 (8.5%) |
| 60 to 89 Minutes | 51 (4.7%) | 5 (0.5%) |
| 90 or more Minutes | 48 (4.4%) | 22 (2.3%) |
Time of Departure to Work by Sex in Carter County
The most frequent times of departure to work in Carter County are 7:00 AM to 7:29 AM (212, 19.4%) for males and 7:00 AM to 7:29 AM (251, 26.5%) for females.
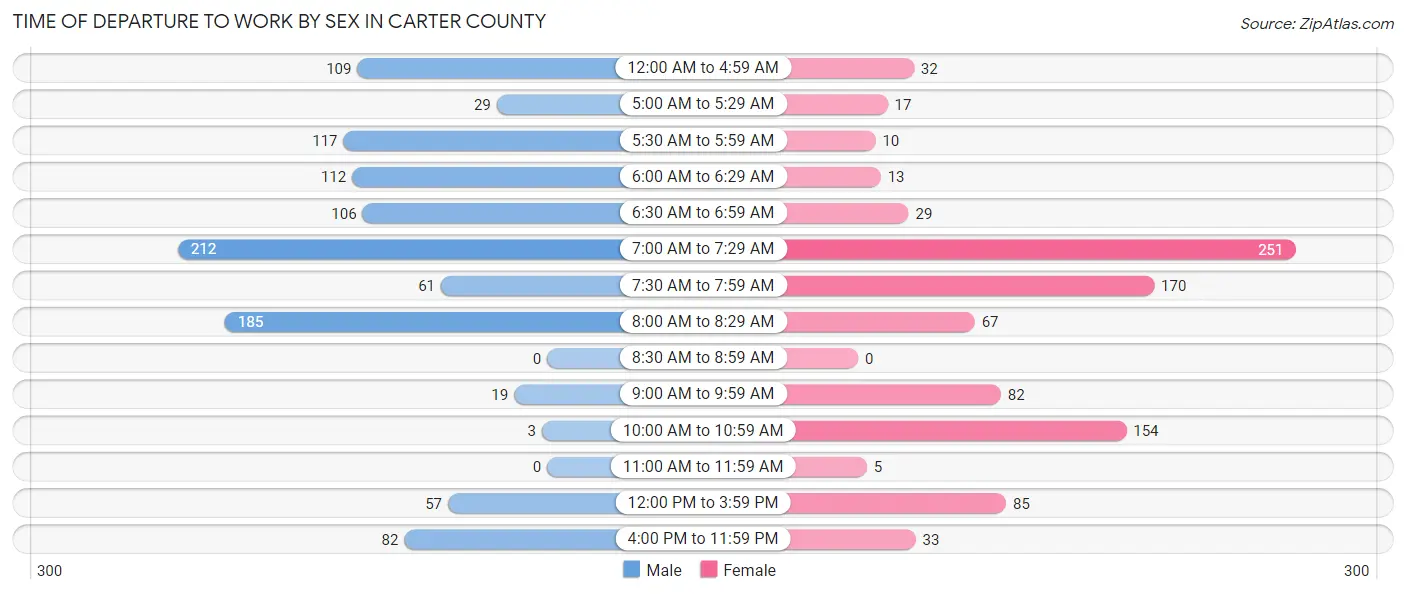
| Time of Departure | Male | Female |
| 12:00 AM to 4:59 AM | 109 (10.0%) | 32 (3.4%) |
| 5:00 AM to 5:29 AM | 29 (2.7%) | 17 (1.8%) |
| 5:30 AM to 5:59 AM | 117 (10.7%) | 10 (1.1%) |
| 6:00 AM to 6:29 AM | 112 (10.3%) | 13 (1.4%) |
| 6:30 AM to 6:59 AM | 106 (9.7%) | 29 (3.1%) |
| 7:00 AM to 7:29 AM | 212 (19.4%) | 251 (26.5%) |
| 7:30 AM to 7:59 AM | 61 (5.6%) | 170 (17.9%) |
| 8:00 AM to 8:29 AM | 185 (16.9%) | 67 (7.1%) |
| 8:30 AM to 8:59 AM | 0 (0.0%) | 0 (0.0%) |
| 9:00 AM to 9:59 AM | 19 (1.7%) | 82 (8.6%) |
| 10:00 AM to 10:59 AM | 3 (0.3%) | 154 (16.2%) |
| 11:00 AM to 11:59 AM | 0 (0.0%) | 5 (0.5%) |
| 12:00 PM to 3:59 PM | 57 (5.2%) | 85 (9.0%) |
| 4:00 PM to 11:59 PM | 82 (7.5%) | 33 (3.5%) |
| Total | 1,092 (100.0%) | 948 (100.0%) |
Housing Occupancy in Carter County
Occupancy by Ownership in Carter County
Of the total 1,925 dwellings in Carter County, owner-occupied units account for 1,335 (69.4%), while renter-occupied units make up 590 (30.6%).
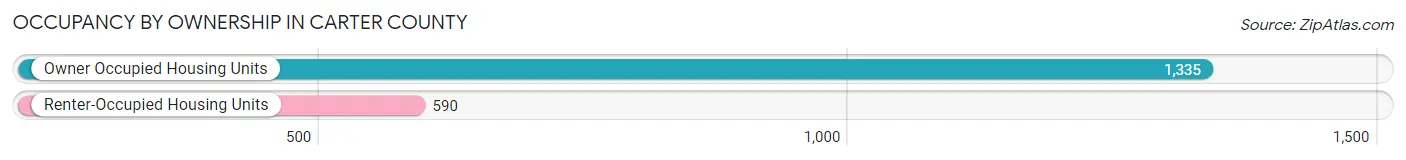
| Occupancy | # Housing Units | % Housing Units |
| Owner Occupied Housing Units | 1,335 | 69.4% |
| Renter-Occupied Housing Units | 590 | 30.6% |
| Total Occupied Housing Units | 1,925 | 100.0% |
Occupancy by Household Size in Carter County
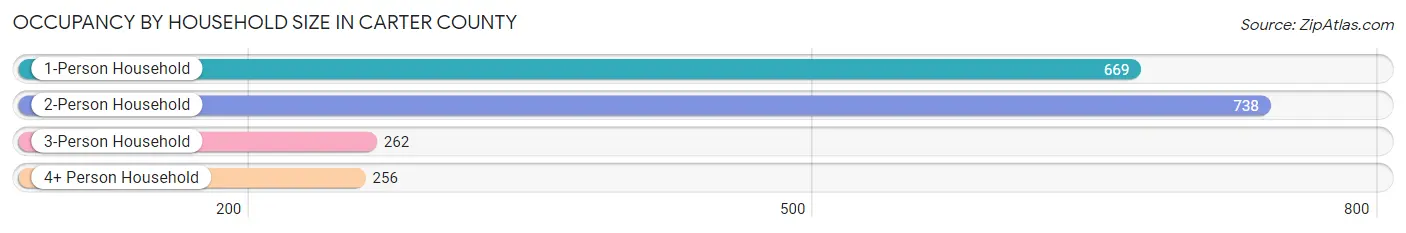
| Household Size | # Housing Units | % Housing Units |
| 1-Person Household | 669 | 34.7% |
| 2-Person Household | 738 | 38.3% |
| 3-Person Household | 262 | 13.6% |
| 4+ Person Household | 256 | 13.3% |
| Total Housing Units | 1,925 | 100.0% |
Occupancy by Ownership by Household Size in Carter County
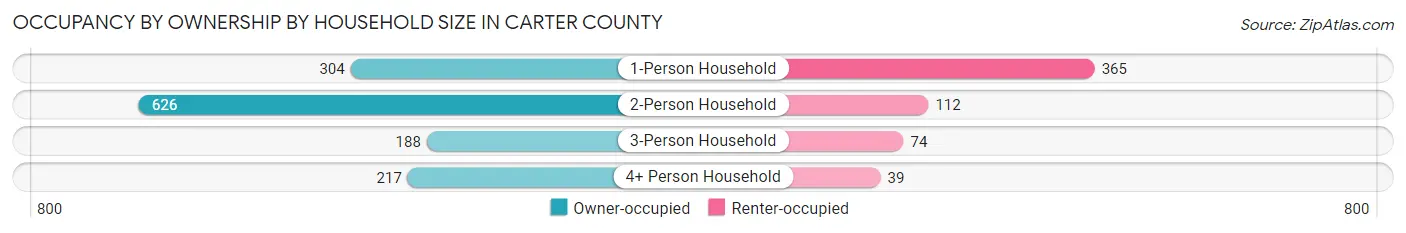
| Household Size | Owner-occupied | Renter-occupied |
| 1-Person Household | 304 (45.4%) | 365 (54.6%) |
| 2-Person Household | 626 (84.8%) | 112 (15.2%) |
| 3-Person Household | 188 (71.8%) | 74 (28.2%) |
| 4+ Person Household | 217 (84.8%) | 39 (15.2%) |
| Total Housing Units | 1,335 (69.4%) | 590 (30.6%) |
Occupancy by Educational Attainment in Carter County
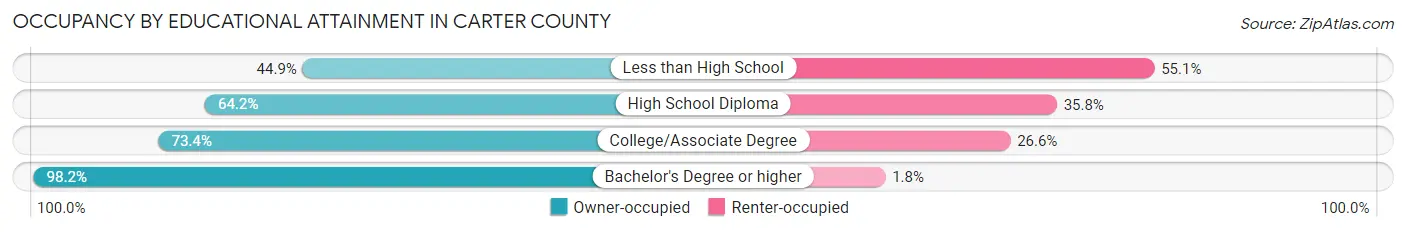
| Household Size | Owner-occupied | Renter-occupied |
| Less than High School | 153 (44.9%) | 188 (55.1%) |
| High School Diploma | 445 (64.2%) | 248 (35.8%) |
| College/Associate Degree | 409 (73.4%) | 148 (26.6%) |
| Bachelor's Degree or higher | 328 (98.2%) | 6 (1.8%) |
Occupancy by Age of Householder in Carter County
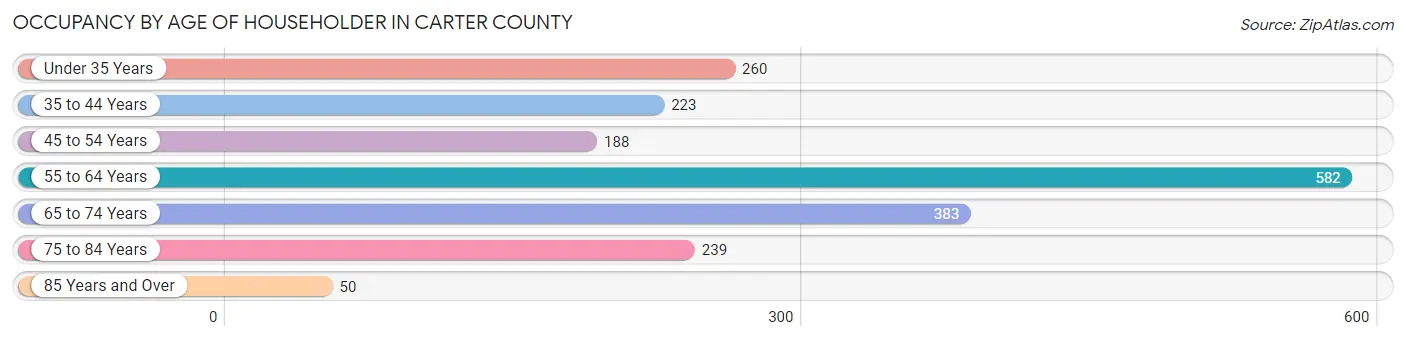
| Age Bracket | # Households | % Households |
| Under 35 Years | 260 | 13.5% |
| 35 to 44 Years | 223 | 11.6% |
| 45 to 54 Years | 188 | 9.8% |
| 55 to 64 Years | 582 | 30.2% |
| 65 to 74 Years | 383 | 19.9% |
| 75 to 84 Years | 239 | 12.4% |
| 85 Years and Over | 50 | 2.6% |
| Total | 1,925 | 100.0% |
Housing Finances in Carter County
Median Income by Occupancy in Carter County
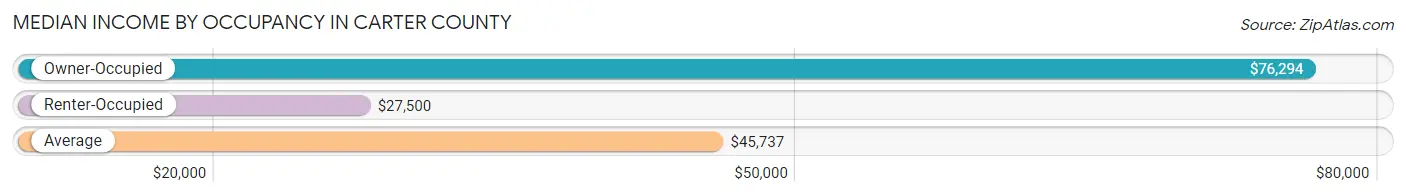
| Occupancy Type | # Households | Median Income |
| Owner-Occupied | 1,335 (69.4%) | $76,294 |
| Renter-Occupied | 590 (30.6%) | $27,500 |
| Average | 1,925 (100.0%) | $45,737 |
Occupancy by Householder Income Bracket in Carter County
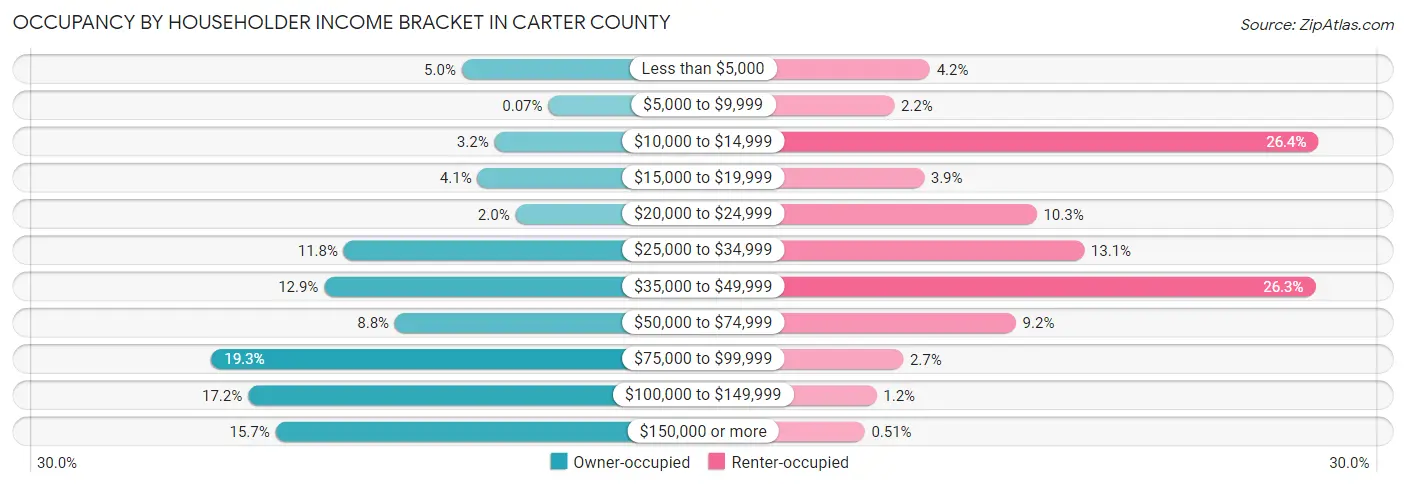
| Income Bracket | Owner-occupied | Renter-occupied |
| Less than $5,000 | 67 (5.0%) | 25 (4.2%) |
| $5,000 to $9,999 | 1 (0.1%) | 13 (2.2%) |
| $10,000 to $14,999 | 42 (3.2%) | 156 (26.4%) |
| $15,000 to $19,999 | 55 (4.1%) | 23 (3.9%) |
| $20,000 to $24,999 | 26 (1.9%) | 61 (10.3%) |
| $25,000 to $34,999 | 157 (11.8%) | 77 (13.1%) |
| $35,000 to $49,999 | 172 (12.9%) | 155 (26.3%) |
| $50,000 to $74,999 | 118 (8.8%) | 54 (9.1%) |
| $75,000 to $99,999 | 258 (19.3%) | 16 (2.7%) |
| $100,000 to $149,999 | 230 (17.2%) | 7 (1.2%) |
| $150,000 or more | 209 (15.7%) | 3 (0.5%) |
| Total | 1,335 (100.0%) | 590 (100.0%) |
Monthly Housing Cost Tiers in Carter County
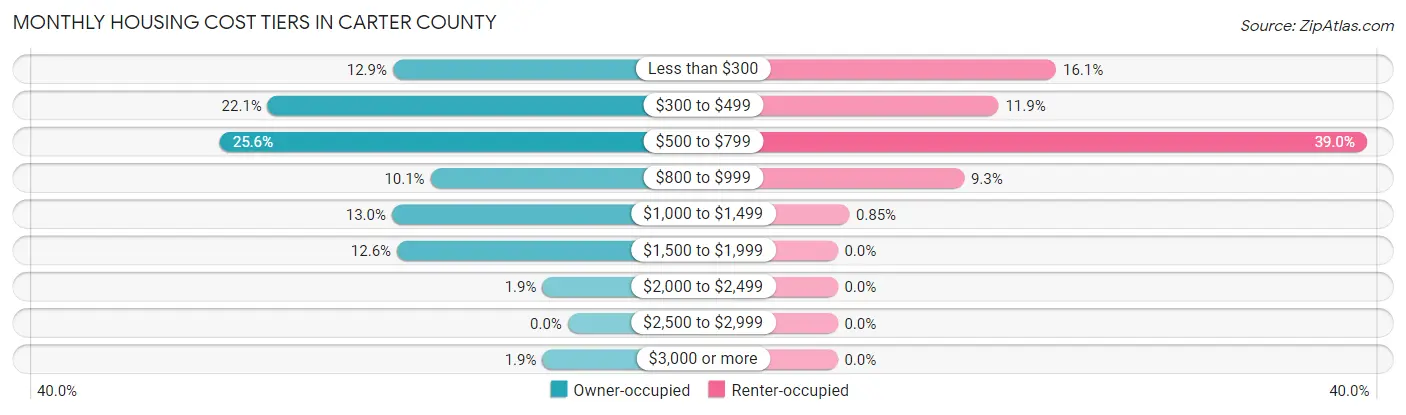
| Monthly Cost | Owner-occupied | Renter-occupied |
| Less than $300 | 172 (12.9%) | 95 (16.1%) |
| $300 to $499 | 295 (22.1%) | 70 (11.9%) |
| $500 to $799 | 342 (25.6%) | 230 (39.0%) |
| $800 to $999 | 135 (10.1%) | 55 (9.3%) |
| $1,000 to $1,499 | 173 (13.0%) | 5 (0.9%) |
| $1,500 to $1,999 | 168 (12.6%) | 0 (0.0%) |
| $2,000 to $2,499 | 25 (1.9%) | 0 (0.0%) |
| $2,500 to $2,999 | 0 (0.0%) | 0 (0.0%) |
| $3,000 or more | 25 (1.9%) | 0 (0.0%) |
| Total | 1,335 (100.0%) | 590 (100.0%) |
Physical Housing Characteristics in Carter County
Housing Structures in Carter County
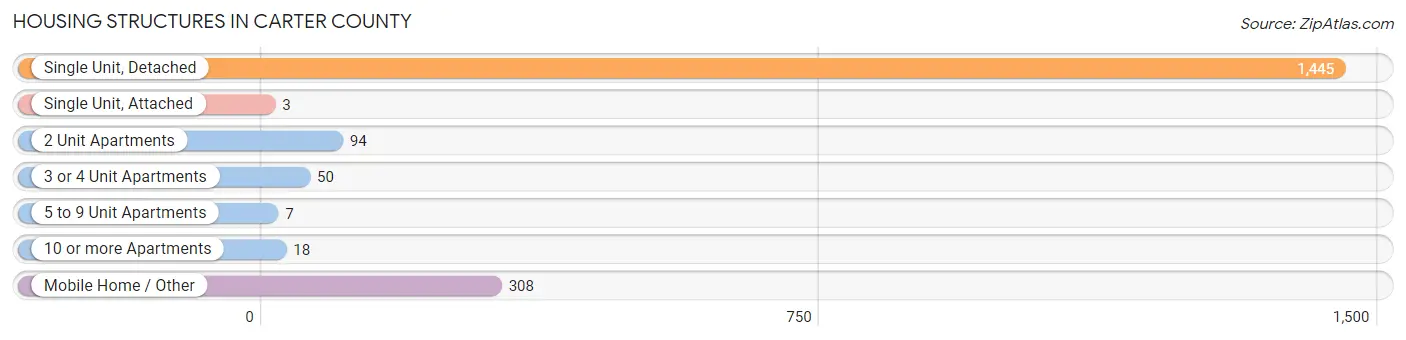
| Structure Type | # Housing Units | % Housing Units |
| Single Unit, Detached | 1,445 | 75.1% |
| Single Unit, Attached | 3 | 0.2% |
| 2 Unit Apartments | 94 | 4.9% |
| 3 or 4 Unit Apartments | 50 | 2.6% |
| 5 to 9 Unit Apartments | 7 | 0.4% |
| 10 or more Apartments | 18 | 0.9% |
| Mobile Home / Other | 308 | 16.0% |
| Total | 1,925 | 100.0% |
Housing Structures by Occupancy in Carter County
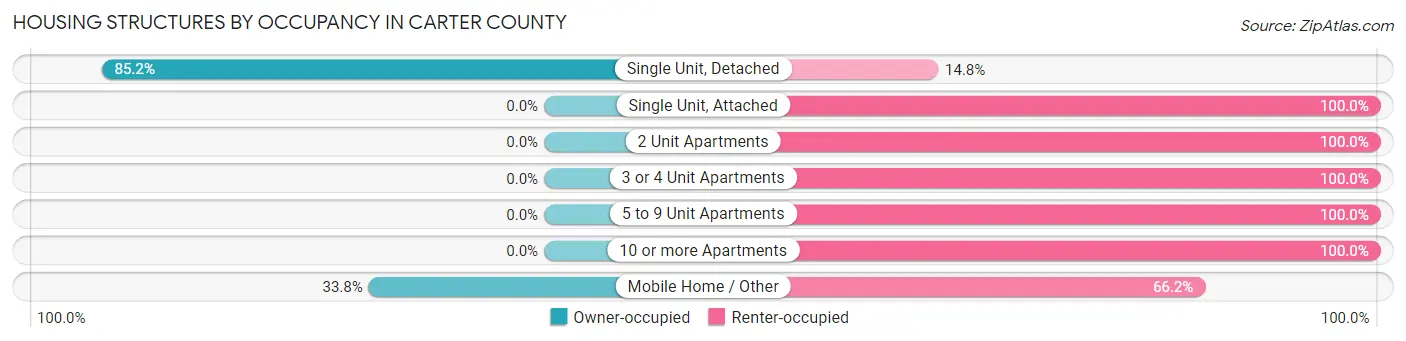
| Structure Type | Owner-occupied | Renter-occupied |
| Single Unit, Detached | 1,231 (85.2%) | 214 (14.8%) |
| Single Unit, Attached | 0 (0.0%) | 3 (100.0%) |
| 2 Unit Apartments | 0 (0.0%) | 94 (100.0%) |
| 3 or 4 Unit Apartments | 0 (0.0%) | 50 (100.0%) |
| 5 to 9 Unit Apartments | 0 (0.0%) | 7 (100.0%) |
| 10 or more Apartments | 0 (0.0%) | 18 (100.0%) |
| Mobile Home / Other | 104 (33.8%) | 204 (66.2%) |
| Total | 1,335 (69.4%) | 590 (30.6%) |
Housing Structures by Number of Rooms in Carter County
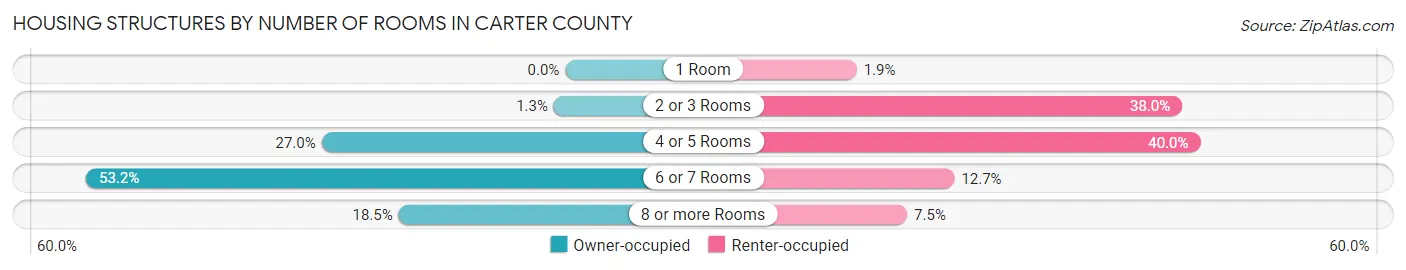
| Number of Rooms | Owner-occupied | Renter-occupied |
| 1 Room | 0 (0.0%) | 11 (1.9%) |
| 2 or 3 Rooms | 17 (1.3%) | 224 (38.0%) |
| 4 or 5 Rooms | 361 (27.0%) | 236 (40.0%) |
| 6 or 7 Rooms | 710 (53.2%) | 75 (12.7%) |
| 8 or more Rooms | 247 (18.5%) | 44 (7.5%) |
| Total | 1,335 (100.0%) | 590 (100.0%) |
Housing Structure by Heating Type in Carter County
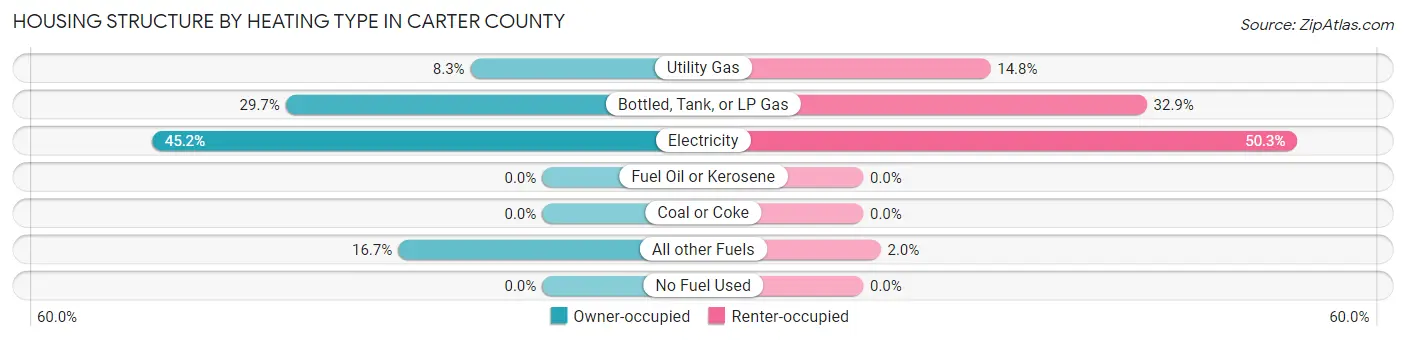
| Heating Type | Owner-occupied | Renter-occupied |
| Utility Gas | 111 (8.3%) | 87 (14.7%) |
| Bottled, Tank, or LP Gas | 397 (29.7%) | 194 (32.9%) |
| Electricity | 604 (45.2%) | 297 (50.3%) |
| Fuel Oil or Kerosene | 0 (0.0%) | 0 (0.0%) |
| Coal or Coke | 0 (0.0%) | 0 (0.0%) |
| All other Fuels | 223 (16.7%) | 12 (2.0%) |
| No Fuel Used | 0 (0.0%) | 0 (0.0%) |
| Total | 1,335 (100.0%) | 590 (100.0%) |
Household Vehicle Usage in Carter County
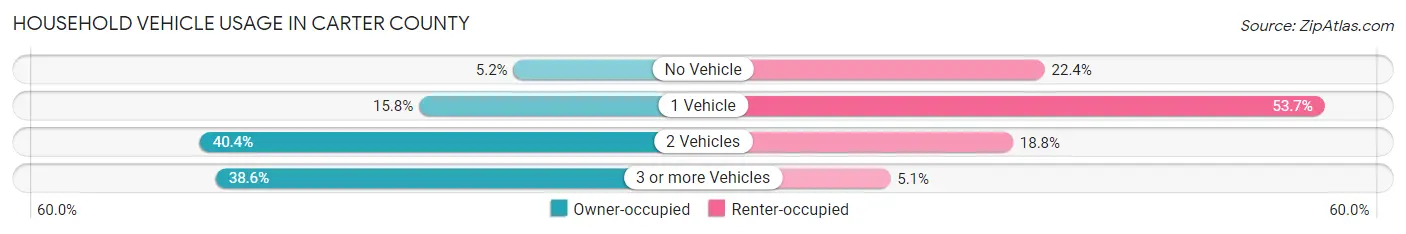
| Vehicles per Household | Owner-occupied | Renter-occupied |
| No Vehicle | 70 (5.2%) | 132 (22.4%) |
| 1 Vehicle | 211 (15.8%) | 317 (53.7%) |
| 2 Vehicles | 539 (40.4%) | 111 (18.8%) |
| 3 or more Vehicles | 515 (38.6%) | 30 (5.1%) |
| Total | 1,335 (100.0%) | 590 (100.0%) |
Real Estate & Mortgages in Carter County
Real Estate and Mortgage Overview in Carter County
| Characteristic | Without Mortgage | With Mortgage |
| Housing Units | 715 | 620 |
| Median Property Value | $196,700 | $172,900 |
| Median Household Income | $76,208 | $82 |
| Monthly Housing Costs | $449 | $21 |
| Real Estate Taxes | $596 | $11 |
Property Value by Mortgage Status in Carter County
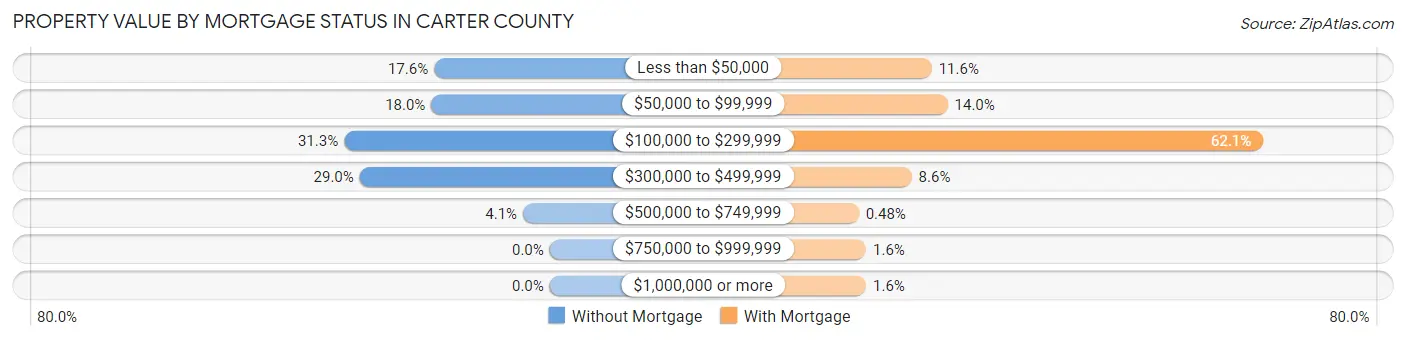
| Property Value | Without Mortgage | With Mortgage |
| Less than $50,000 | 126 (17.6%) | 72 (11.6%) |
| $50,000 to $99,999 | 129 (18.0%) | 87 (14.0%) |
| $100,000 to $299,999 | 224 (31.3%) | 385 (62.1%) |
| $300,000 to $499,999 | 207 (28.9%) | 53 (8.6%) |
| $500,000 to $749,999 | 29 (4.1%) | 3 (0.5%) |
| $750,000 to $999,999 | 0 (0.0%) | 10 (1.6%) |
| $1,000,000 or more | 0 (0.0%) | 10 (1.6%) |
| Total | 715 (100.0%) | 620 (100.0%) |
Household Income by Mortgage Status in Carter County
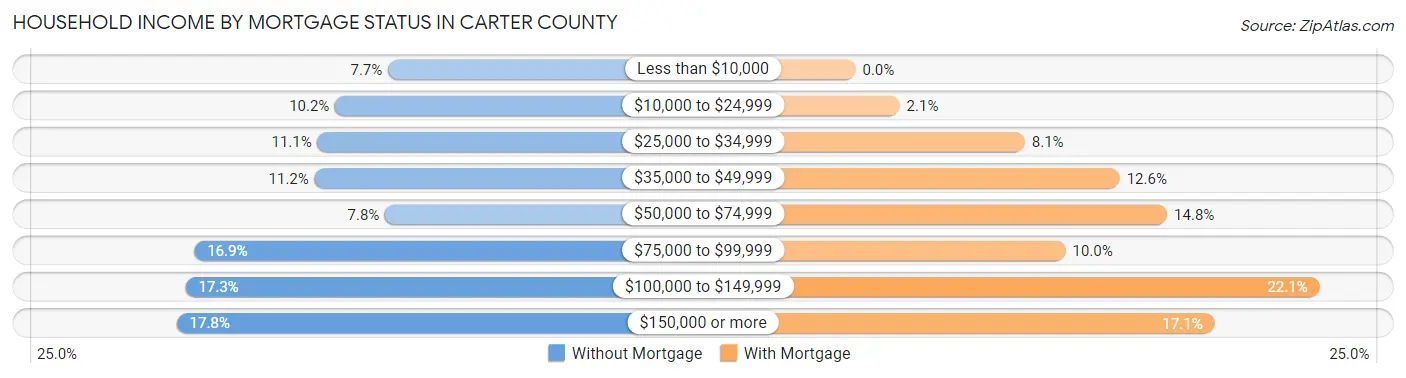
| Household Income | Without Mortgage | With Mortgage |
| Less than $10,000 | 55 (7.7%) | 0 (0.0%) |
| $10,000 to $24,999 | 73 (10.2%) | 13 (2.1%) |
| $25,000 to $34,999 | 79 (11.1%) | 50 (8.1%) |
| $35,000 to $49,999 | 80 (11.2%) | 78 (12.6%) |
| $50,000 to $74,999 | 56 (7.8%) | 92 (14.8%) |
| $75,000 to $99,999 | 121 (16.9%) | 62 (10.0%) |
| $100,000 to $149,999 | 124 (17.3%) | 137 (22.1%) |
| $150,000 or more | 127 (17.8%) | 106 (17.1%) |
| Total | 715 (100.0%) | 620 (100.0%) |
Property Value to Household Income Ratio in Carter County
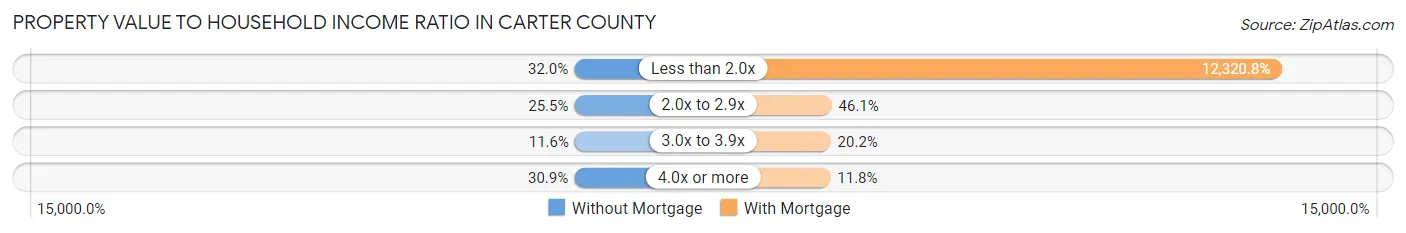
| Value-to-Income Ratio | Without Mortgage | With Mortgage |
| Less than 2.0x | 229 (32.0%) | 76,389 (12,320.8%) |
| 2.0x to 2.9x | 182 (25.5%) | 286 (46.1%) |
| 3.0x to 3.9x | 83 (11.6%) | 125 (20.2%) |
| 4.0x or more | 221 (30.9%) | 73 (11.8%) |
| Total | 715 (100.0%) | 620 (100.0%) |
Real Estate Taxes by Mortgage Status in Carter County
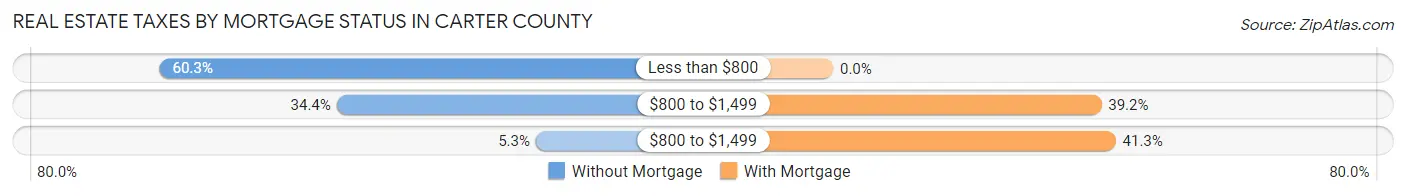
| Property Taxes | Without Mortgage | With Mortgage |
| Less than $800 | 431 (60.3%) | 0 (0.0%) |
| $800 to $1,499 | 246 (34.4%) | 243 (39.2%) |
| $800 to $1,499 | 38 (5.3%) | 256 (41.3%) |
| Total | 715 (100.0%) | 620 (100.0%) |
Health & Disability in Carter County
Health Insurance Coverage by Age in Carter County
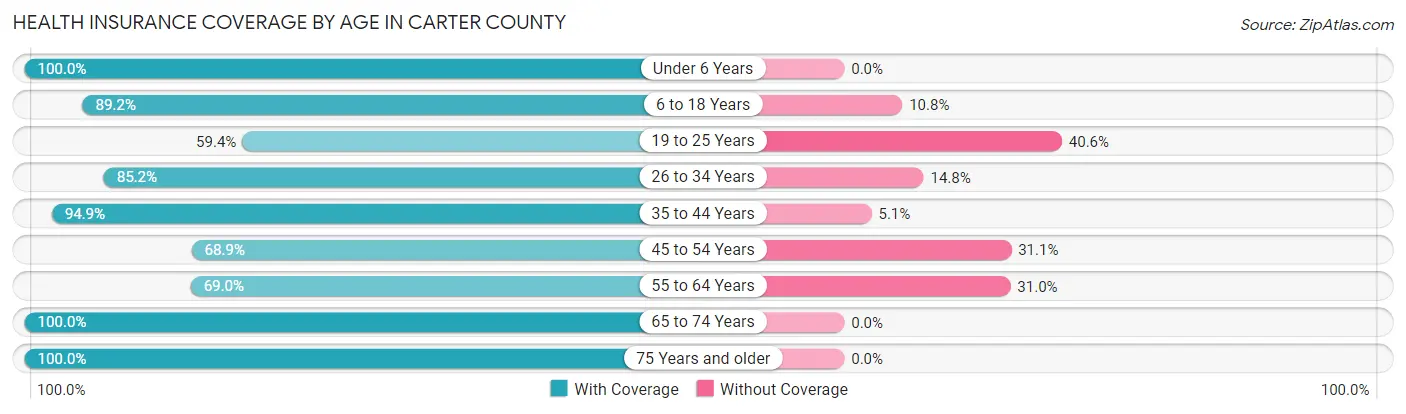
| Age Bracket | With Coverage | Without Coverage |
| Under 6 Years | 360 (100.0%) | 0 (0.0%) |
| 6 to 18 Years | 792 (89.2%) | 96 (10.8%) |
| 19 to 25 Years | 293 (59.4%) | 200 (40.6%) |
| 26 to 34 Years | 369 (85.2%) | 64 (14.8%) |
| 35 to 44 Years | 542 (94.9%) | 29 (5.1%) |
| 45 to 54 Years | 396 (68.9%) | 179 (31.1%) |
| 55 to 64 Years | 615 (69.0%) | 276 (31.0%) |
| 65 to 74 Years | 613 (100.0%) | 0 (0.0%) |
| 75 Years and older | 427 (100.0%) | 0 (0.0%) |
| Total | 4,407 (83.9%) | 844 (16.1%) |
Health Insurance Coverage by Citizenship Status in Carter County
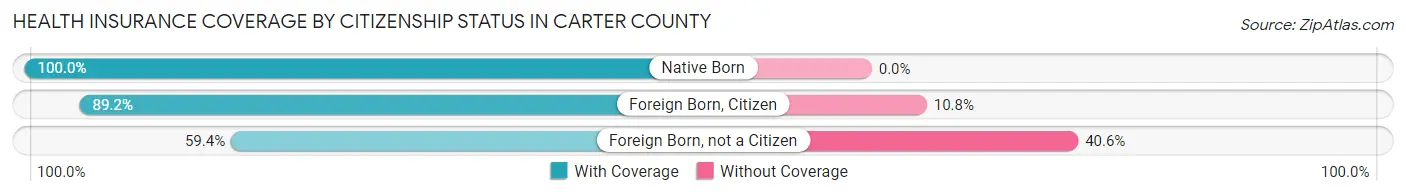
| Citizenship Status | With Coverage | Without Coverage |
| Native Born | 360 (100.0%) | 0 (0.0%) |
| Foreign Born, Citizen | 792 (89.2%) | 96 (10.8%) |
| Foreign Born, not a Citizen | 293 (59.4%) | 200 (40.6%) |
Health Insurance Coverage by Household Income in Carter County
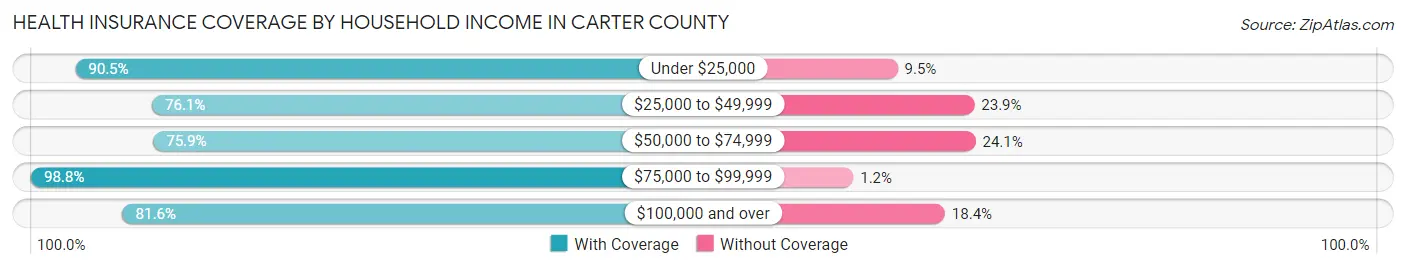
| Household Income | With Coverage | Without Coverage |
| Under $25,000 | 779 (90.5%) | 82 (9.5%) |
| $25,000 to $49,999 | 1,092 (76.1%) | 343 (23.9%) |
| $50,000 to $74,999 | 390 (75.9%) | 124 (24.1%) |
| $75,000 to $99,999 | 893 (98.8%) | 11 (1.2%) |
| $100,000 and over | 1,252 (81.6%) | 282 (18.4%) |
Public vs Private Health Insurance Coverage by Age in Carter County
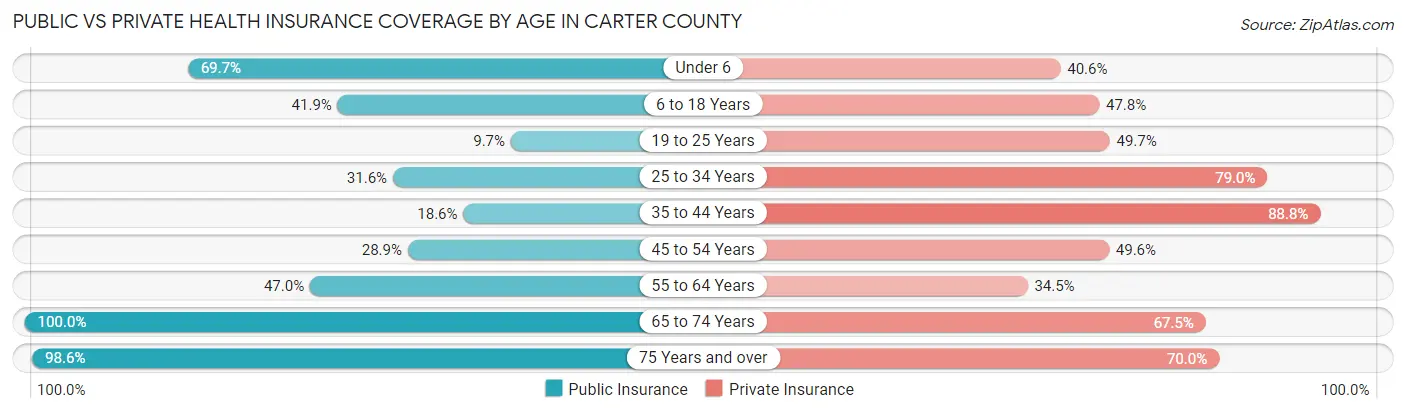
| Age Bracket | Public Insurance | Private Insurance |
| Under 6 | 251 (69.7%) | 146 (40.6%) |
| 6 to 18 Years | 372 (41.9%) | 424 (47.7%) |
| 19 to 25 Years | 48 (9.7%) | 245 (49.7%) |
| 25 to 34 Years | 137 (31.6%) | 342 (79.0%) |
| 35 to 44 Years | 106 (18.6%) | 507 (88.8%) |
| 45 to 54 Years | 166 (28.9%) | 285 (49.6%) |
| 55 to 64 Years | 419 (47.0%) | 307 (34.5%) |
| 65 to 74 Years | 613 (100.0%) | 414 (67.5%) |
| 75 Years and over | 421 (98.6%) | 299 (70.0%) |
| Total | 2,533 (48.2%) | 2,969 (56.5%) |
Disability Status by Sex by Age in Carter County
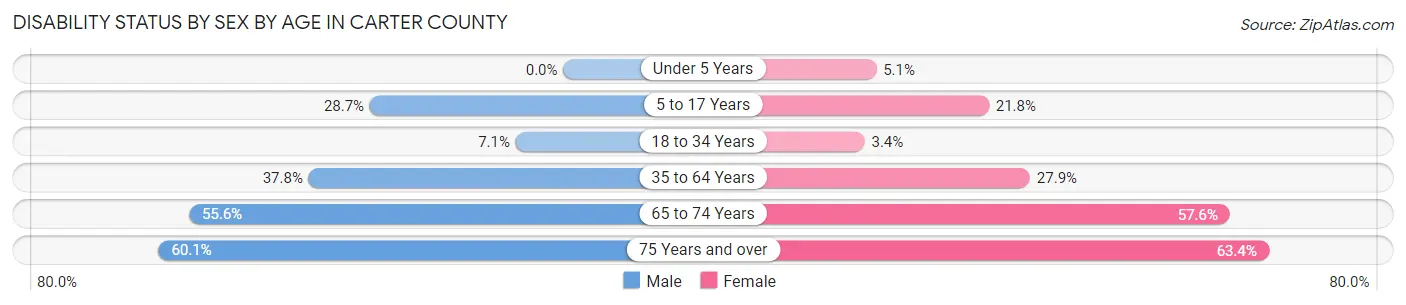
| Age Bracket | Male | Female |
| Under 5 Years | 0 (0.0%) | 9 (5.1%) |
| 5 to 17 Years | 112 (28.7%) | 98 (21.8%) |
| 18 to 34 Years | 38 (7.1%) | 16 (3.4%) |
| 35 to 64 Years | 383 (37.8%) | 286 (27.9%) |
| 65 to 74 Years | 169 (55.6%) | 178 (57.6%) |
| 75 Years and over | 104 (60.1%) | 161 (63.4%) |
Disability Class by Sex by Age in Carter County
Disability Class: Hearing Difficulty
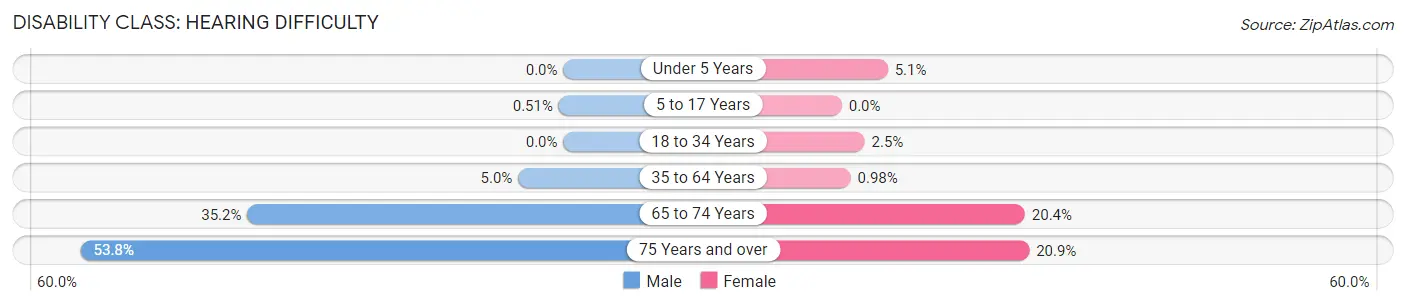
| Age Bracket | Male | Female |
| Under 5 Years | 0 (0.0%) | 9 (5.1%) |
| 5 to 17 Years | 2 (0.5%) | 0 (0.0%) |
| 18 to 34 Years | 0 (0.0%) | 12 (2.5%) |
| 35 to 64 Years | 51 (5.0%) | 10 (1.0%) |
| 65 to 74 Years | 107 (35.2%) | 63 (20.4%) |
| 75 Years and over | 93 (53.8%) | 53 (20.9%) |
Disability Class: Vision Difficulty
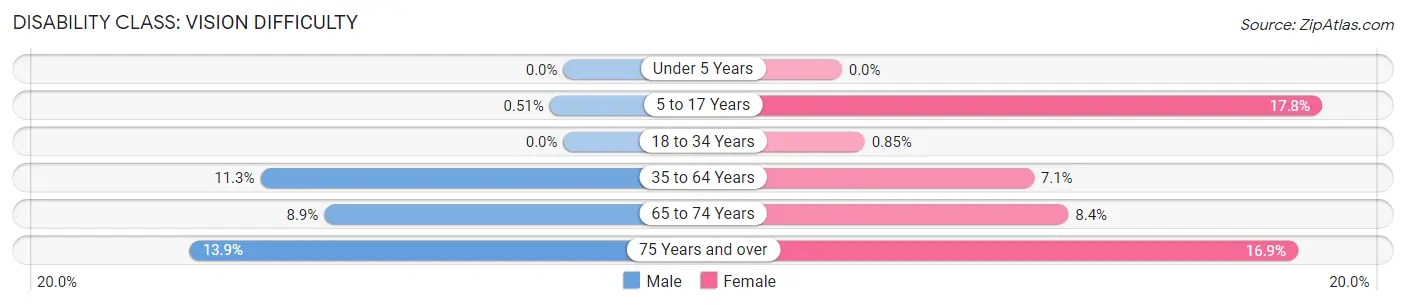
| Age Bracket | Male | Female |
| Under 5 Years | 0 (0.0%) | 0 (0.0%) |
| 5 to 17 Years | 2 (0.5%) | 80 (17.8%) |
| 18 to 34 Years | 0 (0.0%) | 4 (0.9%) |
| 35 to 64 Years | 114 (11.3%) | 73 (7.1%) |
| 65 to 74 Years | 27 (8.9%) | 26 (8.4%) |
| 75 Years and over | 24 (13.9%) | 43 (16.9%) |
Disability Class: Cognitive Difficulty
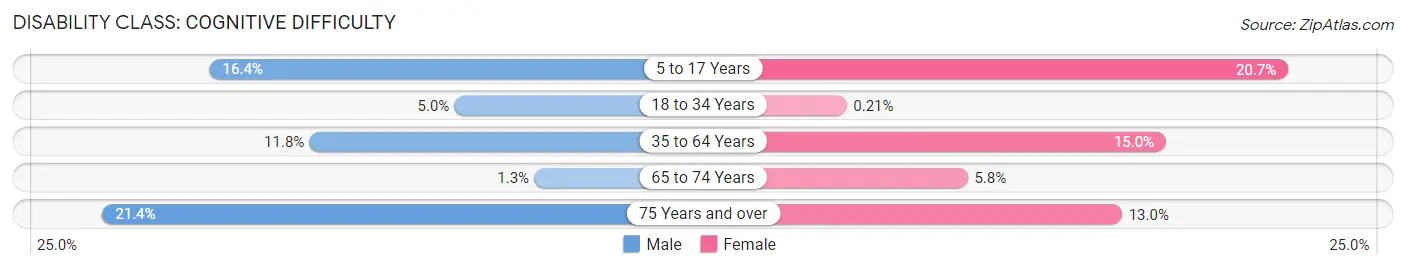
| Age Bracket | Male | Female |
| 5 to 17 Years | 64 (16.4%) | 93 (20.7%) |
| 18 to 34 Years | 27 (5.0%) | 1 (0.2%) |
| 35 to 64 Years | 119 (11.7%) | 154 (15.0%) |
| 65 to 74 Years | 4 (1.3%) | 18 (5.8%) |
| 75 Years and over | 37 (21.4%) | 33 (13.0%) |
Disability Class: Ambulatory Difficulty
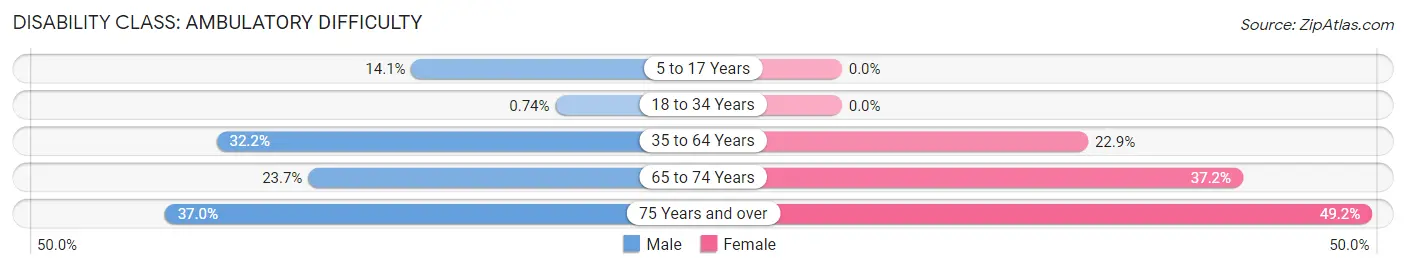
| Age Bracket | Male | Female |
| 5 to 17 Years | 55 (14.1%) | 0 (0.0%) |
| 18 to 34 Years | 4 (0.7%) | 0 (0.0%) |
| 35 to 64 Years | 326 (32.2%) | 234 (22.9%) |
| 65 to 74 Years | 72 (23.7%) | 115 (37.2%) |
| 75 Years and over | 64 (37.0%) | 125 (49.2%) |
Disability Class: Self-Care Difficulty
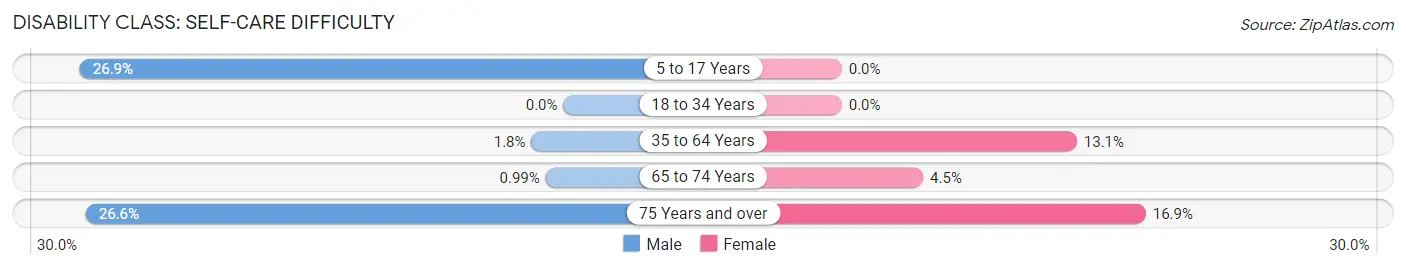
| Age Bracket | Male | Female |
| 5 to 17 Years | 105 (26.9%) | 0 (0.0%) |
| 18 to 34 Years | 0 (0.0%) | 0 (0.0%) |
| 35 to 64 Years | 18 (1.8%) | 134 (13.1%) |
| 65 to 74 Years | 3 (1.0%) | 14 (4.5%) |
| 75 Years and over | 46 (26.6%) | 43 (16.9%) |
Technology Access in Carter County
Computing Device Access in Carter County
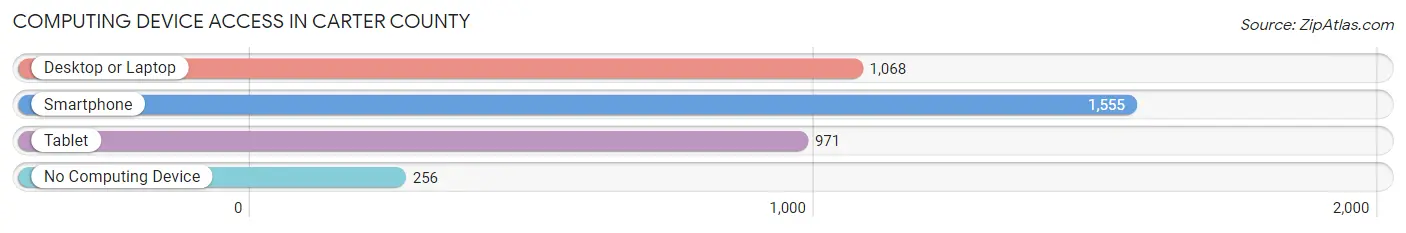
| Device Type | # Households | % Households |
| Desktop or Laptop | 1,068 | 55.5% |
| Smartphone | 1,555 | 80.8% |
| Tablet | 971 | 50.4% |
| No Computing Device | 256 | 13.3% |
| Total | 1,925 | 100.0% |
Internet Access in Carter County
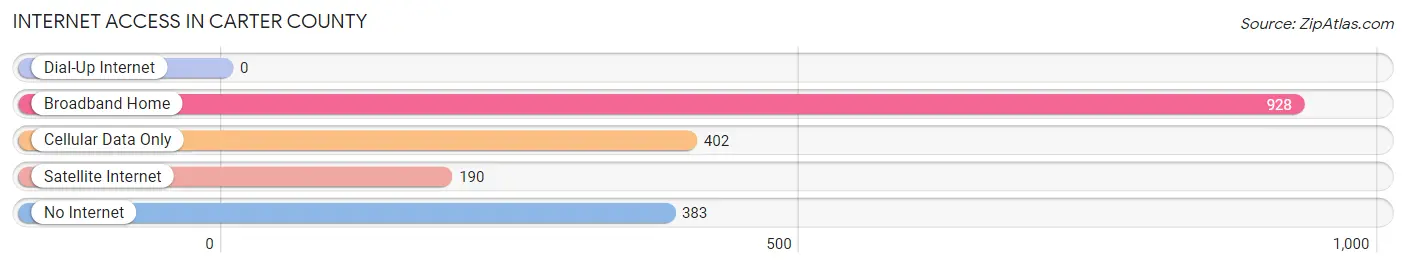
| Internet Type | # Households | % Households |
| Dial-Up Internet | 0 | 0.0% |
| Broadband Home | 928 | 48.2% |
| Cellular Data Only | 402 | 20.9% |
| Satellite Internet | 190 | 9.9% |
| No Internet | 383 | 19.9% |
| Total | 1,925 | 100.0% |
Carter County Summary
County History
Carter County is located in the southeastern corner of Missouri and is part of the Ozark Plateau. It was established in 1859 and named after Zimri A. Carter, a prominent local politician. The county was originally part of Ripley County, but was split off in 1859 due to its large population.
The first settlers in the area were Native Americans, who lived in the area for thousands of years before the arrival of Europeans. The first Europeans to settle in the area were French trappers and traders, who arrived in the late 1700s. The area was then part of the Louisiana Purchase, and was part of the Missouri Territory until 1821, when it became part of the state of Missouri.
The county was largely rural until the early 1900s, when the timber industry began to boom. The timber industry brought jobs and economic growth to the area, and the population began to grow rapidly. The county seat, Van Buren, was established in 1859 and is the oldest town in the county.
The county was largely agricultural until the 1950s, when the timber industry began to decline. The county then shifted to a more diversified economy, with manufacturing, tourism, and other industries becoming more important.
Geography
Carter County is located in the southeastern corner of Missouri and is part of the Ozark Plateau. It is bordered by Ripley County to the north, Shannon County to the east, Oregon County to the south, and Howell County to the west. The county covers an area of 576 square miles and is mostly rural, with only a few small towns and villages.
The terrain of the county is mostly hilly and forested, with some areas of flat land. The highest point in the county is Pilot Knob, which has an elevation of 1,072 feet. The county is drained by the Current River, which flows through the county from north to south.
Economy
Carter County has a diversified economy, with manufacturing, tourism, and other industries playing an important role. The county is home to several manufacturing companies, including a furniture factory, a plastics factory, and a metal fabrication plant.
Tourism is also an important part of the economy, with the Current River and the Mark Twain National Forest providing recreational opportunities for visitors. The county is also home to several state parks, including Big Spring State Park and Echo Bluff State Park.
Demographics
As of the 2010 census, Carter County had a population of 6,265. The population was spread out, with 28.3% under the age of 18, 8.2% from 18 to 24, 28.3% from 25 to 44, 22.2% from 45 to 64, and 12.9% who were 65 years of age or older. The median age was 37.4 years.
The racial makeup of the county was 97.2% White, 0.7% African American, 0.3% Native American, 0.2% Asian, 0.1% Pacific Islander, 0.3% from other races, and 1.2% from two or more races. Hispanic or Latino of any race were 1.2% of the population.
The median income for a household in the county was $30,938, and the median income for a family was $37,917. The per capita income for the county was $16,845. About 17.2% of families and 21.2% of the population were below the poverty line, including 28.2% of those under age 18 and 14.2% of those age 65 or over.
Common Questions
What is Per Capita Income in Carter County?
Per Capita income in Carter County is $27,150.
What is the Median Family Income in Carter County?
Median Family Income in Carter County is $77,281.
What is the Median Household income in Carter County?
Median Household Income in Carter County is $45,737.
What is Income or Wage Gap in Carter County?
Income or Wage Gap in Carter County is 36.0%.
Women in Carter County earn 64.0 cents for every dollar earned by a man.
What is Family Income Deficit in Carter County?
Family Income Deficit in Carter County is $8,492.
Families that are below poverty line in Carter County earn $8,492 less on average than the poverty threshold level.
What is Inequality or Gini Index in Carter County?
Inequality or Gini Index in Carter County is 0.45.
What is the Total Population of Carter County?
Total Population of Carter County is 5,299.
What is the Total Male Population of Carter County?
Total Male Population of Carter County is 2,591.
What is the Total Female Population of Carter County?
Total Female Population of Carter County is 2,708.
What is the Ratio of Males per 100 Females in Carter County?
There are 95.68 Males per 100 Females in Carter County.
What is the Ratio of Females per 100 Males in Carter County?
There are 104.52 Females per 100 Males in Carter County.
What is the Median Population Age in Carter County?
Median Population Age in Carter County is 42.0 Years.
What is the Average Family Size in Carter County
Average Family Size in Carter County is 3.5 People.
What is the Average Household Size in Carter County
Average Household Size in Carter County is 2.7 People.
How Large is the Labor Force in Carter County?
There are 2,357 People in the Labor Forcein in Carter County.
What is the Percentage of People in the Labor Force in Carter County?
54.5% of People are in the Labor Force in Carter County.
What is the Unemployment Rate in Carter County?
Unemployment Rate in Carter County is 1.2%.