Cape Girardeau County, MO Map & Demographics
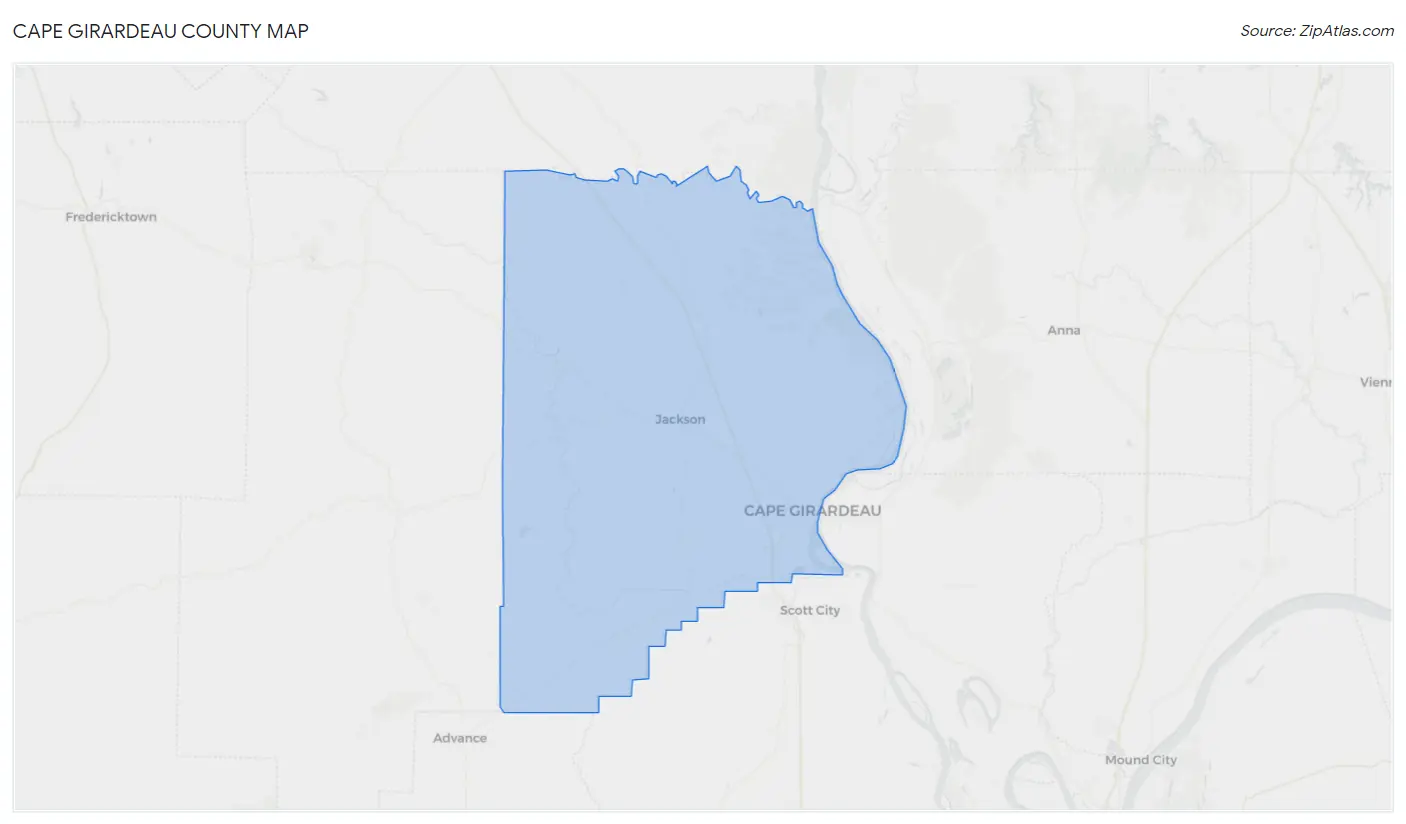
Cape Girardeau County Map
Cape Girardeau County Overview
$32,619
PER CAPITA INCOME
$82,968
AVG FAMILY INCOME
$65,070
AVG HOUSEHOLD INCOME
33.5%
WAGE / INCOME GAP [ % ]
66.5¢/ $1
WAGE / INCOME GAP [ $ ]
$10,368
FAMILY INCOME DEFICIT
0.45
INEQUALITY / GINI INDEX
81,703
TOTAL POPULATION
39,940
MALE POPULATION
41,763
FEMALE POPULATION
95.63
MALES / 100 FEMALES
104.56
FEMALES / 100 MALES
36.9
MEDIAN AGE
3.0
AVG FAMILY SIZE
2.5
AVG HOUSEHOLD SIZE
42,745
LABOR FORCE [ PEOPLE ]
64.7%
PERCENT IN LABOR FORCE
3.2%
UNEMPLOYMENT RATE
Cape Girardeau County Area Codes
Income in Cape Girardeau County
Income Overview in Cape Girardeau County
Per Capita Income in Cape Girardeau County is $32,619, while median incomes of families and households are $82,968 and $65,070 respectively.
| Characteristic | Number | Measure |
| Per Capita Income | 81,703 | $32,619 |
| Median Family Income | 19,847 | $82,968 |
| Mean Family Income | 19,847 | $99,594 |
| Median Household Income | 31,578 | $65,070 |
| Mean Household Income | 31,578 | $82,247 |
| Income Deficit | 19,847 | $10,368 |
| Wage / Income Gap (%) | 81,703 | 33.49% |
| Wage / Income Gap ($) | 81,703 | 66.51¢ per $1 |
| Gini / Inequality Index | 81,703 | 0.45 |
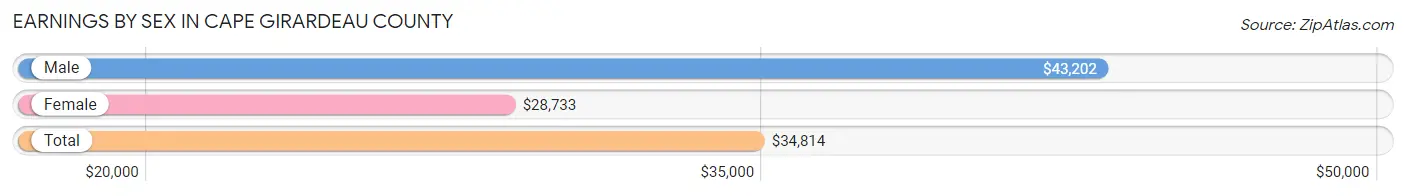
Earnings by Sex in Cape Girardeau County
Average Earnings in Cape Girardeau County are $34,814, $43,202 for men and $28,733 for women, a difference of 33.5%.
| Sex | Number | Average Earnings |
| Male | 22,042 (49.5%) | $43,202 |
| Female | 22,497 (50.5%) | $28,733 |
| Total | 44,539 (100.0%) | $34,814 |
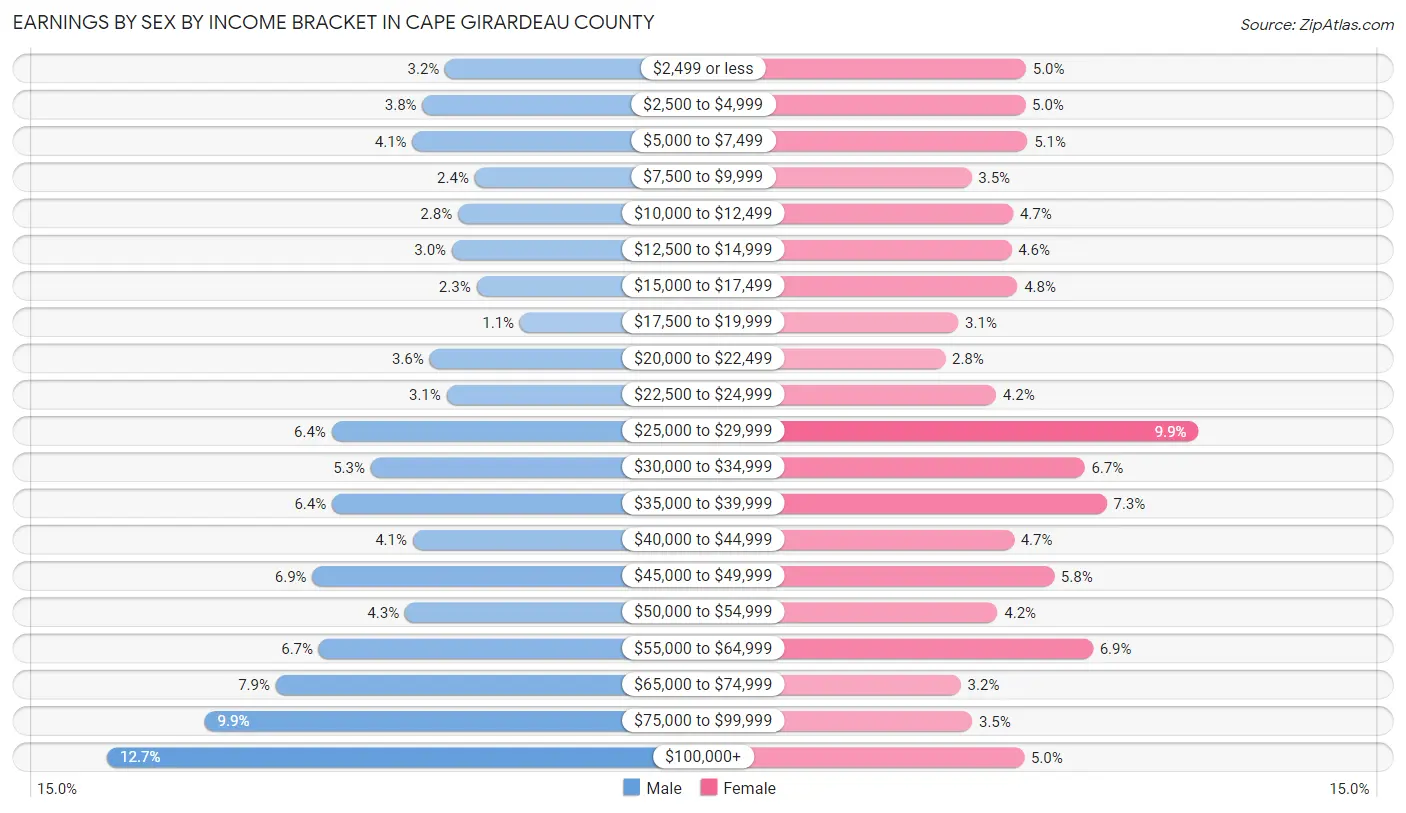
Earnings by Sex by Income Bracket in Cape Girardeau County
The most common earnings brackets in Cape Girardeau County are $100,000+ for men (2,796 | 12.7%) and $25,000 to $29,999 for women (2,222 | 9.9%).
| Income | Male | Female |
| $2,499 or less | 702 (3.2%) | 1,131 (5.0%) |
| $2,500 to $4,999 | 842 (3.8%) | 1,128 (5.0%) |
| $5,000 to $7,499 | 903 (4.1%) | 1,141 (5.1%) |
| $7,500 to $9,999 | 518 (2.4%) | 788 (3.5%) |
| $10,000 to $12,499 | 621 (2.8%) | 1,051 (4.7%) |
| $12,500 to $14,999 | 658 (3.0%) | 1,039 (4.6%) |
| $15,000 to $17,499 | 508 (2.3%) | 1,077 (4.8%) |
| $17,500 to $19,999 | 238 (1.1%) | 705 (3.1%) |
| $20,000 to $22,499 | 798 (3.6%) | 622 (2.8%) |
| $22,500 to $24,999 | 692 (3.1%) | 942 (4.2%) |
| $25,000 to $29,999 | 1,404 (6.4%) | 2,222 (9.9%) |
| $30,000 to $34,999 | 1,161 (5.3%) | 1,503 (6.7%) |
| $35,000 to $39,999 | 1,402 (6.4%) | 1,643 (7.3%) |
| $40,000 to $44,999 | 902 (4.1%) | 1,056 (4.7%) |
| $45,000 to $49,999 | 1,523 (6.9%) | 1,309 (5.8%) |
| $50,000 to $54,999 | 950 (4.3%) | 951 (4.2%) |
| $55,000 to $64,999 | 1,483 (6.7%) | 1,555 (6.9%) |
| $65,000 to $74,999 | 1,750 (7.9%) | 720 (3.2%) |
| $75,000 to $99,999 | 2,191 (9.9%) | 793 (3.5%) |
| $100,000+ | 2,796 (12.7%) | 1,121 (5.0%) |
| Total | 22,042 (100.0%) | 22,497 (100.0%) |
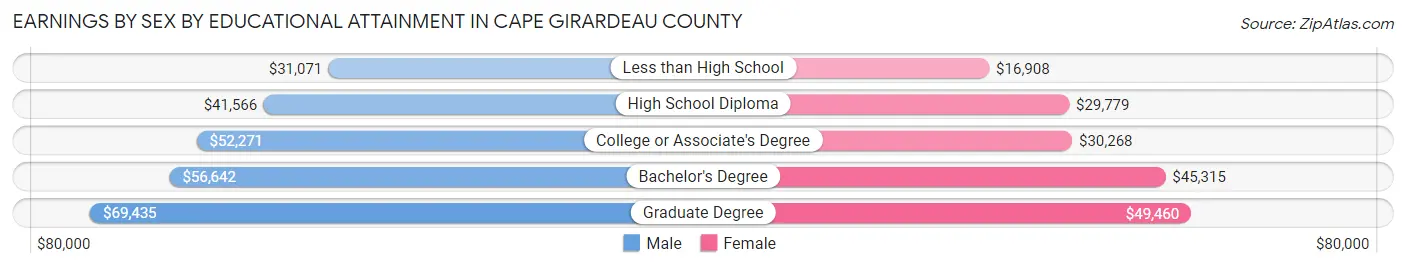
Earnings by Sex by Educational Attainment in Cape Girardeau County
Average earnings in Cape Girardeau County are $50,557 for men and $34,713 for women, a difference of 31.3%. Men with an educational attainment of graduate degree enjoy the highest average annual earnings of $69,435, while those with less than high school education earn the least with $31,071. Women with an educational attainment of graduate degree earn the most with the average annual earnings of $49,460, while those with less than high school education have the smallest earnings of $16,908.
| Educational Attainment | Male Income | Female Income |
| Less than High School | $31,071 | $16,908 |
| High School Diploma | $41,566 | $29,779 |
| College or Associate's Degree | $52,271 | $30,268 |
| Bachelor's Degree | $56,642 | $45,315 |
| Graduate Degree | $69,435 | $49,460 |
| Total | $50,557 | $34,713 |
Family Income in Cape Girardeau County
Family Income Brackets in Cape Girardeau County
According to the Cape Girardeau County family income data, there are 4,585 families falling into the $100,000 to $149,999 income range, which is the most common income bracket and makes up 23.1% of all families. Conversely, the $10,000 to $14,999 income bracket is the least frequent group with only 397 families (2.0%) belonging to this category.
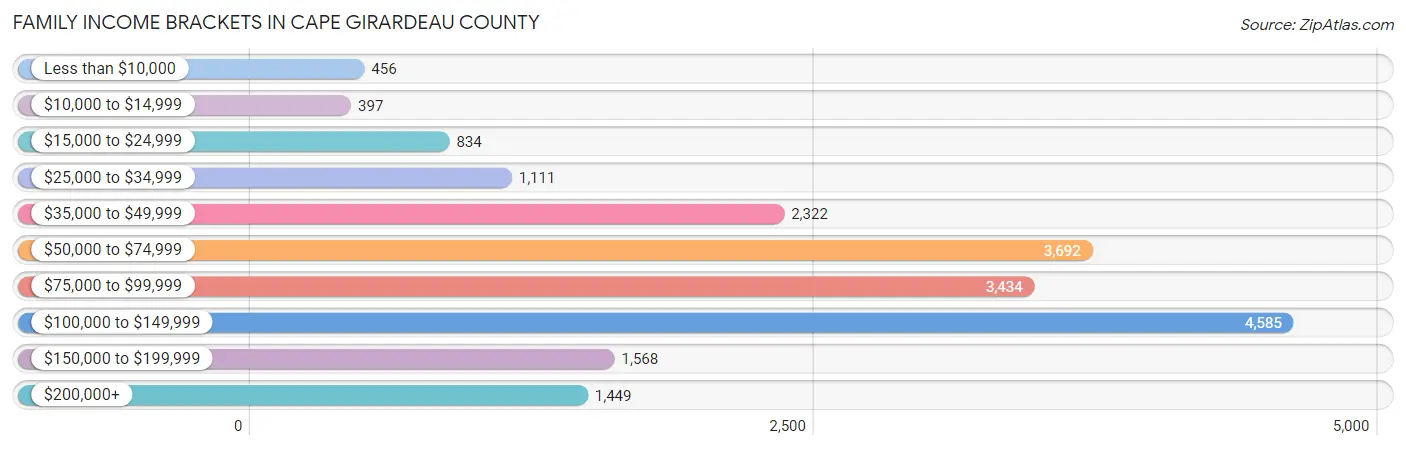
| Income Bracket | # Families | % Families |
| Less than $10,000 | 456 | 2.3% |
| $10,000 to $14,999 | 397 | 2.0% |
| $15,000 to $24,999 | 834 | 4.2% |
| $25,000 to $34,999 | 1,111 | 5.6% |
| $35,000 to $49,999 | 2,322 | 11.7% |
| $50,000 to $74,999 | 3,692 | 18.6% |
| $75,000 to $99,999 | 3,434 | 17.3% |
| $100,000 to $149,999 | 4,585 | 23.1% |
| $150,000 to $199,999 | 1,568 | 7.9% |
| $200,000+ | 1,449 | 7.3% |
Family Income by Famaliy Size in Cape Girardeau County
4-person families (3,707 | 18.7%) account for the highest median family income in Cape Girardeau County with $101,469 per family, while 2-person families (10,066 | 50.7%) have the highest median income of $36,587 per family member.
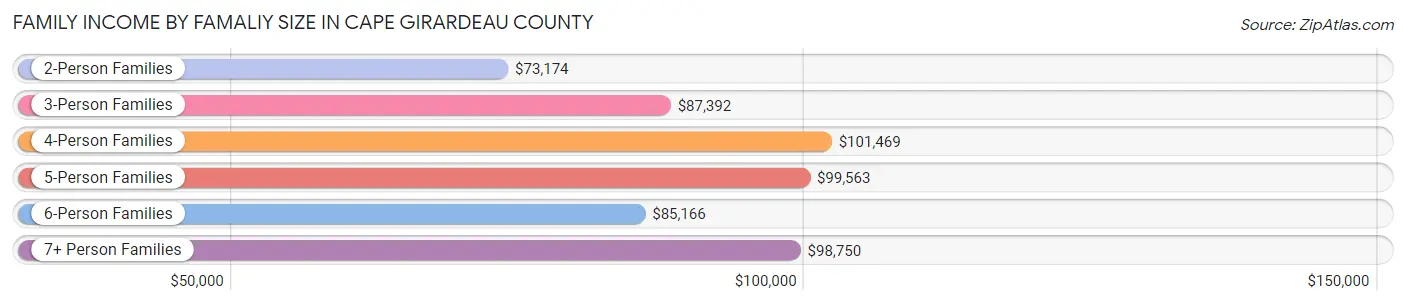
| Income Bracket | # Families | Median Income |
| 2-Person Families | 10,066 (50.7%) | $73,174 |
| 3-Person Families | 4,293 (21.6%) | $87,392 |
| 4-Person Families | 3,707 (18.7%) | $101,469 |
| 5-Person Families | 1,267 (6.4%) | $99,563 |
| 6-Person Families | 411 (2.1%) | $85,166 |
| 7+ Person Families | 103 (0.5%) | $98,750 |
| Total | 19,847 (100.0%) | $82,968 |
Family Income by Number of Earners in Cape Girardeau County
The median family income in Cape Girardeau County is $82,968, with families comprising 3+ earners (2,107) having the highest median family income of $127,687, while families with no earners (2,933) have the lowest median family income of $47,819, accounting for 10.6% and 14.8% of families, respectively.
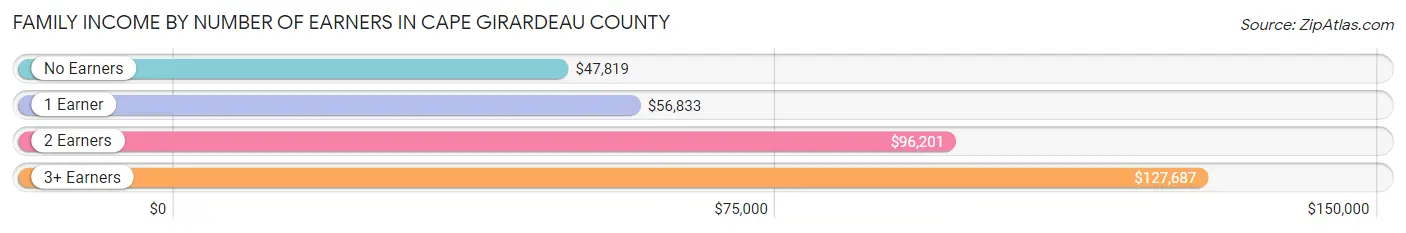
| Number of Earners | # Families | Median Income |
| No Earners | 2,933 (14.8%) | $47,819 |
| 1 Earner | 5,341 (26.9%) | $56,833 |
| 2 Earners | 9,466 (47.7%) | $96,201 |
| 3+ Earners | 2,107 (10.6%) | $127,687 |
| Total | 19,847 (100.0%) | $82,968 |
Household Income in Cape Girardeau County
Household Income Brackets in Cape Girardeau County
With 5,652 households falling in the category, the $50,000 to $74,999 income range is the most frequent in Cape Girardeau County, accounting for 17.9% of all households. In contrast, only 1,358 households (4.3%) fall into the $10,000 to $14,999 income bracket, making it the least populous group.
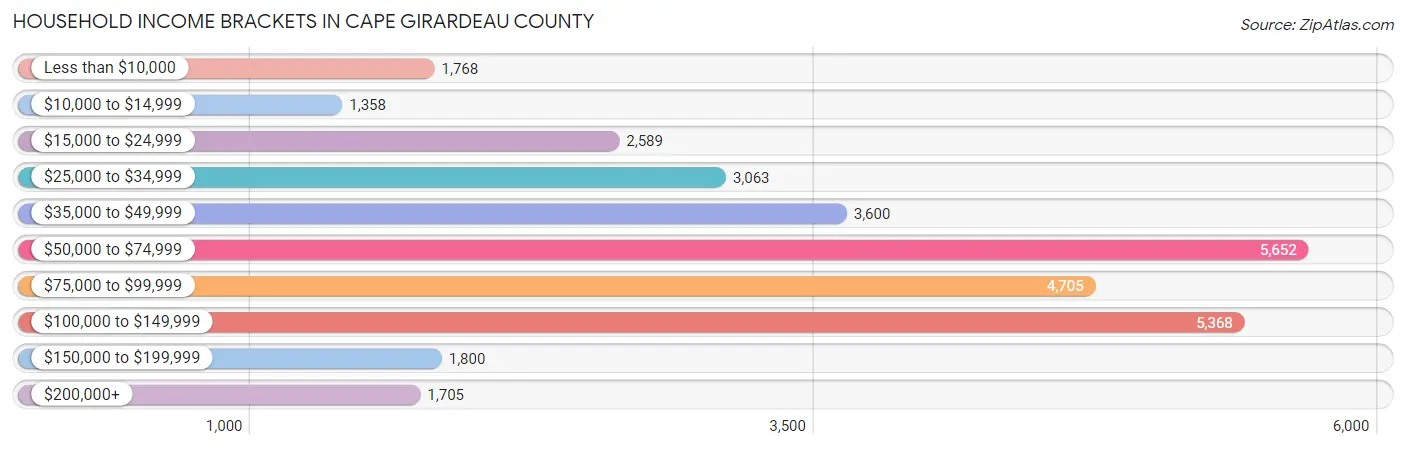
| Income Bracket | # Households | % Households |
| Less than $10,000 | 1,768 | 5.6% |
| $10,000 to $14,999 | 1,358 | 4.3% |
| $15,000 to $24,999 | 2,589 | 8.2% |
| $25,000 to $34,999 | 3,063 | 9.7% |
| $35,000 to $49,999 | 3,600 | 11.4% |
| $50,000 to $74,999 | 5,652 | 17.9% |
| $75,000 to $99,999 | 4,705 | 14.9% |
| $100,000 to $149,999 | 5,368 | 17.0% |
| $150,000 to $199,999 | 1,800 | 5.7% |
| $200,000+ | 1,705 | 5.4% |
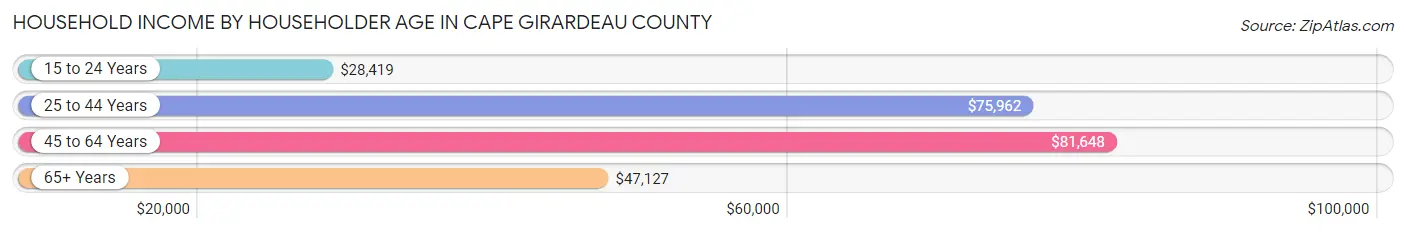
Household Income by Householder Age in Cape Girardeau County
The median household income in Cape Girardeau County is $65,070, with the highest median household income of $81,648 found in the 45 to 64 years age bracket for the primary householder. A total of 10,562 households (33.5%) fall into this category. Meanwhile, the 15 to 24 years age bracket for the primary householder has the lowest median household income of $28,419, with 2,251 households (7.1%) in this group.
| Income Bracket | # Households | Median Income |
| 15 to 24 Years | 2,251 (7.1%) | $28,419 |
| 25 to 44 Years | 10,284 (32.6%) | $75,962 |
| 45 to 64 Years | 10,562 (33.5%) | $81,648 |
| 65+ Years | 8,481 (26.9%) | $47,127 |
| Total | 31,578 (100.0%) | $65,070 |
Poverty in Cape Girardeau County
Income Below Poverty by Sex and Age in Cape Girardeau County
With 13.4% poverty level for males and 15.6% for females among the residents of Cape Girardeau County, 18 to 24 year old males and 5 year old females are the most vulnerable to poverty, with 1,395 males (31.7%) and 79 females (28.6%) in their respective age groups living below the poverty level.
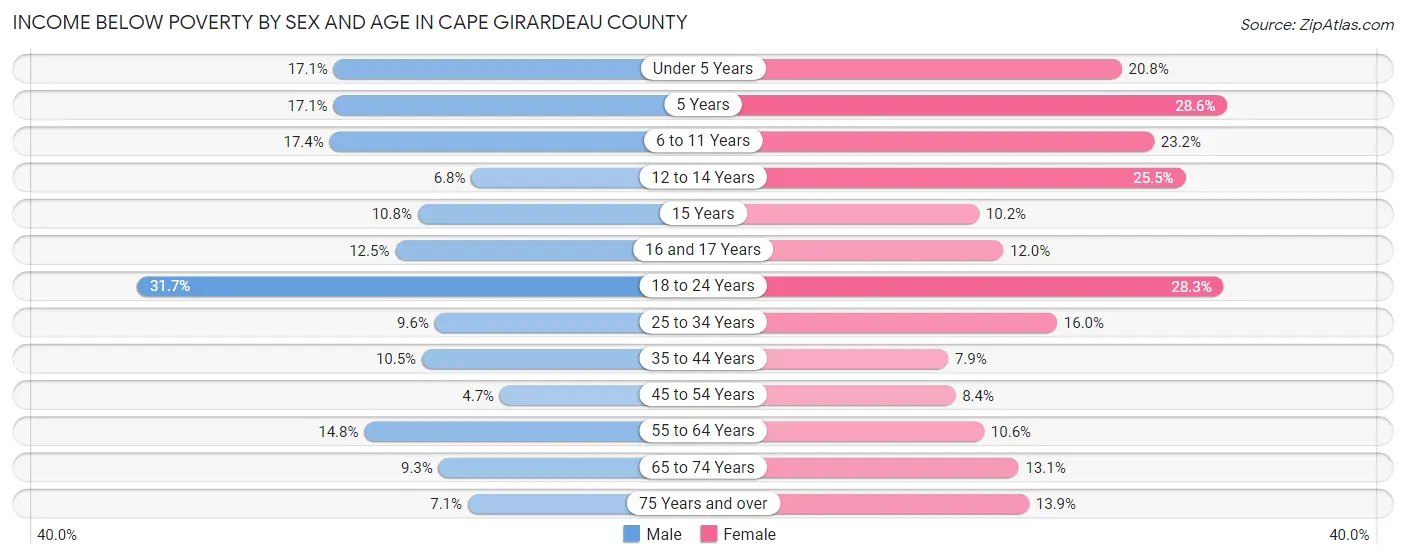
| Age Bracket | Male | Female |
| Under 5 Years | 413 (17.1%) | 438 (20.8%) |
| 5 Years | 57 (17.1%) | 79 (28.6%) |
| 6 to 11 Years | 569 (17.4%) | 638 (23.2%) |
| 12 to 14 Years | 90 (6.8%) | 401 (25.5%) |
| 15 Years | 72 (10.8%) | 52 (10.2%) |
| 16 and 17 Years | 102 (12.5%) | 112 (12.0%) |
| 18 to 24 Years | 1,395 (31.7%) | 1,427 (28.3%) |
| 25 to 34 Years | 485 (9.6%) | 820 (16.0%) |
| 35 to 44 Years | 509 (10.5%) | 363 (7.9%) |
| 45 to 54 Years | 209 (4.7%) | 383 (8.4%) |
| 55 to 64 Years | 729 (14.8%) | 532 (10.5%) |
| 65 to 74 Years | 330 (9.3%) | 547 (13.1%) |
| 75 Years and over | 154 (7.1%) | 434 (13.9%) |
| Total | 5,114 (13.4%) | 6,226 (15.6%) |
Income Above Poverty by Sex and Age in Cape Girardeau County
According to the poverty statistics in Cape Girardeau County, males aged 45 to 54 years and females aged 35 to 44 years are the age groups that are most secure financially, with 95.3% of males and 92.1% of females in these age groups living above the poverty line.
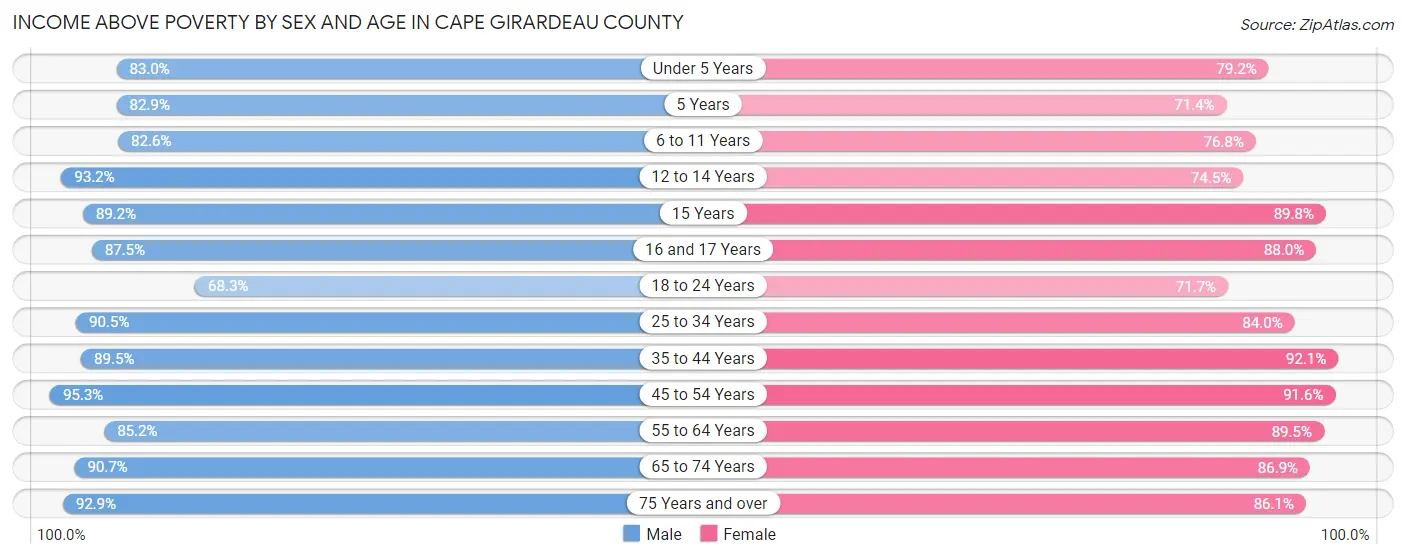
| Age Bracket | Male | Female |
| Under 5 Years | 2,009 (83.0%) | 1,671 (79.2%) |
| 5 Years | 277 (82.9%) | 197 (71.4%) |
| 6 to 11 Years | 2,709 (82.6%) | 2,116 (76.8%) |
| 12 to 14 Years | 1,228 (93.2%) | 1,171 (74.5%) |
| 15 Years | 594 (89.2%) | 459 (89.8%) |
| 16 and 17 Years | 715 (87.5%) | 824 (88.0%) |
| 18 to 24 Years | 3,011 (68.3%) | 3,608 (71.7%) |
| 25 to 34 Years | 4,594 (90.4%) | 4,316 (84.0%) |
| 35 to 44 Years | 4,339 (89.5%) | 4,243 (92.1%) |
| 45 to 54 Years | 4,228 (95.3%) | 4,164 (91.6%) |
| 55 to 64 Years | 4,204 (85.2%) | 4,513 (89.4%) |
| 65 to 74 Years | 3,235 (90.7%) | 3,622 (86.9%) |
| 75 Years and over | 2,017 (92.9%) | 2,690 (86.1%) |
| Total | 33,160 (86.6%) | 33,594 (84.4%) |
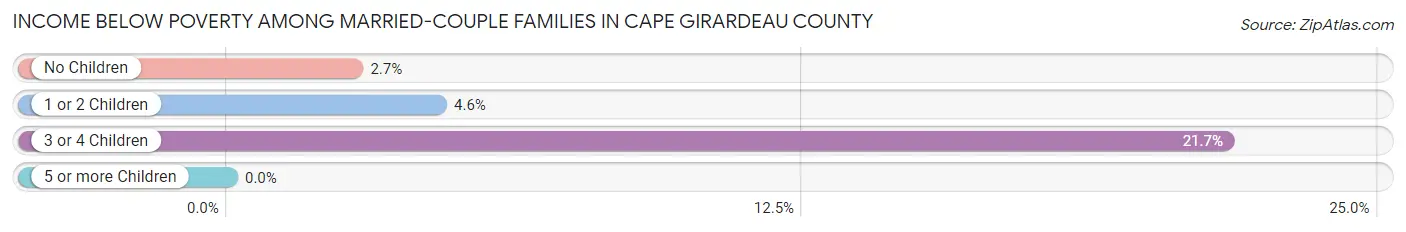
Income Below Poverty Among Married-Couple Families in Cape Girardeau County
The poverty statistics for married-couple families in Cape Girardeau County show that 4.7% or 747 of the total 15,971 families live below the poverty line. Families with 3 or 4 children have the highest poverty rate of 21.7%, comprising of 246 families. On the other hand, families with 5 or more children have the lowest poverty rate of 0.0%, which includes 0 families.
| Children | Above Poverty | Below Poverty |
| No Children | 9,236 (97.3%) | 259 (2.7%) |
| 1 or 2 Children | 5,075 (95.5%) | 242 (4.5%) |
| 3 or 4 Children | 888 (78.3%) | 246 (21.7%) |
| 5 or more Children | 25 (100.0%) | 0 (0.0%) |
| Total | 15,224 (95.3%) | 747 (4.7%) |
Income Below Poverty Among Single-Parent Households in Cape Girardeau County
According to the poverty data in Cape Girardeau County, 14.6% or 161 single-father households and 25.5% or 706 single-mother households are living below the poverty line. Among single-father households, those with 5 or more children have the highest poverty rate, with 16 households (100.0%) experiencing poverty. Likewise, among single-mother households, those with 5 or more children have the highest poverty rate, with 11 households (78.6%) falling below the poverty line.
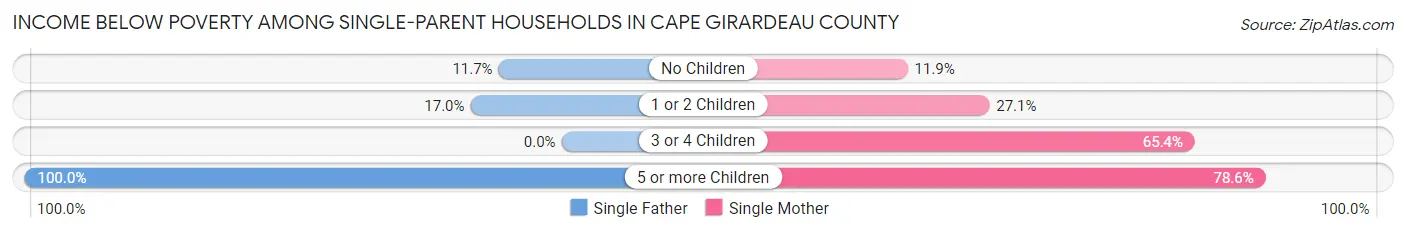
| Children | Single Father | Single Mother |
| No Children | 60 (11.7%) | 129 (11.9%) |
| 1 or 2 Children | 85 (17.0%) | 375 (27.1%) |
| 3 or 4 Children | 0 (0.0%) | 191 (65.4%) |
| 5 or more Children | 16 (100.0%) | 11 (78.6%) |
| Total | 161 (14.6%) | 706 (25.5%) |
Income Below Poverty Among Married-Couple vs Single-Parent Households in Cape Girardeau County
The poverty data for Cape Girardeau County shows that 747 of the married-couple family households (4.7%) and 867 of the single-parent households (22.4%) are living below the poverty level. Within the married-couple family households, those with 3 or 4 children have the highest poverty rate, with 246 households (21.7%) falling below the poverty line. Among the single-parent households, those with 5 or more children have the highest poverty rate, with 27 household (90.0%) living below poverty.
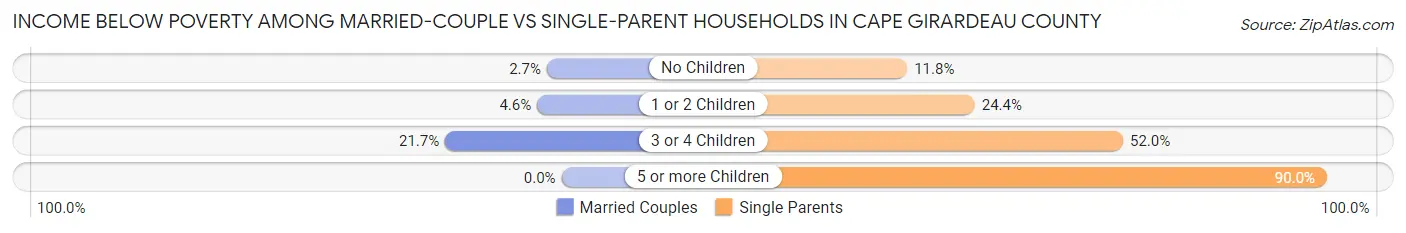
| Children | Married-Couple Families | Single-Parent Households |
| No Children | 259 (2.7%) | 189 (11.8%) |
| 1 or 2 Children | 242 (4.5%) | 460 (24.4%) |
| 3 or 4 Children | 246 (21.7%) | 191 (52.0%) |
| 5 or more Children | 0 (0.0%) | 27 (90.0%) |
| Total | 747 (4.7%) | 867 (22.4%) |
Race in Cape Girardeau County
The most populous races in Cape Girardeau County are White / Caucasian (70,305 | 86.1%), Black / African American (6,185 | 7.6%), and Two or more Races (3,303 | 4.0%).
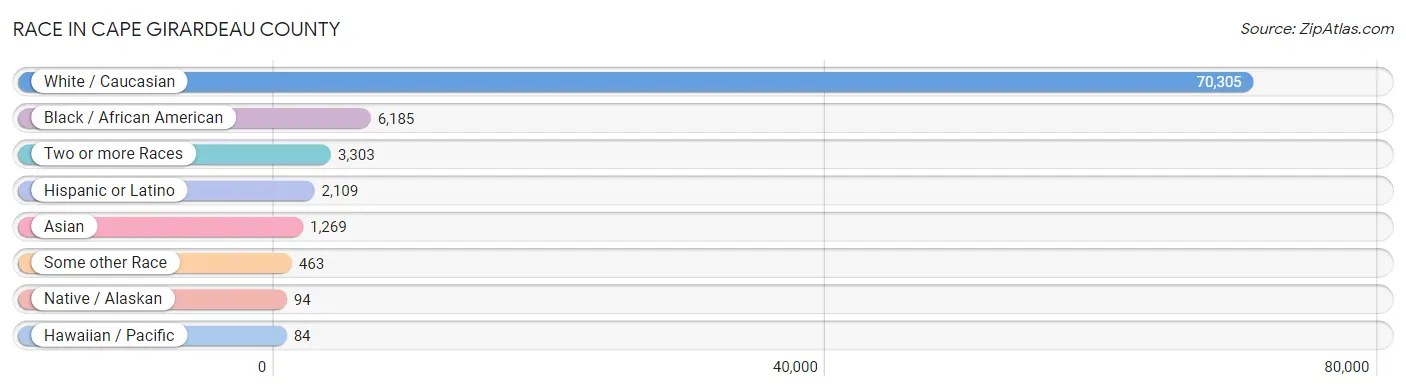
| Race | # Population | % Population |
| Asian | 1,269 | 1.5% |
| Black / African American | 6,185 | 7.6% |
| Hawaiian / Pacific | 84 | 0.1% |
| Hispanic or Latino | 2,109 | 2.6% |
| Native / Alaskan | 94 | 0.1% |
| White / Caucasian | 70,305 | 86.1% |
| Two or more Races | 3,303 | 4.0% |
| Some other Race | 463 | 0.6% |
| Total | 81,703 | 100.0% |
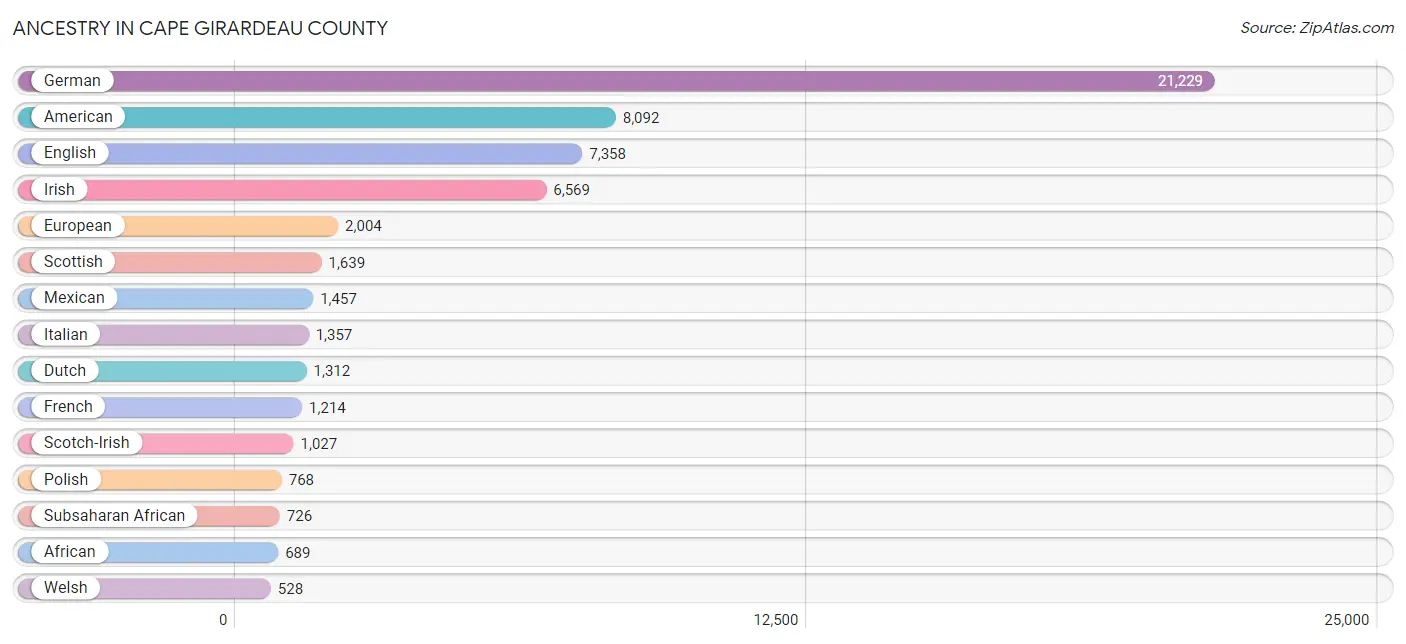
Ancestry in Cape Girardeau County
The most populous ancestries reported in Cape Girardeau County are German (21,229 | 26.0%), American (8,092 | 9.9%), English (7,358 | 9.0%), Irish (6,569 | 8.0%), and European (2,004 | 2.5%), together accounting for 55.4% of all Cape Girardeau County residents.
| Ancestry | # Population | % Population |
| African | 689 | 0.8% |
| American | 8,092 | 9.9% |
| Apache | 14 | 0.0% |
| Arab | 71 | 0.1% |
| Armenian | 60 | 0.1% |
| Austrian | 105 | 0.1% |
| Basque | 12 | 0.0% |
| Belgian | 37 | 0.1% |
| Bhutanese | 510 | 0.6% |
| Blackfeet | 10 | 0.0% |
| British | 304 | 0.4% |
| Bulgarian | 28 | 0.0% |
| Burmese | 139 | 0.2% |
| Canadian | 4 | 0.0% |
| Central American | 160 | 0.2% |
| Central American Indian | 23 | 0.0% |
| Cherokee | 444 | 0.5% |
| Cheyenne | 2 | 0.0% |
| Chickasaw | 3 | 0.0% |
| Chippewa | 15 | 0.0% |
| Choctaw | 28 | 0.0% |
| Colombian | 65 | 0.1% |
| Croatian | 13 | 0.0% |
| Cuban | 49 | 0.1% |
| Czech | 199 | 0.2% |
| Czechoslovakian | 71 | 0.1% |
| Danish | 187 | 0.2% |
| Dominican | 37 | 0.1% |
| Dutch | 1,312 | 1.6% |
| Eastern European | 265 | 0.3% |
| Ecuadorian | 21 | 0.0% |
| Egyptian | 30 | 0.0% |
| English | 7,358 | 9.0% |
| European | 2,004 | 2.5% |
| Finnish | 6 | 0.0% |
| French | 1,214 | 1.5% |
| French Canadian | 157 | 0.2% |
| German | 21,229 | 26.0% |
| Greek | 31 | 0.0% |
| Guamanian / Chamorro | 10 | 0.0% |
| Guatemalan | 71 | 0.1% |
| Honduran | 36 | 0.0% |
| Hungarian | 25 | 0.0% |
| Indian (Asian) | 484 | 0.6% |
| Indonesian | 20 | 0.0% |
| Inupiat | 10 | 0.0% |
| Iranian | 78 | 0.1% |
| Irish | 6,569 | 8.0% |
| Italian | 1,357 | 1.7% |
| Jordanian | 29 | 0.0% |
| Korean | 169 | 0.2% |
| Latvian | 17 | 0.0% |
| Lithuanian | 22 | 0.0% |
| Macedonian | 6 | 0.0% |
| Malaysian | 33 | 0.0% |
| Mexican | 1,457 | 1.8% |
| Native Hawaiian | 61 | 0.1% |
| Navajo | 7 | 0.0% |
| Nigerian | 33 | 0.0% |
| Northern European | 33 | 0.0% |
| Norwegian | 322 | 0.4% |
| Osage | 47 | 0.1% |
| Pakistani | 8 | 0.0% |
| Panamanian | 16 | 0.0% |
| Peruvian | 22 | 0.0% |
| Polish | 768 | 0.9% |
| Portuguese | 12 | 0.0% |
| Pueblo | 2 | 0.0% |
| Puerto Rican | 183 | 0.2% |
| Romanian | 34 | 0.0% |
| Russian | 269 | 0.3% |
| Salvadoran | 37 | 0.1% |
| Scandinavian | 96 | 0.1% |
| Scotch-Irish | 1,027 | 1.3% |
| Scottish | 1,639 | 2.0% |
| Serbian | 24 | 0.0% |
| Shoshone | 12 | 0.0% |
| Sioux | 18 | 0.0% |
| Slovak | 40 | 0.1% |
| South American | 108 | 0.1% |
| Spaniard | 9 | 0.0% |
| Sri Lankan | 101 | 0.1% |
| Subsaharan African | 726 | 0.9% |
| Swedish | 378 | 0.5% |
| Swiss | 296 | 0.4% |
| Thai | 273 | 0.3% |
| Ukrainian | 48 | 0.1% |
| Welsh | 528 | 0.6% |
| Zimbabwean | 4 | 0.0% | View All 89 Rows |
Immigrants in Cape Girardeau County
The most numerous immigrant groups reported in Cape Girardeau County came from Asia (991 | 1.2%), Eastern Asia (579 | 0.7%), Europe (481 | 0.6%), China (441 | 0.5%), and Latin America (361 | 0.4%), together accounting for 3.5% of all Cape Girardeau County residents.
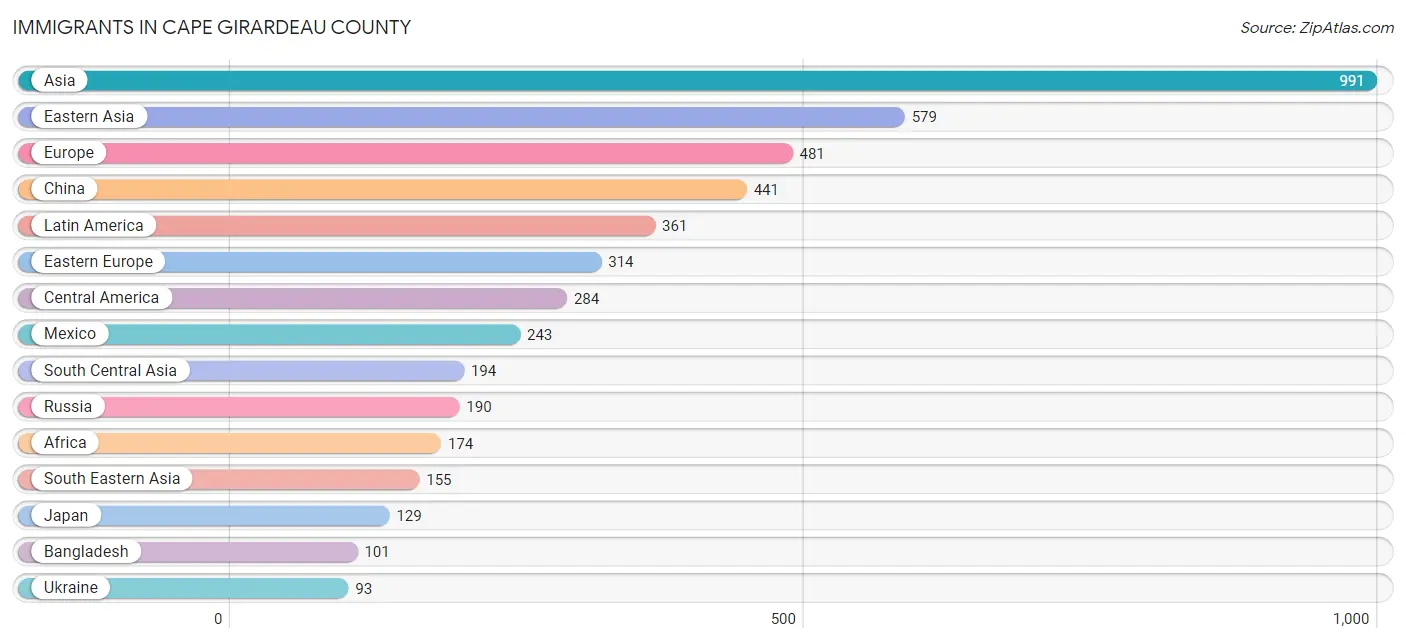
| Immigration Origin | # Population | % Population |
| Africa | 174 | 0.2% |
| Armenia | 15 | 0.0% |
| Asia | 991 | 1.2% |
| Bangladesh | 101 | 0.1% |
| Belarus | 5 | 0.0% |
| Bulgaria | 20 | 0.0% |
| Central America | 284 | 0.4% |
| Chile | 7 | 0.0% |
| China | 441 | 0.5% |
| Colombia | 45 | 0.1% |
| Eastern Africa | 13 | 0.0% |
| Eastern Asia | 579 | 0.7% |
| Eastern Europe | 314 | 0.4% |
| Ecuador | 3 | 0.0% |
| Egypt | 38 | 0.1% |
| El Salvador | 15 | 0.0% |
| England | 6 | 0.0% |
| Europe | 481 | 0.6% |
| France | 8 | 0.0% |
| Germany | 67 | 0.1% |
| Ghana | 15 | 0.0% |
| Guatemala | 26 | 0.0% |
| India | 65 | 0.1% |
| Italy | 54 | 0.1% |
| Japan | 129 | 0.2% |
| Jordan | 15 | 0.0% |
| Korea | 9 | 0.0% |
| Kuwait | 33 | 0.0% |
| Laos | 7 | 0.0% |
| Latin America | 361 | 0.4% |
| Mexico | 243 | 0.3% |
| Micronesia | 13 | 0.0% |
| Nepal | 28 | 0.0% |
| Netherlands | 14 | 0.0% |
| Nigeria | 37 | 0.1% |
| Northern Africa | 40 | 0.1% |
| Northern Europe | 24 | 0.0% |
| Oceania | 13 | 0.0% |
| Peru | 22 | 0.0% |
| Philippines | 67 | 0.1% |
| Russia | 190 | 0.2% |
| South America | 77 | 0.1% |
| South Central Asia | 194 | 0.2% |
| South Eastern Asia | 155 | 0.2% |
| Southern Europe | 54 | 0.1% |
| Sudan | 2 | 0.0% |
| Sweden | 18 | 0.0% |
| Thailand | 8 | 0.0% |
| Ukraine | 93 | 0.1% |
| Vietnam | 53 | 0.1% |
| Western Africa | 52 | 0.1% |
| Western Asia | 63 | 0.1% |
| Western Europe | 89 | 0.1% |
| Zimbabwe | 13 | 0.0% | View All 54 Rows |
Sex and Age in Cape Girardeau County
Sex and Age in Cape Girardeau County
The most populous age groups in Cape Girardeau County are 20 to 24 Years (3,929 | 9.8%) for men and 20 to 24 Years (4,459 | 10.7%) for women.
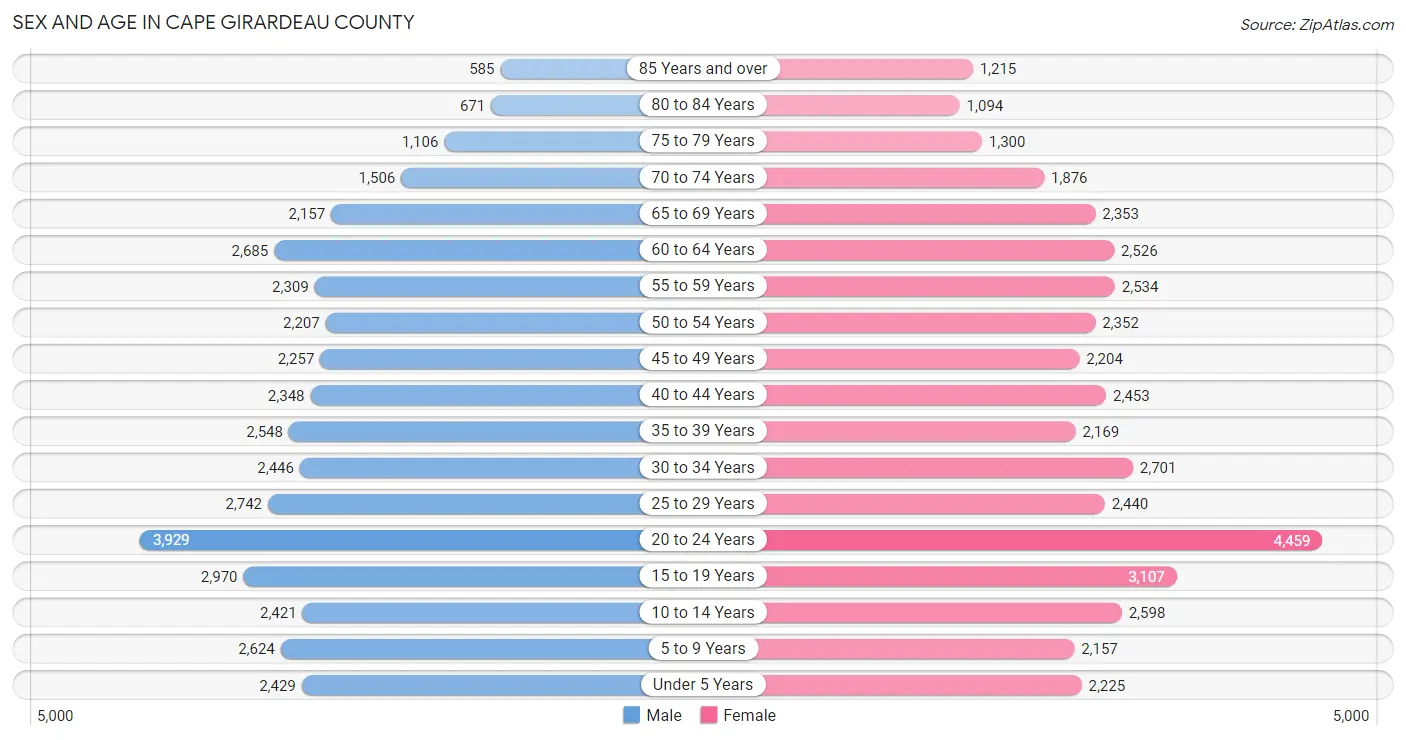
| Age Bracket | Male | Female |
| Under 5 Years | 2,429 (6.1%) | 2,225 (5.3%) |
| 5 to 9 Years | 2,624 (6.6%) | 2,157 (5.2%) |
| 10 to 14 Years | 2,421 (6.1%) | 2,598 (6.2%) |
| 15 to 19 Years | 2,970 (7.4%) | 3,107 (7.4%) |
| 20 to 24 Years | 3,929 (9.8%) | 4,459 (10.7%) |
| 25 to 29 Years | 2,742 (6.9%) | 2,440 (5.8%) |
| 30 to 34 Years | 2,446 (6.1%) | 2,701 (6.5%) |
| 35 to 39 Years | 2,548 (6.4%) | 2,169 (5.2%) |
| 40 to 44 Years | 2,348 (5.9%) | 2,453 (5.9%) |
| 45 to 49 Years | 2,257 (5.7%) | 2,204 (5.3%) |
| 50 to 54 Years | 2,207 (5.5%) | 2,352 (5.6%) |
| 55 to 59 Years | 2,309 (5.8%) | 2,534 (6.1%) |
| 60 to 64 Years | 2,685 (6.7%) | 2,526 (6.0%) |
| 65 to 69 Years | 2,157 (5.4%) | 2,353 (5.6%) |
| 70 to 74 Years | 1,506 (3.8%) | 1,876 (4.5%) |
| 75 to 79 Years | 1,106 (2.8%) | 1,300 (3.1%) |
| 80 to 84 Years | 671 (1.7%) | 1,094 (2.6%) |
| 85 Years and over | 585 (1.5%) | 1,215 (2.9%) |
| Total | 39,940 (100.0%) | 41,763 (100.0%) |
Families and Households in Cape Girardeau County
Median Family Size in Cape Girardeau County
The median family size in Cape Girardeau County is 3.04 persons per family, with single female/mother families (2,773 | 14.0%) accounting for the largest median family size of 3.21 persons per family. On the other hand, single male/father families (1,103 | 5.6%) represent the smallest median family size with 2.75 persons per family.
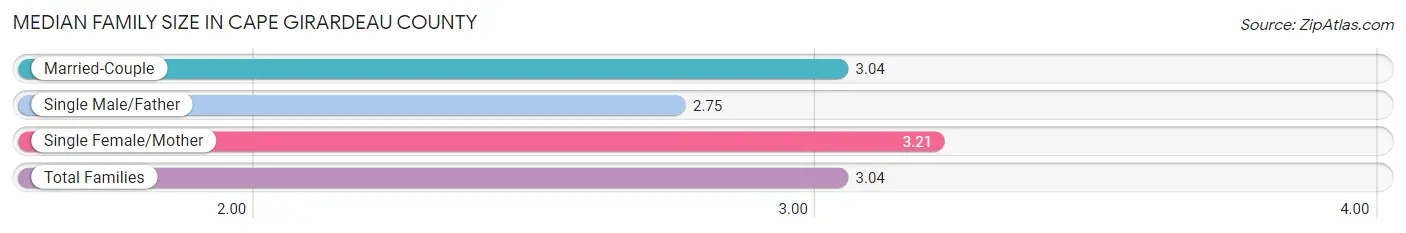
| Family Type | # Families | Family Size |
| Married-Couple | 15,971 (80.5%) | 3.04 |
| Single Male/Father | 1,103 (5.6%) | 2.75 |
| Single Female/Mother | 2,773 (14.0%) | 3.21 |
| Total Families | 19,847 (100.0%) | 3.04 |
Median Household Size in Cape Girardeau County
The median household size in Cape Girardeau County is 2.47 persons per household, with single female/mother households (2,773 | 8.8%) accounting for the largest median household size of 3.46 persons per household. non-family households (11,731 | 37.1%) represent the smallest median household size with 1.38 persons per household.
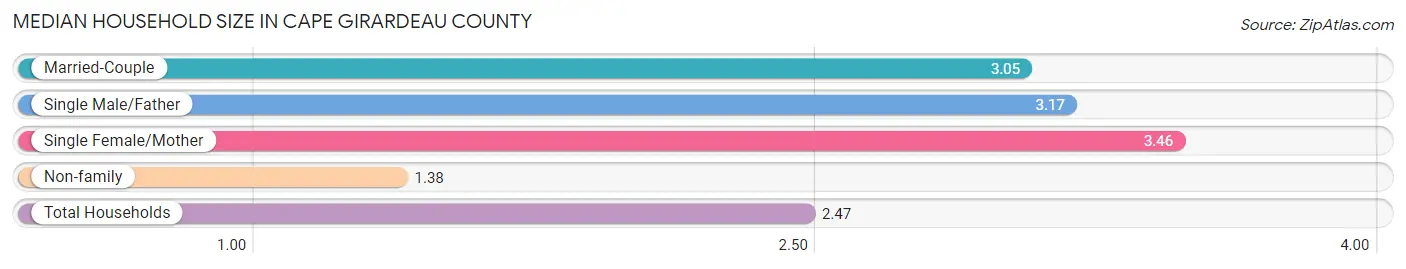
| Household Type | # Households | Household Size |
| Married-Couple | 15,971 (50.6%) | 3.05 |
| Single Male/Father | 1,103 (3.5%) | 3.17 |
| Single Female/Mother | 2,773 (8.8%) | 3.46 |
| Non-family | 11,731 (37.1%) | 1.38 |
| Total Households | 31,578 (100.0%) | 2.47 |
Household Size by Marriage Status in Cape Girardeau County
Out of a total of 31,578 households in Cape Girardeau County, 19,847 (62.8%) are family households, while 11,731 (37.1%) are nonfamily households. The most numerous type of family households are 2-person households, comprising 9,605, and the most common type of nonfamily households are 1-person households, comprising 9,215.
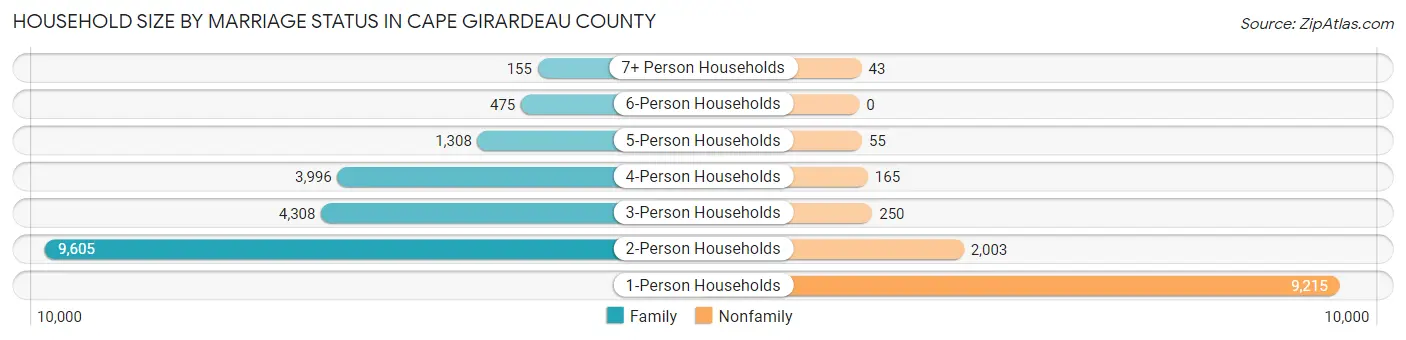
| Household Size | Family Households | Nonfamily Households |
| 1-Person Households | - | 9,215 (29.2%) |
| 2-Person Households | 9,605 (30.4%) | 2,003 (6.3%) |
| 3-Person Households | 4,308 (13.6%) | 250 (0.8%) |
| 4-Person Households | 3,996 (12.7%) | 165 (0.5%) |
| 5-Person Households | 1,308 (4.1%) | 55 (0.2%) |
| 6-Person Households | 475 (1.5%) | 0 (0.0%) |
| 7+ Person Households | 155 (0.5%) | 43 (0.1%) |
| Total | 19,847 (62.8%) | 11,731 (37.1%) |
Female Fertility in Cape Girardeau County
Fertility by Age in Cape Girardeau County
Average fertility rate in Cape Girardeau County is 45.0 births per 1,000 women. Women in the age bracket of 20 to 34 years have the highest fertility rate with 83.0 births per 1,000 women. Women in the age bracket of 20 to 34 years acount for 89.4% of all women with births.
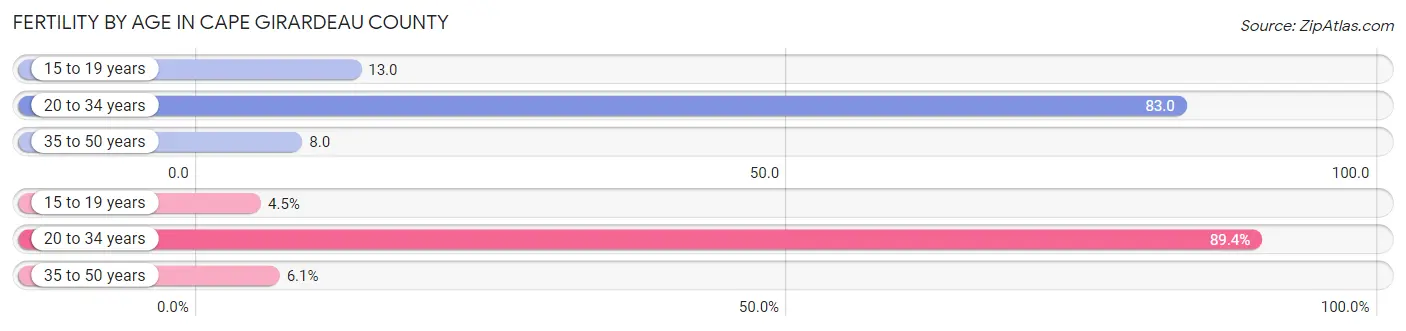
| Age Bracket | Women with Births | Births / 1,000 Women |
| 15 to 19 years | 40 (4.5%) | 13.0 |
| 20 to 34 years | 794 (89.4%) | 83.0 |
| 35 to 50 years | 54 (6.1%) | 8.0 |
| Total | 888 (100.0%) | 45.0 |
Fertility by Age by Marriage Status in Cape Girardeau County
79.2% of women with births (888) in Cape Girardeau County are married. The highest percentage of unmarried women with births falls into 15 to 19 years age bracket with 100.0% of them unmarried at the time of birth, while the lowest percentage of unmarried women with births belong to 35 to 50 years age bracket with 5.6% of them unmarried.
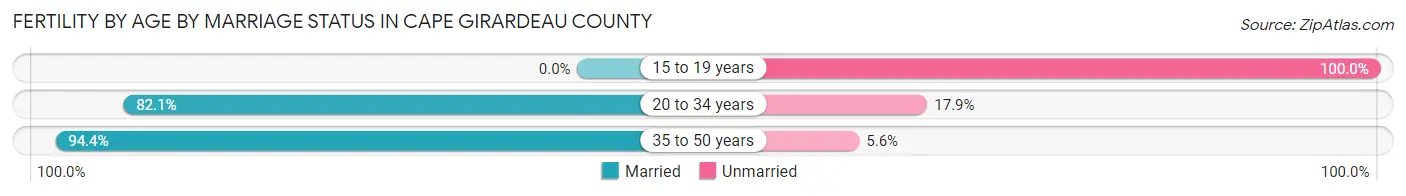
| Age Bracket | Married | Unmarried |
| 15 to 19 years | 0 (0.0%) | 40 (100.0%) |
| 20 to 34 years | 652 (82.1%) | 142 (17.9%) |
| 35 to 50 years | 51 (94.4%) | 3 (5.6%) |
| Total | 703 (79.2%) | 185 (20.8%) |
Fertility by Education in Cape Girardeau County
Average fertility rate in Cape Girardeau County is 45.0 births per 1,000 women. Women with the education attainment of graduate degree have the highest fertility rate of 60.0 births per 1,000 women, while women with the education attainment of less than high school have the lowest fertility at 20.0 births per 1,000 women. Women with the education attainment of college or associate's degree represent 42.6% of all women with births.
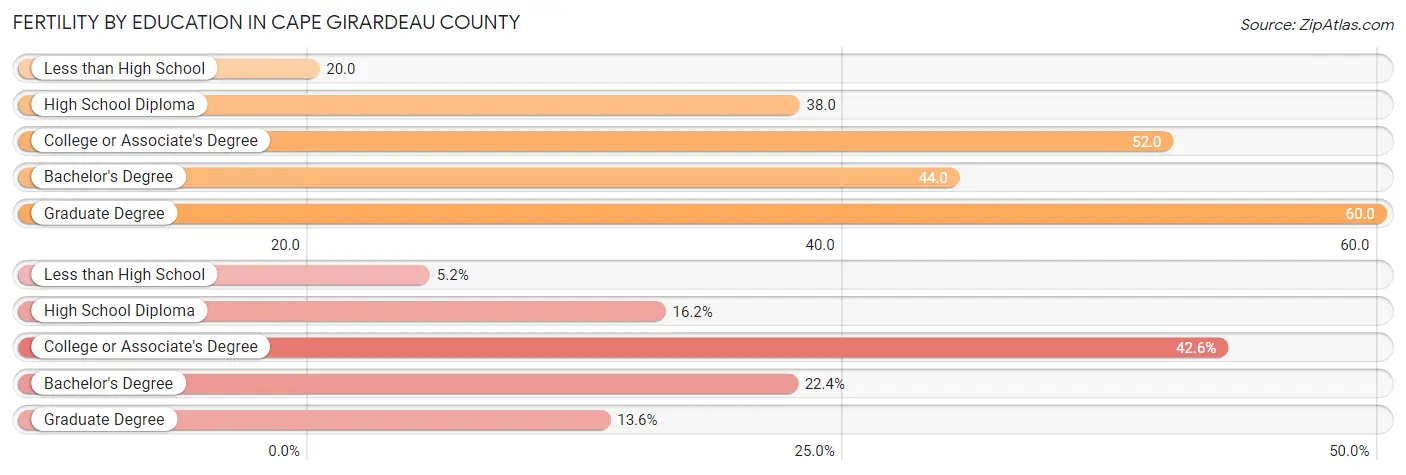
| Educational Attainment | Women with Births | Births / 1,000 Women |
| Less than High School | 46 (5.2%) | 20.0 |
| High School Diploma | 144 (16.2%) | 38.0 |
| College or Associate's Degree | 378 (42.6%) | 52.0 |
| Bachelor's Degree | 199 (22.4%) | 44.0 |
| Graduate Degree | 121 (13.6%) | 60.0 |
| Total | 888 (100.0%) | 45.0 |
Fertility by Education by Marriage Status in Cape Girardeau County
20.8% of women with births in Cape Girardeau County are unmarried. Women with the educational attainment of graduate degree are most likely to be married with 100.0% of them married at childbirth, while women with the educational attainment of less than high school are least likely to be married with 60.9% of them unmarried at childbirth.
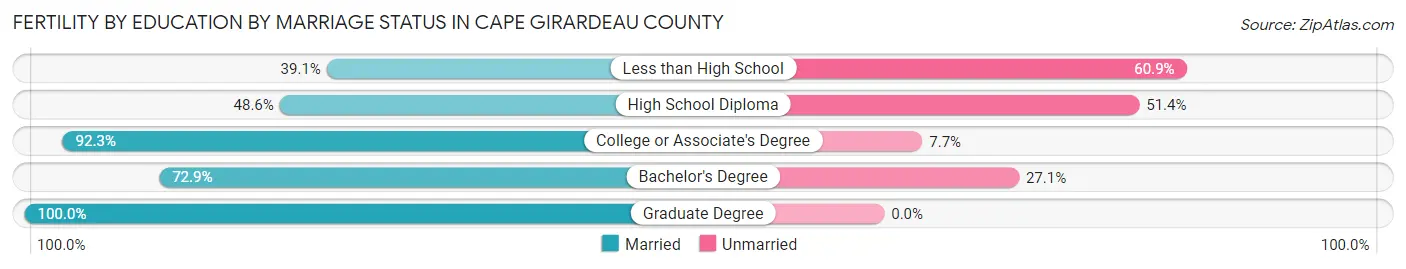
| Educational Attainment | Married | Unmarried |
| Less than High School | 18 (39.1%) | 28 (60.9%) |
| High School Diploma | 70 (48.6%) | 74 (51.4%) |
| College or Associate's Degree | 349 (92.3%) | 29 (7.7%) |
| Bachelor's Degree | 145 (72.9%) | 54 (27.1%) |
| Graduate Degree | 121 (100.0%) | 0 (0.0%) |
| Total | 703 (79.2%) | 185 (20.8%) |
Employment Characteristics in Cape Girardeau County
Employment by Class of Employer in Cape Girardeau County
Among the 40,636 employed individuals in Cape Girardeau County, private company employees (25,958 | 63.9%), not-for-profit organizations (5,157 | 12.7%), and state government employees (3,031 | 7.5%) make up the most common classes of employment.
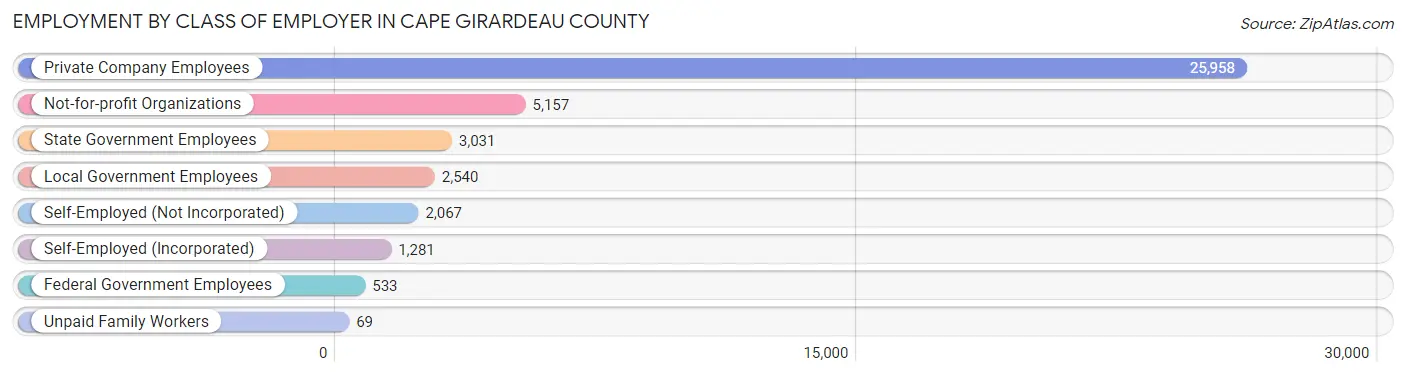
| Employer Class | # Employees | % Employees |
| Private Company Employees | 25,958 | 63.9% |
| Self-Employed (Incorporated) | 1,281 | 3.2% |
| Self-Employed (Not Incorporated) | 2,067 | 5.1% |
| Not-for-profit Organizations | 5,157 | 12.7% |
| Local Government Employees | 2,540 | 6.2% |
| State Government Employees | 3,031 | 7.5% |
| Federal Government Employees | 533 | 1.3% |
| Unpaid Family Workers | 69 | 0.2% |
| Total | 40,636 | 100.0% |
Employment Status by Age in Cape Girardeau County
According to the labor force statistics for Cape Girardeau County, out of the total population over 16 years of age (66,066), 64.7% or 42,745 individuals are in the labor force, with 3.2% or 1,368 of them unemployed. The age group with the highest labor force participation rate is 25 to 29 years, with 89.0% or 4,612 individuals in the labor force. Within the labor force, the 16 to 19 years age range has the highest percentage of unemployed individuals, with 9.7% or 216 of them being unemployed.
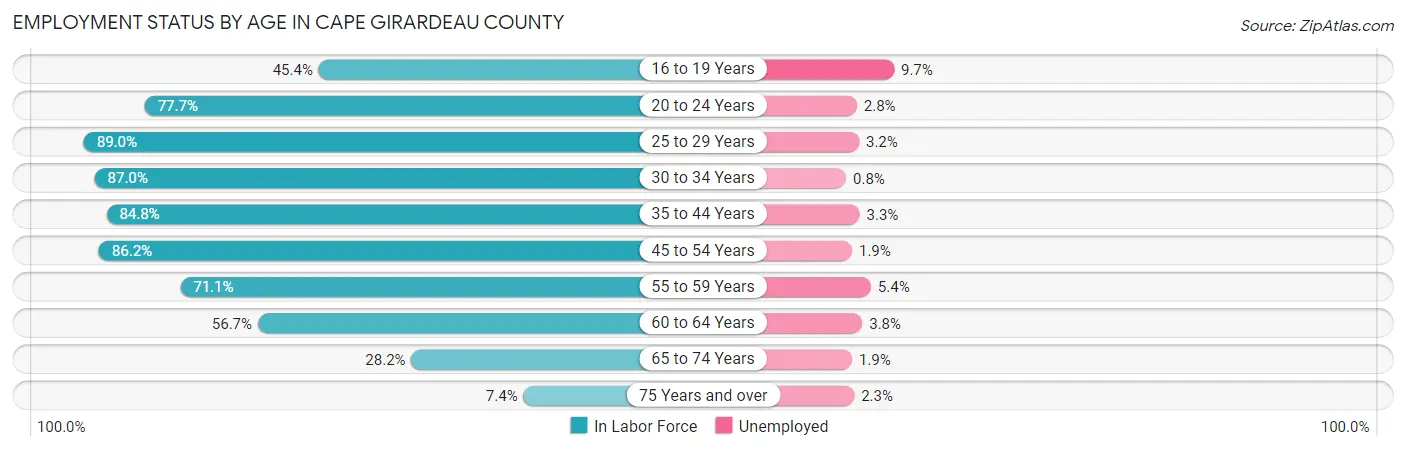
| Age Bracket | In Labor Force | Unemployed |
| 16 to 19 Years | 2,222 (45.4%) | 216 (9.7%) |
| 20 to 24 Years | 6,517 (77.7%) | 182 (2.8%) |
| 25 to 29 Years | 4,612 (89.0%) | 148 (3.2%) |
| 30 to 34 Years | 4,478 (87.0%) | 36 (0.8%) |
| 35 to 44 Years | 8,071 (84.8%) | 266 (3.3%) |
| 45 to 54 Years | 7,775 (86.2%) | 148 (1.9%) |
| 55 to 59 Years | 3,443 (71.1%) | 186 (5.4%) |
| 60 to 64 Years | 2,955 (56.7%) | 112 (3.8%) |
| 65 to 74 Years | 2,226 (28.2%) | 42 (1.9%) |
| 75 Years and over | 442 (7.4%) | 10 (2.3%) |
| Total | 42,745 (64.7%) | 1,368 (3.2%) |
Employment Status by Educational Attainment in Cape Girardeau County
According to labor force statistics for Cape Girardeau County, 80.5% of individuals (31,331) out of the total population between 25 and 64 years of age (38,921) are in the labor force, with 2.8% or 877 of them being unemployed. The group with the highest labor force participation rate are those with the educational attainment of bachelor's degree or higher, with 89.7% or 12,745 individuals in the labor force. Within the labor force, individuals with less than high school education have the highest percentage of unemployment, with 6.2% or 78 of them being unemployed.
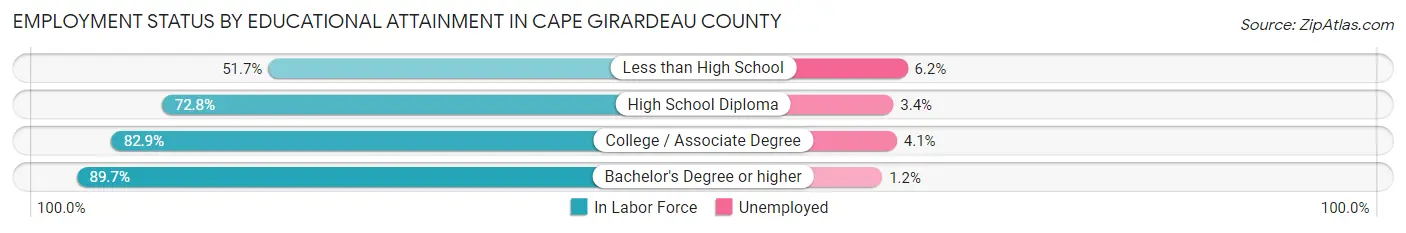
| Educational Attainment | In Labor Force | Unemployed |
| Less than High School | 1,265 (51.7%) | 152 (6.2%) |
| High School Diploma | 8,164 (72.8%) | 381 (3.4%) |
| College / Associate Degree | 9,162 (82.9%) | 453 (4.1%) |
| Bachelor's Degree or higher | 12,745 (89.7%) | 170 (1.2%) |
| Total | 31,331 (80.5%) | 1,090 (2.8%) |
Employment Occupations by Sex in Cape Girardeau County
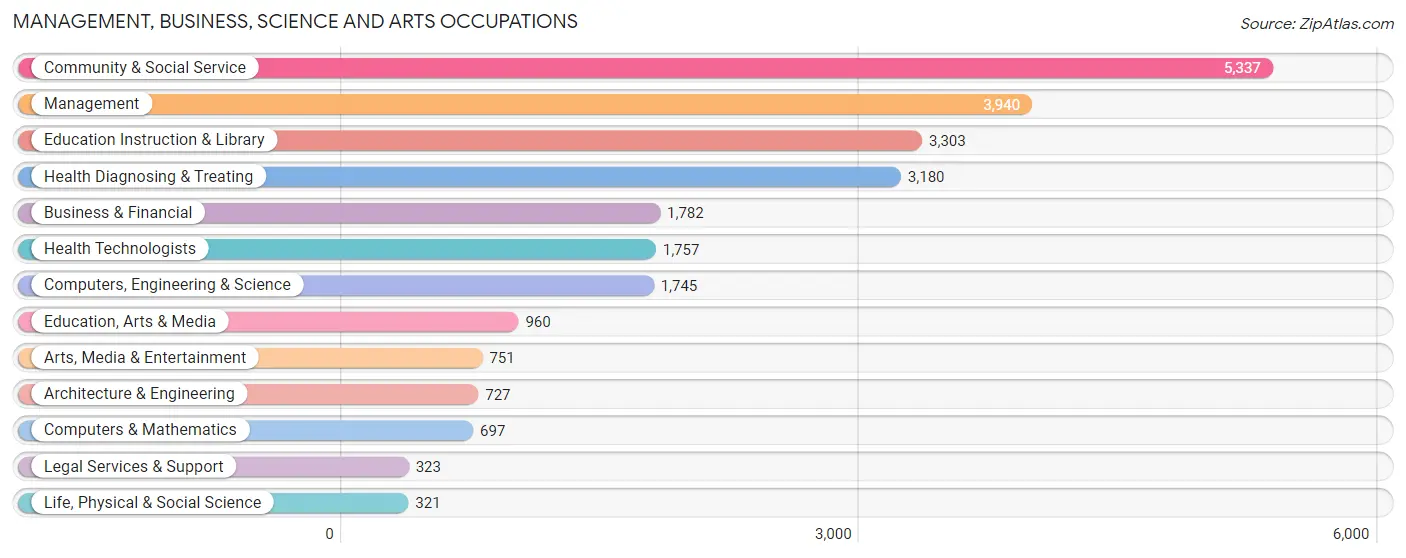
Management, Business, Science and Arts Occupations
The most common Management, Business, Science and Arts occupations in Cape Girardeau County are Community & Social Service (5,337 | 12.9%), Management (3,940 | 9.5%), Education Instruction & Library (3,303 | 8.0%), Health Diagnosing & Treating (3,180 | 7.7%), and Business & Financial (1,782 | 4.3%).
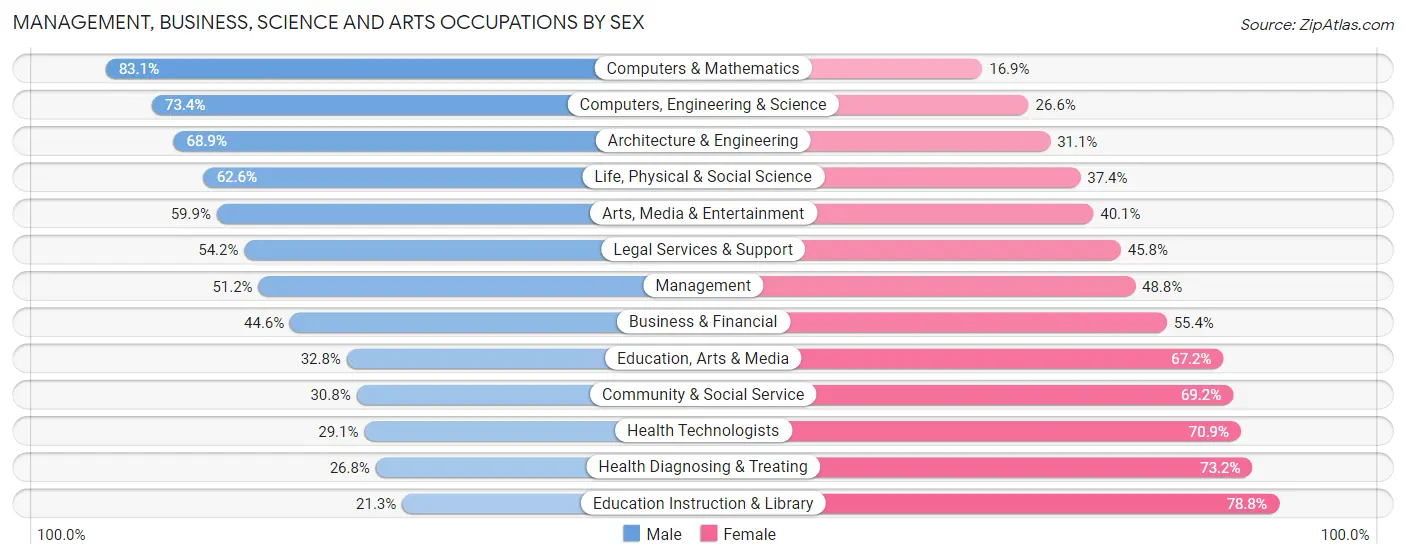
Management, Business, Science and Arts Occupations by Sex
Within the Management, Business, Science and Arts occupations in Cape Girardeau County, the most male-oriented occupations are Computers & Mathematics (83.1%), Computers, Engineering & Science (73.4%), and Architecture & Engineering (68.9%), while the most female-oriented occupations are Education Instruction & Library (78.7%), Health Diagnosing & Treating (73.2%), and Health Technologists (70.9%).
| Occupation | Male | Female |
| Management | 2,018 (51.2%) | 1,922 (48.8%) |
| Business & Financial | 795 (44.6%) | 987 (55.4%) |
| Computers, Engineering & Science | 1,281 (73.4%) | 464 (26.6%) |
| Computers & Mathematics | 579 (83.1%) | 118 (16.9%) |
| Architecture & Engineering | 501 (68.9%) | 226 (31.1%) |
| Life, Physical & Social Science | 201 (62.6%) | 120 (37.4%) |
| Community & Social Service | 1,642 (30.8%) | 3,695 (69.2%) |
| Education, Arts & Media | 315 (32.8%) | 645 (67.2%) |
| Legal Services & Support | 175 (54.2%) | 148 (45.8%) |
| Education Instruction & Library | 702 (21.2%) | 2,601 (78.7%) |
| Arts, Media & Entertainment | 450 (59.9%) | 301 (40.1%) |
| Health Diagnosing & Treating | 851 (26.8%) | 2,329 (73.2%) |
| Health Technologists | 512 (29.1%) | 1,245 (70.9%) |
| Total (Category) | 6,587 (41.2%) | 9,397 (58.8%) |
| Total (Overall) | 20,528 (49.6%) | 20,825 (50.4%) |
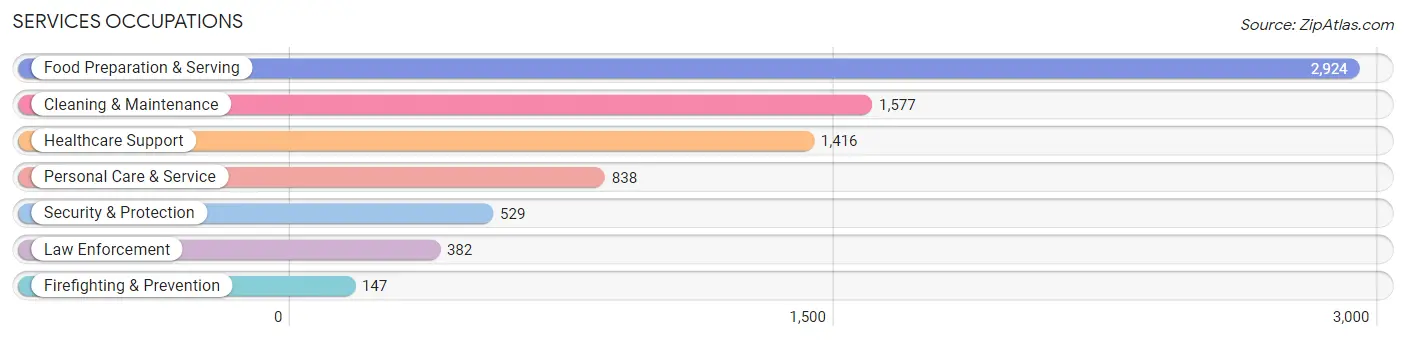
Services Occupations
The most common Services occupations in Cape Girardeau County are Food Preparation & Serving (2,924 | 7.1%), Cleaning & Maintenance (1,577 | 3.8%), Healthcare Support (1,416 | 3.4%), Personal Care & Service (838 | 2.0%), and Security & Protection (529 | 1.3%).
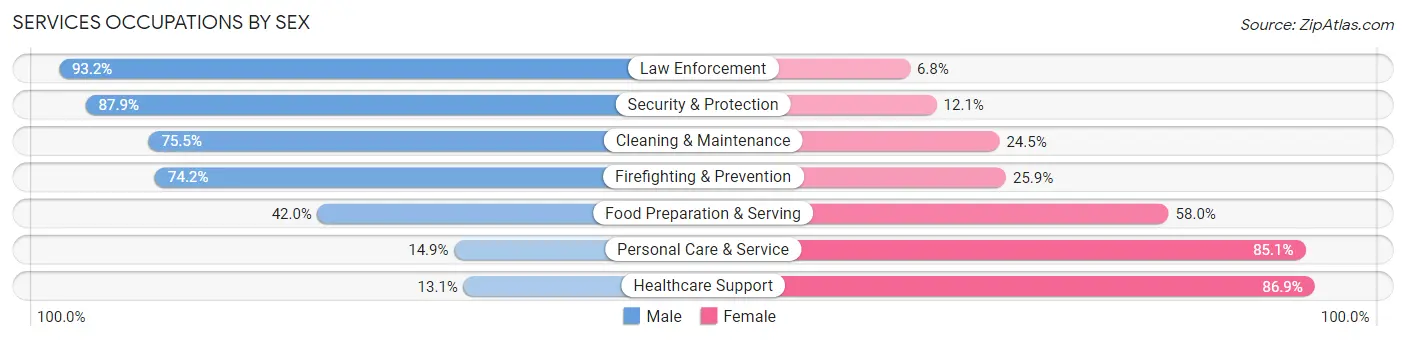
Services Occupations by Sex
Within the Services occupations in Cape Girardeau County, the most male-oriented occupations are Law Enforcement (93.2%), Security & Protection (87.9%), and Cleaning & Maintenance (75.5%), while the most female-oriented occupations are Healthcare Support (86.9%), Personal Care & Service (85.1%), and Food Preparation & Serving (58.0%).
| Occupation | Male | Female |
| Healthcare Support | 185 (13.1%) | 1,231 (86.9%) |
| Security & Protection | 465 (87.9%) | 64 (12.1%) |
| Firefighting & Prevention | 109 (74.2%) | 38 (25.9%) |
| Law Enforcement | 356 (93.2%) | 26 (6.8%) |
| Food Preparation & Serving | 1,227 (42.0%) | 1,697 (58.0%) |
| Cleaning & Maintenance | 1,190 (75.5%) | 387 (24.5%) |
| Personal Care & Service | 125 (14.9%) | 713 (85.1%) |
| Total (Category) | 3,192 (43.8%) | 4,092 (56.2%) |
| Total (Overall) | 20,528 (49.6%) | 20,825 (50.4%) |
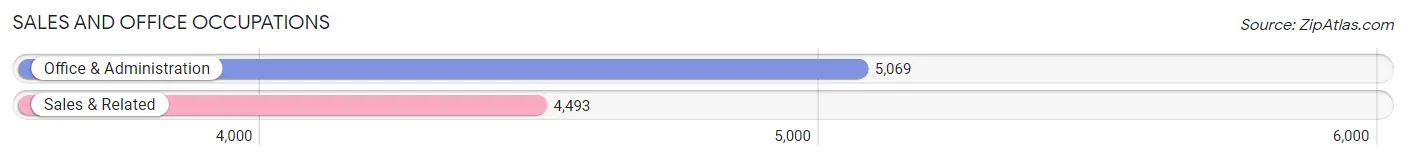
Sales and Office Occupations
The most common Sales and Office occupations in Cape Girardeau County are Office & Administration (5,069 | 12.3%), and Sales & Related (4,493 | 10.9%).
Sales and Office Occupations by Sex
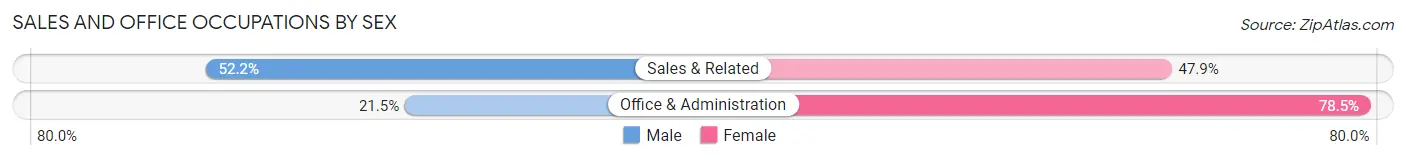
| Occupation | Male | Female |
| Sales & Related | 2,343 (52.1%) | 2,150 (47.8%) |
| Office & Administration | 1,089 (21.5%) | 3,980 (78.5%) |
| Total (Category) | 3,432 (35.9%) | 6,130 (64.1%) |
| Total (Overall) | 20,528 (49.6%) | 20,825 (50.4%) |
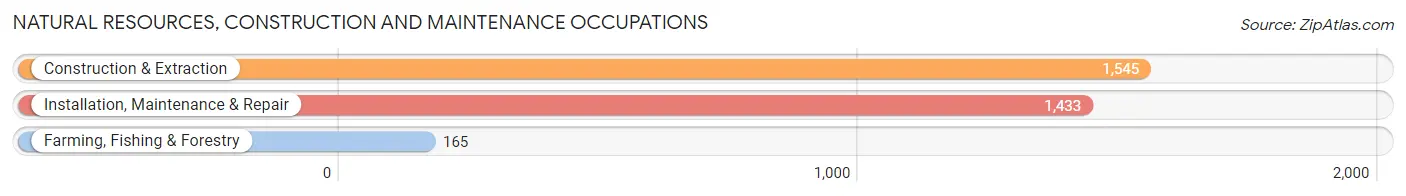
Natural Resources, Construction and Maintenance Occupations
The most common Natural Resources, Construction and Maintenance occupations in Cape Girardeau County are Construction & Extraction (1,545 | 3.7%), Installation, Maintenance & Repair (1,433 | 3.5%), and Farming, Fishing & Forestry (165 | 0.4%).
Natural Resources, Construction and Maintenance Occupations by Sex
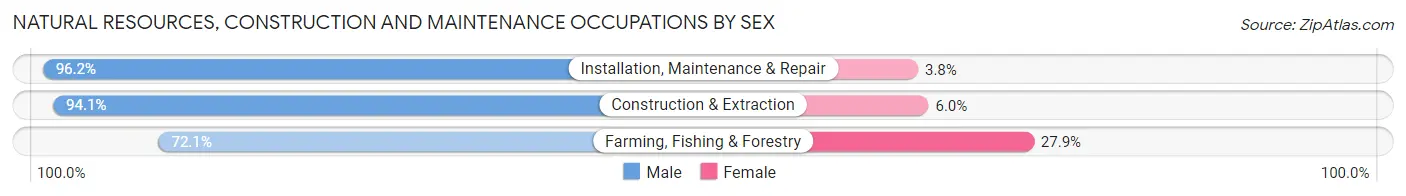
| Occupation | Male | Female |
| Farming, Fishing & Forestry | 119 (72.1%) | 46 (27.9%) |
| Construction & Extraction | 1,453 (94.1%) | 92 (5.9%) |
| Installation, Maintenance & Repair | 1,379 (96.2%) | 54 (3.8%) |
| Total (Category) | 2,951 (93.9%) | 192 (6.1%) |
| Total (Overall) | 20,528 (49.6%) | 20,825 (50.4%) |
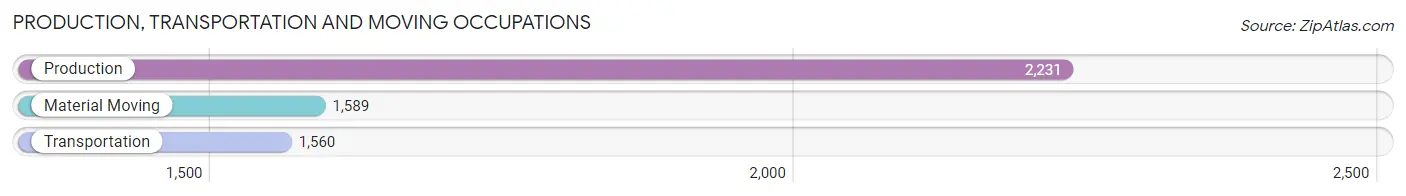
Production, Transportation and Moving Occupations
The most common Production, Transportation and Moving occupations in Cape Girardeau County are Production (2,231 | 5.4%), Material Moving (1,589 | 3.8%), and Transportation (1,560 | 3.8%).
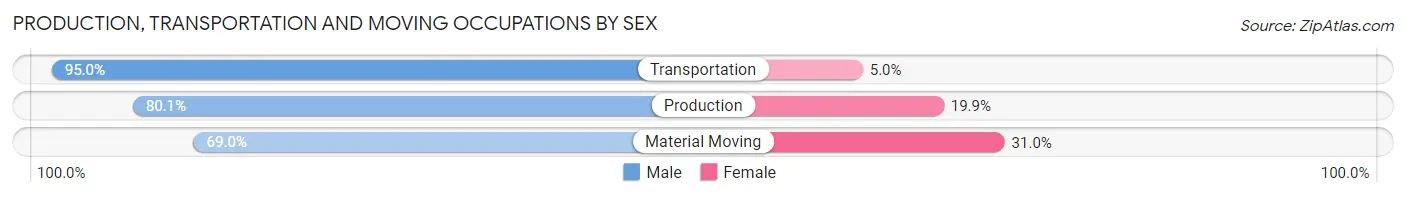
Production, Transportation and Moving Occupations by Sex
| Occupation | Male | Female |
| Production | 1,788 (80.1%) | 443 (19.9%) |
| Transportation | 1,482 (95.0%) | 78 (5.0%) |
| Material Moving | 1,096 (69.0%) | 493 (31.0%) |
| Total (Category) | 4,366 (81.1%) | 1,014 (18.9%) |
| Total (Overall) | 20,528 (49.6%) | 20,825 (50.4%) |
Employment Industries by Sex in Cape Girardeau County
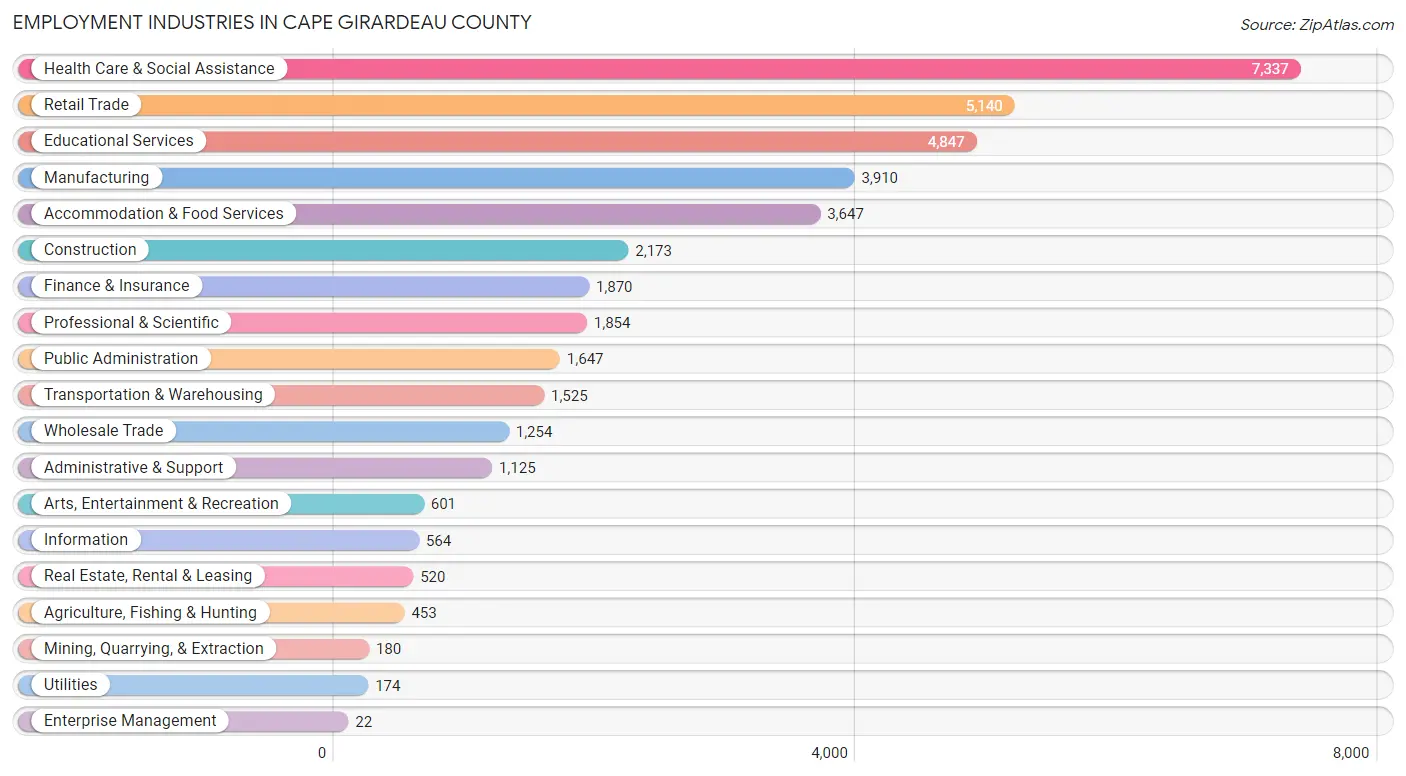
Employment Industries in Cape Girardeau County
The major employment industries in Cape Girardeau County include Health Care & Social Assistance (7,337 | 17.7%), Retail Trade (5,140 | 12.4%), Educational Services (4,847 | 11.7%), Manufacturing (3,910 | 9.5%), and Accommodation & Food Services (3,647 | 8.8%).
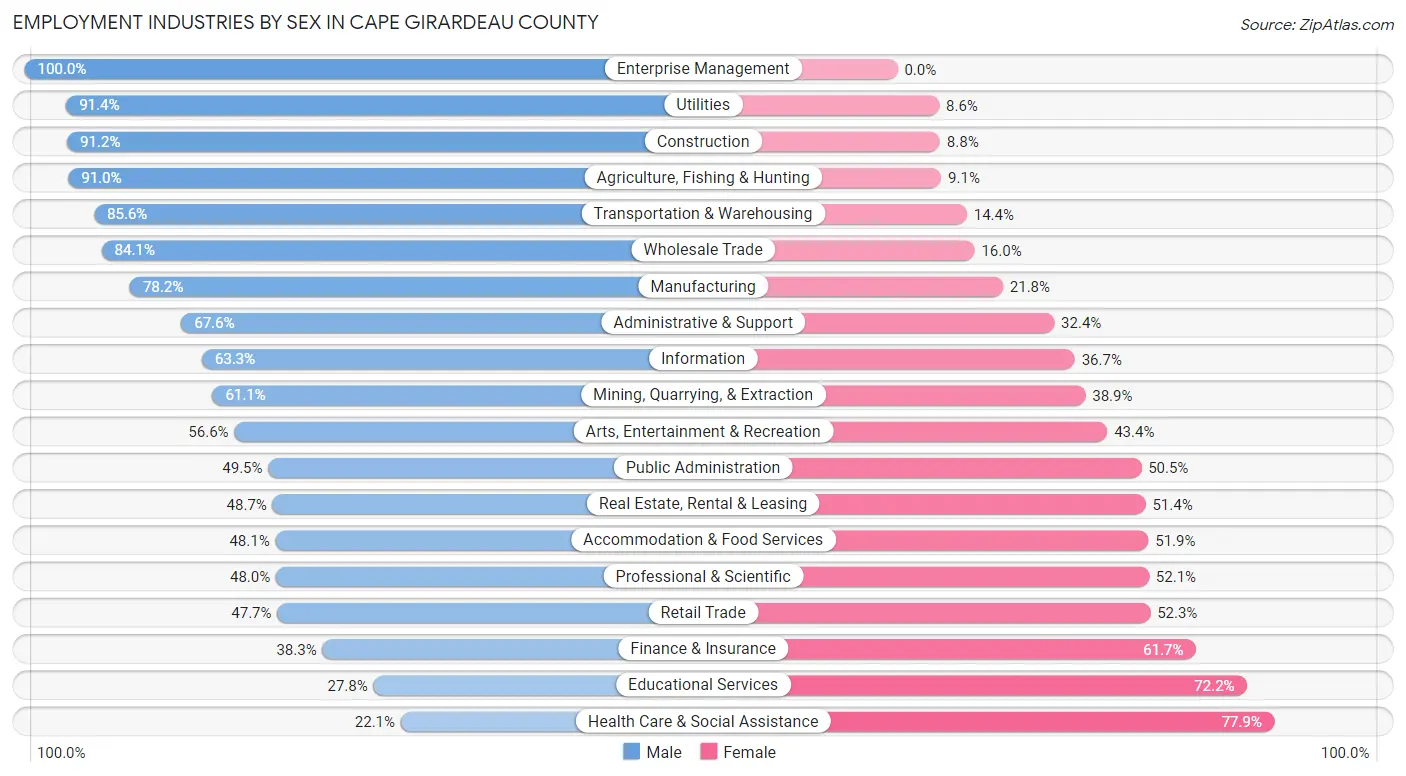
Employment Industries by Sex in Cape Girardeau County
The Cape Girardeau County industries that see more men than women are Enterprise Management (100.0%), Utilities (91.4%), and Construction (91.2%), whereas the industries that tend to have a higher number of women are Health Care & Social Assistance (77.9%), Educational Services (72.2%), and Finance & Insurance (61.7%).
| Industry | Male | Female |
| Agriculture, Fishing & Hunting | 412 (90.9%) | 41 (9.0%) |
| Mining, Quarrying, & Extraction | 110 (61.1%) | 70 (38.9%) |
| Construction | 1,982 (91.2%) | 191 (8.8%) |
| Manufacturing | 3,057 (78.2%) | 853 (21.8%) |
| Wholesale Trade | 1,054 (84.1%) | 200 (16.0%) |
| Retail Trade | 2,451 (47.7%) | 2,689 (52.3%) |
| Transportation & Warehousing | 1,306 (85.6%) | 219 (14.4%) |
| Utilities | 159 (91.4%) | 15 (8.6%) |
| Information | 357 (63.3%) | 207 (36.7%) |
| Finance & Insurance | 717 (38.3%) | 1,153 (61.7%) |
| Real Estate, Rental & Leasing | 253 (48.6%) | 267 (51.3%) |
| Professional & Scientific | 889 (47.9%) | 965 (52.0%) |
| Enterprise Management | 22 (100.0%) | 0 (0.0%) |
| Administrative & Support | 760 (67.6%) | 365 (32.4%) |
| Educational Services | 1,346 (27.8%) | 3,501 (72.2%) |
| Health Care & Social Assistance | 1,623 (22.1%) | 5,714 (77.9%) |
| Arts, Entertainment & Recreation | 340 (56.6%) | 261 (43.4%) |
| Accommodation & Food Services | 1,753 (48.1%) | 1,894 (51.9%) |
| Public Administration | 816 (49.5%) | 831 (50.5%) |
| Total | 20,528 (49.6%) | 20,825 (50.4%) |
Education in Cape Girardeau County
School Enrollment in Cape Girardeau County
The most common levels of schooling among the 21,737 students in Cape Girardeau County are college / undergraduate (7,270 | 33.5%), elementary school (4,254 | 19.6%), and middle school (4,003 | 18.4%).
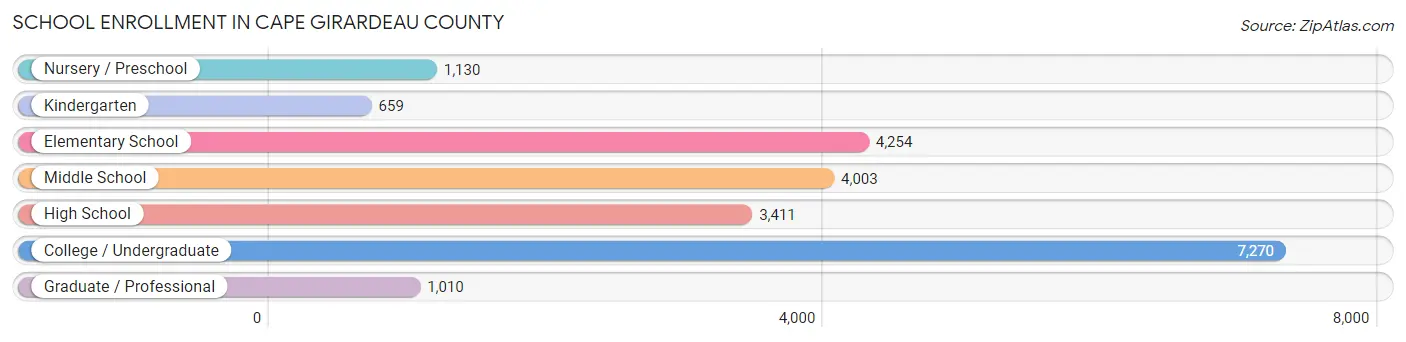
| School Level | # Students | % Students |
| Nursery / Preschool | 1,130 | 5.2% |
| Kindergarten | 659 | 3.0% |
| Elementary School | 4,254 | 19.6% |
| Middle School | 4,003 | 18.4% |
| High School | 3,411 | 15.7% |
| College / Undergraduate | 7,270 | 33.5% |
| Graduate / Professional | 1,010 | 4.6% |
| Total | 21,737 | 100.0% |
School Enrollment by Age by Funding Source in Cape Girardeau County
Out of a total of 21,737 students who are enrolled in schools in Cape Girardeau County, 3,021 (13.9%) attend a private institution, while the remaining 18,716 (86.1%) are enrolled in public schools. The age group of 3 to 4 year olds has the highest likelihood of being enrolled in private schools, with 386 (45.2% in the age bracket) enrolled. Conversely, the age group of 20 to 24 year olds has the lowest likelihood of being enrolled in a private school, with 4,203 (95.4% in the age bracket) attending a public institution.
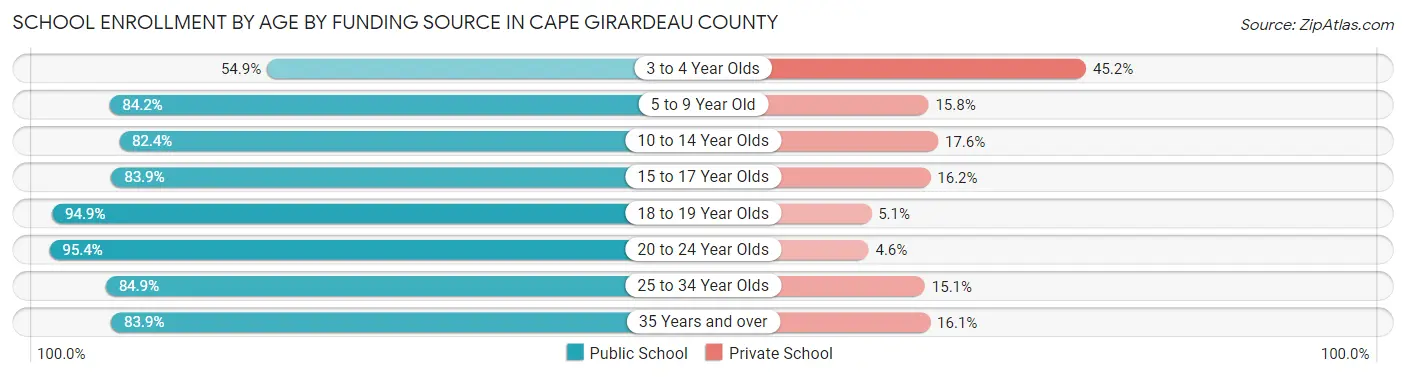
| Age Bracket | Public School | Private School |
| 3 to 4 Year Olds | 469 (54.8%) | 386 (45.2%) |
| 5 to 9 Year Old | 3,785 (84.2%) | 710 (15.8%) |
| 10 to 14 Year Olds | 4,055 (82.4%) | 865 (17.6%) |
| 15 to 17 Year Olds | 2,290 (83.9%) | 441 (16.2%) |
| 18 to 19 Year Olds | 2,388 (94.9%) | 129 (5.1%) |
| 20 to 24 Year Olds | 4,203 (95.4%) | 204 (4.6%) |
| 25 to 34 Year Olds | 848 (84.9%) | 151 (15.1%) |
| 35 Years and over | 682 (83.9%) | 131 (16.1%) |
| Total | 18,716 (86.1%) | 3,021 (13.9%) |
Educational Attainment by Field of Study in Cape Girardeau County
Education (3,895 | 20.4%), science & technology (2,948 | 15.4%), business (2,774 | 14.5%), arts & humanities (1,692 | 8.9%), and bio, nature & agricultural (1,299 | 6.8%) are the most common fields of study among 19,101 individuals in Cape Girardeau County who have obtained a bachelor's degree or higher.
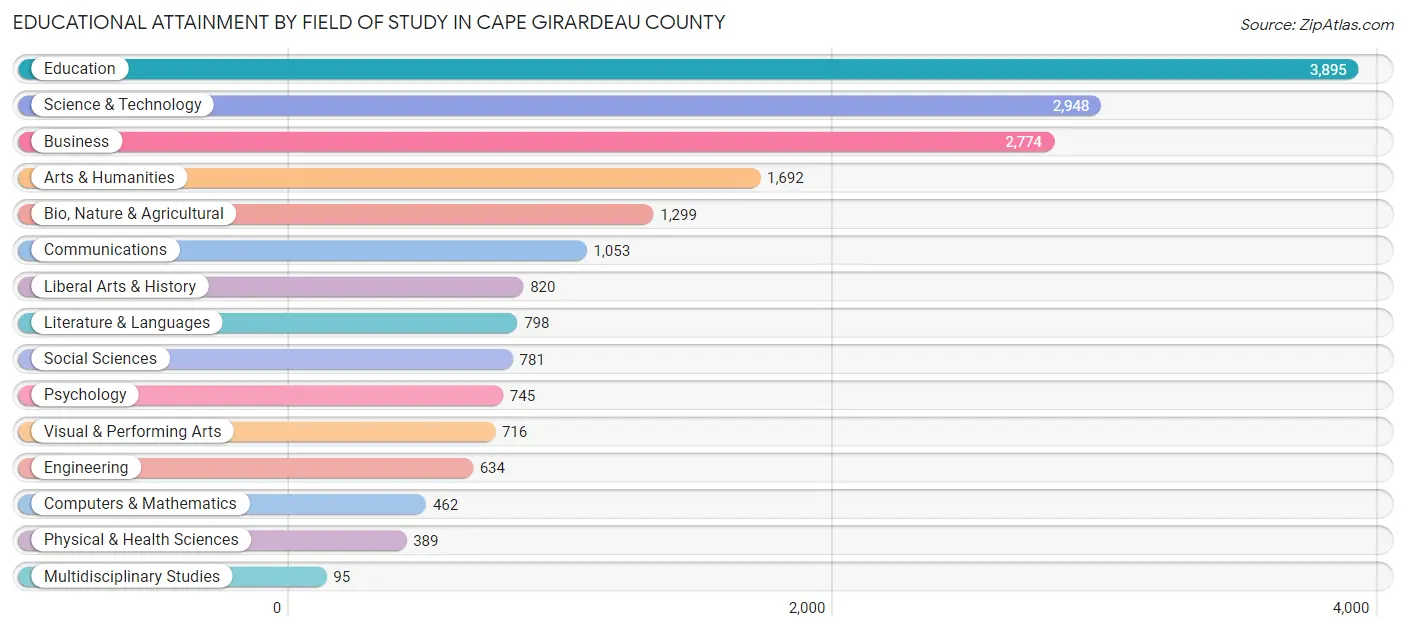
| Field of Study | # Graduates | % Graduates |
| Computers & Mathematics | 462 | 2.4% |
| Bio, Nature & Agricultural | 1,299 | 6.8% |
| Physical & Health Sciences | 389 | 2.0% |
| Psychology | 745 | 3.9% |
| Social Sciences | 781 | 4.1% |
| Engineering | 634 | 3.3% |
| Multidisciplinary Studies | 95 | 0.5% |
| Science & Technology | 2,948 | 15.4% |
| Business | 2,774 | 14.5% |
| Education | 3,895 | 20.4% |
| Literature & Languages | 798 | 4.2% |
| Liberal Arts & History | 820 | 4.3% |
| Visual & Performing Arts | 716 | 3.7% |
| Communications | 1,053 | 5.5% |
| Arts & Humanities | 1,692 | 8.9% |
| Total | 19,101 | 100.0% |
Transportation & Commute in Cape Girardeau County
Vehicle Availability by Sex in Cape Girardeau County
The most prevalent vehicle ownership categories in Cape Girardeau County are males with 2 vehicles (8,120, accounting for 40.5%) and females with 2 vehicles (8,189, making up 39.9%).
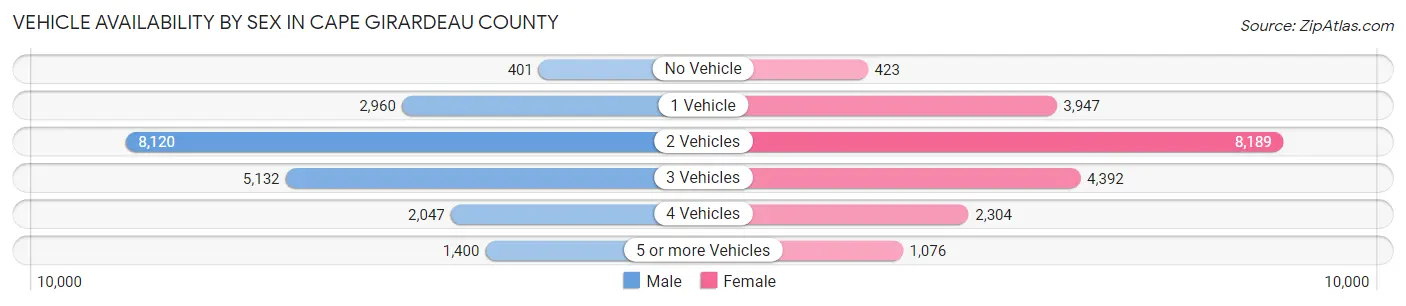
| Vehicles Available | Male | Female |
| No Vehicle | 401 (2.0%) | 423 (2.1%) |
| 1 Vehicle | 2,960 (14.8%) | 3,947 (19.4%) |
| 2 Vehicles | 8,120 (40.5%) | 8,189 (40.3%) |
| 3 Vehicles | 5,132 (25.6%) | 4,392 (21.6%) |
| 4 Vehicles | 2,047 (10.2%) | 2,304 (11.3%) |
| 5 or more Vehicles | 1,400 (7.0%) | 1,076 (5.3%) |
| Total | 20,060 (100.0%) | 20,331 (100.0%) |
Commute Time in Cape Girardeau County
The most frequently occuring commute durations in Cape Girardeau County are 10 to 14 minutes (7,868 commuters, 20.7%), 15 to 19 minutes (7,491 commuters, 19.7%), and 5 to 9 minutes (6,168 commuters, 16.2%).
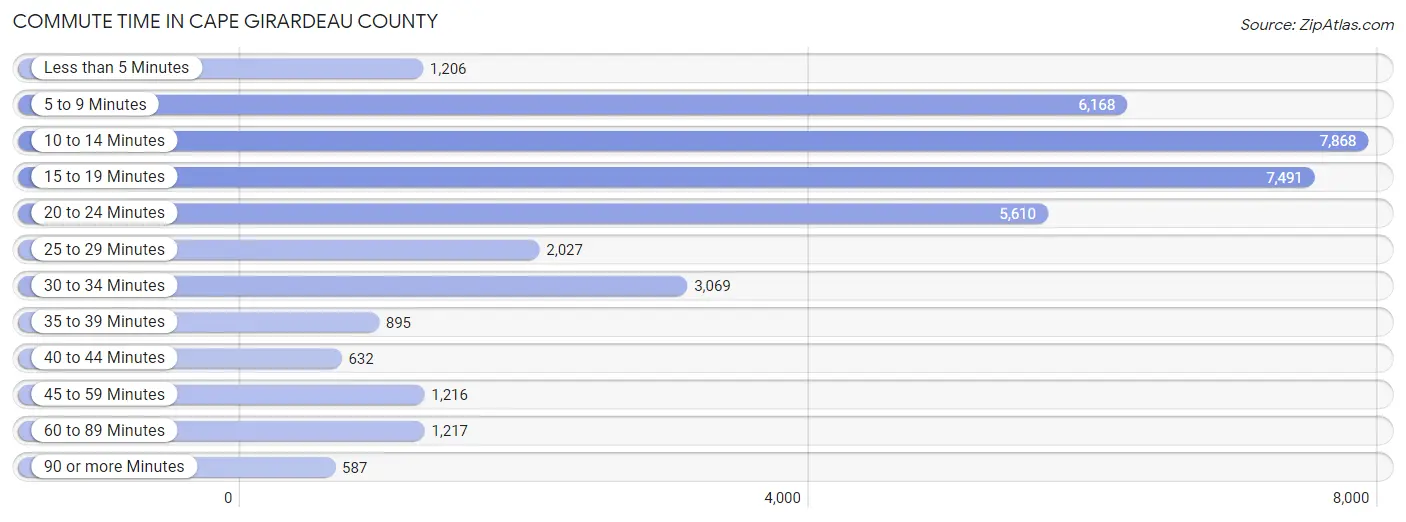
| Commute Time | # Commuters | % Commuters |
| Less than 5 Minutes | 1,206 | 3.2% |
| 5 to 9 Minutes | 6,168 | 16.2% |
| 10 to 14 Minutes | 7,868 | 20.7% |
| 15 to 19 Minutes | 7,491 | 19.7% |
| 20 to 24 Minutes | 5,610 | 14.8% |
| 25 to 29 Minutes | 2,027 | 5.3% |
| 30 to 34 Minutes | 3,069 | 8.1% |
| 35 to 39 Minutes | 895 | 2.4% |
| 40 to 44 Minutes | 632 | 1.7% |
| 45 to 59 Minutes | 1,216 | 3.2% |
| 60 to 89 Minutes | 1,217 | 3.2% |
| 90 or more Minutes | 587 | 1.5% |
Commute Time by Sex in Cape Girardeau County
The most common commute times in Cape Girardeau County are 10 to 14 minutes (3,746 commuters, 19.9%) for males and 10 to 14 minutes (4,122 commuters, 21.5%) for females.
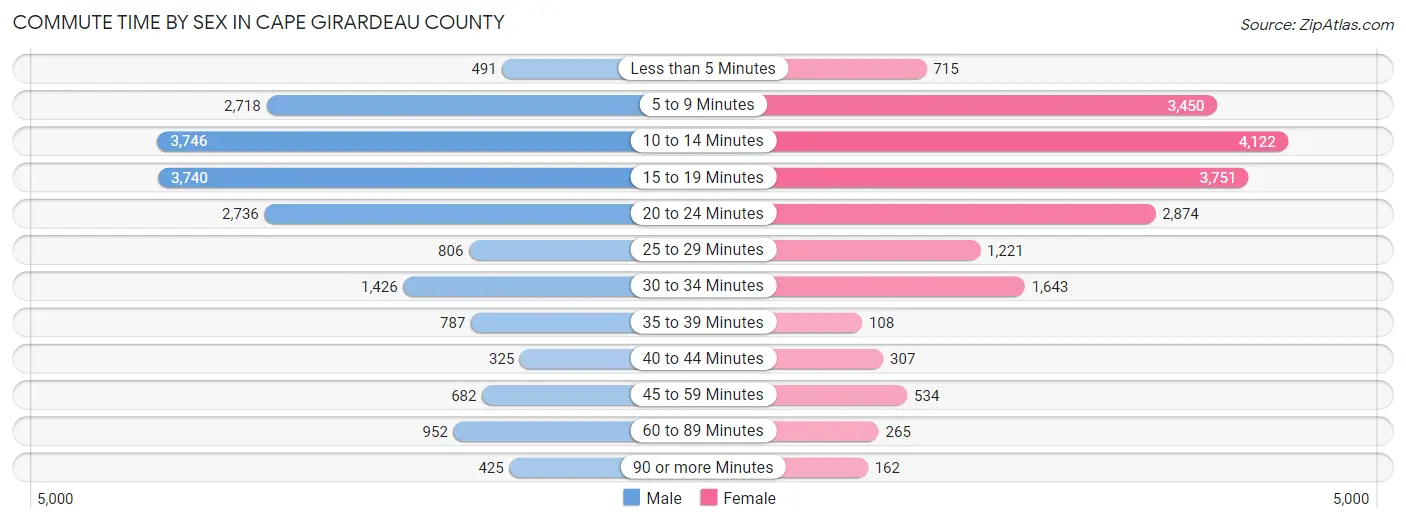
| Commute Time | Male | Female |
| Less than 5 Minutes | 491 (2.6%) | 715 (3.7%) |
| 5 to 9 Minutes | 2,718 (14.4%) | 3,450 (18.0%) |
| 10 to 14 Minutes | 3,746 (19.9%) | 4,122 (21.5%) |
| 15 to 19 Minutes | 3,740 (19.9%) | 3,751 (19.6%) |
| 20 to 24 Minutes | 2,736 (14.5%) | 2,874 (15.0%) |
| 25 to 29 Minutes | 806 (4.3%) | 1,221 (6.4%) |
| 30 to 34 Minutes | 1,426 (7.6%) | 1,643 (8.6%) |
| 35 to 39 Minutes | 787 (4.2%) | 108 (0.6%) |
| 40 to 44 Minutes | 325 (1.7%) | 307 (1.6%) |
| 45 to 59 Minutes | 682 (3.6%) | 534 (2.8%) |
| 60 to 89 Minutes | 952 (5.1%) | 265 (1.4%) |
| 90 or more Minutes | 425 (2.3%) | 162 (0.9%) |
Time of Departure to Work by Sex in Cape Girardeau County
The most frequent times of departure to work in Cape Girardeau County are 7:00 AM to 7:29 AM (2,999, 15.9%) for males and 7:30 AM to 7:59 AM (4,025, 21.0%) for females.
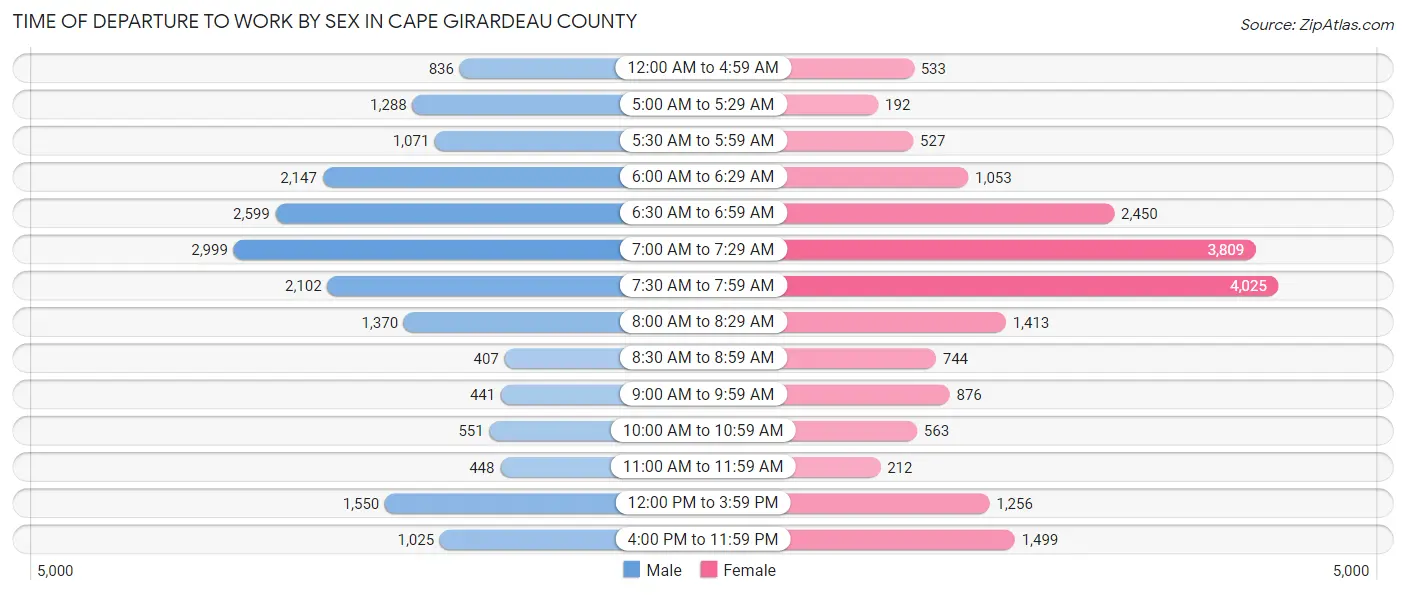
| Time of Departure | Male | Female |
| 12:00 AM to 4:59 AM | 836 (4.4%) | 533 (2.8%) |
| 5:00 AM to 5:29 AM | 1,288 (6.8%) | 192 (1.0%) |
| 5:30 AM to 5:59 AM | 1,071 (5.7%) | 527 (2.8%) |
| 6:00 AM to 6:29 AM | 2,147 (11.4%) | 1,053 (5.5%) |
| 6:30 AM to 6:59 AM | 2,599 (13.8%) | 2,450 (12.8%) |
| 7:00 AM to 7:29 AM | 2,999 (15.9%) | 3,809 (19.9%) |
| 7:30 AM to 7:59 AM | 2,102 (11.2%) | 4,025 (21.0%) |
| 8:00 AM to 8:29 AM | 1,370 (7.3%) | 1,413 (7.4%) |
| 8:30 AM to 8:59 AM | 407 (2.2%) | 744 (3.9%) |
| 9:00 AM to 9:59 AM | 441 (2.3%) | 876 (4.6%) |
| 10:00 AM to 10:59 AM | 551 (2.9%) | 563 (2.9%) |
| 11:00 AM to 11:59 AM | 448 (2.4%) | 212 (1.1%) |
| 12:00 PM to 3:59 PM | 1,550 (8.2%) | 1,256 (6.6%) |
| 4:00 PM to 11:59 PM | 1,025 (5.4%) | 1,499 (7.8%) |
| Total | 18,834 (100.0%) | 19,152 (100.0%) |
Housing Occupancy in Cape Girardeau County
Occupancy by Ownership in Cape Girardeau County
Of the total 31,578 dwellings in Cape Girardeau County, owner-occupied units account for 21,205 (67.1%), while renter-occupied units make up 10,373 (32.9%).
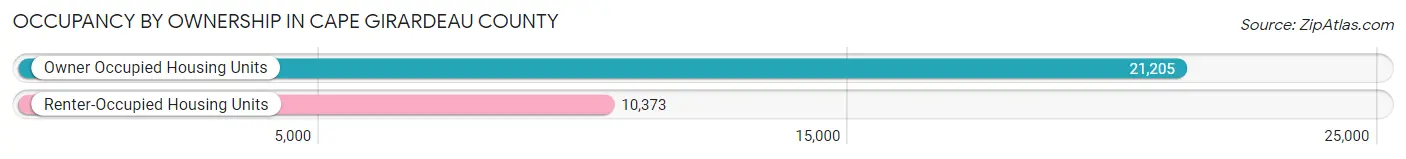
| Occupancy | # Housing Units | % Housing Units |
| Owner Occupied Housing Units | 21,205 | 67.1% |
| Renter-Occupied Housing Units | 10,373 | 32.9% |
| Total Occupied Housing Units | 31,578 | 100.0% |
Occupancy by Household Size in Cape Girardeau County
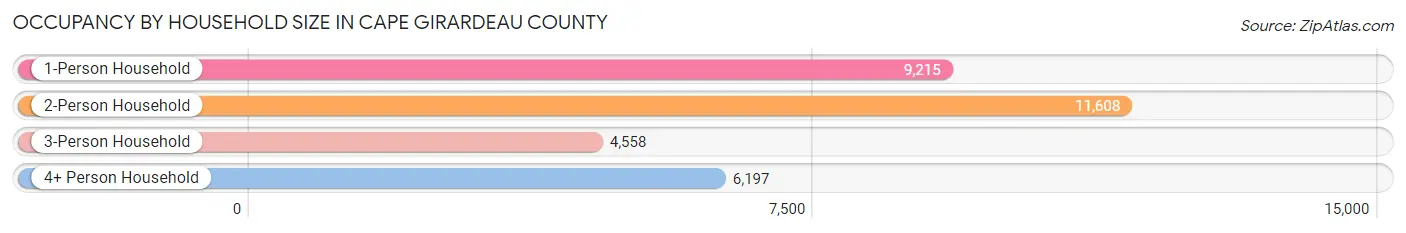
| Household Size | # Housing Units | % Housing Units |
| 1-Person Household | 9,215 | 29.2% |
| 2-Person Household | 11,608 | 36.8% |
| 3-Person Household | 4,558 | 14.4% |
| 4+ Person Household | 6,197 | 19.6% |
| Total Housing Units | 31,578 | 100.0% |
Occupancy by Ownership by Household Size in Cape Girardeau County
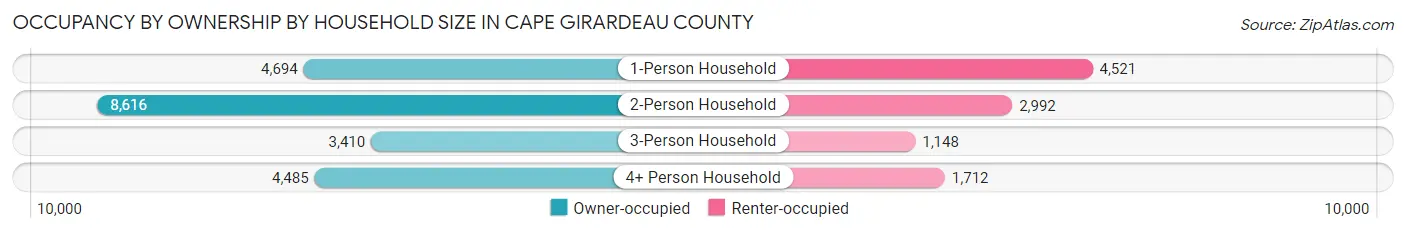
| Household Size | Owner-occupied | Renter-occupied |
| 1-Person Household | 4,694 (50.9%) | 4,521 (49.1%) |
| 2-Person Household | 8,616 (74.2%) | 2,992 (25.8%) |
| 3-Person Household | 3,410 (74.8%) | 1,148 (25.2%) |
| 4+ Person Household | 4,485 (72.4%) | 1,712 (27.6%) |
| Total Housing Units | 21,205 (67.1%) | 10,373 (32.9%) |
Occupancy by Educational Attainment in Cape Girardeau County
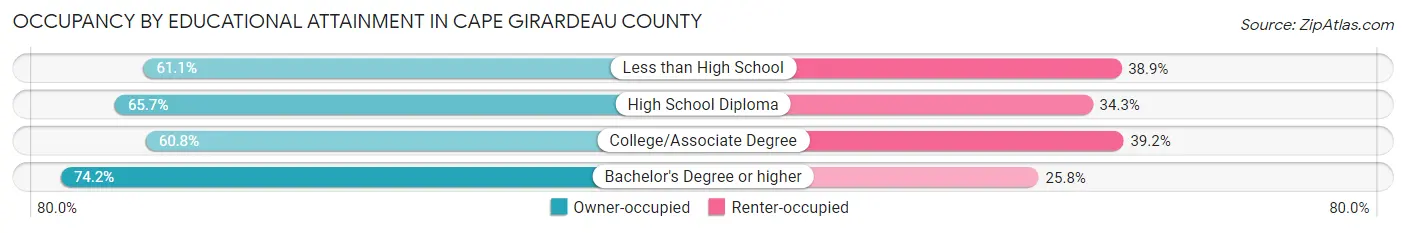
| Household Size | Owner-occupied | Renter-occupied |
| Less than High School | 1,328 (61.1%) | 844 (38.9%) |
| High School Diploma | 6,043 (65.7%) | 3,160 (34.3%) |
| College/Associate Degree | 5,252 (60.8%) | 3,390 (39.2%) |
| Bachelor's Degree or higher | 8,582 (74.2%) | 2,979 (25.8%) |
Occupancy by Age of Householder in Cape Girardeau County
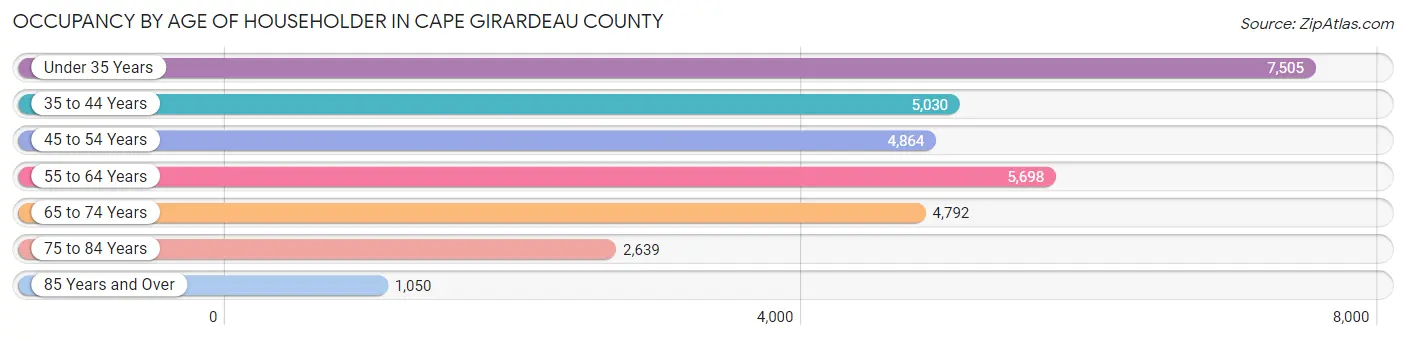
| Age Bracket | # Households | % Households |
| Under 35 Years | 7,505 | 23.8% |
| 35 to 44 Years | 5,030 | 15.9% |
| 45 to 54 Years | 4,864 | 15.4% |
| 55 to 64 Years | 5,698 | 18.0% |
| 65 to 74 Years | 4,792 | 15.2% |
| 75 to 84 Years | 2,639 | 8.4% |
| 85 Years and Over | 1,050 | 3.3% |
| Total | 31,578 | 100.0% |
Housing Finances in Cape Girardeau County
Median Income by Occupancy in Cape Girardeau County
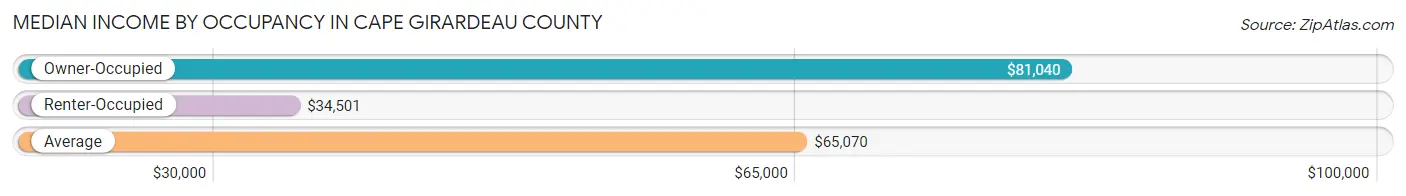
| Occupancy Type | # Households | Median Income |
| Owner-Occupied | 21,205 (67.1%) | $81,040 |
| Renter-Occupied | 10,373 (32.9%) | $34,501 |
| Average | 31,578 (100.0%) | $65,070 |
Occupancy by Householder Income Bracket in Cape Girardeau County
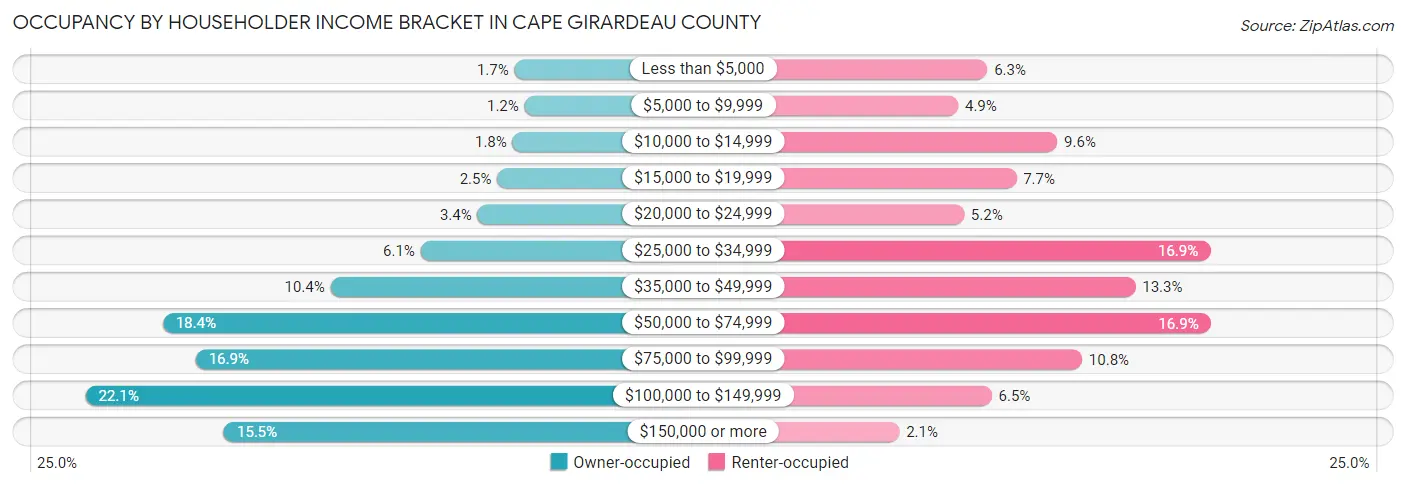
| Income Bracket | Owner-occupied | Renter-occupied |
| Less than $5,000 | 355 (1.7%) | 650 (6.3%) |
| $5,000 to $9,999 | 252 (1.2%) | 506 (4.9%) |
| $10,000 to $14,999 | 373 (1.8%) | 996 (9.6%) |
| $15,000 to $19,999 | 527 (2.5%) | 794 (7.6%) |
| $20,000 to $24,999 | 727 (3.4%) | 535 (5.2%) |
| $25,000 to $34,999 | 1,302 (6.1%) | 1,751 (16.9%) |
| $35,000 to $49,999 | 2,212 (10.4%) | 1,382 (13.3%) |
| $50,000 to $74,999 | 3,907 (18.4%) | 1,753 (16.9%) |
| $75,000 to $99,999 | 3,574 (16.9%) | 1,118 (10.8%) |
| $100,000 to $149,999 | 4,687 (22.1%) | 672 (6.5%) |
| $150,000 or more | 3,289 (15.5%) | 216 (2.1%) |
| Total | 21,205 (100.0%) | 10,373 (100.0%) |
Monthly Housing Cost Tiers in Cape Girardeau County
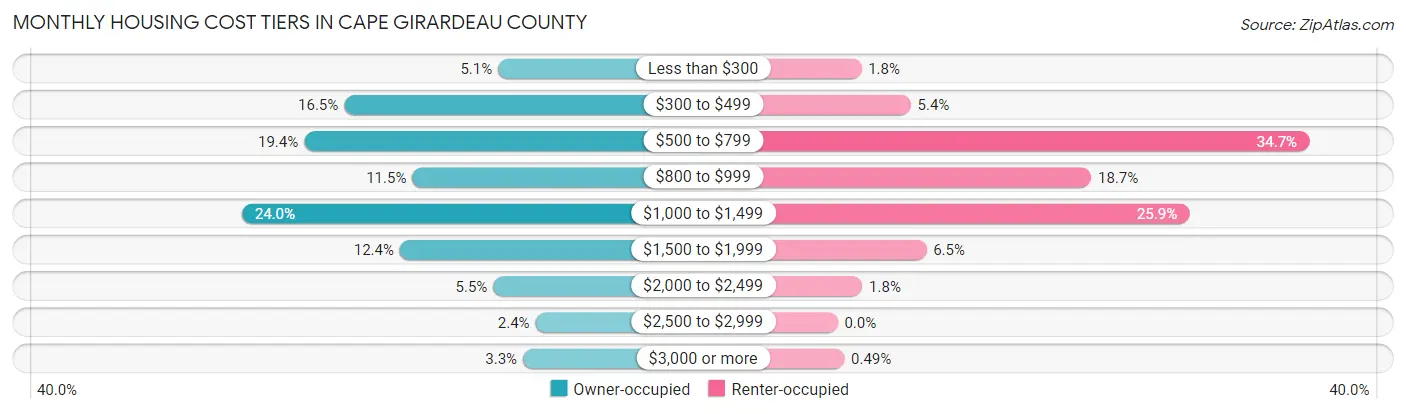
| Monthly Cost | Owner-occupied | Renter-occupied |
| Less than $300 | 1,087 (5.1%) | 182 (1.8%) |
| $300 to $499 | 3,492 (16.5%) | 559 (5.4%) |
| $500 to $799 | 4,118 (19.4%) | 3,602 (34.7%) |
| $800 to $999 | 2,427 (11.5%) | 1,938 (18.7%) |
| $1,000 to $1,499 | 5,089 (24.0%) | 2,686 (25.9%) |
| $1,500 to $1,999 | 2,624 (12.4%) | 678 (6.5%) |
| $2,000 to $2,499 | 1,164 (5.5%) | 189 (1.8%) |
| $2,500 to $2,999 | 504 (2.4%) | 0 (0.0%) |
| $3,000 or more | 700 (3.3%) | 51 (0.5%) |
| Total | 21,205 (100.0%) | 10,373 (100.0%) |
Physical Housing Characteristics in Cape Girardeau County
Housing Structures in Cape Girardeau County
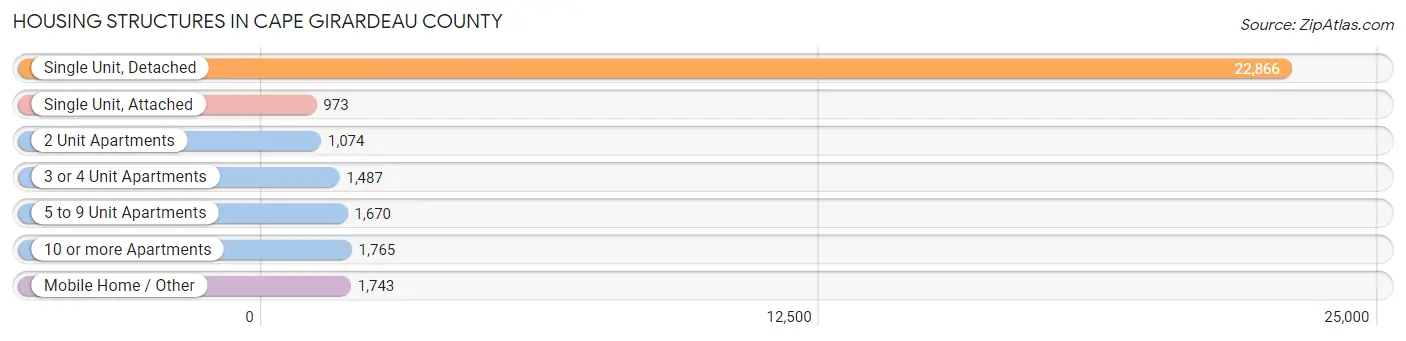
| Structure Type | # Housing Units | % Housing Units |
| Single Unit, Detached | 22,866 | 72.4% |
| Single Unit, Attached | 973 | 3.1% |
| 2 Unit Apartments | 1,074 | 3.4% |
| 3 or 4 Unit Apartments | 1,487 | 4.7% |
| 5 to 9 Unit Apartments | 1,670 | 5.3% |
| 10 or more Apartments | 1,765 | 5.6% |
| Mobile Home / Other | 1,743 | 5.5% |
| Total | 31,578 | 100.0% |
Housing Structures by Occupancy in Cape Girardeau County
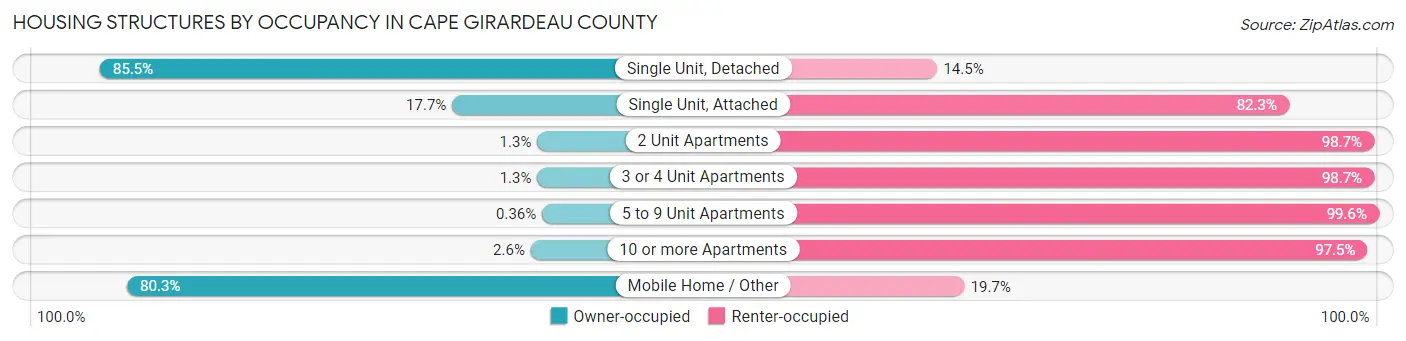
| Structure Type | Owner-occupied | Renter-occupied |
| Single Unit, Detached | 19,550 (85.5%) | 3,316 (14.5%) |
| Single Unit, Attached | 172 (17.7%) | 801 (82.3%) |
| 2 Unit Apartments | 14 (1.3%) | 1,060 (98.7%) |
| 3 or 4 Unit Apartments | 19 (1.3%) | 1,468 (98.7%) |
| 5 to 9 Unit Apartments | 6 (0.4%) | 1,664 (99.6%) |
| 10 or more Apartments | 45 (2.5%) | 1,720 (97.5%) |
| Mobile Home / Other | 1,399 (80.3%) | 344 (19.7%) |
| Total | 21,205 (67.1%) | 10,373 (32.9%) |
Housing Structures by Number of Rooms in Cape Girardeau County
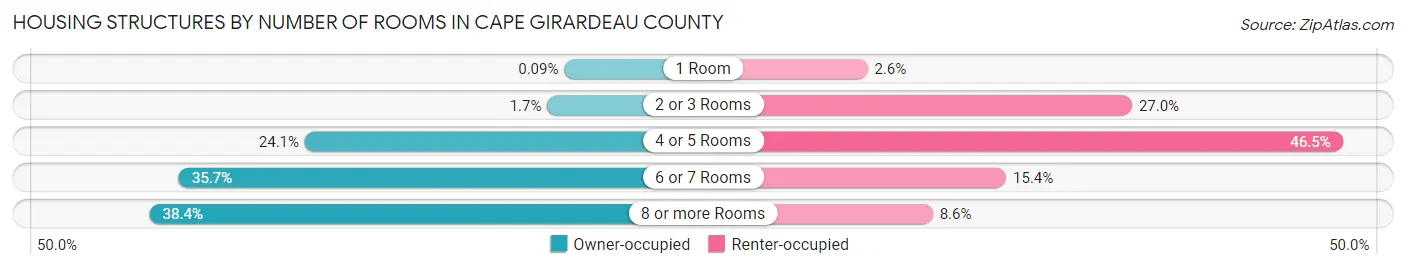
| Number of Rooms | Owner-occupied | Renter-occupied |
| 1 Room | 20 (0.1%) | 265 (2.5%) |
| 2 or 3 Rooms | 352 (1.7%) | 2,802 (27.0%) |
| 4 or 5 Rooms | 5,106 (24.1%) | 4,822 (46.5%) |
| 6 or 7 Rooms | 7,577 (35.7%) | 1,594 (15.4%) |
| 8 or more Rooms | 8,150 (38.4%) | 890 (8.6%) |
| Total | 21,205 (100.0%) | 10,373 (100.0%) |
Housing Structure by Heating Type in Cape Girardeau County
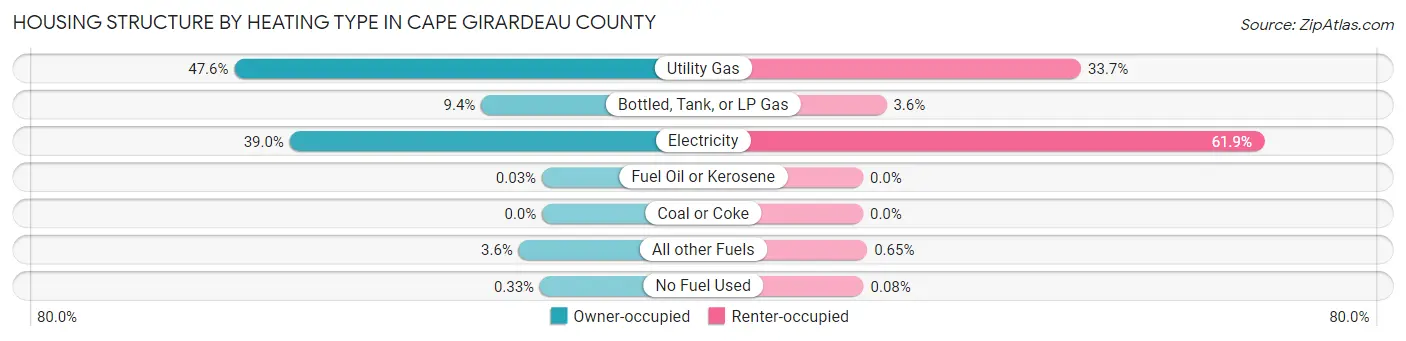
| Heating Type | Owner-occupied | Renter-occupied |
| Utility Gas | 10,089 (47.6%) | 3,497 (33.7%) |
| Bottled, Tank, or LP Gas | 1,997 (9.4%) | 376 (3.6%) |
| Electricity | 8,274 (39.0%) | 6,425 (61.9%) |
| Fuel Oil or Kerosene | 7 (0.0%) | 0 (0.0%) |
| Coal or Coke | 0 (0.0%) | 0 (0.0%) |
| All other Fuels | 767 (3.6%) | 67 (0.6%) |
| No Fuel Used | 71 (0.3%) | 8 (0.1%) |
| Total | 21,205 (100.0%) | 10,373 (100.0%) |
Household Vehicle Usage in Cape Girardeau County
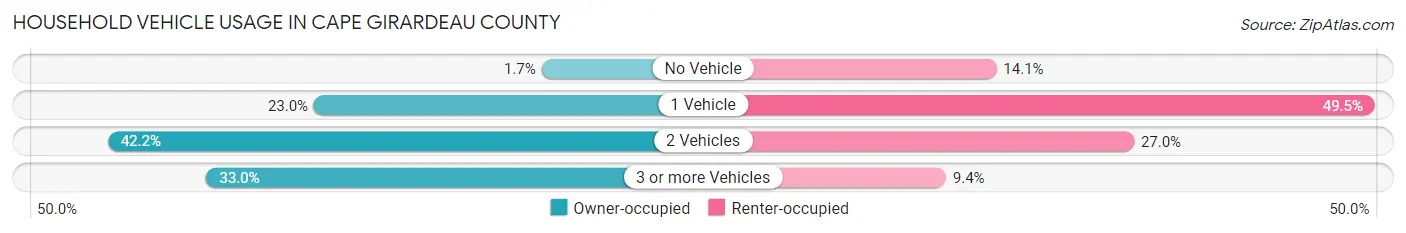
| Vehicles per Household | Owner-occupied | Renter-occupied |
| No Vehicle | 369 (1.7%) | 1,467 (14.1%) |
| 1 Vehicle | 4,876 (23.0%) | 5,130 (49.5%) |
| 2 Vehicles | 8,956 (42.2%) | 2,799 (27.0%) |
| 3 or more Vehicles | 7,004 (33.0%) | 977 (9.4%) |
| Total | 21,205 (100.0%) | 10,373 (100.0%) |
Real Estate & Mortgages in Cape Girardeau County
Real Estate and Mortgage Overview in Cape Girardeau County
| Characteristic | Without Mortgage | With Mortgage |
| Housing Units | 8,071 | 13,134 |
| Median Property Value | $181,100 | $204,100 |
| Median Household Income | $60,302 | $2,602 |
| Monthly Housing Costs | $481 | $700 |
| Real Estate Taxes | $1,266 | $246 |
Property Value by Mortgage Status in Cape Girardeau County
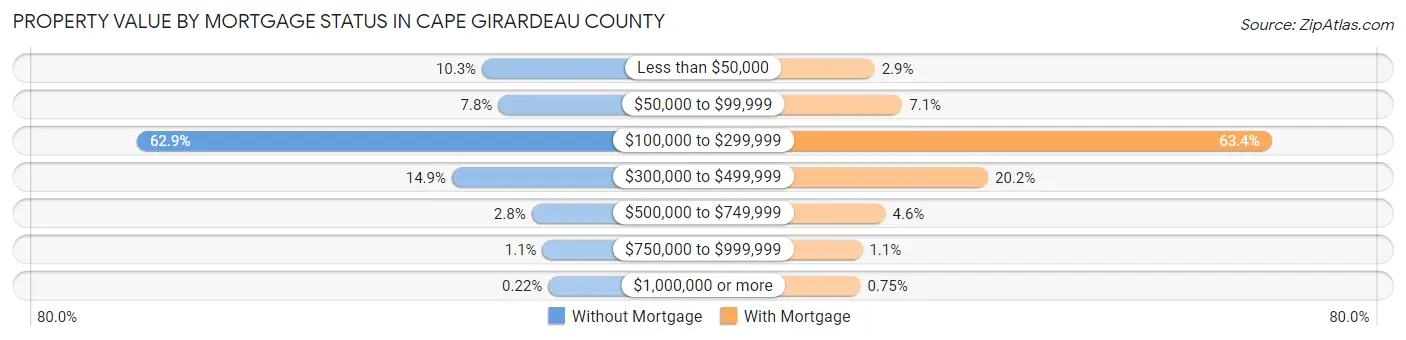
| Property Value | Without Mortgage | With Mortgage |
| Less than $50,000 | 832 (10.3%) | 383 (2.9%) |
| $50,000 to $99,999 | 633 (7.8%) | 937 (7.1%) |
| $100,000 to $299,999 | 5,074 (62.9%) | 8,324 (63.4%) |
| $300,000 to $499,999 | 1,203 (14.9%) | 2,652 (20.2%) |
| $500,000 to $749,999 | 223 (2.8%) | 601 (4.6%) |
| $750,000 to $999,999 | 88 (1.1%) | 138 (1.1%) |
| $1,000,000 or more | 18 (0.2%) | 99 (0.7%) |
| Total | 8,071 (100.0%) | 13,134 (100.0%) |
Household Income by Mortgage Status in Cape Girardeau County
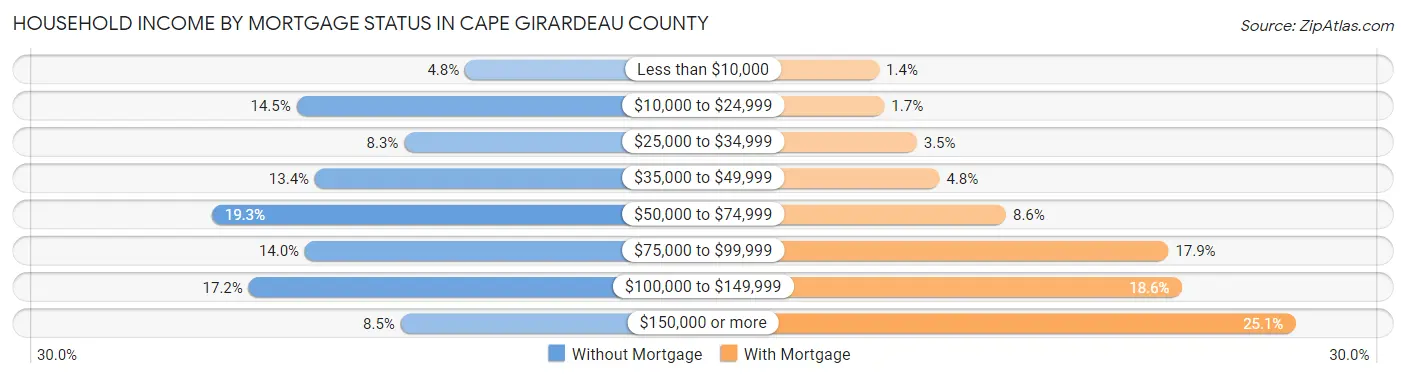
| Household Income | Without Mortgage | With Mortgage |
| Less than $10,000 | 390 (4.8%) | 177 (1.3%) |
| $10,000 to $24,999 | 1,167 (14.5%) | 217 (1.7%) |
| $25,000 to $34,999 | 671 (8.3%) | 460 (3.5%) |
| $35,000 to $49,999 | 1,082 (13.4%) | 631 (4.8%) |
| $50,000 to $74,999 | 1,558 (19.3%) | 1,130 (8.6%) |
| $75,000 to $99,999 | 1,128 (14.0%) | 2,349 (17.9%) |
| $100,000 to $149,999 | 1,388 (17.2%) | 2,446 (18.6%) |
| $150,000 or more | 687 (8.5%) | 3,299 (25.1%) |
| Total | 8,071 (100.0%) | 13,134 (100.0%) |
Property Value to Household Income Ratio in Cape Girardeau County
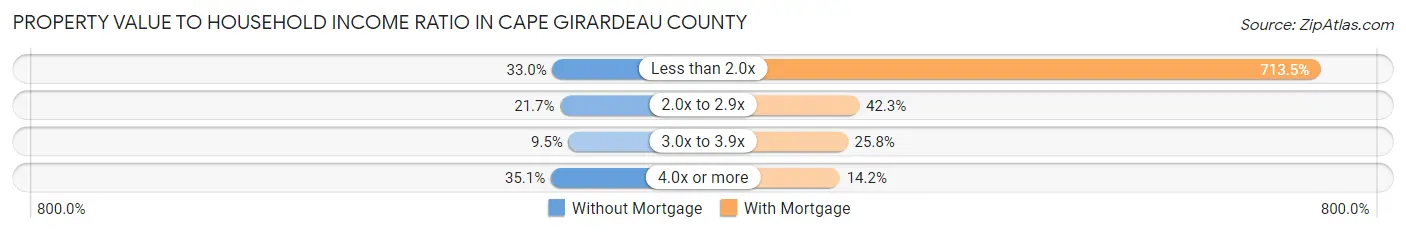
| Value-to-Income Ratio | Without Mortgage | With Mortgage |
| Less than 2.0x | 2,660 (33.0%) | 93,707 (713.5%) |
| 2.0x to 2.9x | 1,754 (21.7%) | 5,551 (42.3%) |
| 3.0x to 3.9x | 767 (9.5%) | 3,387 (25.8%) |
| 4.0x or more | 2,836 (35.1%) | 1,869 (14.2%) |
| Total | 8,071 (100.0%) | 13,134 (100.0%) |
Real Estate Taxes by Mortgage Status in Cape Girardeau County
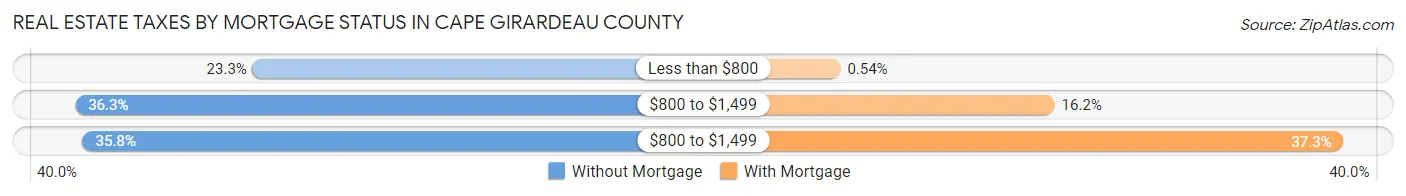
| Property Taxes | Without Mortgage | With Mortgage |
| Less than $800 | 1,884 (23.3%) | 71 (0.5%) |
| $800 to $1,499 | 2,930 (36.3%) | 2,126 (16.2%) |
| $800 to $1,499 | 2,886 (35.8%) | 4,898 (37.3%) |
| Total | 8,071 (100.0%) | 13,134 (100.0%) |
Health & Disability in Cape Girardeau County
Health Insurance Coverage by Age in Cape Girardeau County
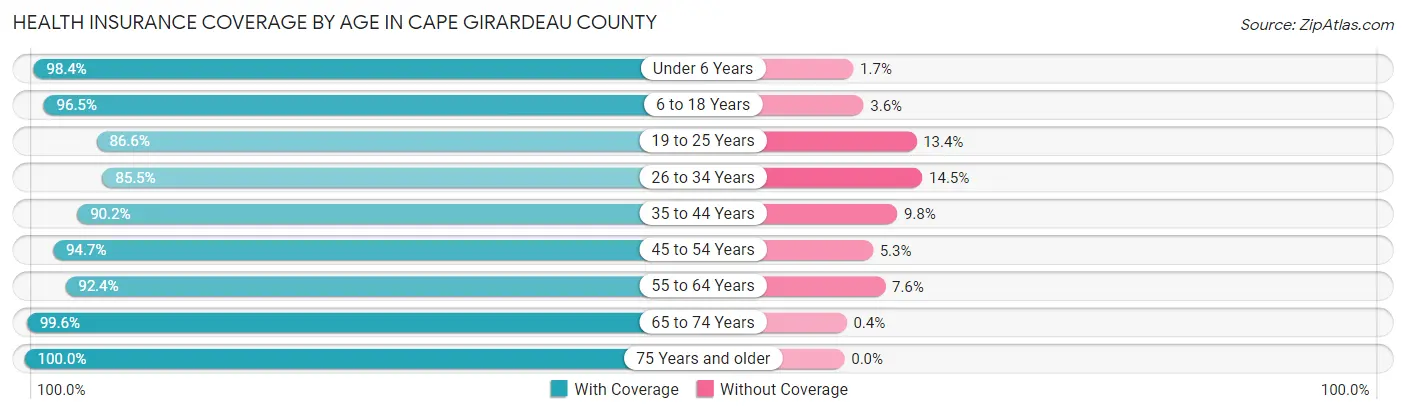
| Age Bracket | With Coverage | Without Coverage |
| Under 6 Years | 5,191 (98.4%) | 87 (1.7%) |
| 6 to 18 Years | 13,057 (96.5%) | 480 (3.5%) |
| 19 to 25 Years | 9,541 (86.6%) | 1,477 (13.4%) |
| 26 to 34 Years | 7,886 (85.5%) | 1,339 (14.5%) |
| 35 to 44 Years | 8,516 (90.2%) | 927 (9.8%) |
| 45 to 54 Years | 8,508 (94.7%) | 476 (5.3%) |
| 55 to 64 Years | 9,220 (92.4%) | 758 (7.6%) |
| 65 to 74 Years | 7,703 (99.6%) | 31 (0.4%) |
| 75 Years and older | 5,295 (100.0%) | 0 (0.0%) |
| Total | 74,917 (93.1%) | 5,575 (6.9%) |
Health Insurance Coverage by Citizenship Status in Cape Girardeau County
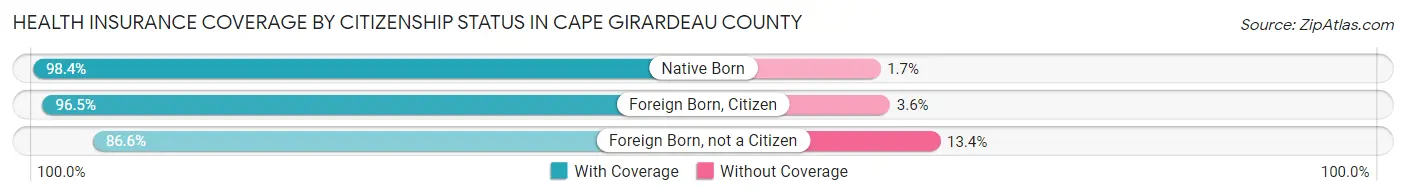
| Citizenship Status | With Coverage | Without Coverage |
| Native Born | 5,191 (98.4%) | 87 (1.7%) |
| Foreign Born, Citizen | 13,057 (96.5%) | 480 (3.5%) |
| Foreign Born, not a Citizen | 9,541 (86.6%) | 1,477 (13.4%) |
Health Insurance Coverage by Household Income in Cape Girardeau County
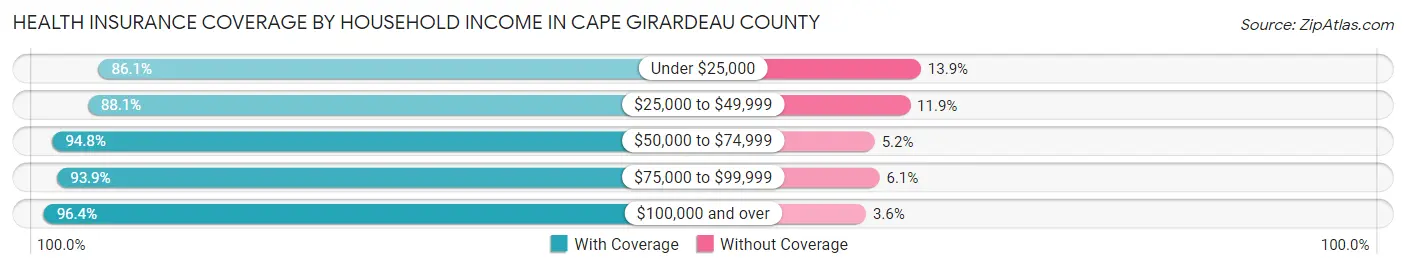
| Household Income | With Coverage | Without Coverage |
| Under $25,000 | 8,118 (86.1%) | 1,308 (13.9%) |
| $25,000 to $49,999 | 12,432 (88.1%) | 1,674 (11.9%) |
| $50,000 to $74,999 | 13,489 (94.8%) | 744 (5.2%) |
| $75,000 to $99,999 | 12,012 (93.9%) | 784 (6.1%) |
| $100,000 and over | 26,436 (96.4%) | 984 (3.6%) |
Public vs Private Health Insurance Coverage by Age in Cape Girardeau County
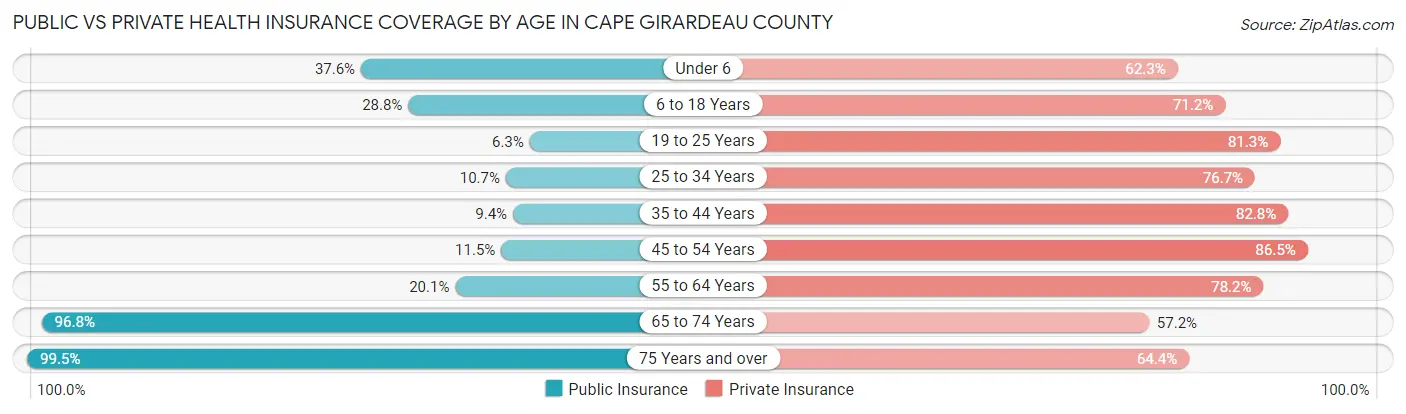
| Age Bracket | Public Insurance | Private Insurance |
| Under 6 | 1,983 (37.6%) | 3,289 (62.3%) |
| 6 to 18 Years | 3,898 (28.8%) | 9,631 (71.2%) |
| 19 to 25 Years | 690 (6.3%) | 8,962 (81.3%) |
| 25 to 34 Years | 986 (10.7%) | 7,074 (76.7%) |
| 35 to 44 Years | 884 (9.4%) | 7,821 (82.8%) |
| 45 to 54 Years | 1,037 (11.5%) | 7,768 (86.5%) |
| 55 to 64 Years | 2,003 (20.1%) | 7,806 (78.2%) |
| 65 to 74 Years | 7,489 (96.8%) | 4,423 (57.2%) |
| 75 Years and over | 5,270 (99.5%) | 3,412 (64.4%) |
| Total | 24,240 (30.1%) | 60,186 (74.8%) |
Disability Status by Sex by Age in Cape Girardeau County
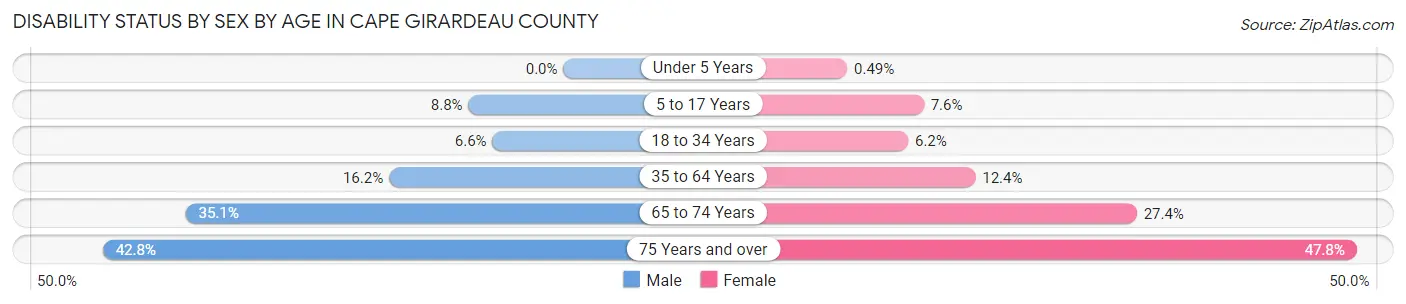
| Age Bracket | Male | Female |
| Under 5 Years | 0 (0.0%) | 11 (0.5%) |
| 5 to 17 Years | 574 (8.8%) | 471 (7.6%) |
| 18 to 34 Years | 687 (6.6%) | 691 (6.1%) |
| 35 to 64 Years | 2,299 (16.2%) | 1,759 (12.4%) |
| 65 to 74 Years | 1,250 (35.1%) | 1,141 (27.4%) |
| 75 Years and over | 928 (42.7%) | 1,493 (47.8%) |
Disability Class by Sex by Age in Cape Girardeau County
Disability Class: Hearing Difficulty
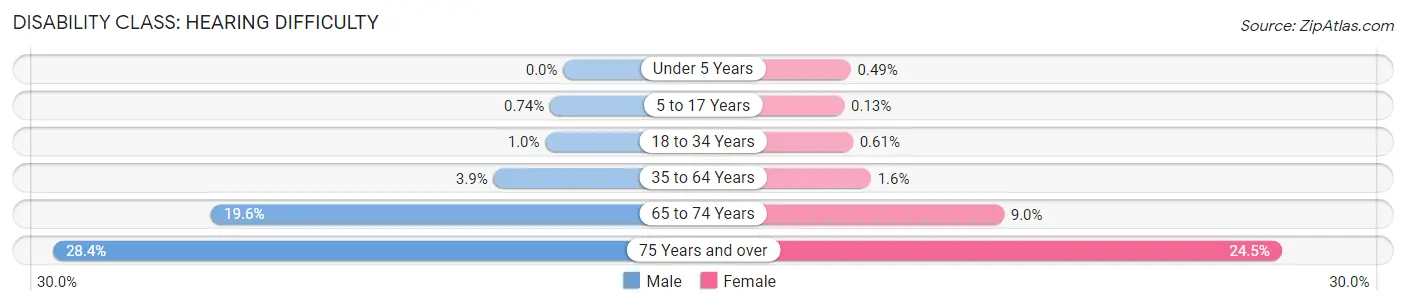
| Age Bracket | Male | Female |
| Under 5 Years | 0 (0.0%) | 11 (0.5%) |
| 5 to 17 Years | 48 (0.7%) | 8 (0.1%) |
| 18 to 34 Years | 104 (1.0%) | 69 (0.6%) |
| 35 to 64 Years | 553 (3.9%) | 229 (1.6%) |
| 65 to 74 Years | 699 (19.6%) | 376 (9.0%) |
| 75 Years and over | 617 (28.4%) | 765 (24.5%) |
Disability Class: Vision Difficulty
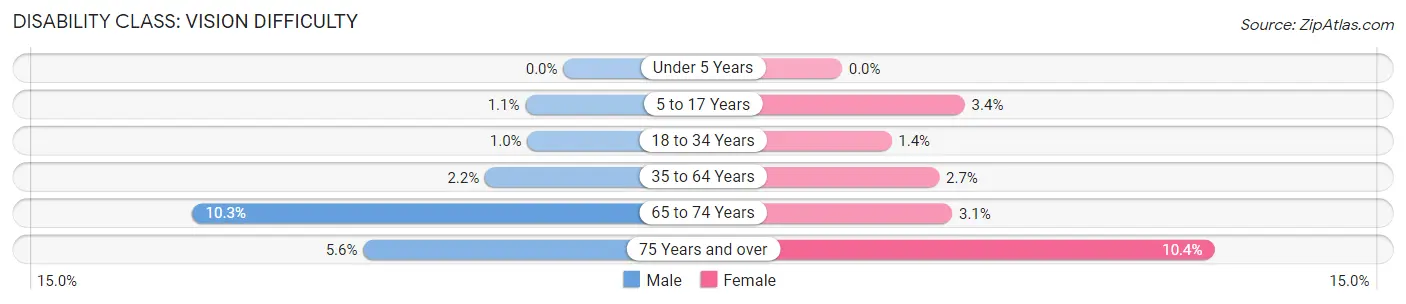
| Age Bracket | Male | Female |
| Under 5 Years | 0 (0.0%) | 0 (0.0%) |
| 5 to 17 Years | 69 (1.1%) | 212 (3.4%) |
| 18 to 34 Years | 104 (1.0%) | 155 (1.4%) |
| 35 to 64 Years | 310 (2.2%) | 385 (2.7%) |
| 65 to 74 Years | 368 (10.3%) | 128 (3.1%) |
| 75 Years and over | 121 (5.6%) | 324 (10.4%) |
Disability Class: Cognitive Difficulty
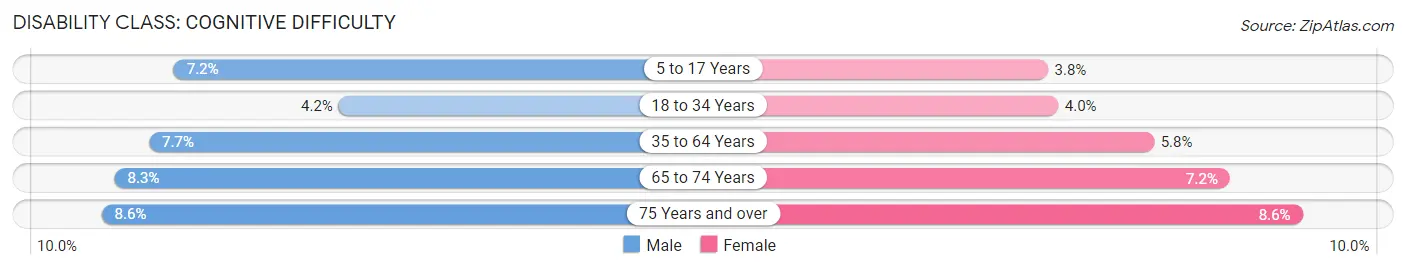
| Age Bracket | Male | Female |
| 5 to 17 Years | 471 (7.2%) | 237 (3.8%) |
| 18 to 34 Years | 435 (4.2%) | 451 (4.0%) |
| 35 to 64 Years | 1,092 (7.7%) | 822 (5.8%) |
| 65 to 74 Years | 297 (8.3%) | 300 (7.2%) |
| 75 Years and over | 186 (8.6%) | 267 (8.6%) |
Disability Class: Ambulatory Difficulty
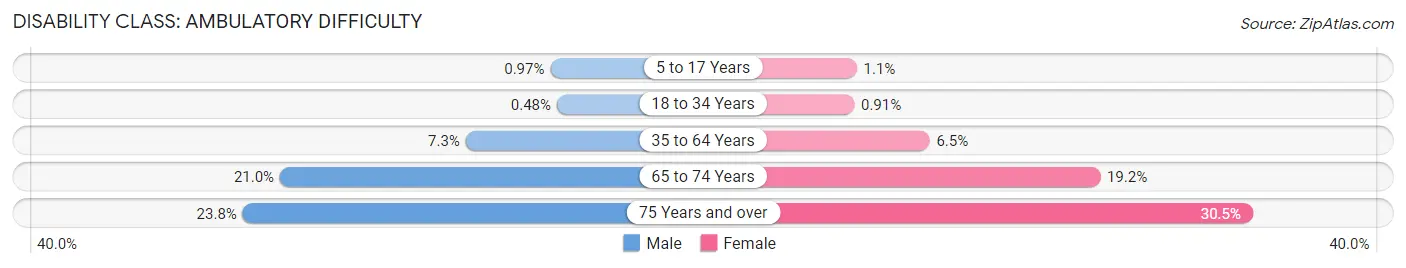
| Age Bracket | Male | Female |
| 5 to 17 Years | 63 (1.0%) | 68 (1.1%) |
| 18 to 34 Years | 50 (0.5%) | 102 (0.9%) |
| 35 to 64 Years | 1,030 (7.2%) | 924 (6.5%) |
| 65 to 74 Years | 750 (21.0%) | 799 (19.2%) |
| 75 Years and over | 517 (23.8%) | 953 (30.5%) |
Disability Class: Self-Care Difficulty
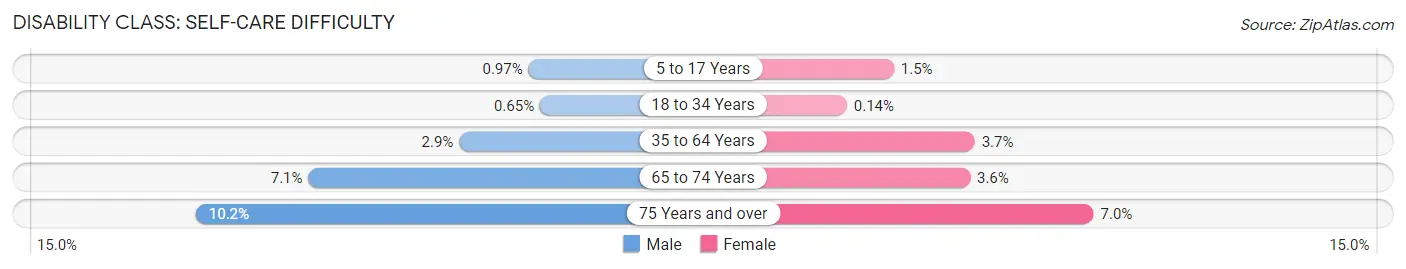
| Age Bracket | Male | Female |
| 5 to 17 Years | 63 (1.0%) | 90 (1.5%) |
| 18 to 34 Years | 68 (0.6%) | 16 (0.1%) |
| 35 to 64 Years | 412 (2.9%) | 525 (3.7%) |
| 65 to 74 Years | 253 (7.1%) | 149 (3.6%) |
| 75 Years and over | 222 (10.2%) | 219 (7.0%) |
Technology Access in Cape Girardeau County
Computing Device Access in Cape Girardeau County
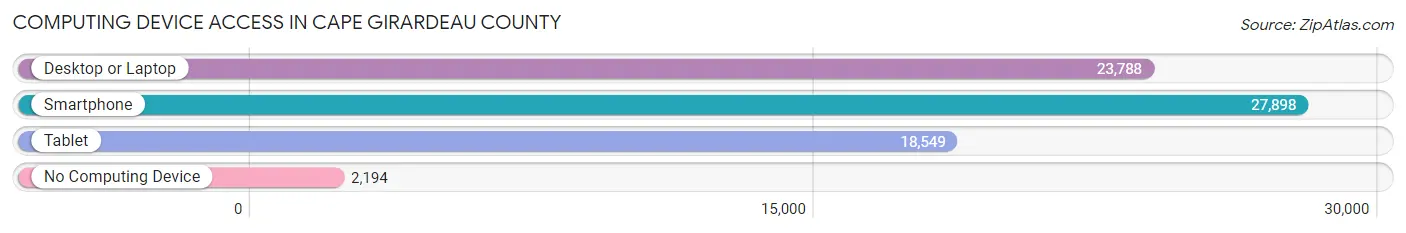
| Device Type | # Households | % Households |
| Desktop or Laptop | 23,788 | 75.3% |
| Smartphone | 27,898 | 88.3% |
| Tablet | 18,549 | 58.7% |
| No Computing Device | 2,194 | 7.0% |
| Total | 31,578 | 100.0% |
Internet Access in Cape Girardeau County
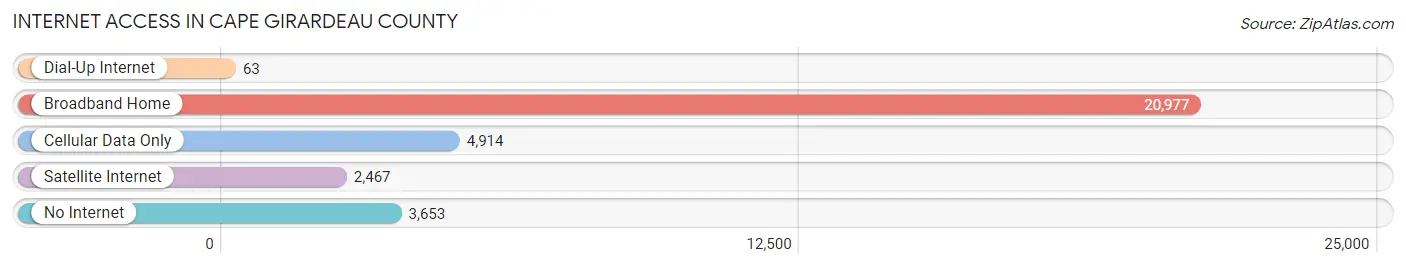
| Internet Type | # Households | % Households |
| Dial-Up Internet | 63 | 0.2% |
| Broadband Home | 20,977 | 66.4% |
| Cellular Data Only | 4,914 | 15.6% |
| Satellite Internet | 2,467 | 7.8% |
| No Internet | 3,653 | 11.6% |
| Total | 31,578 | 100.0% |
Cape Girardeau County Summary
Cape Girardeau County is located in the southeastern corner of Missouri, and is bordered by the Mississippi River to the east, the states of Kentucky and Illinois to the south and west, and Scott County to the north. The county seat is Jackson, and the county is part of the Cape Girardeau–Jackson, MO–IL Metropolitan Statistical Area.
History
Cape Girardeau County was established in 1812, and was named after the French explorer Jean Baptiste de Girardot, who explored the area in 1733. The county was originally part of New Madrid County, and was later divided into several smaller counties, including Cape Girardeau County.
The county was home to several Native American tribes, including the Osage, Shawnee, and Quapaw. The first European settlers arrived in the area in the late 1700s, and the county was officially organized in 1812.
During the Civil War, the county was the site of several battles, including the Battle of Cape Girardeau in 1861. The county was also the site of the Battle of Pilot Knob in 1864.
Geography
Cape Girardeau County covers an area of 576 square miles, and is located in the southeastern corner of Missouri. The county is bordered by the Mississippi River to the east, the states of Kentucky and Illinois to the south and west, and Scott County to the north.
The county is mostly flat, with some rolling hills in the northern and western parts. The highest point in the county is located in the northern part of the county, at an elevation of 845 feet.
The county is home to several rivers and streams, including the Big and Little Whitewater Rivers, the Apple Creek, and the Castor River. The county is also home to several lakes, including the Clearwater Lake, the Lake Girardeau, and the Lake Wappapello.
Economy
Cape Girardeau County has a diverse economy, with a mix of manufacturing, agriculture, and services. The county is home to several large employers, including Procter & Gamble, 3M, and the Southeast Missouri State University.
Agriculture is an important part of the county’s economy, with corn, soybeans, and wheat being the main crops. Livestock production is also important, with cattle, hogs, and poultry being the main animals raised.
The county is also home to several manufacturing companies, including the Cape Girardeau Manufacturing Company, which produces automotive parts, and the Cape Girardeau Steel Company, which produces steel products.
Demographics
As of the 2010 census, Cape Girardeau County had a population of 75,674. The population was spread out, with 24.3% under the age of 18, 10.2% from 18 to 24, 28.2% from 25 to 44, 24.2% from 45 to 64, and 13.1% who were 65 years of age or older.
The median income for a household in the county was $41,945, and the median income for a family was $50,945. The per capita income for the county was $20,945. About 11.2% of families and 14.3% of the population were below the poverty line, including 19.2% of those under age 18 and 8.7% of those age 65 or over.
The racial makeup of the county was 87.2% White, 8.3% African American, 0.4% Native American, 1.2% Asian, 0.1% Pacific Islander, 0.7% from other races, and 2.1% from two or more races. Hispanic or Latino of any race were 2.3% of the population.
Common Questions
What is Per Capita Income in Cape Girardeau County?
Per Capita income in Cape Girardeau County is $32,619.
What is the Median Family Income in Cape Girardeau County?
Median Family Income in Cape Girardeau County is $82,968.
What is the Median Household income in Cape Girardeau County?
Median Household Income in Cape Girardeau County is $65,070.
What is Income or Wage Gap in Cape Girardeau County?
Income or Wage Gap in Cape Girardeau County is 33.5%.
Women in Cape Girardeau County earn 66.5 cents for every dollar earned by a man.
What is Family Income Deficit in Cape Girardeau County?
Family Income Deficit in Cape Girardeau County is $10,368.
Families that are below poverty line in Cape Girardeau County earn $10,368 less on average than the poverty threshold level.
What is Inequality or Gini Index in Cape Girardeau County?
Inequality or Gini Index in Cape Girardeau County is 0.45.
What is the Total Population of Cape Girardeau County?
Total Population of Cape Girardeau County is 81,703.
What is the Total Male Population of Cape Girardeau County?
Total Male Population of Cape Girardeau County is 39,940.
What is the Total Female Population of Cape Girardeau County?
Total Female Population of Cape Girardeau County is 41,763.
What is the Ratio of Males per 100 Females in Cape Girardeau County?
There are 95.63 Males per 100 Females in Cape Girardeau County.
What is the Ratio of Females per 100 Males in Cape Girardeau County?
There are 104.56 Females per 100 Males in Cape Girardeau County.
What is the Median Population Age in Cape Girardeau County?
Median Population Age in Cape Girardeau County is 36.9 Years.
What is the Average Family Size in Cape Girardeau County
Average Family Size in Cape Girardeau County is 3.0 People.
What is the Average Household Size in Cape Girardeau County
Average Household Size in Cape Girardeau County is 2.5 People.
How Large is the Labor Force in Cape Girardeau County?
There are 42,745 People in the Labor Forcein in Cape Girardeau County.
What is the Percentage of People in the Labor Force in Cape Girardeau County?
64.7% of People are in the Labor Force in Cape Girardeau County.
What is the Unemployment Rate in Cape Girardeau County?
Unemployment Rate in Cape Girardeau County is 3.2%.