Callaway County, MO Map & Demographics
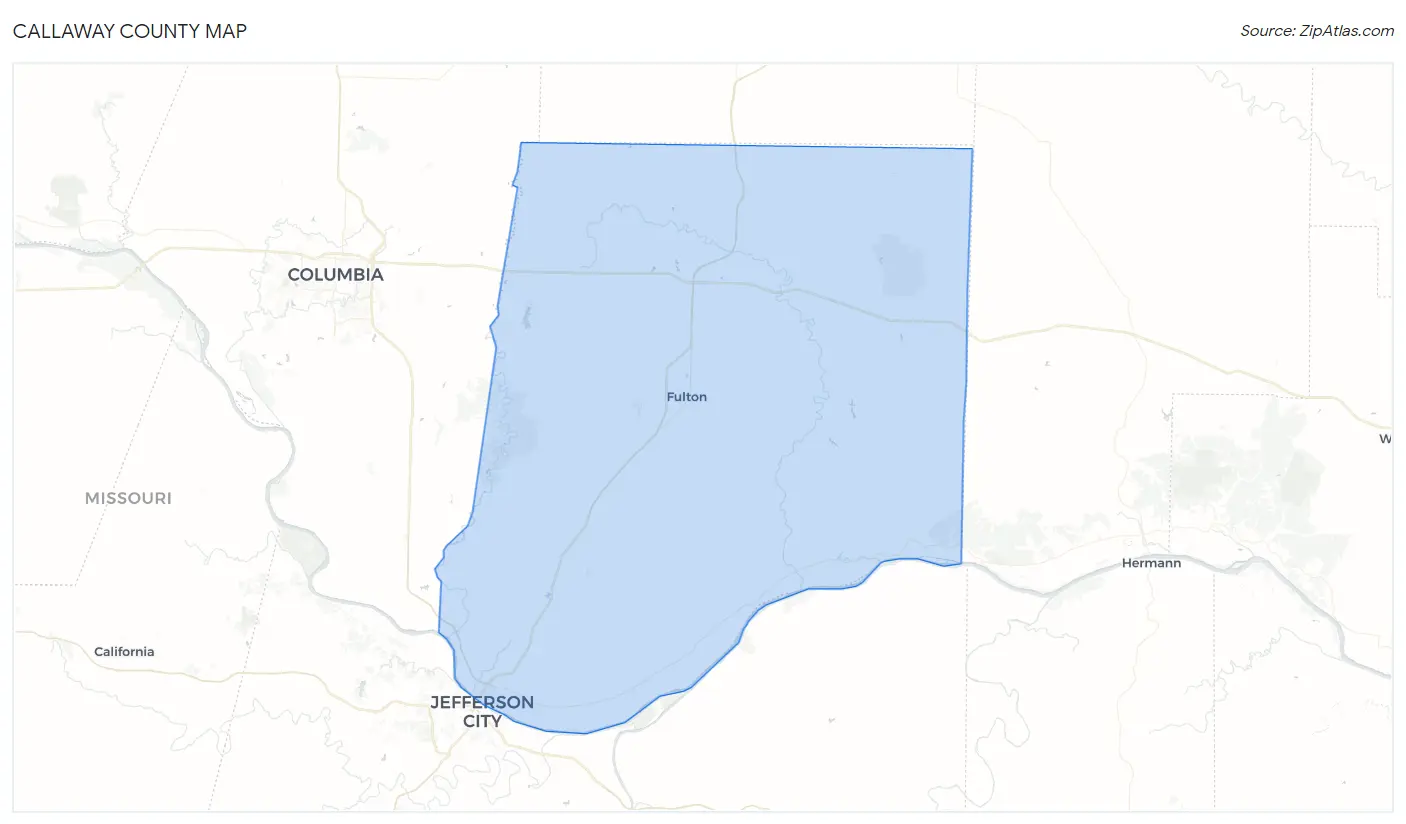
Callaway County Map
Callaway County Overview
$31,874
PER CAPITA INCOME
$83,245
AVG FAMILY INCOME
$70,599
AVG HOUSEHOLD INCOME
20.8%
WAGE / INCOME GAP [ % ]
79.2¢/ $1
WAGE / INCOME GAP [ $ ]
$8,616
FAMILY INCOME DEFICIT
0.40
INEQUALITY / GINI INDEX
44,517
TOTAL POPULATION
23,158
MALE POPULATION
21,359
FEMALE POPULATION
108.42
MALES / 100 FEMALES
92.23
FEMALES / 100 MALES
39.6
MEDIAN AGE
3.1
AVG FAMILY SIZE
2.5
AVG HOUSEHOLD SIZE
21,746
LABOR FORCE [ PEOPLE ]
59.7%
PERCENT IN LABOR FORCE
5.2%
UNEMPLOYMENT RATE
Callaway County Area Codes
Income in Callaway County
Income Overview in Callaway County
Per Capita Income in Callaway County is $31,874, while median incomes of families and households are $83,245 and $70,599 respectively.
| Characteristic | Number | Measure |
| Per Capita Income | 44,517 | $31,874 |
| Median Family Income | 11,005 | $83,245 |
| Mean Family Income | 11,005 | $96,728 |
| Median Household Income | 15,981 | $70,599 |
| Mean Household Income | 15,981 | $84,960 |
| Income Deficit | 11,005 | $8,616 |
| Wage / Income Gap (%) | 44,517 | 20.78% |
| Wage / Income Gap ($) | 44,517 | 79.22¢ per $1 |
| Gini / Inequality Index | 44,517 | 0.40 |
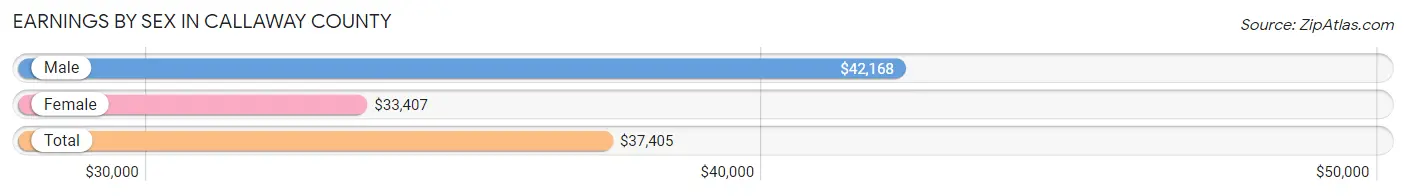
Earnings by Sex in Callaway County
Average Earnings in Callaway County are $37,405, $42,168 for men and $33,407 for women, a difference of 20.8%.
| Sex | Number | Average Earnings |
| Male | 12,991 (54.6%) | $42,168 |
| Female | 10,800 (45.4%) | $33,407 |
| Total | 23,791 (100.0%) | $37,405 |
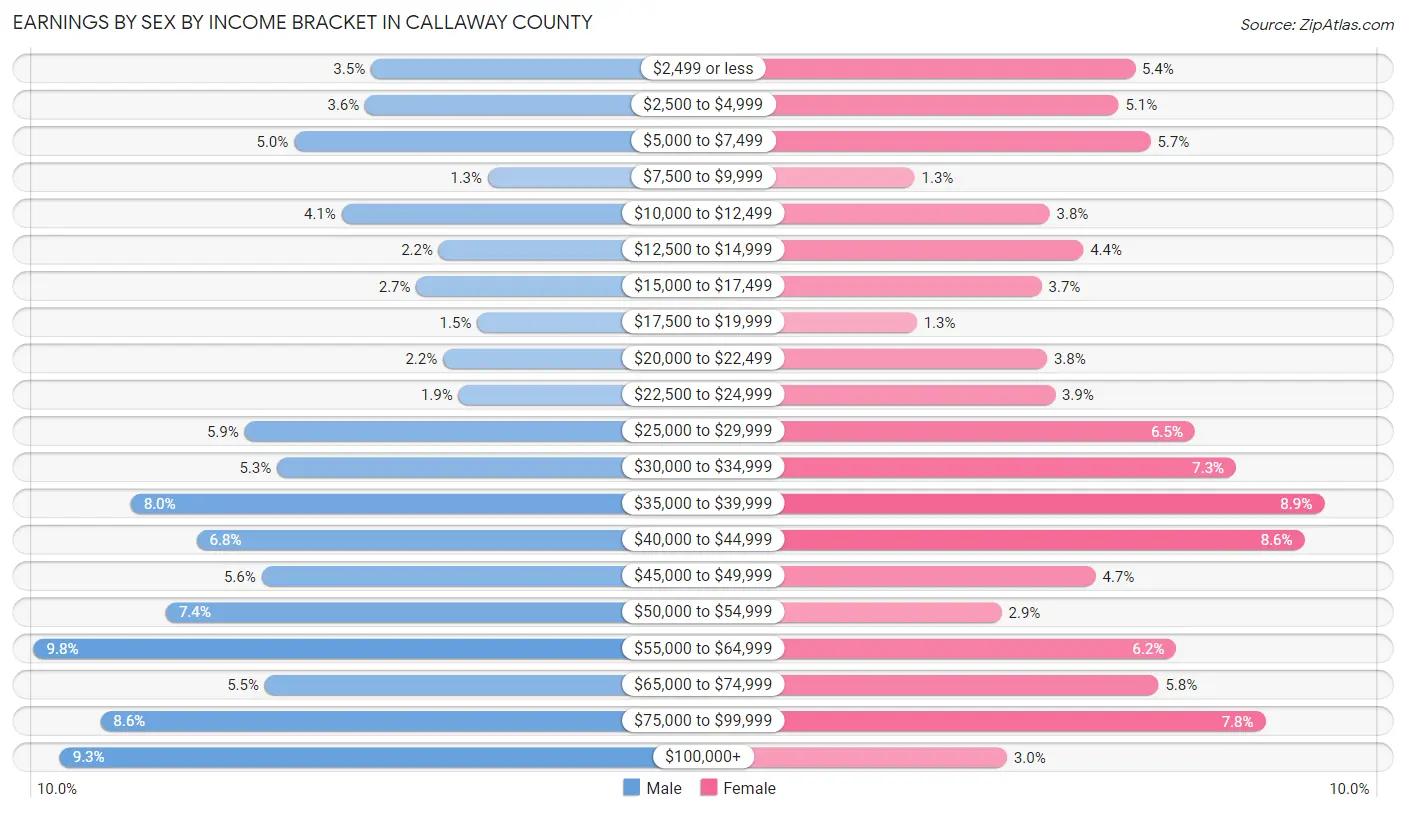
Earnings by Sex by Income Bracket in Callaway County
The most common earnings brackets in Callaway County are $55,000 to $64,999 for men (1,277 | 9.8%) and $35,000 to $39,999 for women (965 | 8.9%).
| Income | Male | Female |
| $2,499 or less | 456 (3.5%) | 583 (5.4%) |
| $2,500 to $4,999 | 470 (3.6%) | 550 (5.1%) |
| $5,000 to $7,499 | 643 (5.0%) | 614 (5.7%) |
| $7,500 to $9,999 | 172 (1.3%) | 137 (1.3%) |
| $10,000 to $12,499 | 527 (4.1%) | 410 (3.8%) |
| $12,500 to $14,999 | 291 (2.2%) | 478 (4.4%) |
| $15,000 to $17,499 | 345 (2.7%) | 394 (3.6%) |
| $17,500 to $19,999 | 198 (1.5%) | 142 (1.3%) |
| $20,000 to $22,499 | 281 (2.2%) | 405 (3.7%) |
| $22,500 to $24,999 | 243 (1.9%) | 421 (3.9%) |
| $25,000 to $29,999 | 764 (5.9%) | 704 (6.5%) |
| $30,000 to $34,999 | 684 (5.3%) | 787 (7.3%) |
| $35,000 to $39,999 | 1,040 (8.0%) | 965 (8.9%) |
| $40,000 to $44,999 | 881 (6.8%) | 926 (8.6%) |
| $45,000 to $49,999 | 722 (5.6%) | 503 (4.7%) |
| $50,000 to $54,999 | 955 (7.3%) | 313 (2.9%) |
| $55,000 to $64,999 | 1,277 (9.8%) | 666 (6.2%) |
| $65,000 to $74,999 | 714 (5.5%) | 631 (5.8%) |
| $75,000 to $99,999 | 1,114 (8.6%) | 847 (7.8%) |
| $100,000+ | 1,214 (9.3%) | 324 (3.0%) |
| Total | 12,991 (100.0%) | 10,800 (100.0%) |
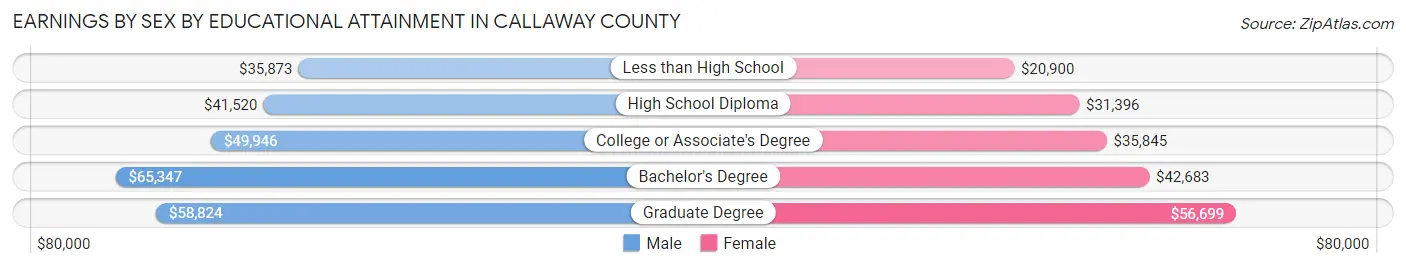
Earnings by Sex by Educational Attainment in Callaway County
Average earnings in Callaway County are $47,836 for men and $37,567 for women, a difference of 21.5%. Men with an educational attainment of bachelor's degree enjoy the highest average annual earnings of $65,347, while those with less than high school education earn the least with $35,873. Women with an educational attainment of graduate degree earn the most with the average annual earnings of $56,699, while those with less than high school education have the smallest earnings of $20,900.
| Educational Attainment | Male Income | Female Income |
| Less than High School | $35,873 | $20,900 |
| High School Diploma | $41,520 | $31,396 |
| College or Associate's Degree | $49,946 | $35,845 |
| Bachelor's Degree | $65,347 | $42,683 |
| Graduate Degree | $58,824 | $56,699 |
| Total | $47,836 | $37,567 |
Family Income in Callaway County
Family Income Brackets in Callaway County
According to the Callaway County family income data, there are 2,608 families falling into the $100,000 to $149,999 income range, which is the most common income bracket and makes up 23.7% of all families. Conversely, the $10,000 to $14,999 income bracket is the least frequent group with only 110 families (1.0%) belonging to this category.
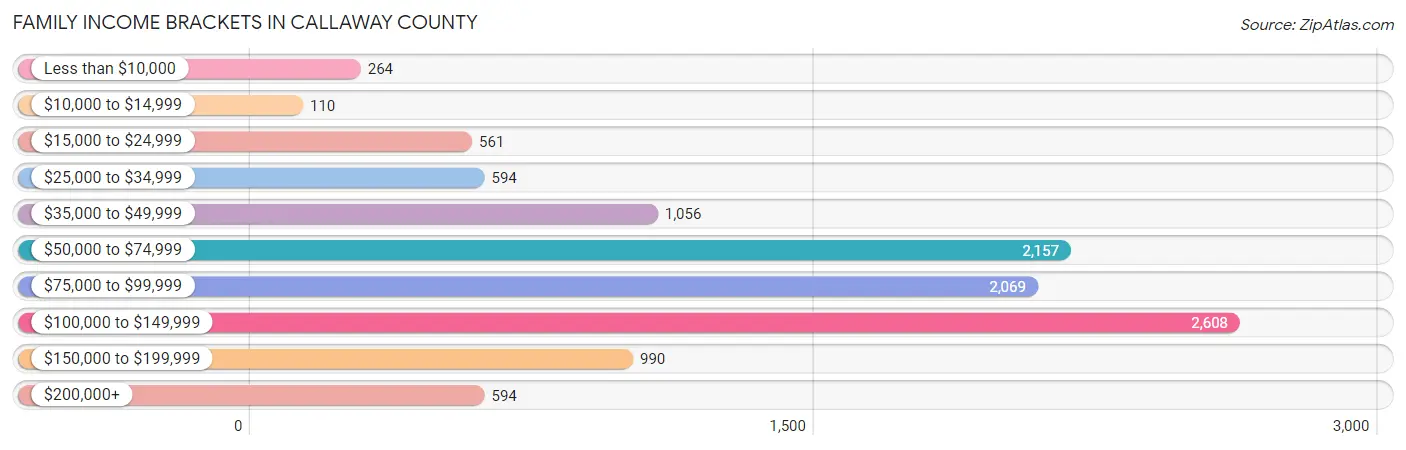
| Income Bracket | # Families | % Families |
| Less than $10,000 | 264 | 2.4% |
| $10,000 to $14,999 | 110 | 1.0% |
| $15,000 to $24,999 | 561 | 5.1% |
| $25,000 to $34,999 | 594 | 5.4% |
| $35,000 to $49,999 | 1,056 | 9.6% |
| $50,000 to $74,999 | 2,157 | 19.6% |
| $75,000 to $99,999 | 2,069 | 18.8% |
| $100,000 to $149,999 | 2,608 | 23.7% |
| $150,000 to $199,999 | 990 | 9.0% |
| $200,000+ | 594 | 5.4% |
Family Income by Famaliy Size in Callaway County
4-person families (1,961 | 17.8%) account for the highest median family income in Callaway County with $113,314 per family, while 2-person families (5,379 | 48.9%) have the highest median income of $36,570 per family member.
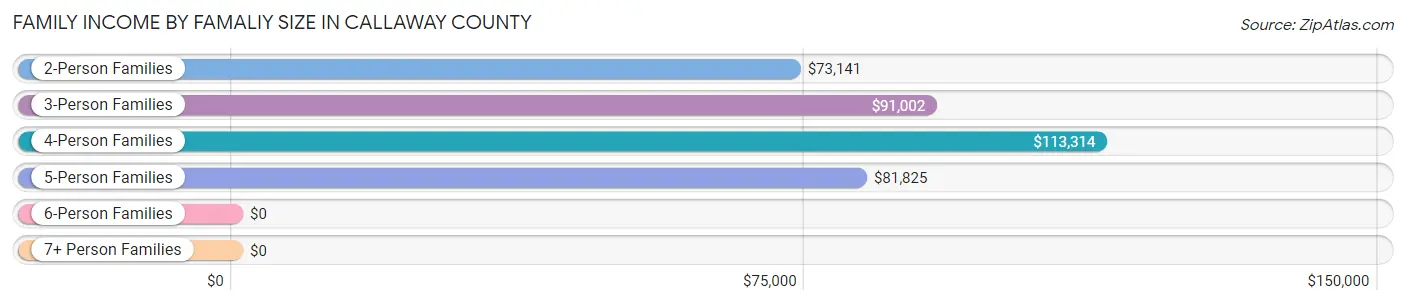
| Income Bracket | # Families | Median Income |
| 2-Person Families | 5,379 (48.9%) | $73,141 |
| 3-Person Families | 2,287 (20.8%) | $91,002 |
| 4-Person Families | 1,961 (17.8%) | $113,314 |
| 5-Person Families | 1,041 (9.5%) | $81,825 |
| 6-Person Families | 283 (2.6%) | $0 |
| 7+ Person Families | 54 (0.5%) | $0 |
| Total | 11,005 (100.0%) | $83,245 |
Family Income by Number of Earners in Callaway County
The median family income in Callaway County is $83,245, with families comprising 3+ earners (1,298) having the highest median family income of $129,423, while families with no earners (1,743) have the lowest median family income of $47,482, accounting for 11.8% and 15.8% of families, respectively.
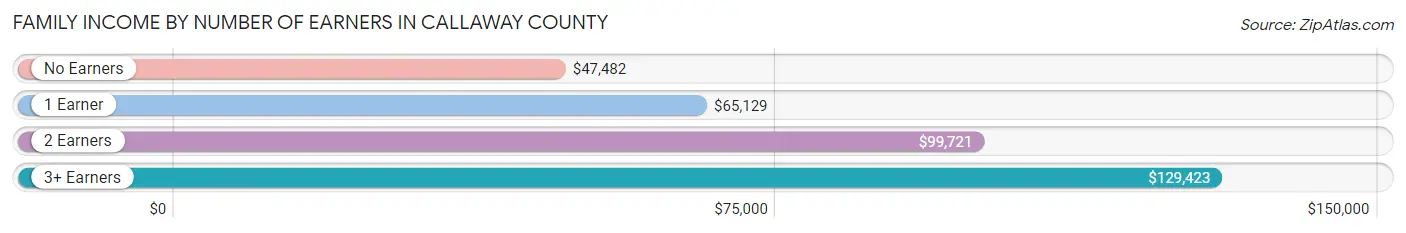
| Number of Earners | # Families | Median Income |
| No Earners | 1,743 (15.8%) | $47,482 |
| 1 Earner | 3,379 (30.7%) | $65,129 |
| 2 Earners | 4,585 (41.7%) | $99,721 |
| 3+ Earners | 1,298 (11.8%) | $129,423 |
| Total | 11,005 (100.0%) | $83,245 |
Household Income in Callaway County
Household Income Brackets in Callaway County
With 3,388 households falling in the category, the $50,000 to $74,999 income range is the most frequent in Callaway County, accounting for 21.2% of all households. In contrast, only 304 households (1.9%) fall into the $10,000 to $14,999 income bracket, making it the least populous group.
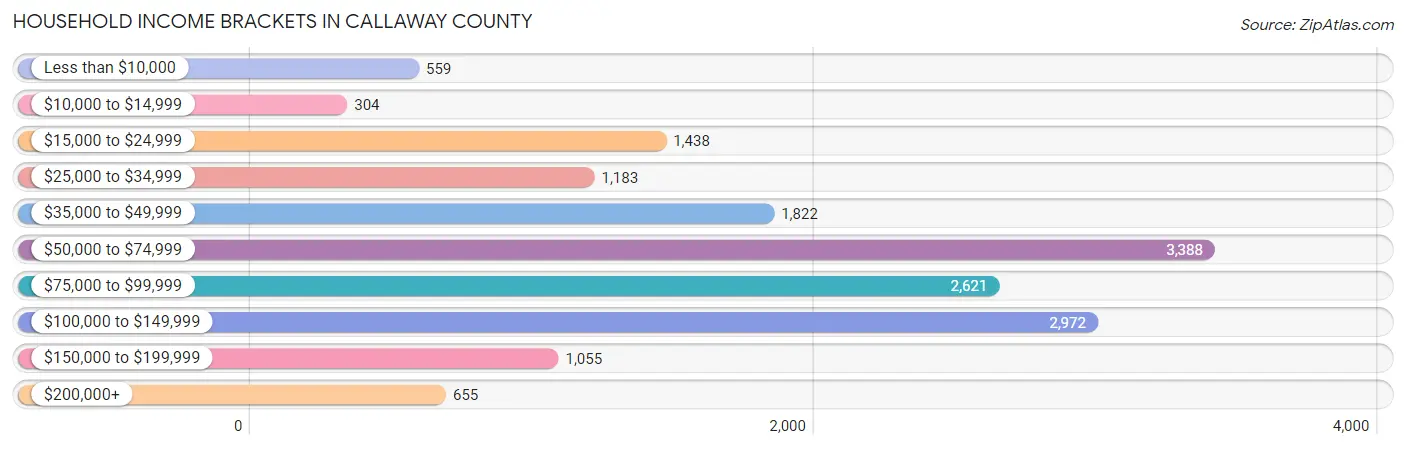
| Income Bracket | # Households | % Households |
| Less than $10,000 | 559 | 3.5% |
| $10,000 to $14,999 | 304 | 1.9% |
| $15,000 to $24,999 | 1,438 | 9.0% |
| $25,000 to $34,999 | 1,183 | 7.4% |
| $35,000 to $49,999 | 1,822 | 11.4% |
| $50,000 to $74,999 | 3,388 | 21.2% |
| $75,000 to $99,999 | 2,621 | 16.4% |
| $100,000 to $149,999 | 2,972 | 18.6% |
| $150,000 to $199,999 | 1,055 | 6.6% |
| $200,000+ | 655 | 4.1% |
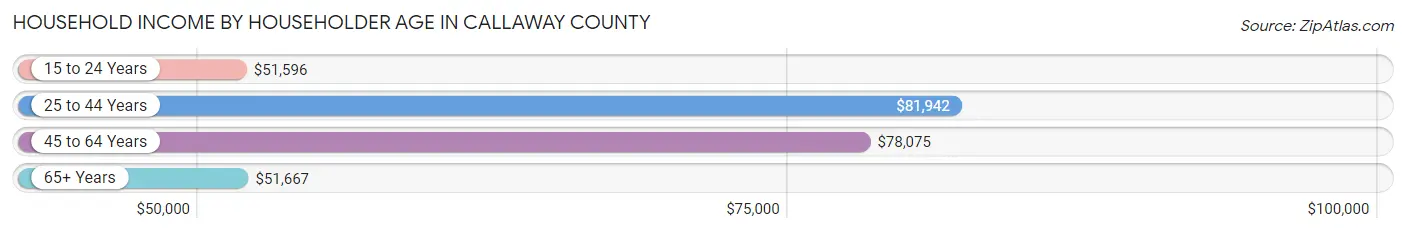
Household Income by Householder Age in Callaway County
The median household income in Callaway County is $70,599, with the highest median household income of $81,942 found in the 25 to 44 years age bracket for the primary householder. A total of 4,590 households (28.7%) fall into this category. Meanwhile, the 15 to 24 years age bracket for the primary householder has the lowest median household income of $51,596, with 498 households (3.1%) in this group.
| Income Bracket | # Households | Median Income |
| 15 to 24 Years | 498 (3.1%) | $51,596 |
| 25 to 44 Years | 4,590 (28.7%) | $81,942 |
| 45 to 64 Years | 6,635 (41.5%) | $78,075 |
| 65+ Years | 4,258 (26.6%) | $51,667 |
| Total | 15,981 (100.0%) | $70,599 |
Poverty in Callaway County
Income Below Poverty by Sex and Age in Callaway County
With 7.0% poverty level for males and 11.9% for females among the residents of Callaway County, 6 to 11 year old males and 6 to 11 year old females are the most vulnerable to poverty, with 350 males (21.0%) and 430 females (27.6%) in their respective age groups living below the poverty level.
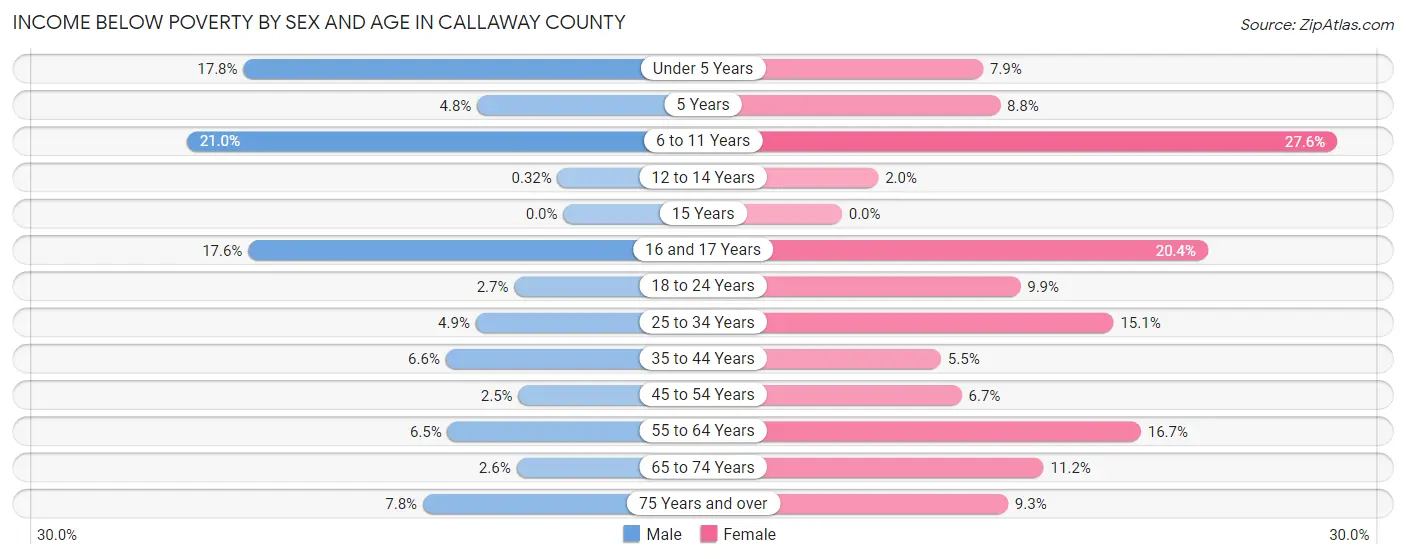
| Age Bracket | Male | Female |
| Under 5 Years | 235 (17.8%) | 85 (7.9%) |
| 5 Years | 13 (4.8%) | 17 (8.8%) |
| 6 to 11 Years | 350 (21.0%) | 430 (27.6%) |
| 12 to 14 Years | 2 (0.3%) | 14 (2.0%) |
| 15 Years | 0 (0.0%) | 0 (0.0%) |
| 16 and 17 Years | 83 (17.5%) | 128 (20.4%) |
| 18 to 24 Years | 41 (2.7%) | 142 (9.9%) |
| 25 to 34 Years | 125 (4.9%) | 405 (15.1%) |
| 35 to 44 Years | 169 (6.6%) | 143 (5.5%) |
| 45 to 54 Years | 65 (2.5%) | 176 (6.7%) |
| 55 to 64 Years | 192 (6.5%) | 495 (16.7%) |
| 65 to 74 Years | 58 (2.6%) | 252 (11.2%) |
| 75 Years and over | 93 (7.8%) | 141 (9.2%) |
| Total | 1,426 (7.0%) | 2,428 (11.9%) |
Income Above Poverty by Sex and Age in Callaway County
According to the poverty statistics in Callaway County, males aged 15 years and females aged 15 years are the age groups that are most secure financially, with 100.0% of males and 100.0% of females in these age groups living above the poverty line.
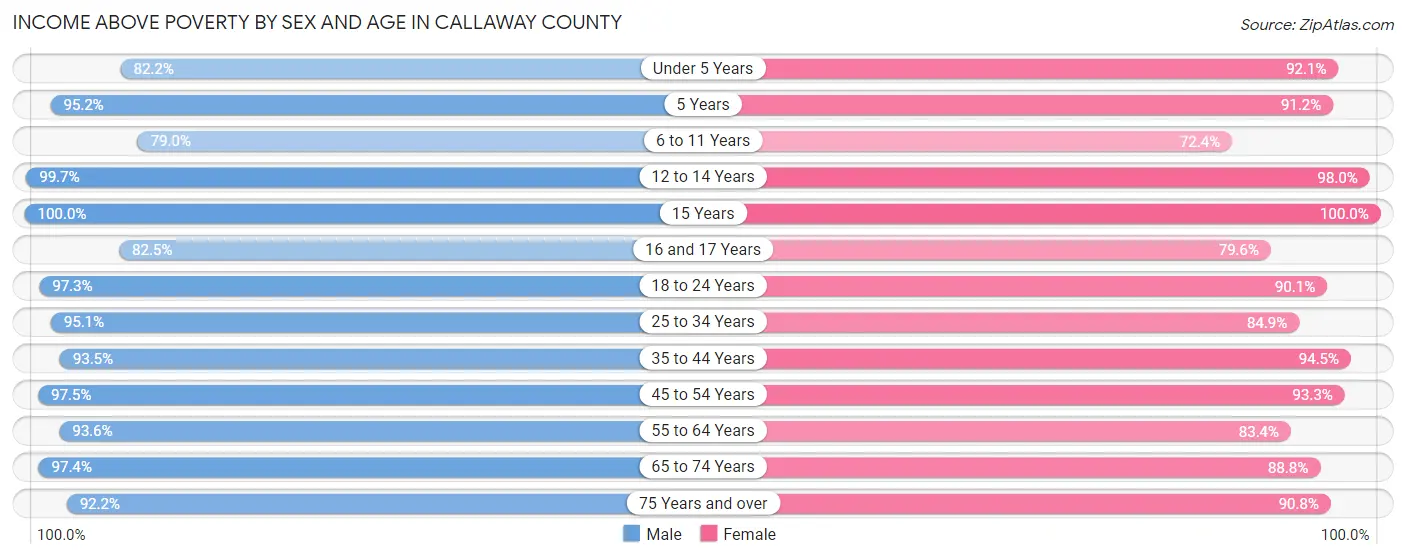
| Age Bracket | Male | Female |
| Under 5 Years | 1,084 (82.2%) | 997 (92.1%) |
| 5 Years | 258 (95.2%) | 176 (91.2%) |
| 6 to 11 Years | 1,319 (79.0%) | 1,129 (72.4%) |
| 12 to 14 Years | 624 (99.7%) | 676 (98.0%) |
| 15 Years | 289 (100.0%) | 179 (100.0%) |
| 16 and 17 Years | 390 (82.5%) | 500 (79.6%) |
| 18 to 24 Years | 1,462 (97.3%) | 1,287 (90.1%) |
| 25 to 34 Years | 2,435 (95.1%) | 2,271 (84.9%) |
| 35 to 44 Years | 2,410 (93.4%) | 2,449 (94.5%) |
| 45 to 54 Years | 2,530 (97.5%) | 2,463 (93.3%) |
| 55 to 64 Years | 2,784 (93.5%) | 2,478 (83.4%) |
| 65 to 74 Years | 2,164 (97.4%) | 1,989 (88.8%) |
| 75 Years and over | 1,096 (92.2%) | 1,384 (90.7%) |
| Total | 18,845 (93.0%) | 17,978 (88.1%) |
Income Below Poverty Among Married-Couple Families in Callaway County
The poverty statistics for married-couple families in Callaway County show that 2.9% or 240 of the total 8,359 families live below the poverty line. Families with no children have the highest poverty rate of 4.3%, comprising of 206 families. On the other hand, families with 5 or more children have the lowest poverty rate of 0.0%, which includes 0 families.
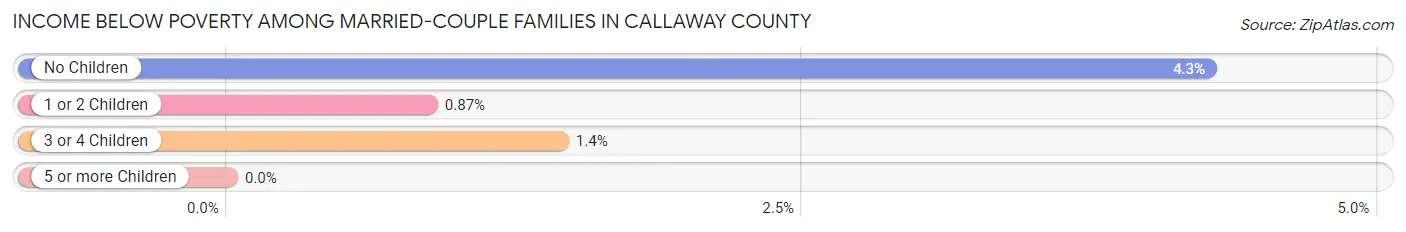
| Children | Above Poverty | Below Poverty |
| No Children | 4,625 (95.7%) | 206 (4.3%) |
| 1 or 2 Children | 2,839 (99.1%) | 25 (0.9%) |
| 3 or 4 Children | 617 (98.6%) | 9 (1.4%) |
| 5 or more Children | 38 (100.0%) | 0 (0.0%) |
| Total | 8,119 (97.1%) | 240 (2.9%) |
Income Below Poverty Among Single-Parent Households in Callaway County
According to the poverty data in Callaway County, 17.0% or 160 single-father households and 29.5% or 503 single-mother households are living below the poverty line. Among single-father households, those with 3 or 4 children have the highest poverty rate, with 120 households (93.8%) experiencing poverty. Likewise, among single-mother households, those with 3 or 4 children have the highest poverty rate, with 134 households (55.4%) falling below the poverty line.
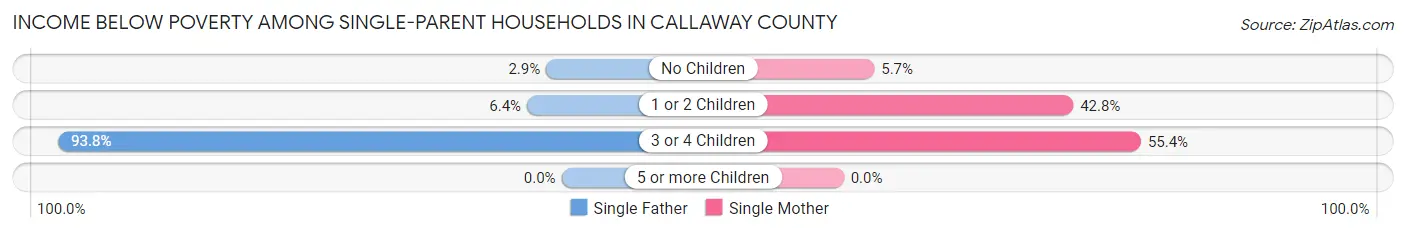
| Children | Single Father | Single Mother |
| No Children | 10 (2.9%) | 39 (5.7%) |
| 1 or 2 Children | 30 (6.4%) | 330 (42.7%) |
| 3 or 4 Children | 120 (93.8%) | 134 (55.4%) |
| 5 or more Children | 0 (0.0%) | 0 (0.0%) |
| Total | 160 (17.0%) | 503 (29.5%) |
Income Below Poverty Among Married-Couple vs Single-Parent Households in Callaway County
The poverty data for Callaway County shows that 240 of the married-couple family households (2.9%) and 663 of the single-parent households (25.1%) are living below the poverty level. Within the married-couple family households, those with no children have the highest poverty rate, with 206 households (4.3%) falling below the poverty line. Among the single-parent households, those with 3 or 4 children have the highest poverty rate, with 254 household (68.6%) living below poverty.
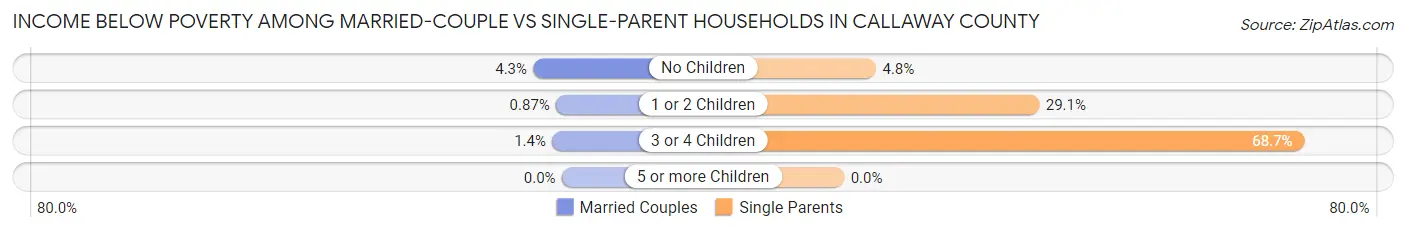
| Children | Married-Couple Families | Single-Parent Households |
| No Children | 206 (4.3%) | 49 (4.8%) |
| 1 or 2 Children | 25 (0.9%) | 360 (29.1%) |
| 3 or 4 Children | 9 (1.4%) | 254 (68.6%) |
| 5 or more Children | 0 (0.0%) | 0 (0.0%) |
| Total | 240 (2.9%) | 663 (25.1%) |
Race in Callaway County
The most populous races in Callaway County are White / Caucasian (40,216 | 90.3%), Black / African American (1,898 | 4.3%), and Two or more Races (1,861 | 4.2%).
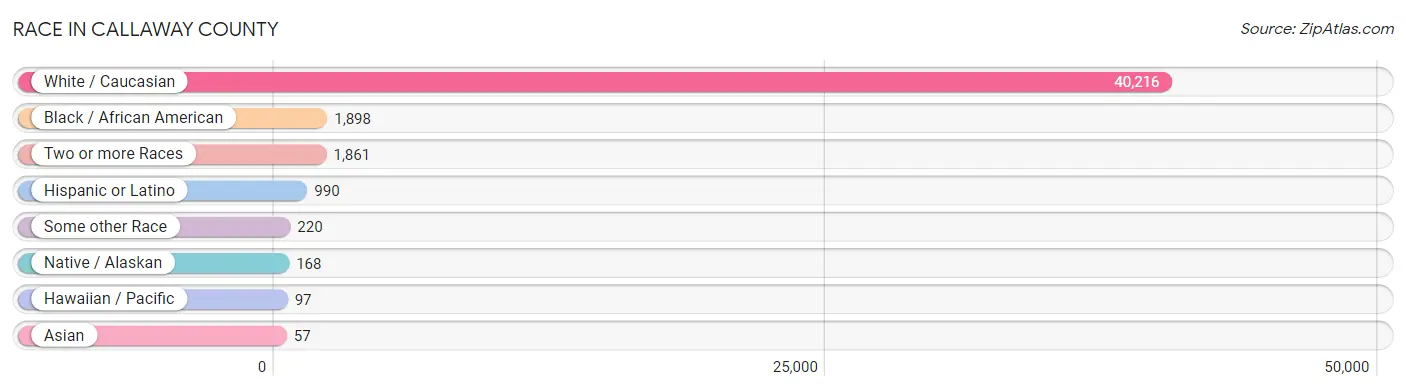
| Race | # Population | % Population |
| Asian | 57 | 0.1% |
| Black / African American | 1,898 | 4.3% |
| Hawaiian / Pacific | 97 | 0.2% |
| Hispanic or Latino | 990 | 2.2% |
| Native / Alaskan | 168 | 0.4% |
| White / Caucasian | 40,216 | 90.3% |
| Two or more Races | 1,861 | 4.2% |
| Some other Race | 220 | 0.5% |
| Total | 44,517 | 100.0% |
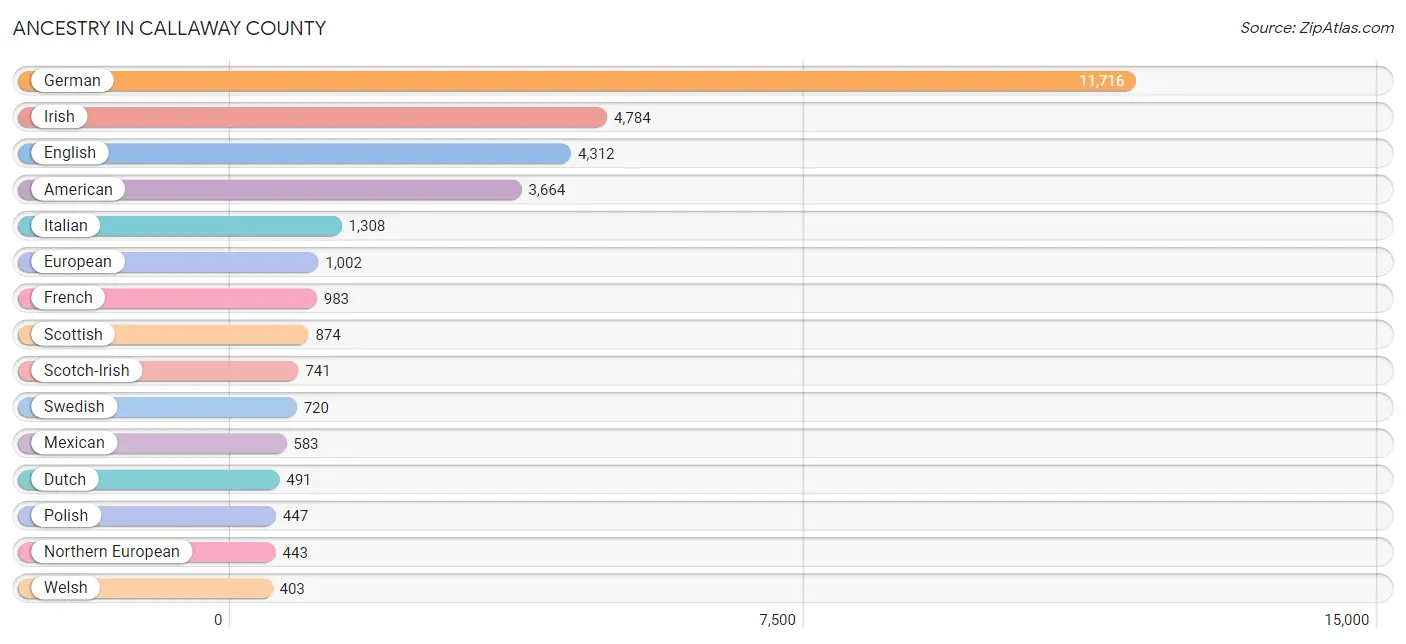
Ancestry in Callaway County
The most populous ancestries reported in Callaway County are German (11,716 | 26.3%), Irish (4,784 | 10.7%), English (4,312 | 9.7%), American (3,664 | 8.2%), and Italian (1,308 | 2.9%), together accounting for 57.9% of all Callaway County residents.
| Ancestry | # Population | % Population |
| African | 89 | 0.2% |
| American | 3,664 | 8.2% |
| Arab | 12 | 0.0% |
| Armenian | 20 | 0.0% |
| Austrian | 30 | 0.1% |
| Belgian | 14 | 0.0% |
| Bhutanese | 13 | 0.0% |
| Blackfeet | 69 | 0.2% |
| British | 205 | 0.5% |
| Bulgarian | 32 | 0.1% |
| Burmese | 38 | 0.1% |
| Canadian | 23 | 0.1% |
| Central American | 173 | 0.4% |
| Cherokee | 334 | 0.7% |
| Chickasaw | 5 | 0.0% |
| Choctaw | 102 | 0.2% |
| Costa Rican | 8 | 0.0% |
| Creek | 31 | 0.1% |
| Croatian | 58 | 0.1% |
| Cuban | 24 | 0.1% |
| Czech | 297 | 0.7% |
| Czechoslovakian | 10 | 0.0% |
| Danish | 172 | 0.4% |
| Dominican | 21 | 0.1% |
| Dutch | 491 | 1.1% |
| Eastern European | 11 | 0.0% |
| English | 4,312 | 9.7% |
| European | 1,002 | 2.2% |
| Finnish | 248 | 0.6% |
| French | 983 | 2.2% |
| French Canadian | 56 | 0.1% |
| German | 11,716 | 26.3% |
| Ghanaian | 8 | 0.0% |
| Hungarian | 19 | 0.0% |
| Indian (Asian) | 34 | 0.1% |
| Irish | 4,784 | 10.7% |
| Italian | 1,308 | 2.9% |
| Jamaican | 13 | 0.0% |
| Korean | 66 | 0.2% |
| Latvian | 27 | 0.1% |
| Lithuanian | 53 | 0.1% |
| Luxembourger | 3 | 0.0% |
| Mexican | 583 | 1.3% |
| Native Hawaiian | 97 | 0.2% |
| Nicaraguan | 156 | 0.4% |
| Northern European | 443 | 1.0% |
| Norwegian | 381 | 0.9% |
| Pakistani | 2 | 0.0% |
| Paraguayan | 5 | 0.0% |
| Polish | 447 | 1.0% |
| Puerto Rican | 45 | 0.1% |
| Russian | 55 | 0.1% |
| Salvadoran | 9 | 0.0% |
| Scandinavian | 39 | 0.1% |
| Scotch-Irish | 741 | 1.7% |
| Scottish | 874 | 2.0% |
| Somali | 5 | 0.0% |
| South American | 5 | 0.0% |
| South American Indian | 34 | 0.1% |
| Spanish | 37 | 0.1% |
| Subsaharan African | 102 | 0.2% |
| Swedish | 720 | 1.6% |
| Swiss | 86 | 0.2% |
| Thai | 2 | 0.0% |
| Ukrainian | 23 | 0.1% |
| Welsh | 403 | 0.9% | View All 66 Rows |
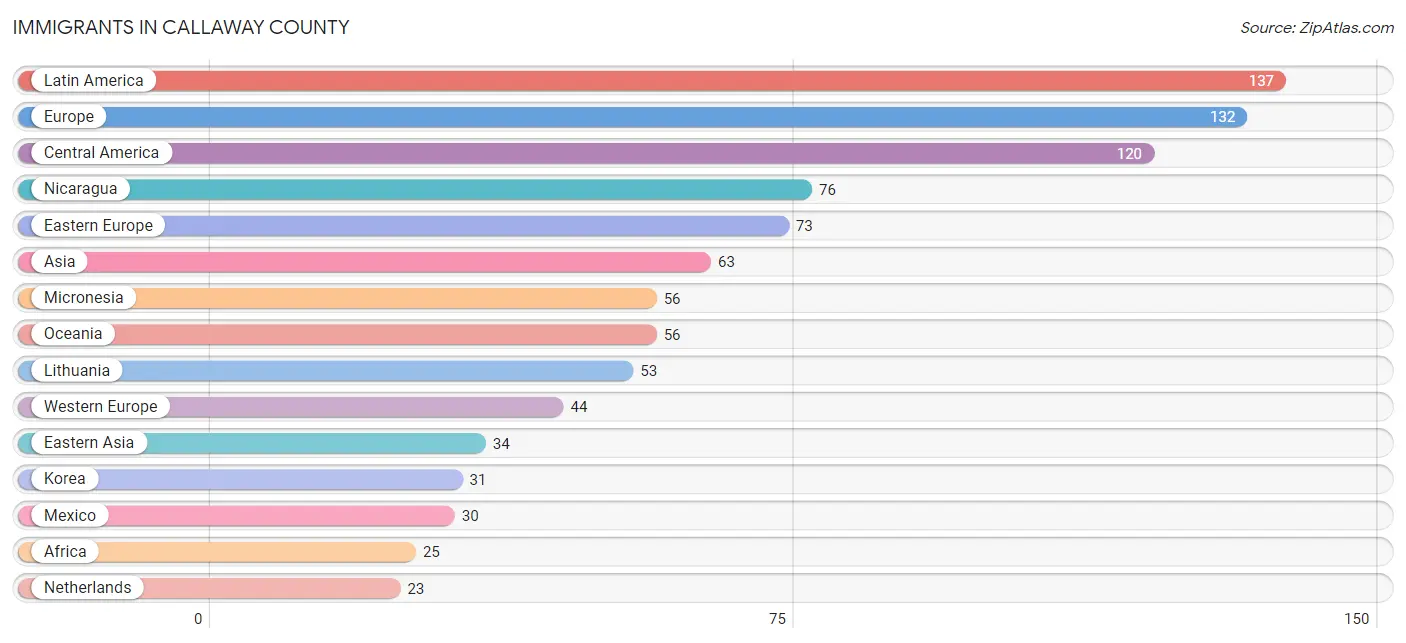
Immigrants in Callaway County
The most numerous immigrant groups reported in Callaway County came from Latin America (137 | 0.3%), Europe (132 | 0.3%), Central America (120 | 0.3%), Nicaragua (76 | 0.2%), and Eastern Europe (73 | 0.2%), together accounting for 1.2% of all Callaway County residents.
| Immigration Origin | # Population | % Population |
| Africa | 25 | 0.1% |
| Asia | 63 | 0.1% |
| Brazil | 16 | 0.0% |
| Caribbean | 1 | 0.0% |
| Central America | 120 | 0.3% |
| China | 3 | 0.0% |
| Costa Rica | 8 | 0.0% |
| Eastern Africa | 5 | 0.0% |
| Eastern Asia | 34 | 0.1% |
| Eastern Europe | 73 | 0.2% |
| El Salvador | 6 | 0.0% |
| England | 3 | 0.0% |
| Europe | 132 | 0.3% |
| Germany | 21 | 0.1% |
| Ghana | 8 | 0.0% |
| India | 11 | 0.0% |
| Indonesia | 6 | 0.0% |
| Korea | 31 | 0.1% |
| Latin America | 137 | 0.3% |
| Lithuania | 53 | 0.1% |
| Mexico | 30 | 0.1% |
| Micronesia | 56 | 0.1% |
| Netherlands | 23 | 0.1% |
| Nicaragua | 76 | 0.2% |
| Northern Africa | 12 | 0.0% |
| Northern Europe | 15 | 0.0% |
| Oceania | 56 | 0.1% |
| Philippines | 10 | 0.0% |
| Somalia | 5 | 0.0% |
| South America | 16 | 0.0% |
| South Central Asia | 11 | 0.0% |
| South Eastern Asia | 18 | 0.0% |
| Thailand | 2 | 0.0% |
| Ukraine | 20 | 0.0% |
| Western Africa | 8 | 0.0% |
| Western Europe | 44 | 0.1% | View All 36 Rows |
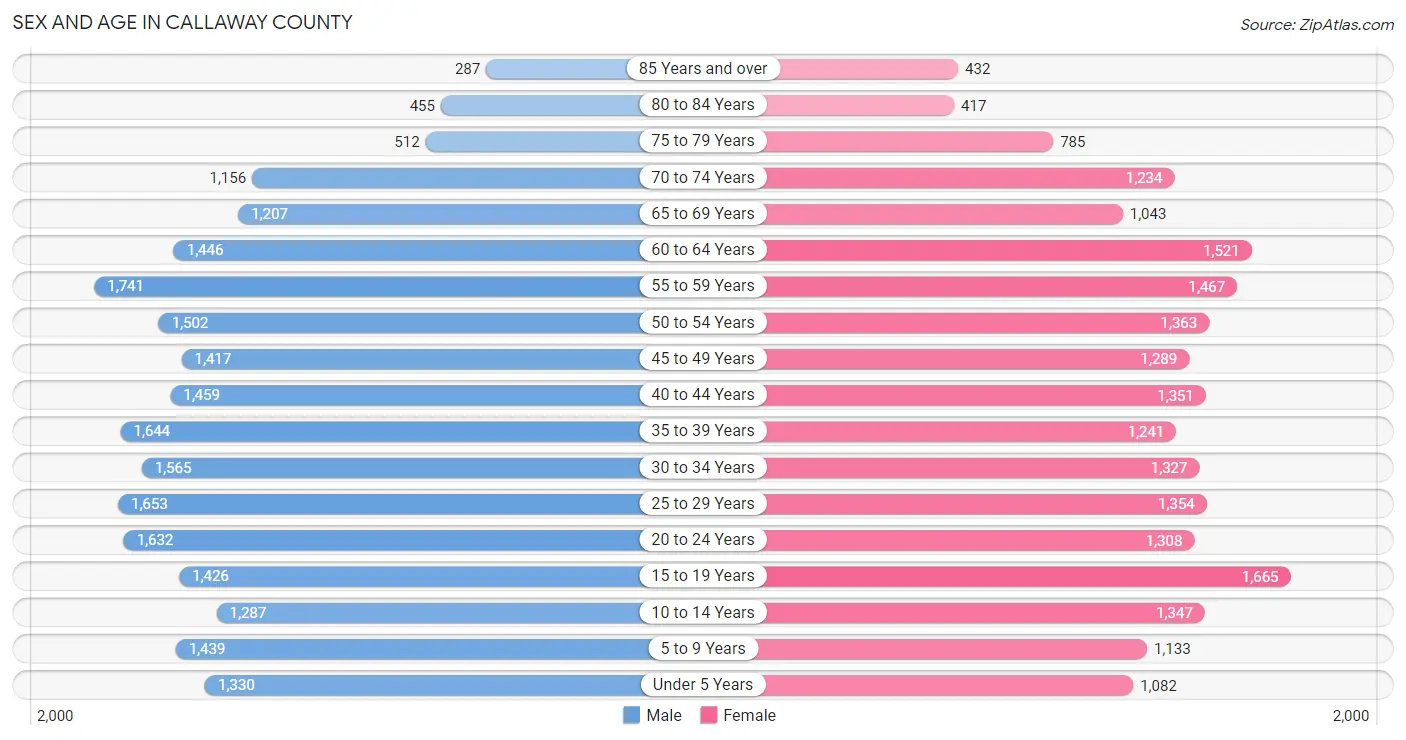
Sex and Age in Callaway County
Sex and Age in Callaway County
The most populous age groups in Callaway County are 55 to 59 Years (1,741 | 7.5%) for men and 15 to 19 Years (1,665 | 7.8%) for women.
| Age Bracket | Male | Female |
| Under 5 Years | 1,330 (5.7%) | 1,082 (5.1%) |
| 5 to 9 Years | 1,439 (6.2%) | 1,133 (5.3%) |
| 10 to 14 Years | 1,287 (5.6%) | 1,347 (6.3%) |
| 15 to 19 Years | 1,426 (6.2%) | 1,665 (7.8%) |
| 20 to 24 Years | 1,632 (7.0%) | 1,308 (6.1%) |
| 25 to 29 Years | 1,653 (7.1%) | 1,354 (6.3%) |
| 30 to 34 Years | 1,565 (6.8%) | 1,327 (6.2%) |
| 35 to 39 Years | 1,644 (7.1%) | 1,241 (5.8%) |
| 40 to 44 Years | 1,459 (6.3%) | 1,351 (6.3%) |
| 45 to 49 Years | 1,417 (6.1%) | 1,289 (6.0%) |
| 50 to 54 Years | 1,502 (6.5%) | 1,363 (6.4%) |
| 55 to 59 Years | 1,741 (7.5%) | 1,467 (6.9%) |
| 60 to 64 Years | 1,446 (6.2%) | 1,521 (7.1%) |
| 65 to 69 Years | 1,207 (5.2%) | 1,043 (4.9%) |
| 70 to 74 Years | 1,156 (5.0%) | 1,234 (5.8%) |
| 75 to 79 Years | 512 (2.2%) | 785 (3.7%) |
| 80 to 84 Years | 455 (2.0%) | 417 (1.9%) |
| 85 Years and over | 287 (1.2%) | 432 (2.0%) |
| Total | 23,158 (100.0%) | 21,359 (100.0%) |
Families and Households in Callaway County
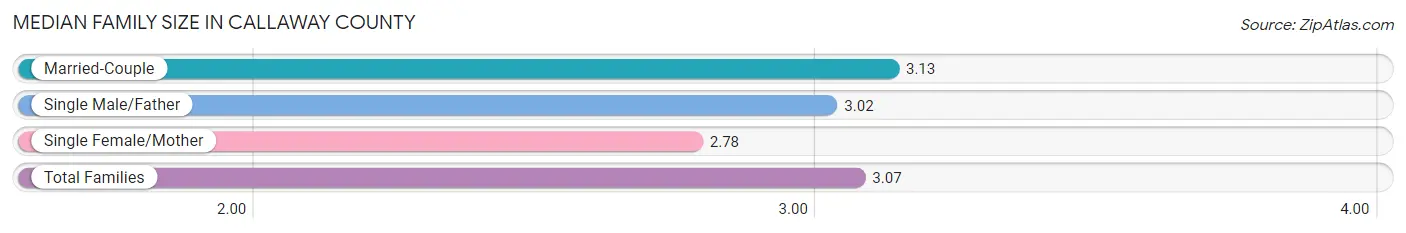
Median Family Size in Callaway County
The median family size in Callaway County is 3.07 persons per family, with married-couple families (8,359 | 76.0%) accounting for the largest median family size of 3.13 persons per family. On the other hand, single female/mother families (1,704 | 15.5%) represent the smallest median family size with 2.78 persons per family.
| Family Type | # Families | Family Size |
| Married-Couple | 8,359 (76.0%) | 3.13 |
| Single Male/Father | 942 (8.6%) | 3.02 |
| Single Female/Mother | 1,704 (15.5%) | 2.78 |
| Total Families | 11,005 (100.0%) | 3.07 |
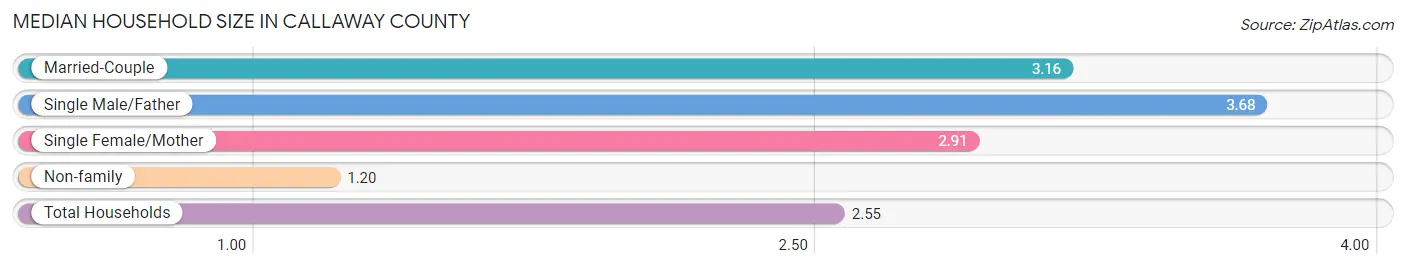
Median Household Size in Callaway County
The median household size in Callaway County is 2.55 persons per household, with single male/father households (942 | 5.9%) accounting for the largest median household size of 3.68 persons per household. non-family households (4,976 | 31.1%) represent the smallest median household size with 1.20 persons per household.
| Household Type | # Households | Household Size |
| Married-Couple | 8,359 (52.3%) | 3.16 |
| Single Male/Father | 942 (5.9%) | 3.68 |
| Single Female/Mother | 1,704 (10.7%) | 2.91 |
| Non-family | 4,976 (31.1%) | 1.20 |
| Total Households | 15,981 (100.0%) | 2.55 |
Household Size by Marriage Status in Callaway County
Out of a total of 15,981 households in Callaway County, 11,005 (68.9%) are family households, while 4,976 (31.1%) are nonfamily households. The most numerous type of family households are 2-person households, comprising 5,115, and the most common type of nonfamily households are 1-person households, comprising 3,995.
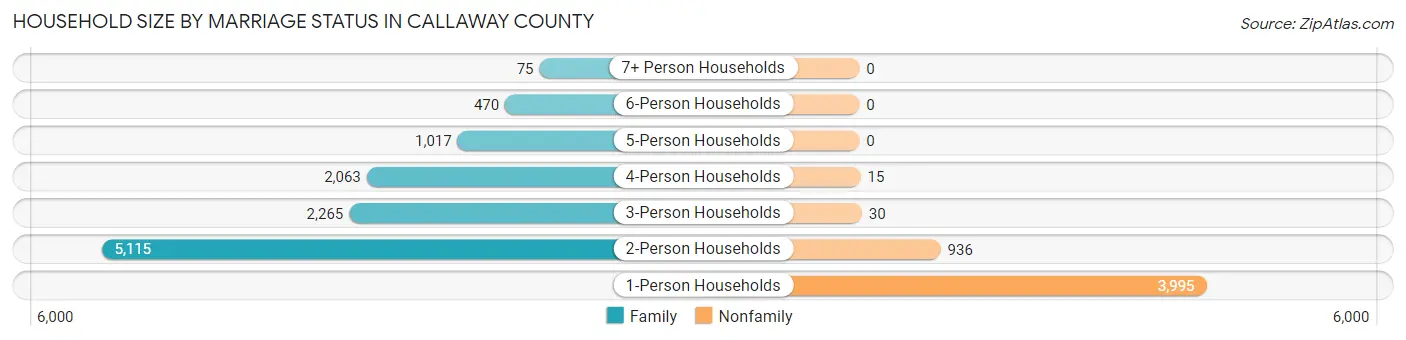
| Household Size | Family Households | Nonfamily Households |
| 1-Person Households | - | 3,995 (25.0%) |
| 2-Person Households | 5,115 (32.0%) | 936 (5.9%) |
| 3-Person Households | 2,265 (14.2%) | 30 (0.2%) |
| 4-Person Households | 2,063 (12.9%) | 15 (0.1%) |
| 5-Person Households | 1,017 (6.4%) | 0 (0.0%) |
| 6-Person Households | 470 (2.9%) | 0 (0.0%) |
| 7+ Person Households | 75 (0.5%) | 0 (0.0%) |
| Total | 11,005 (68.9%) | 4,976 (31.1%) |
Female Fertility in Callaway County
Fertility by Age in Callaway County
Average fertility rate in Callaway County is 60.0 births per 1,000 women. Women in the age bracket of 20 to 34 years have the highest fertility rate with 78.0 births per 1,000 women. Women in the age bracket of 20 to 34 years acount for 53.5% of all women with births.
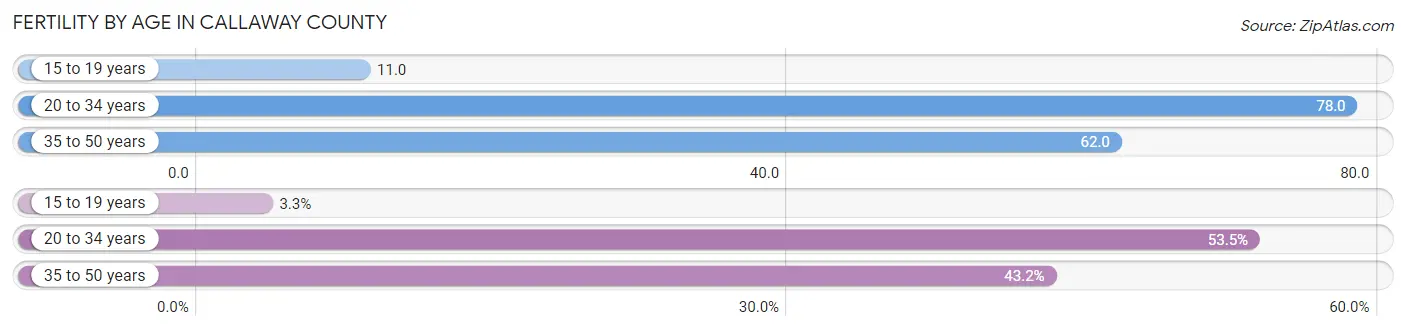
| Age Bracket | Women with Births | Births / 1,000 Women |
| 15 to 19 years | 19 (3.3%) | 11.0 |
| 20 to 34 years | 310 (53.5%) | 78.0 |
| 35 to 50 years | 250 (43.2%) | 62.0 |
| Total | 579 (100.0%) | 60.0 |
Fertility by Age by Marriage Status in Callaway County
87.0% of women with births (579) in Callaway County are married. The highest percentage of unmarried women with births falls into 15 to 19 years age bracket with 100.0% of them unmarried at the time of birth, while the lowest percentage of unmarried women with births belong to 35 to 50 years age bracket with 0.0% of them unmarried.
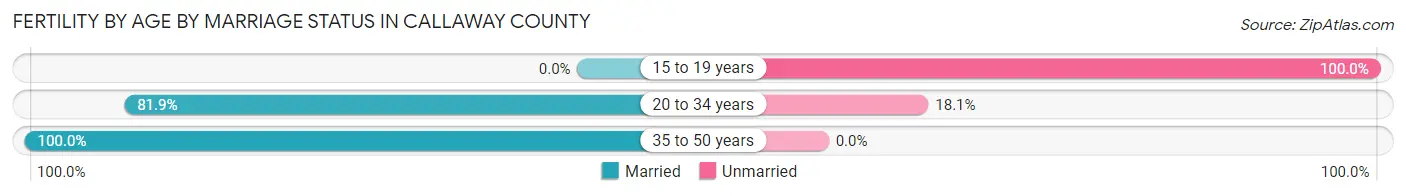
| Age Bracket | Married | Unmarried |
| 15 to 19 years | 0 (0.0%) | 19 (100.0%) |
| 20 to 34 years | 254 (81.9%) | 56 (18.1%) |
| 35 to 50 years | 250 (100.0%) | 0 (0.0%) |
| Total | 504 (87.1%) | 75 (13.0%) |
Fertility by Education in Callaway County
Average fertility rate in Callaway County is 60.0 births per 1,000 women. Women with the education attainment of graduate degree have the highest fertility rate of 145.0 births per 1,000 women, while women with the education attainment of high school diploma have the lowest fertility at 34.0 births per 1,000 women. Women with the education attainment of college or associate's degree represent 28.3% of all women with births.
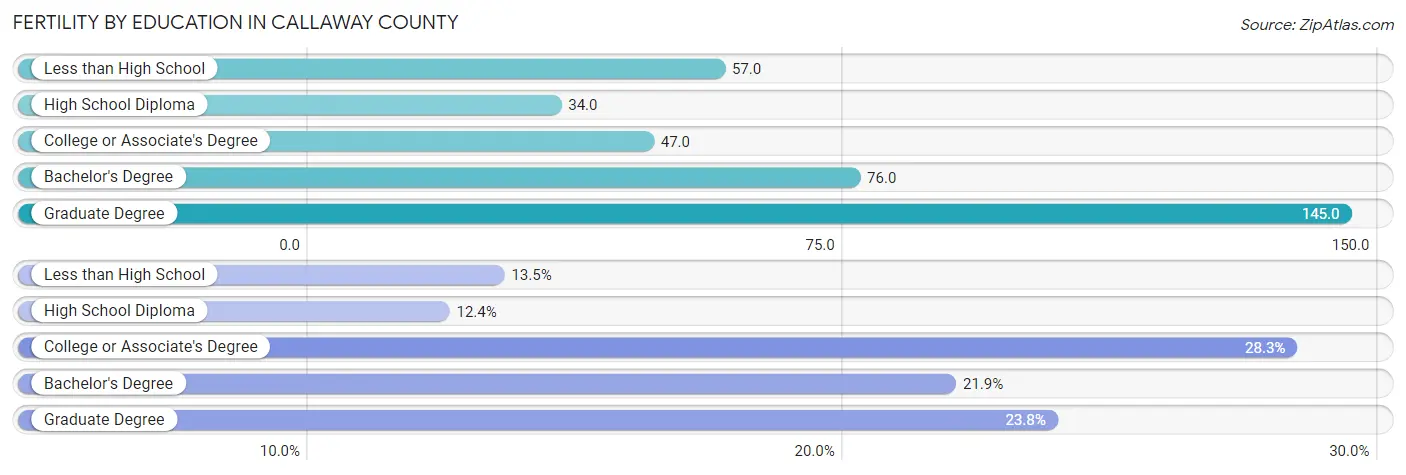
| Educational Attainment | Women with Births | Births / 1,000 Women |
| Less than High School | 78 (13.5%) | 57.0 |
| High School Diploma | 72 (12.4%) | 34.0 |
| College or Associate's Degree | 164 (28.3%) | 47.0 |
| Bachelor's Degree | 127 (21.9%) | 76.0 |
| Graduate Degree | 138 (23.8%) | 145.0 |
| Total | 579 (100.0%) | 60.0 |
Fertility by Education by Marriage Status in Callaway County
13.0% of women with births in Callaway County are unmarried. Women with the educational attainment of bachelor's degree are most likely to be married with 100.0% of them married at childbirth, while women with the educational attainment of high school diploma are least likely to be married with 68.1% of them unmarried at childbirth.
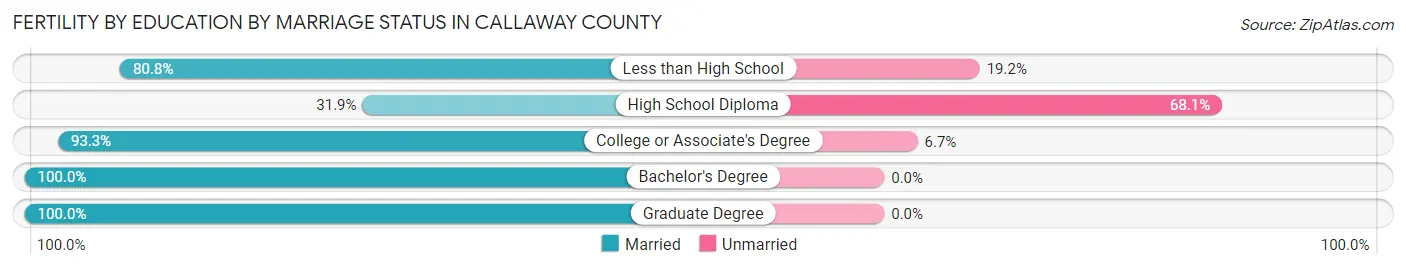
| Educational Attainment | Married | Unmarried |
| Less than High School | 63 (80.8%) | 15 (19.2%) |
| High School Diploma | 23 (31.9%) | 49 (68.1%) |
| College or Associate's Degree | 153 (93.3%) | 11 (6.7%) |
| Bachelor's Degree | 127 (100.0%) | 0 (0.0%) |
| Graduate Degree | 138 (100.0%) | 0 (0.0%) |
| Total | 504 (87.1%) | 75 (13.0%) |
Employment Characteristics in Callaway County
Employment by Class of Employer in Callaway County
Among the 20,411 employed individuals in Callaway County, private company employees (12,310 | 60.3%), state government employees (2,233 | 10.9%), and not-for-profit organizations (2,059 | 10.1%) make up the most common classes of employment.
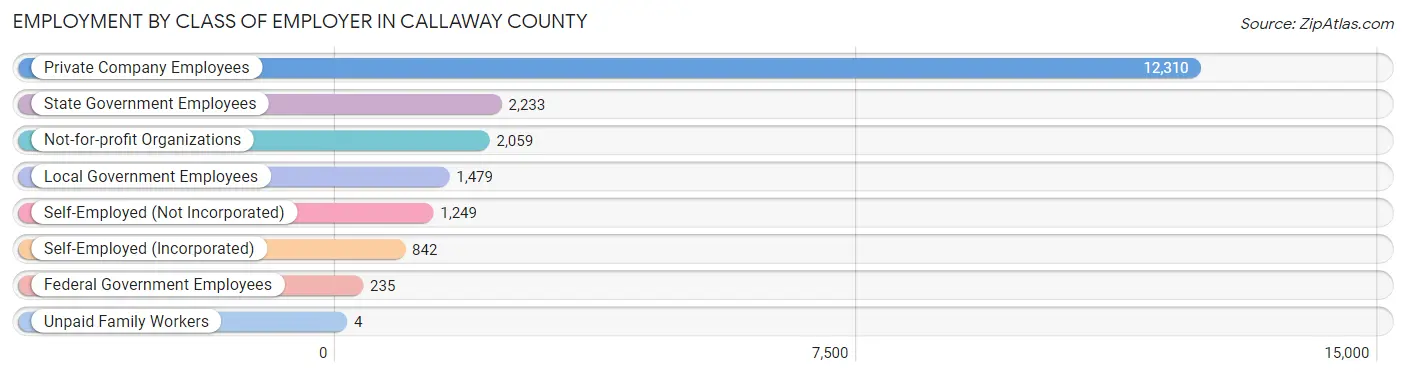
| Employer Class | # Employees | % Employees |
| Private Company Employees | 12,310 | 60.3% |
| Self-Employed (Incorporated) | 842 | 4.1% |
| Self-Employed (Not Incorporated) | 1,249 | 6.1% |
| Not-for-profit Organizations | 2,059 | 10.1% |
| Local Government Employees | 1,479 | 7.2% |
| State Government Employees | 2,233 | 10.9% |
| Federal Government Employees | 235 | 1.1% |
| Unpaid Family Workers | 4 | 0.0% |
| Total | 20,411 | 100.0% |
Employment Status by Age in Callaway County
According to the labor force statistics for Callaway County, out of the total population over 16 years of age (36,425), 59.7% or 21,746 individuals are in the labor force, with 5.2% or 1,131 of them unemployed. The age group with the highest labor force participation rate is 45 to 54 years, with 81.7% or 4,552 individuals in the labor force. Within the labor force, the 16 to 19 years age range has the highest percentage of unemployed individuals, with 15.7% or 229 of them being unemployed.
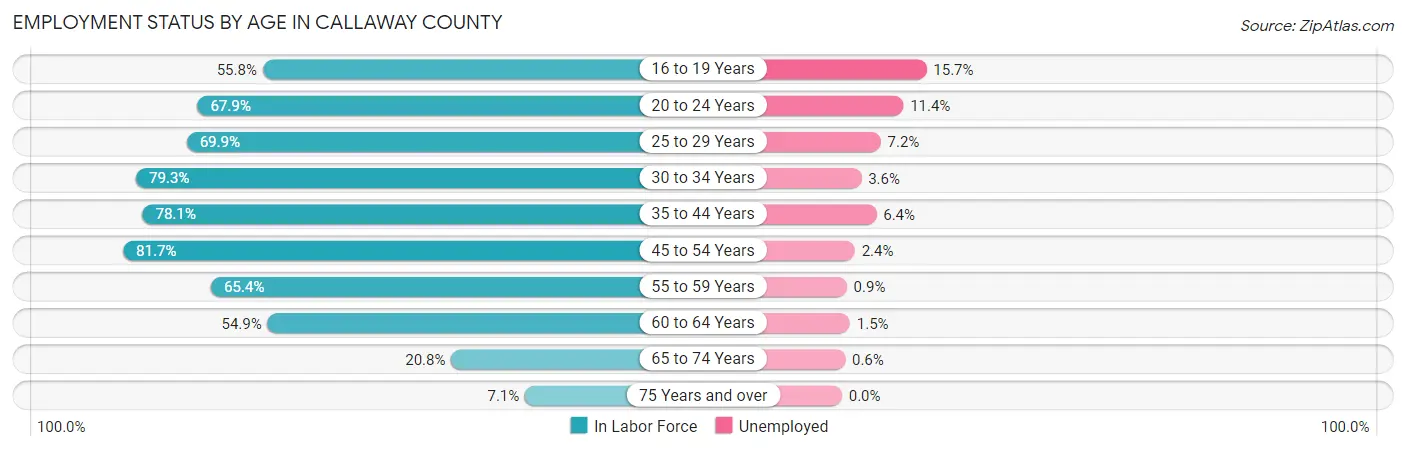
| Age Bracket | In Labor Force | Unemployed |
| 16 to 19 Years | 1,460 (55.8%) | 229 (15.7%) |
| 20 to 24 Years | 1,996 (67.9%) | 228 (11.4%) |
| 25 to 29 Years | 2,102 (69.9%) | 151 (7.2%) |
| 30 to 34 Years | 2,293 (79.3%) | 83 (3.6%) |
| 35 to 44 Years | 4,448 (78.1%) | 285 (6.4%) |
| 45 to 54 Years | 4,552 (81.7%) | 109 (2.4%) |
| 55 to 59 Years | 2,098 (65.4%) | 19 (0.9%) |
| 60 to 64 Years | 1,629 (54.9%) | 24 (1.5%) |
| 65 to 74 Years | 965 (20.8%) | 6 (0.6%) |
| 75 Years and over | 205 (7.1%) | 0 (0.0%) |
| Total | 21,746 (59.7%) | 1,131 (5.2%) |
Employment Status by Educational Attainment in Callaway County
According to labor force statistics for Callaway County, 73.4% of individuals (17,132) out of the total population between 25 and 64 years of age (23,340) are in the labor force, with 3.9% or 668 of them being unemployed. The group with the highest labor force participation rate are those with the educational attainment of bachelor's degree or higher, with 85.0% or 5,168 individuals in the labor force. Within the labor force, individuals with less than high school education have the highest percentage of unemployment, with 21.1% or 255 of them being unemployed.
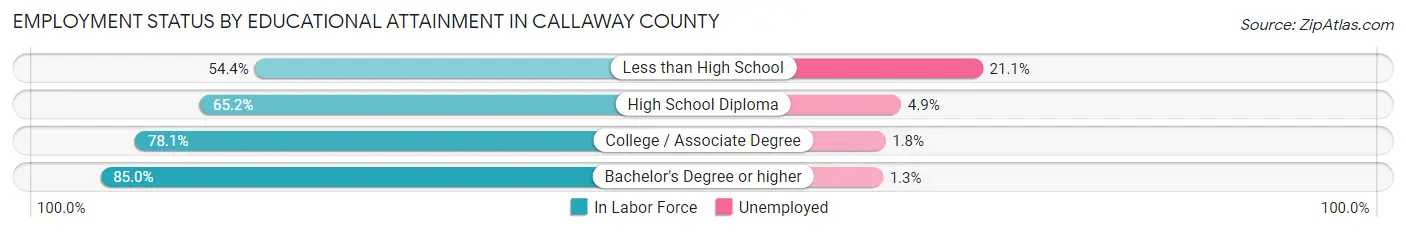
| Educational Attainment | In Labor Force | Unemployed |
| Less than High School | 1,209 (54.4%) | 469 (21.1%) |
| High School Diploma | 5,075 (65.2%) | 381 (4.9%) |
| College / Associate Degree | 5,665 (78.1%) | 131 (1.8%) |
| Bachelor's Degree or higher | 5,168 (85.0%) | 79 (1.3%) |
| Total | 17,132 (73.4%) | 910 (3.9%) |
Employment Occupations by Sex in Callaway County
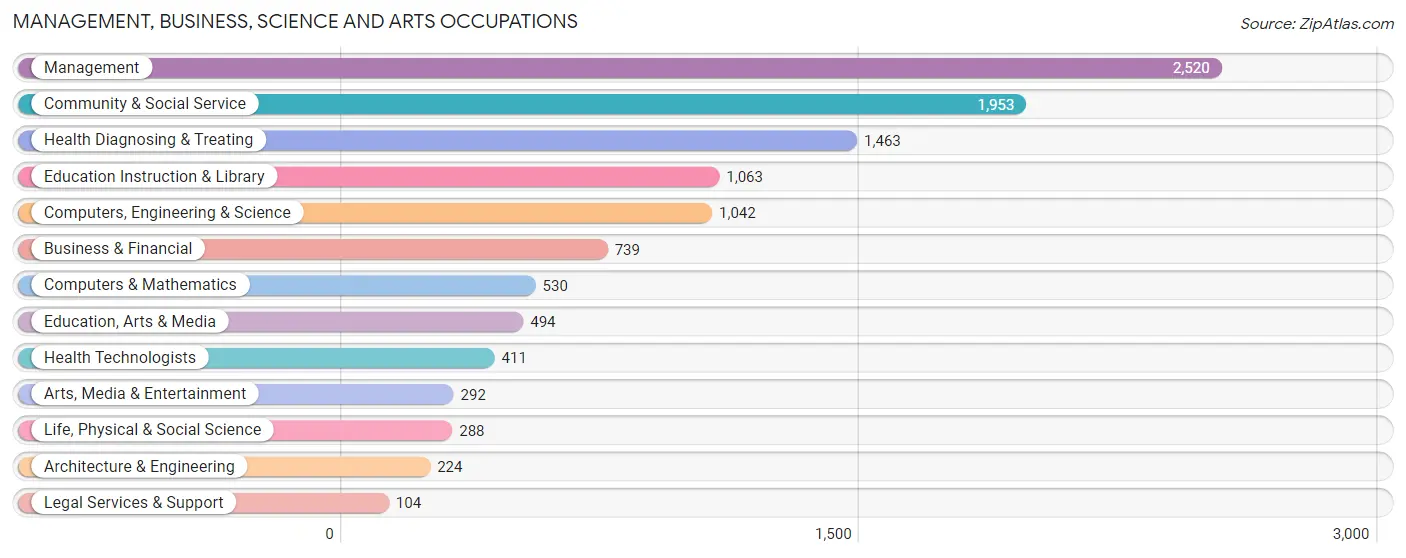
Management, Business, Science and Arts Occupations
The most common Management, Business, Science and Arts occupations in Callaway County are Management (2,520 | 12.2%), Community & Social Service (1,953 | 9.5%), Health Diagnosing & Treating (1,463 | 7.1%), Education Instruction & Library (1,063 | 5.2%), and Computers, Engineering & Science (1,042 | 5.1%).
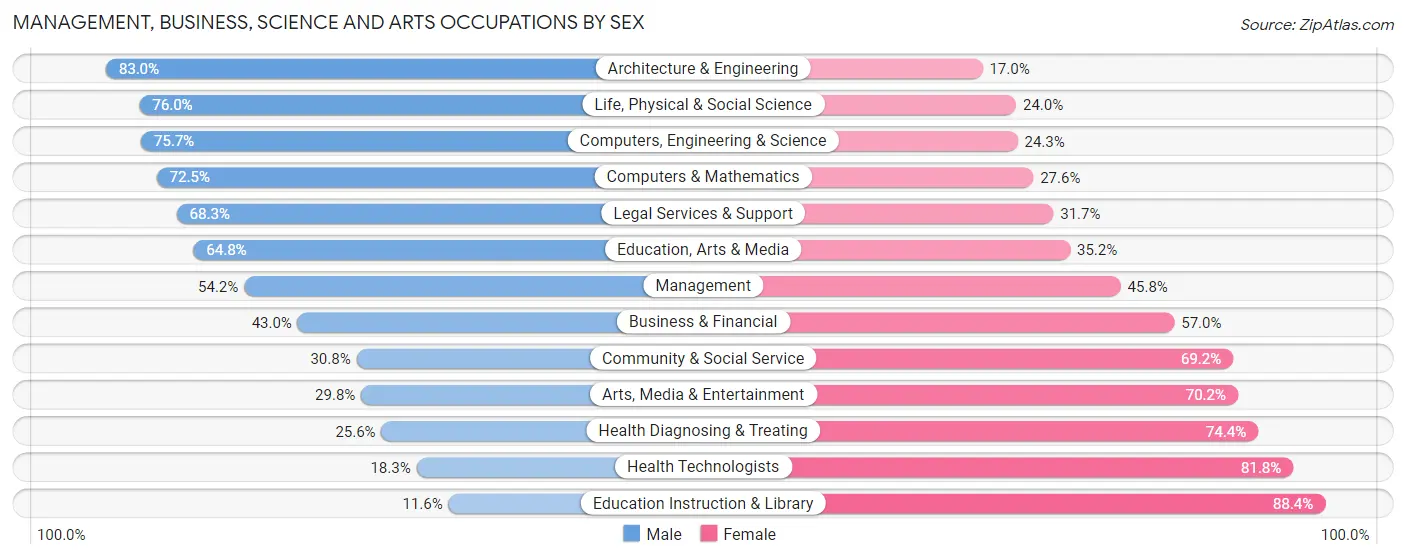
Management, Business, Science and Arts Occupations by Sex
Within the Management, Business, Science and Arts occupations in Callaway County, the most male-oriented occupations are Architecture & Engineering (83.0%), Life, Physical & Social Science (76.0%), and Computers, Engineering & Science (75.7%), while the most female-oriented occupations are Education Instruction & Library (88.4%), Health Technologists (81.8%), and Health Diagnosing & Treating (74.4%).
| Occupation | Male | Female |
| Management | 1,366 (54.2%) | 1,154 (45.8%) |
| Business & Financial | 318 (43.0%) | 421 (57.0%) |
| Computers, Engineering & Science | 789 (75.7%) | 253 (24.3%) |
| Computers & Mathematics | 384 (72.5%) | 146 (27.6%) |
| Architecture & Engineering | 186 (83.0%) | 38 (17.0%) |
| Life, Physical & Social Science | 219 (76.0%) | 69 (24.0%) |
| Community & Social Service | 601 (30.8%) | 1,352 (69.2%) |
| Education, Arts & Media | 320 (64.8%) | 174 (35.2%) |
| Legal Services & Support | 71 (68.3%) | 33 (31.7%) |
| Education Instruction & Library | 123 (11.6%) | 940 (88.4%) |
| Arts, Media & Entertainment | 87 (29.8%) | 205 (70.2%) |
| Health Diagnosing & Treating | 374 (25.6%) | 1,089 (74.4%) |
| Health Technologists | 75 (18.2%) | 336 (81.8%) |
| Total (Category) | 3,448 (44.7%) | 4,269 (55.3%) |
| Total (Overall) | 10,990 (53.4%) | 9,593 (46.6%) |
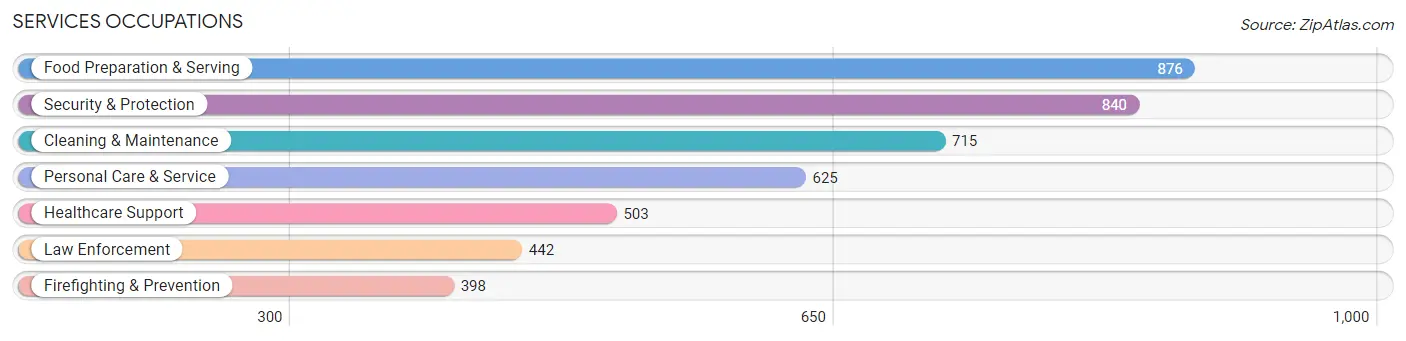
Services Occupations
The most common Services occupations in Callaway County are Food Preparation & Serving (876 | 4.3%), Security & Protection (840 | 4.1%), Cleaning & Maintenance (715 | 3.5%), Personal Care & Service (625 | 3.0%), and Healthcare Support (503 | 2.4%).
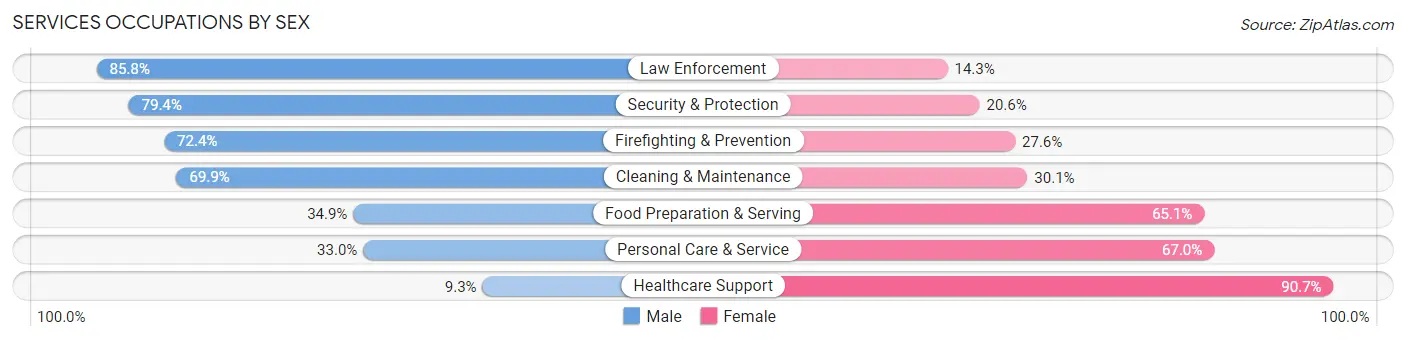
Services Occupations by Sex
Within the Services occupations in Callaway County, the most male-oriented occupations are Law Enforcement (85.8%), Security & Protection (79.4%), and Firefighting & Prevention (72.4%), while the most female-oriented occupations are Healthcare Support (90.7%), Personal Care & Service (67.0%), and Food Preparation & Serving (65.1%).
| Occupation | Male | Female |
| Healthcare Support | 47 (9.3%) | 456 (90.7%) |
| Security & Protection | 667 (79.4%) | 173 (20.6%) |
| Firefighting & Prevention | 288 (72.4%) | 110 (27.6%) |
| Law Enforcement | 379 (85.8%) | 63 (14.2%) |
| Food Preparation & Serving | 306 (34.9%) | 570 (65.1%) |
| Cleaning & Maintenance | 500 (69.9%) | 215 (30.1%) |
| Personal Care & Service | 206 (33.0%) | 419 (67.0%) |
| Total (Category) | 1,726 (48.5%) | 1,833 (51.5%) |
| Total (Overall) | 10,990 (53.4%) | 9,593 (46.6%) |
Sales and Office Occupations
The most common Sales and Office occupations in Callaway County are Office & Administration (2,683 | 13.0%), and Sales & Related (1,797 | 8.7%).
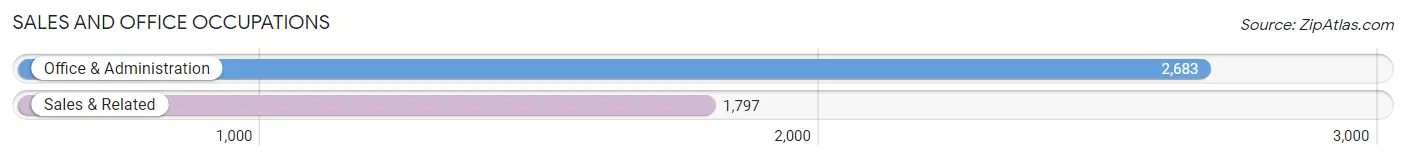
Sales and Office Occupations by Sex
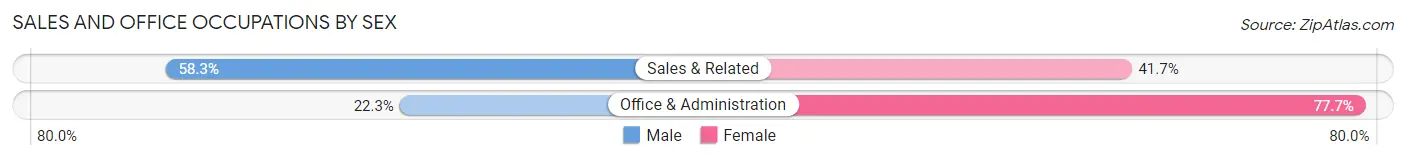
| Occupation | Male | Female |
| Sales & Related | 1,048 (58.3%) | 749 (41.7%) |
| Office & Administration | 598 (22.3%) | 2,085 (77.7%) |
| Total (Category) | 1,646 (36.7%) | 2,834 (63.3%) |
| Total (Overall) | 10,990 (53.4%) | 9,593 (46.6%) |
Natural Resources, Construction and Maintenance Occupations
The most common Natural Resources, Construction and Maintenance occupations in Callaway County are Construction & Extraction (1,138 | 5.5%), Installation, Maintenance & Repair (575 | 2.8%), and Farming, Fishing & Forestry (123 | 0.6%).
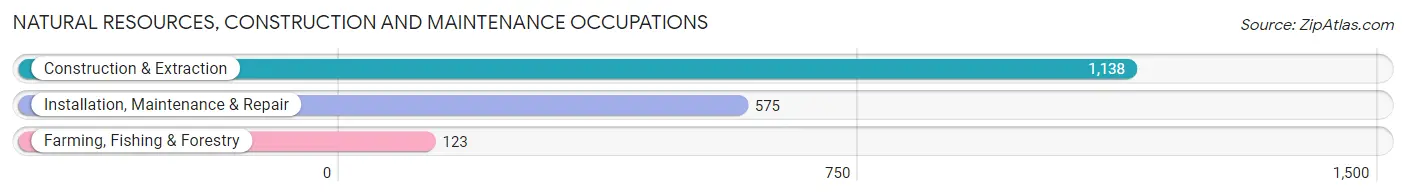
Natural Resources, Construction and Maintenance Occupations by Sex
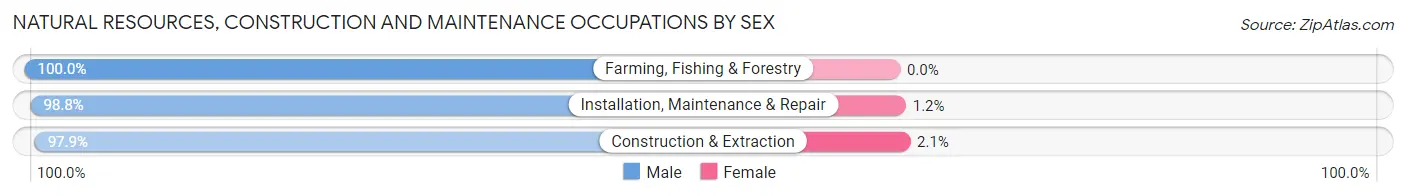
| Occupation | Male | Female |
| Farming, Fishing & Forestry | 123 (100.0%) | 0 (0.0%) |
| Construction & Extraction | 1,114 (97.9%) | 24 (2.1%) |
| Installation, Maintenance & Repair | 568 (98.8%) | 7 (1.2%) |
| Total (Category) | 1,805 (98.3%) | 31 (1.7%) |
| Total (Overall) | 10,990 (53.4%) | 9,593 (46.6%) |
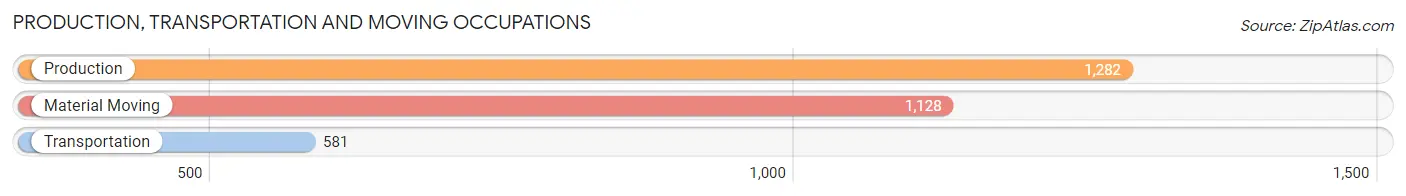
Production, Transportation and Moving Occupations
The most common Production, Transportation and Moving occupations in Callaway County are Production (1,282 | 6.2%), Material Moving (1,128 | 5.5%), and Transportation (581 | 2.8%).
Production, Transportation and Moving Occupations by Sex
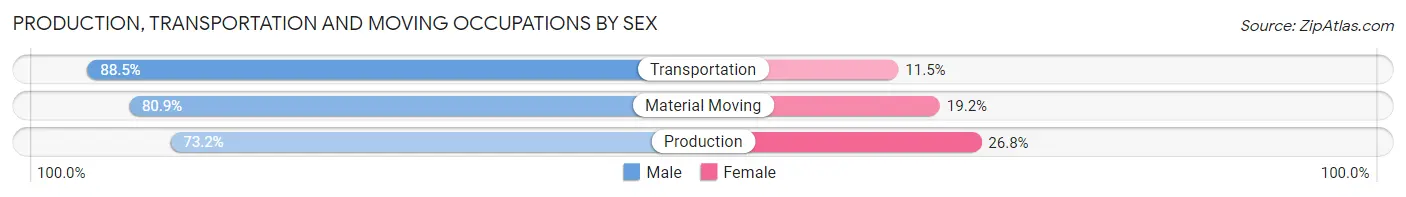
| Occupation | Male | Female |
| Production | 939 (73.2%) | 343 (26.8%) |
| Transportation | 514 (88.5%) | 67 (11.5%) |
| Material Moving | 912 (80.8%) | 216 (19.2%) |
| Total (Category) | 2,365 (79.1%) | 626 (20.9%) |
| Total (Overall) | 10,990 (53.4%) | 9,593 (46.6%) |
Employment Industries by Sex in Callaway County
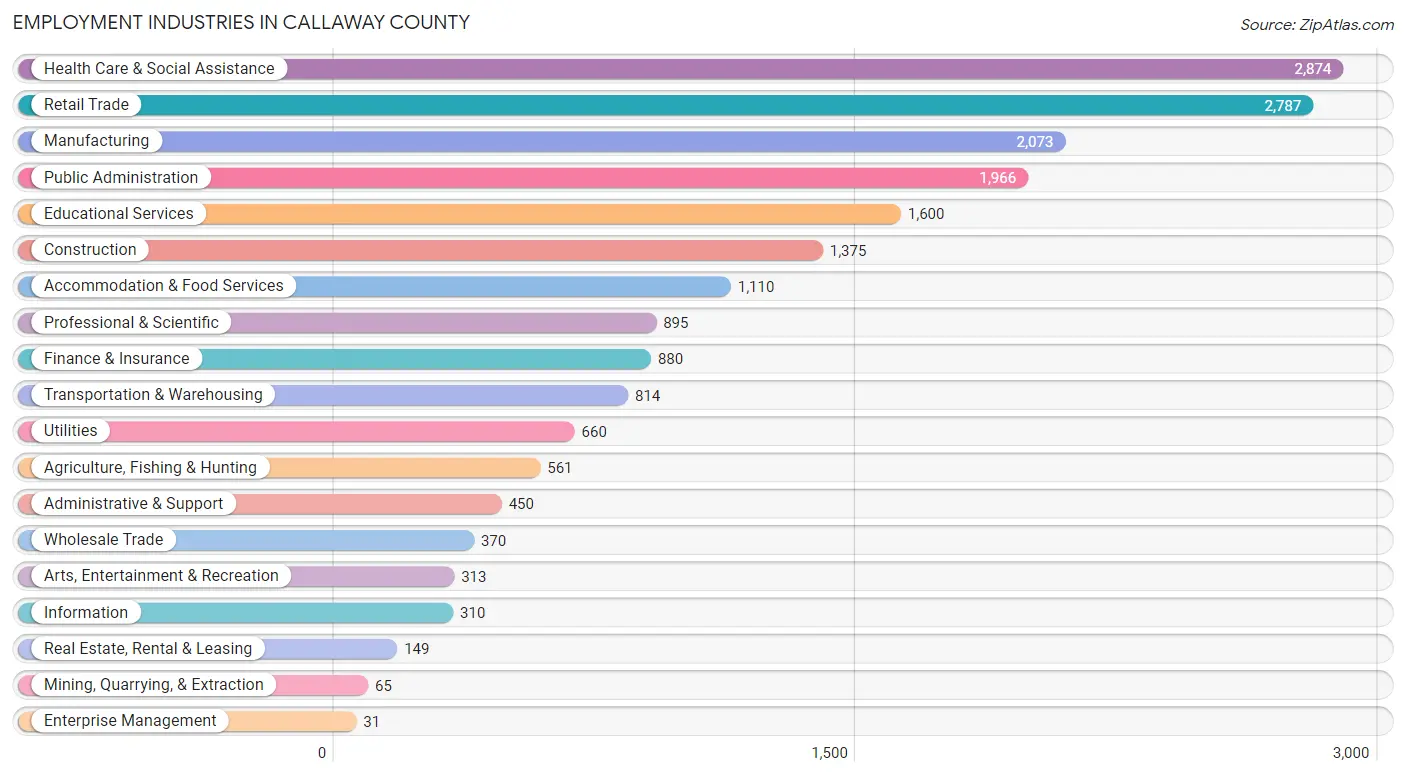
Employment Industries in Callaway County
The major employment industries in Callaway County include Health Care & Social Assistance (2,874 | 14.0%), Retail Trade (2,787 | 13.5%), Manufacturing (2,073 | 10.1%), Public Administration (1,966 | 9.6%), and Educational Services (1,600 | 7.8%).
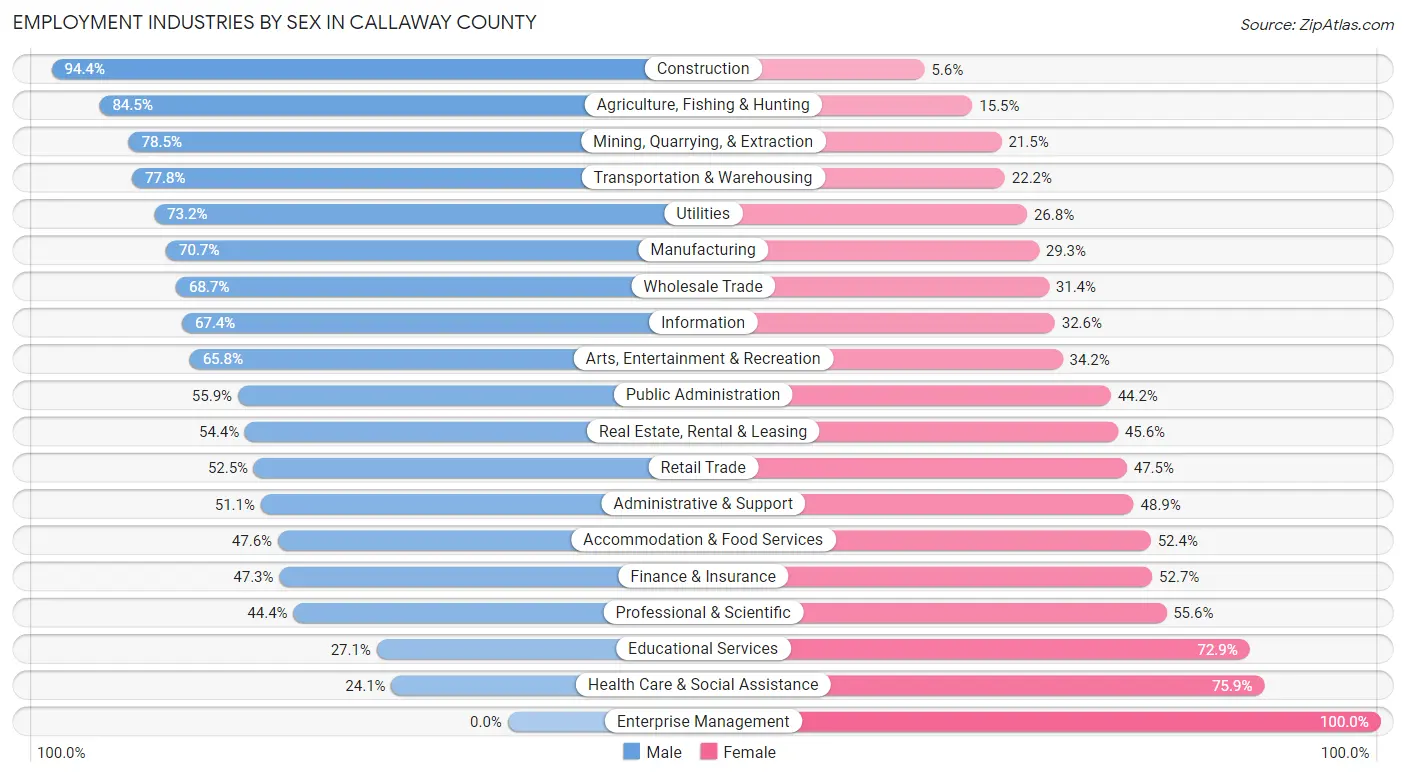
Employment Industries by Sex in Callaway County
The Callaway County industries that see more men than women are Construction (94.4%), Agriculture, Fishing & Hunting (84.5%), and Mining, Quarrying, & Extraction (78.5%), whereas the industries that tend to have a higher number of women are Enterprise Management (100.0%), Health Care & Social Assistance (75.9%), and Educational Services (72.9%).
| Industry | Male | Female |
| Agriculture, Fishing & Hunting | 474 (84.5%) | 87 (15.5%) |
| Mining, Quarrying, & Extraction | 51 (78.5%) | 14 (21.5%) |
| Construction | 1,298 (94.4%) | 77 (5.6%) |
| Manufacturing | 1,466 (70.7%) | 607 (29.3%) |
| Wholesale Trade | 254 (68.6%) | 116 (31.4%) |
| Retail Trade | 1,464 (52.5%) | 1,323 (47.5%) |
| Transportation & Warehousing | 633 (77.8%) | 181 (22.2%) |
| Utilities | 483 (73.2%) | 177 (26.8%) |
| Information | 209 (67.4%) | 101 (32.6%) |
| Finance & Insurance | 416 (47.3%) | 464 (52.7%) |
| Real Estate, Rental & Leasing | 81 (54.4%) | 68 (45.6%) |
| Professional & Scientific | 397 (44.4%) | 498 (55.6%) |
| Enterprise Management | 0 (0.0%) | 31 (100.0%) |
| Administrative & Support | 230 (51.1%) | 220 (48.9%) |
| Educational Services | 434 (27.1%) | 1,166 (72.9%) |
| Health Care & Social Assistance | 692 (24.1%) | 2,182 (75.9%) |
| Arts, Entertainment & Recreation | 206 (65.8%) | 107 (34.2%) |
| Accommodation & Food Services | 528 (47.6%) | 582 (52.4%) |
| Public Administration | 1,098 (55.8%) | 868 (44.2%) |
| Total | 10,990 (53.4%) | 9,593 (46.6%) |
Education in Callaway County
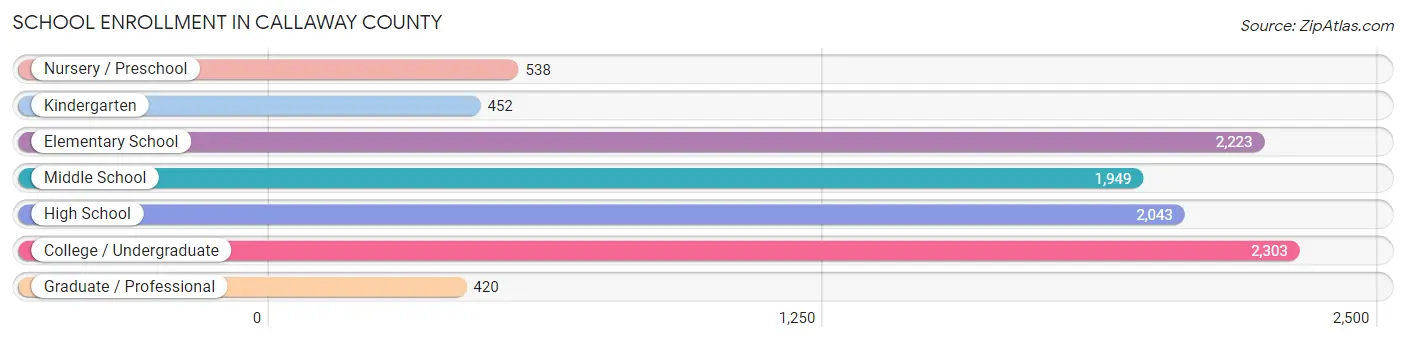
School Enrollment in Callaway County
The most common levels of schooling among the 9,928 students in Callaway County are college / undergraduate (2,303 | 23.2%), elementary school (2,223 | 22.4%), and high school (2,043 | 20.6%).
| School Level | # Students | % Students |
| Nursery / Preschool | 538 | 5.4% |
| Kindergarten | 452 | 4.5% |
| Elementary School | 2,223 | 22.4% |
| Middle School | 1,949 | 19.6% |
| High School | 2,043 | 20.6% |
| College / Undergraduate | 2,303 | 23.2% |
| Graduate / Professional | 420 | 4.2% |
| Total | 9,928 | 100.0% |
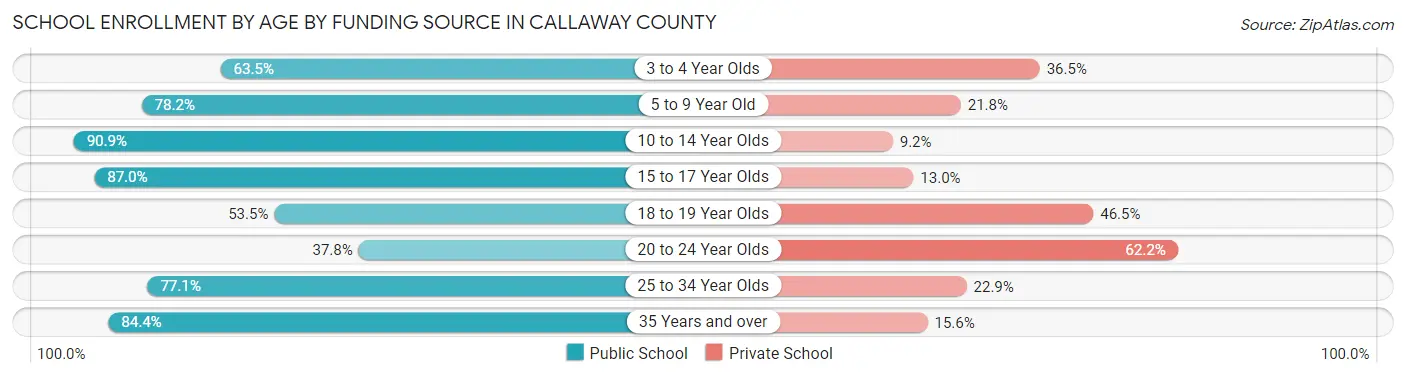
School Enrollment by Age by Funding Source in Callaway County
Out of a total of 9,928 students who are enrolled in schools in Callaway County, 2,462 (24.8%) attend a private institution, while the remaining 7,466 (75.2%) are enrolled in public schools. The age group of 20 to 24 year olds has the highest likelihood of being enrolled in private schools, with 711 (62.2% in the age bracket) enrolled. Conversely, the age group of 10 to 14 year olds has the lowest likelihood of being enrolled in a private school, with 2,343 (90.8% in the age bracket) attending a public institution.
| Age Bracket | Public School | Private School |
| 3 to 4 Year Olds | 252 (63.5%) | 145 (36.5%) |
| 5 to 9 Year Old | 1,785 (78.2%) | 498 (21.8%) |
| 10 to 14 Year Olds | 2,343 (90.8%) | 236 (9.1%) |
| 15 to 17 Year Olds | 1,373 (87.0%) | 205 (13.0%) |
| 18 to 19 Year Olds | 604 (53.5%) | 525 (46.5%) |
| 20 to 24 Year Olds | 432 (37.8%) | 711 (62.2%) |
| 25 to 34 Year Olds | 202 (77.1%) | 60 (22.9%) |
| 35 Years and over | 470 (84.4%) | 87 (15.6%) |
| Total | 7,466 (75.2%) | 2,462 (24.8%) |
Educational Attainment by Field of Study in Callaway County
Business (1,631 | 19.3%), education (1,306 | 15.4%), bio, nature & agricultural (1,033 | 12.2%), science & technology (778 | 9.2%), and liberal arts & history (725 | 8.6%) are the most common fields of study among 8,474 individuals in Callaway County who have obtained a bachelor's degree or higher.
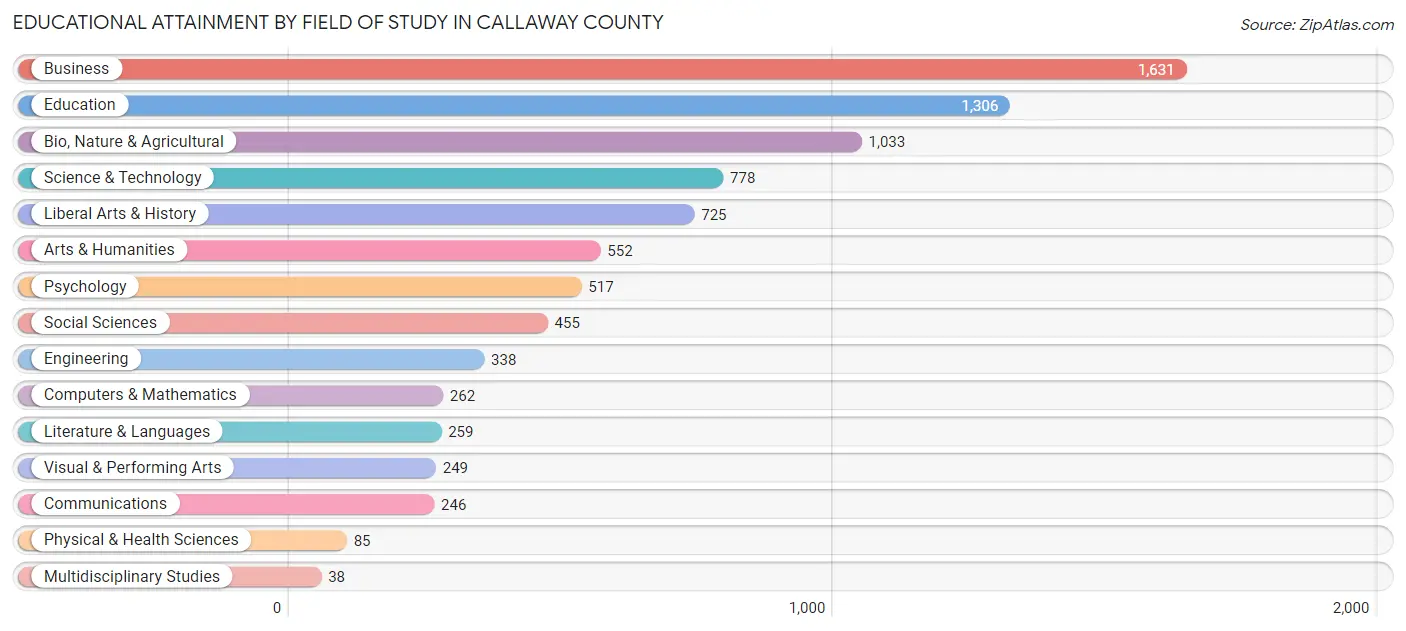
| Field of Study | # Graduates | % Graduates |
| Computers & Mathematics | 262 | 3.1% |
| Bio, Nature & Agricultural | 1,033 | 12.2% |
| Physical & Health Sciences | 85 | 1.0% |
| Psychology | 517 | 6.1% |
| Social Sciences | 455 | 5.4% |
| Engineering | 338 | 4.0% |
| Multidisciplinary Studies | 38 | 0.4% |
| Science & Technology | 778 | 9.2% |
| Business | 1,631 | 19.3% |
| Education | 1,306 | 15.4% |
| Literature & Languages | 259 | 3.1% |
| Liberal Arts & History | 725 | 8.6% |
| Visual & Performing Arts | 249 | 2.9% |
| Communications | 246 | 2.9% |
| Arts & Humanities | 552 | 6.5% |
| Total | 8,474 | 100.0% |
Transportation & Commute in Callaway County
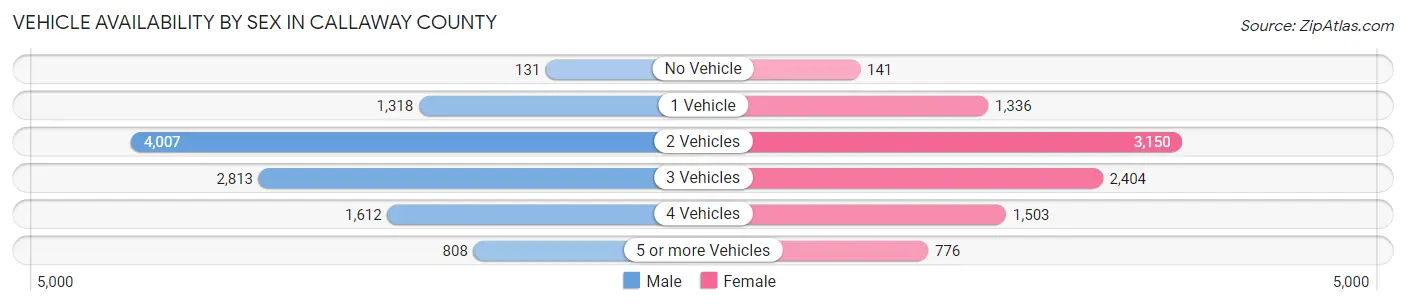
Vehicle Availability by Sex in Callaway County
The most prevalent vehicle ownership categories in Callaway County are males with 2 vehicles (4,007, accounting for 37.5%) and females with 2 vehicles (3,150, making up 43.0%).
| Vehicles Available | Male | Female |
| No Vehicle | 131 (1.2%) | 141 (1.5%) |
| 1 Vehicle | 1,318 (12.3%) | 1,336 (14.3%) |
| 2 Vehicles | 4,007 (37.5%) | 3,150 (33.8%) |
| 3 Vehicles | 2,813 (26.3%) | 2,404 (25.8%) |
| 4 Vehicles | 1,612 (15.1%) | 1,503 (16.1%) |
| 5 or more Vehicles | 808 (7.6%) | 776 (8.3%) |
| Total | 10,689 (100.0%) | 9,310 (100.0%) |
Commute Time in Callaway County
The most frequently occuring commute durations in Callaway County are 15 to 19 minutes (2,923 commuters, 15.4%), 10 to 14 minutes (2,860 commuters, 15.0%), and 20 to 24 minutes (2,805 commuters, 14.7%).
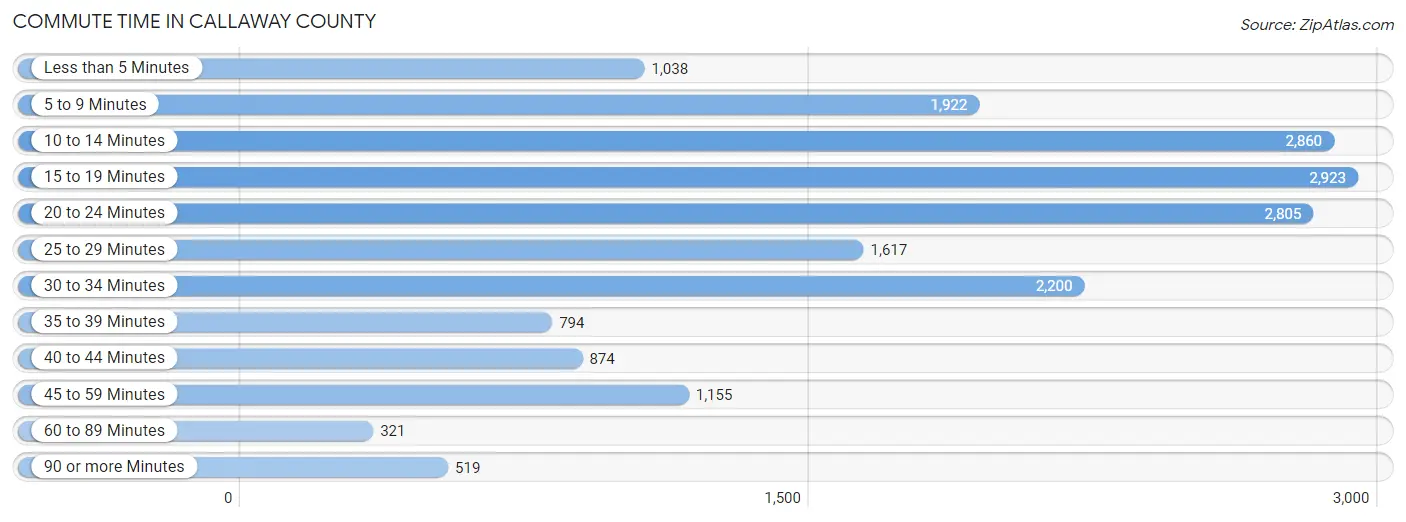
| Commute Time | # Commuters | % Commuters |
| Less than 5 Minutes | 1,038 | 5.5% |
| 5 to 9 Minutes | 1,922 | 10.1% |
| 10 to 14 Minutes | 2,860 | 15.0% |
| 15 to 19 Minutes | 2,923 | 15.4% |
| 20 to 24 Minutes | 2,805 | 14.7% |
| 25 to 29 Minutes | 1,617 | 8.5% |
| 30 to 34 Minutes | 2,200 | 11.6% |
| 35 to 39 Minutes | 794 | 4.2% |
| 40 to 44 Minutes | 874 | 4.6% |
| 45 to 59 Minutes | 1,155 | 6.1% |
| 60 to 89 Minutes | 321 | 1.7% |
| 90 or more Minutes | 519 | 2.7% |
Commute Time by Sex in Callaway County
The most common commute times in Callaway County are 10 to 14 minutes (1,522 commuters, 15.3%) for males and 15 to 19 minutes (1,474 commuters, 16.3%) for females.
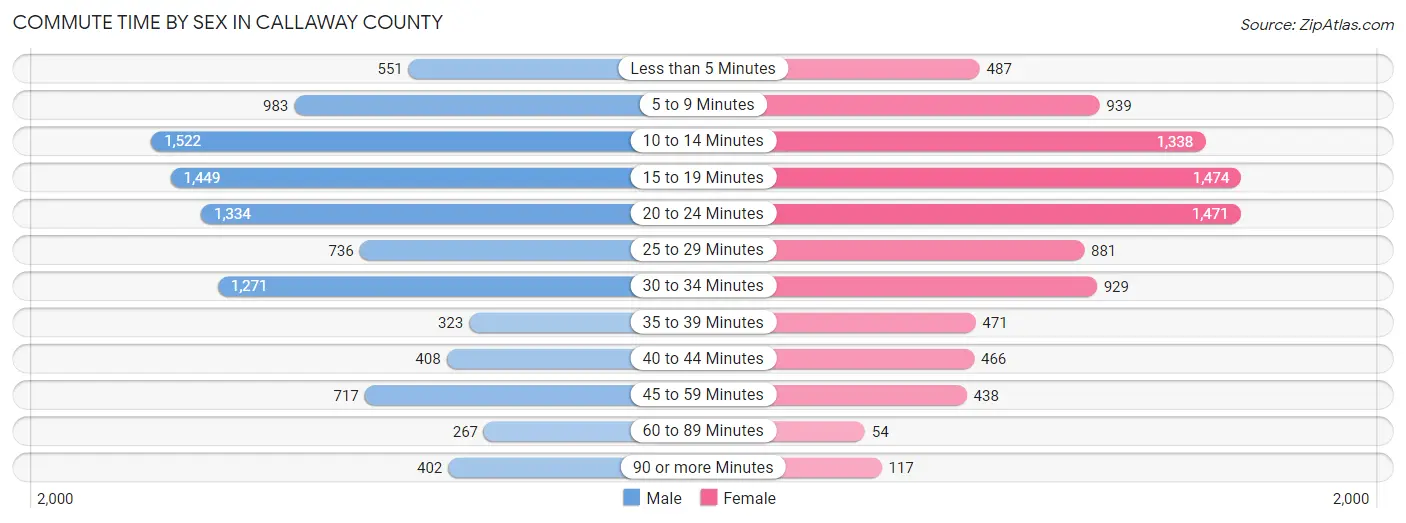
| Commute Time | Male | Female |
| Less than 5 Minutes | 551 (5.5%) | 487 (5.4%) |
| 5 to 9 Minutes | 983 (9.9%) | 939 (10.4%) |
| 10 to 14 Minutes | 1,522 (15.3%) | 1,338 (14.8%) |
| 15 to 19 Minutes | 1,449 (14.5%) | 1,474 (16.3%) |
| 20 to 24 Minutes | 1,334 (13.4%) | 1,471 (16.2%) |
| 25 to 29 Minutes | 736 (7.4%) | 881 (9.7%) |
| 30 to 34 Minutes | 1,271 (12.8%) | 929 (10.2%) |
| 35 to 39 Minutes | 323 (3.2%) | 471 (5.2%) |
| 40 to 44 Minutes | 408 (4.1%) | 466 (5.1%) |
| 45 to 59 Minutes | 717 (7.2%) | 438 (4.8%) |
| 60 to 89 Minutes | 267 (2.7%) | 54 (0.6%) |
| 90 or more Minutes | 402 (4.0%) | 117 (1.3%) |
Time of Departure to Work by Sex in Callaway County
The most frequent times of departure to work in Callaway County are 6:30 AM to 6:59 AM (1,454, 14.6%) for males and 7:00 AM to 7:29 AM (1,804, 19.9%) for females.
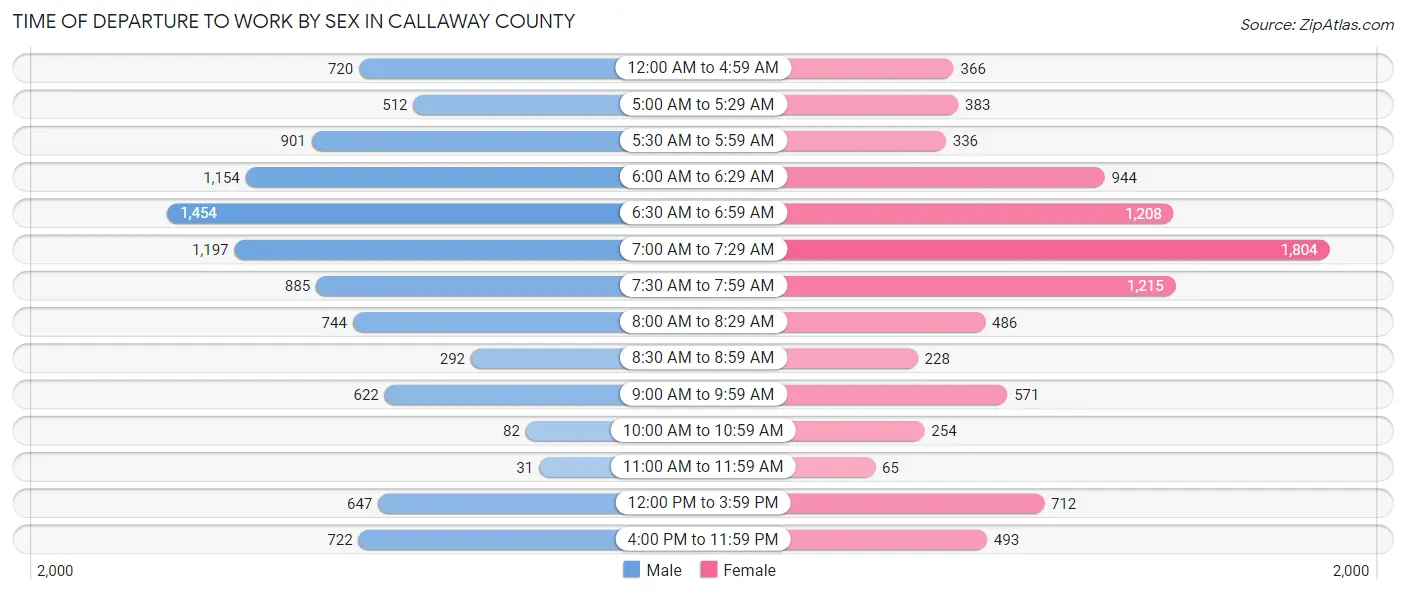
| Time of Departure | Male | Female |
| 12:00 AM to 4:59 AM | 720 (7.2%) | 366 (4.0%) |
| 5:00 AM to 5:29 AM | 512 (5.1%) | 383 (4.2%) |
| 5:30 AM to 5:59 AM | 901 (9.0%) | 336 (3.7%) |
| 6:00 AM to 6:29 AM | 1,154 (11.6%) | 944 (10.4%) |
| 6:30 AM to 6:59 AM | 1,454 (14.6%) | 1,208 (13.3%) |
| 7:00 AM to 7:29 AM | 1,197 (12.0%) | 1,804 (19.9%) |
| 7:30 AM to 7:59 AM | 885 (8.9%) | 1,215 (13.4%) |
| 8:00 AM to 8:29 AM | 744 (7.5%) | 486 (5.4%) |
| 8:30 AM to 8:59 AM | 292 (2.9%) | 228 (2.5%) |
| 9:00 AM to 9:59 AM | 622 (6.2%) | 571 (6.3%) |
| 10:00 AM to 10:59 AM | 82 (0.8%) | 254 (2.8%) |
| 11:00 AM to 11:59 AM | 31 (0.3%) | 65 (0.7%) |
| 12:00 PM to 3:59 PM | 647 (6.5%) | 712 (7.9%) |
| 4:00 PM to 11:59 PM | 722 (7.2%) | 493 (5.4%) |
| Total | 9,963 (100.0%) | 9,065 (100.0%) |
Housing Occupancy in Callaway County
Occupancy by Ownership in Callaway County
Of the total 15,981 dwellings in Callaway County, owner-occupied units account for 12,352 (77.3%), while renter-occupied units make up 3,629 (22.7%).
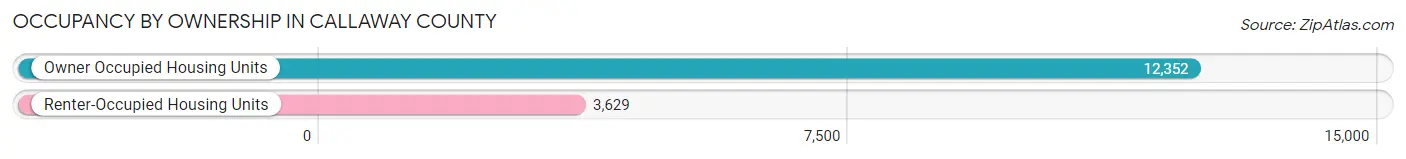
| Occupancy | # Housing Units | % Housing Units |
| Owner Occupied Housing Units | 12,352 | 77.3% |
| Renter-Occupied Housing Units | 3,629 | 22.7% |
| Total Occupied Housing Units | 15,981 | 100.0% |
Occupancy by Household Size in Callaway County
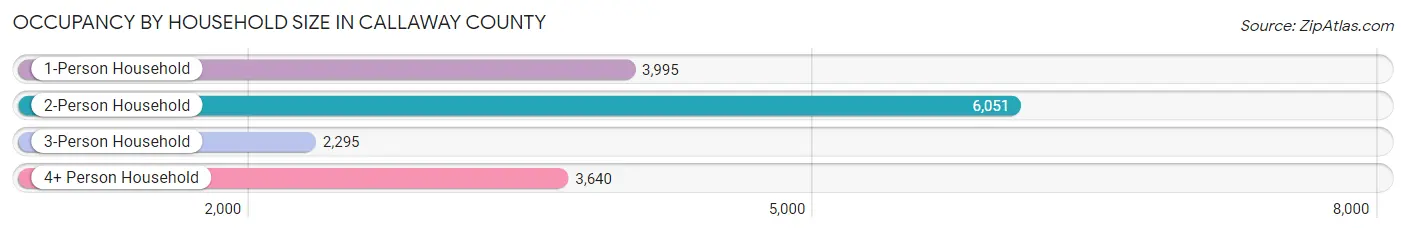
| Household Size | # Housing Units | % Housing Units |
| 1-Person Household | 3,995 | 25.0% |
| 2-Person Household | 6,051 | 37.9% |
| 3-Person Household | 2,295 | 14.4% |
| 4+ Person Household | 3,640 | 22.8% |
| Total Housing Units | 15,981 | 100.0% |
Occupancy by Ownership by Household Size in Callaway County
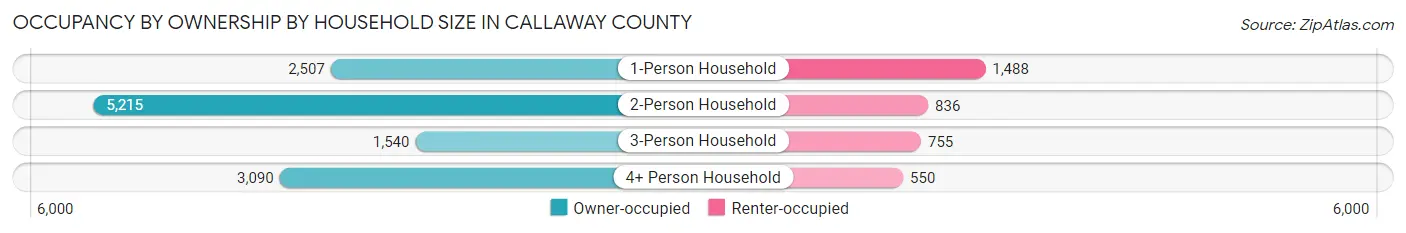
| Household Size | Owner-occupied | Renter-occupied |
| 1-Person Household | 2,507 (62.7%) | 1,488 (37.2%) |
| 2-Person Household | 5,215 (86.2%) | 836 (13.8%) |
| 3-Person Household | 1,540 (67.1%) | 755 (32.9%) |
| 4+ Person Household | 3,090 (84.9%) | 550 (15.1%) |
| Total Housing Units | 12,352 (77.3%) | 3,629 (22.7%) |
Occupancy by Educational Attainment in Callaway County
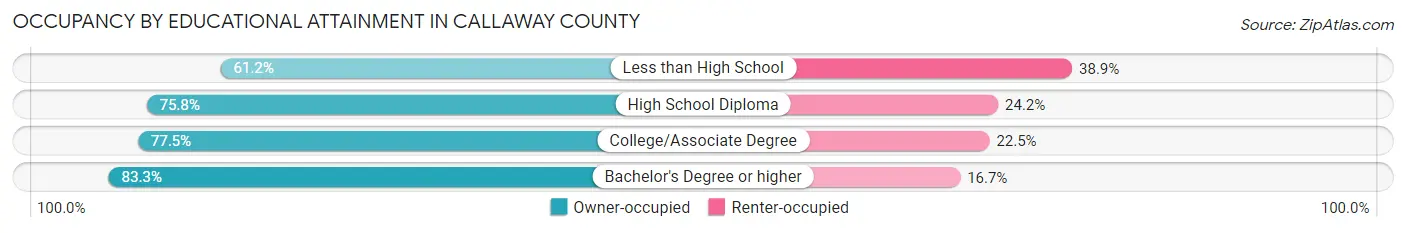
| Household Size | Owner-occupied | Renter-occupied |
| Less than High School | 710 (61.2%) | 451 (38.9%) |
| High School Diploma | 4,029 (75.8%) | 1,285 (24.2%) |
| College/Associate Degree | 4,136 (77.5%) | 1,198 (22.5%) |
| Bachelor's Degree or higher | 3,477 (83.3%) | 695 (16.7%) |
Occupancy by Age of Householder in Callaway County
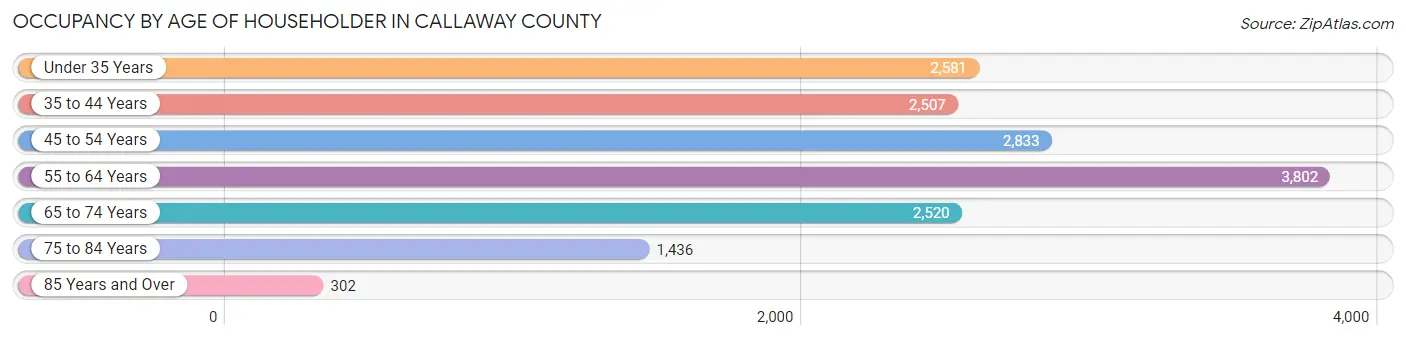
| Age Bracket | # Households | % Households |
| Under 35 Years | 2,581 | 16.2% |
| 35 to 44 Years | 2,507 | 15.7% |
| 45 to 54 Years | 2,833 | 17.7% |
| 55 to 64 Years | 3,802 | 23.8% |
| 65 to 74 Years | 2,520 | 15.8% |
| 75 to 84 Years | 1,436 | 9.0% |
| 85 Years and Over | 302 | 1.9% |
| Total | 15,981 | 100.0% |
Housing Finances in Callaway County
Median Income by Occupancy in Callaway County
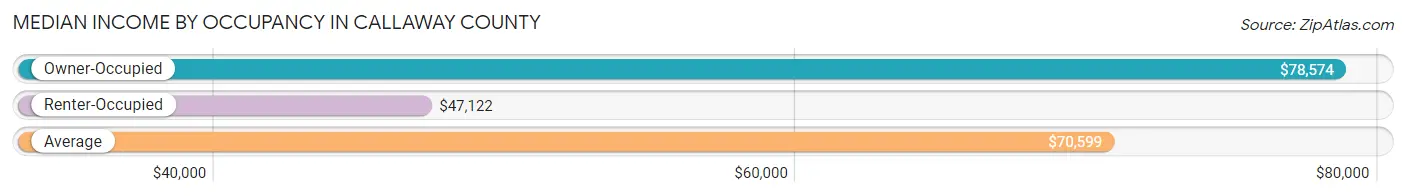
| Occupancy Type | # Households | Median Income |
| Owner-Occupied | 12,352 (77.3%) | $78,574 |
| Renter-Occupied | 3,629 (22.7%) | $47,122 |
| Average | 15,981 (100.0%) | $70,599 |
Occupancy by Householder Income Bracket in Callaway County
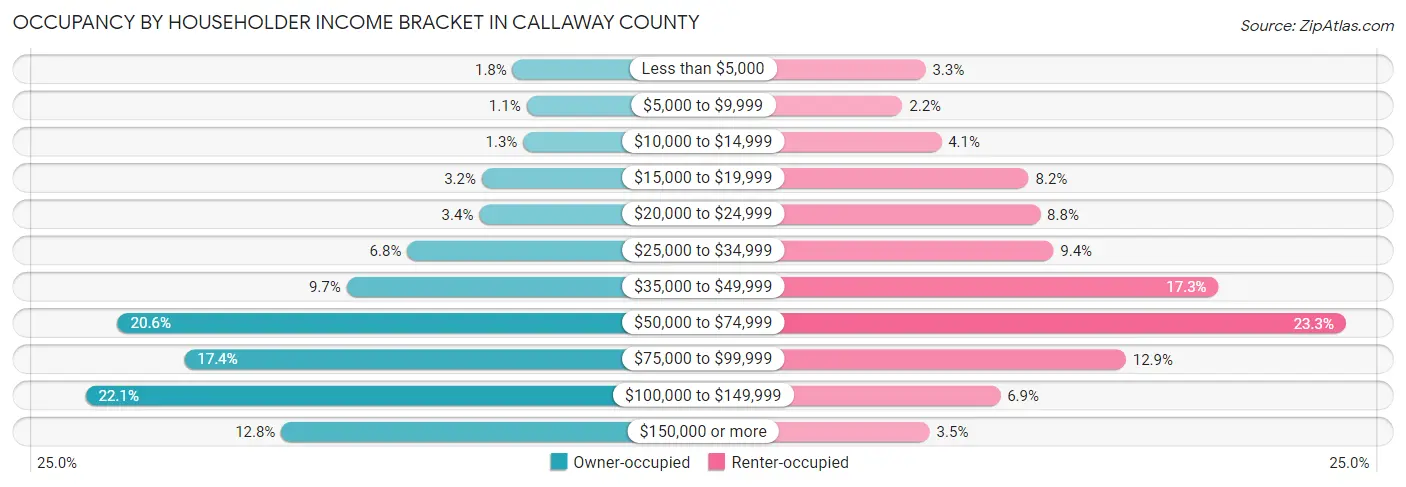
| Income Bracket | Owner-occupied | Renter-occupied |
| Less than $5,000 | 218 (1.8%) | 121 (3.3%) |
| $5,000 to $9,999 | 136 (1.1%) | 81 (2.2%) |
| $10,000 to $14,999 | 156 (1.3%) | 148 (4.1%) |
| $15,000 to $19,999 | 399 (3.2%) | 299 (8.2%) |
| $20,000 to $24,999 | 414 (3.4%) | 319 (8.8%) |
| $25,000 to $34,999 | 837 (6.8%) | 342 (9.4%) |
| $35,000 to $49,999 | 1,194 (9.7%) | 627 (17.3%) |
| $50,000 to $74,999 | 2,541 (20.6%) | 847 (23.3%) |
| $75,000 to $99,999 | 2,148 (17.4%) | 467 (12.9%) |
| $100,000 to $149,999 | 2,730 (22.1%) | 250 (6.9%) |
| $150,000 or more | 1,579 (12.8%) | 128 (3.5%) |
| Total | 12,352 (100.0%) | 3,629 (100.0%) |
Monthly Housing Cost Tiers in Callaway County
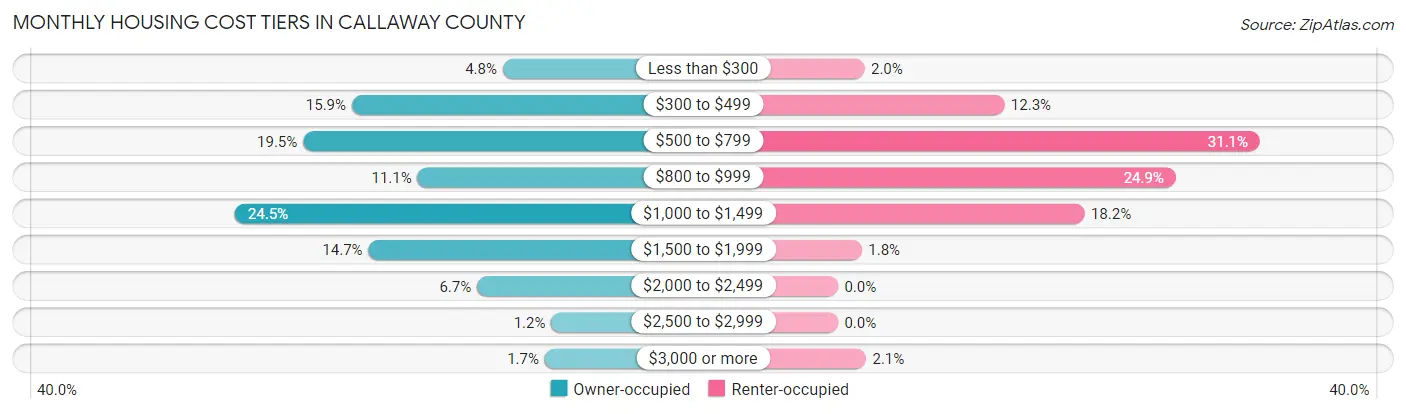
| Monthly Cost | Owner-occupied | Renter-occupied |
| Less than $300 | 591 (4.8%) | 71 (2.0%) |
| $300 to $499 | 1,964 (15.9%) | 445 (12.3%) |
| $500 to $799 | 2,407 (19.5%) | 1,129 (31.1%) |
| $800 to $999 | 1,366 (11.1%) | 904 (24.9%) |
| $1,000 to $1,499 | 3,028 (24.5%) | 659 (18.2%) |
| $1,500 to $1,999 | 1,813 (14.7%) | 64 (1.8%) |
| $2,000 to $2,499 | 825 (6.7%) | 0 (0.0%) |
| $2,500 to $2,999 | 149 (1.2%) | 0 (0.0%) |
| $3,000 or more | 209 (1.7%) | 75 (2.1%) |
| Total | 12,352 (100.0%) | 3,629 (100.0%) |
Physical Housing Characteristics in Callaway County
Housing Structures in Callaway County
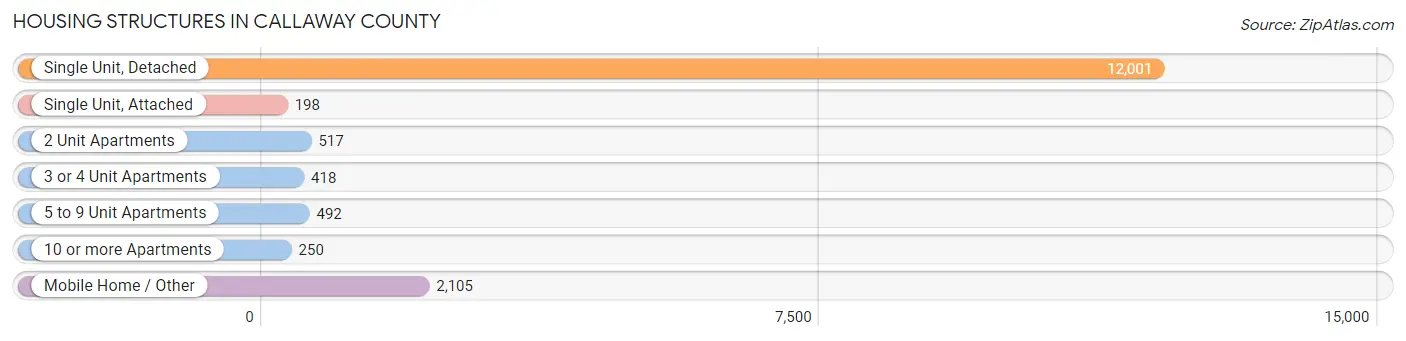
| Structure Type | # Housing Units | % Housing Units |
| Single Unit, Detached | 12,001 | 75.1% |
| Single Unit, Attached | 198 | 1.2% |
| 2 Unit Apartments | 517 | 3.2% |
| 3 or 4 Unit Apartments | 418 | 2.6% |
| 5 to 9 Unit Apartments | 492 | 3.1% |
| 10 or more Apartments | 250 | 1.6% |
| Mobile Home / Other | 2,105 | 13.2% |
| Total | 15,981 | 100.0% |
Housing Structures by Occupancy in Callaway County
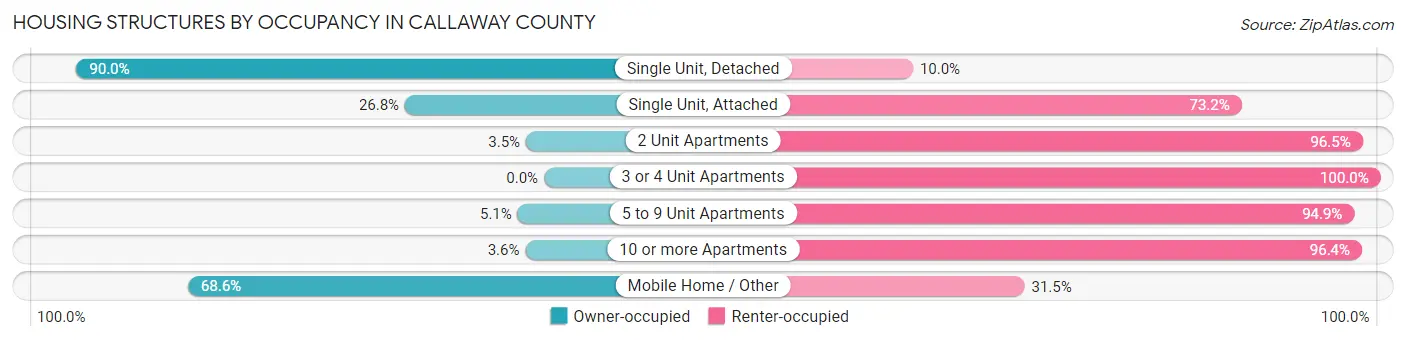
| Structure Type | Owner-occupied | Renter-occupied |
| Single Unit, Detached | 10,804 (90.0%) | 1,197 (10.0%) |
| Single Unit, Attached | 53 (26.8%) | 145 (73.2%) |
| 2 Unit Apartments | 18 (3.5%) | 499 (96.5%) |
| 3 or 4 Unit Apartments | 0 (0.0%) | 418 (100.0%) |
| 5 to 9 Unit Apartments | 25 (5.1%) | 467 (94.9%) |
| 10 or more Apartments | 9 (3.6%) | 241 (96.4%) |
| Mobile Home / Other | 1,443 (68.5%) | 662 (31.5%) |
| Total | 12,352 (77.3%) | 3,629 (22.7%) |
Housing Structures by Number of Rooms in Callaway County
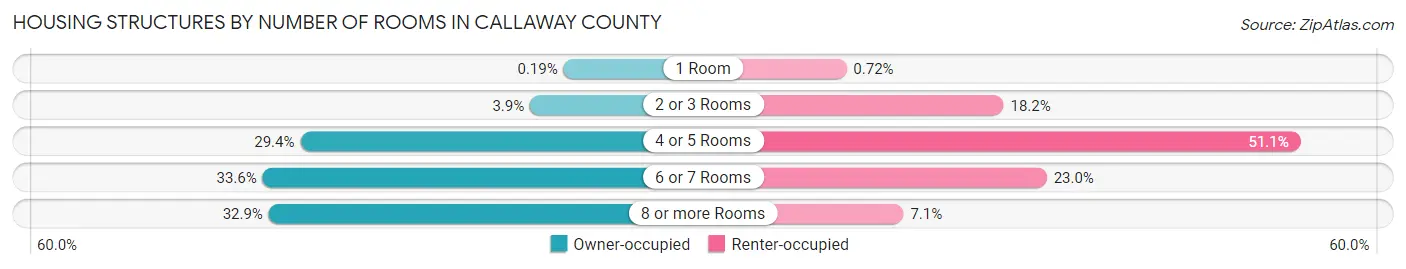
| Number of Rooms | Owner-occupied | Renter-occupied |
| 1 Room | 24 (0.2%) | 26 (0.7%) |
| 2 or 3 Rooms | 482 (3.9%) | 659 (18.2%) |
| 4 or 5 Rooms | 3,632 (29.4%) | 1,855 (51.1%) |
| 6 or 7 Rooms | 4,149 (33.6%) | 833 (23.0%) |
| 8 or more Rooms | 4,065 (32.9%) | 256 (7.0%) |
| Total | 12,352 (100.0%) | 3,629 (100.0%) |
Housing Structure by Heating Type in Callaway County
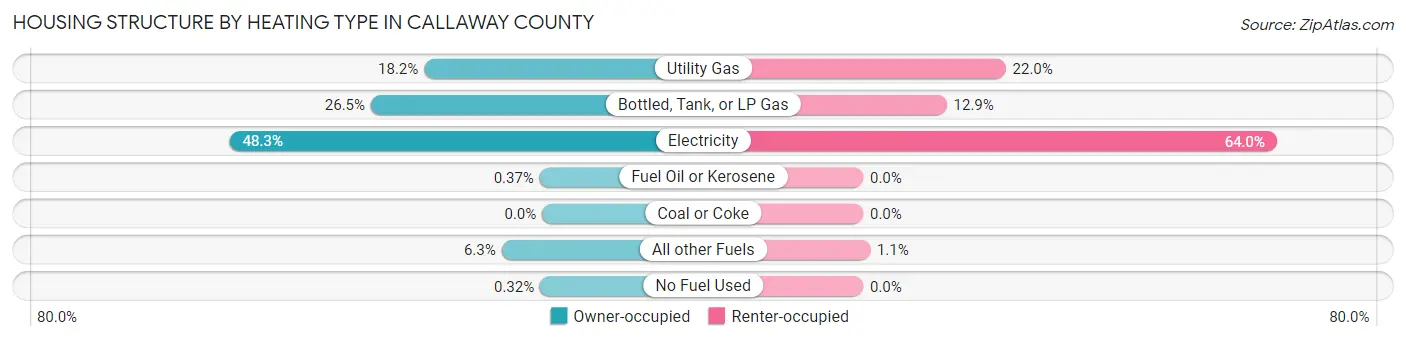
| Heating Type | Owner-occupied | Renter-occupied |
| Utility Gas | 2,253 (18.2%) | 800 (22.0%) |
| Bottled, Tank, or LP Gas | 3,270 (26.5%) | 469 (12.9%) |
| Electricity | 5,968 (48.3%) | 2,321 (64.0%) |
| Fuel Oil or Kerosene | 46 (0.4%) | 0 (0.0%) |
| Coal or Coke | 0 (0.0%) | 0 (0.0%) |
| All other Fuels | 775 (6.3%) | 39 (1.1%) |
| No Fuel Used | 40 (0.3%) | 0 (0.0%) |
| Total | 12,352 (100.0%) | 3,629 (100.0%) |
Household Vehicle Usage in Callaway County
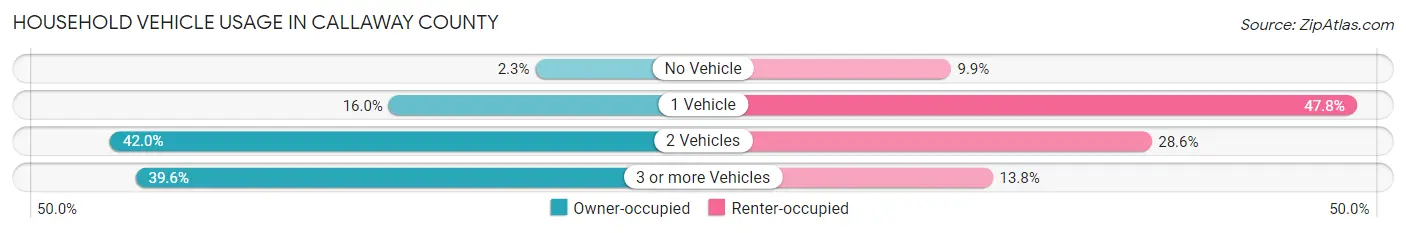
| Vehicles per Household | Owner-occupied | Renter-occupied |
| No Vehicle | 288 (2.3%) | 358 (9.9%) |
| 1 Vehicle | 1,978 (16.0%) | 1,733 (47.7%) |
| 2 Vehicles | 5,190 (42.0%) | 1,038 (28.6%) |
| 3 or more Vehicles | 4,896 (39.6%) | 500 (13.8%) |
| Total | 12,352 (100.0%) | 3,629 (100.0%) |
Real Estate & Mortgages in Callaway County
Real Estate and Mortgage Overview in Callaway County
| Characteristic | Without Mortgage | With Mortgage |
| Housing Units | 4,808 | 7,544 |
| Median Property Value | $172,700 | $188,600 |
| Median Household Income | $56,197 | $1,284 |
| Monthly Housing Costs | $490 | $201 |
| Real Estate Taxes | $1,402 | $233 |
Property Value by Mortgage Status in Callaway County
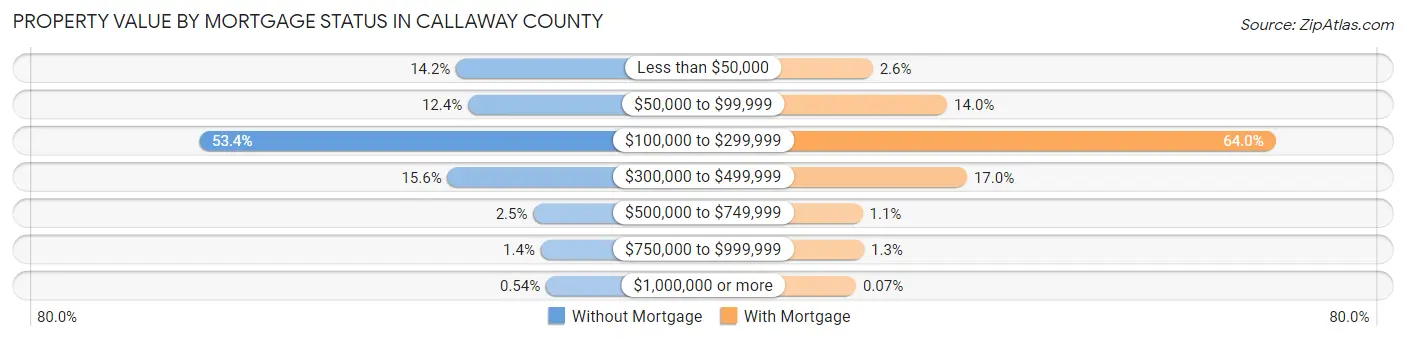
| Property Value | Without Mortgage | With Mortgage |
| Less than $50,000 | 684 (14.2%) | 198 (2.6%) |
| $50,000 to $99,999 | 598 (12.4%) | 1,053 (14.0%) |
| $100,000 to $299,999 | 2,568 (53.4%) | 4,828 (64.0%) |
| $300,000 to $499,999 | 748 (15.6%) | 1,281 (17.0%) |
| $500,000 to $749,999 | 119 (2.5%) | 81 (1.1%) |
| $750,000 to $999,999 | 65 (1.3%) | 98 (1.3%) |
| $1,000,000 or more | 26 (0.5%) | 5 (0.1%) |
| Total | 4,808 (100.0%) | 7,544 (100.0%) |
Household Income by Mortgage Status in Callaway County
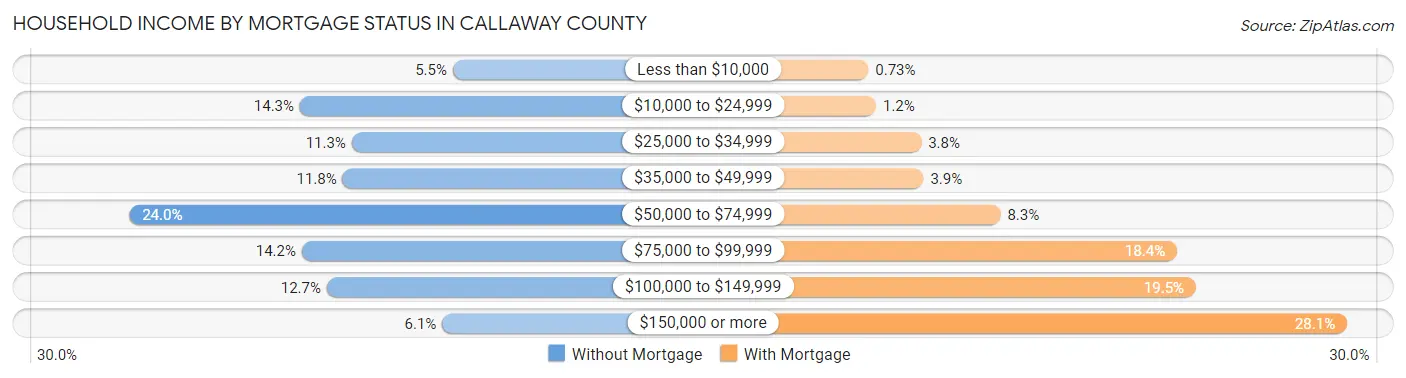
| Household Income | Without Mortgage | With Mortgage |
| Less than $10,000 | 266 (5.5%) | 55 (0.7%) |
| $10,000 to $24,999 | 686 (14.3%) | 88 (1.2%) |
| $25,000 to $34,999 | 544 (11.3%) | 283 (3.7%) |
| $35,000 to $49,999 | 569 (11.8%) | 293 (3.9%) |
| $50,000 to $74,999 | 1,155 (24.0%) | 625 (8.3%) |
| $75,000 to $99,999 | 681 (14.2%) | 1,386 (18.4%) |
| $100,000 to $149,999 | 612 (12.7%) | 1,467 (19.5%) |
| $150,000 or more | 295 (6.1%) | 2,118 (28.1%) |
| Total | 4,808 (100.0%) | 7,544 (100.0%) |
Property Value to Household Income Ratio in Callaway County
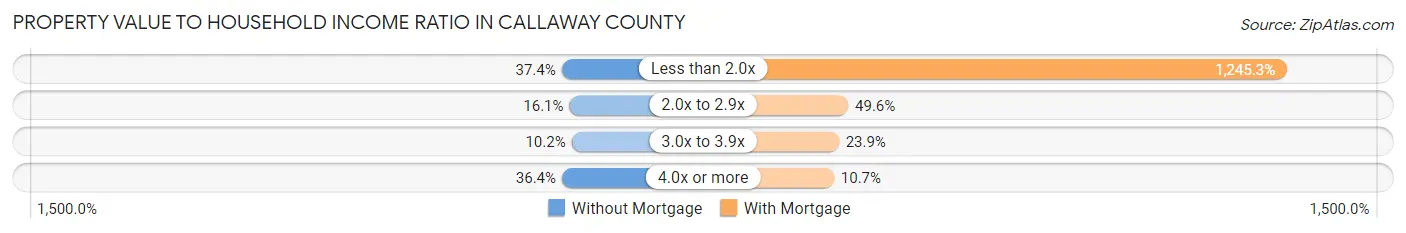
| Value-to-Income Ratio | Without Mortgage | With Mortgage |
| Less than 2.0x | 1,796 (37.3%) | 93,946 (1,245.3%) |
| 2.0x to 2.9x | 772 (16.1%) | 3,743 (49.6%) |
| 3.0x to 3.9x | 489 (10.2%) | 1,806 (23.9%) |
| 4.0x or more | 1,751 (36.4%) | 805 (10.7%) |
| Total | 4,808 (100.0%) | 7,544 (100.0%) |
Real Estate Taxes by Mortgage Status in Callaway County
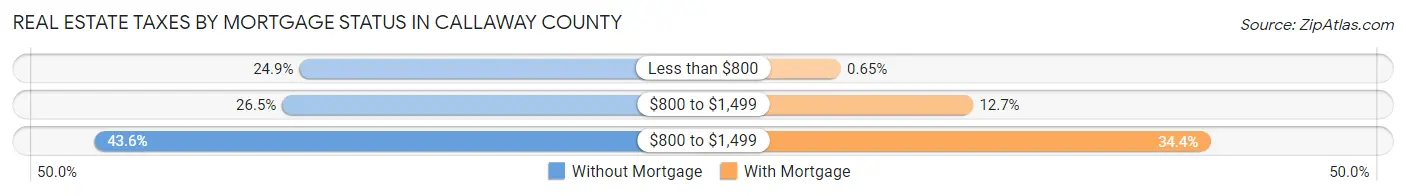
| Property Taxes | Without Mortgage | With Mortgage |
| Less than $800 | 1,198 (24.9%) | 49 (0.6%) |
| $800 to $1,499 | 1,273 (26.5%) | 960 (12.7%) |
| $800 to $1,499 | 2,098 (43.6%) | 2,598 (34.4%) |
| Total | 4,808 (100.0%) | 7,544 (100.0%) |
Health & Disability in Callaway County
Health Insurance Coverage by Age in Callaway County
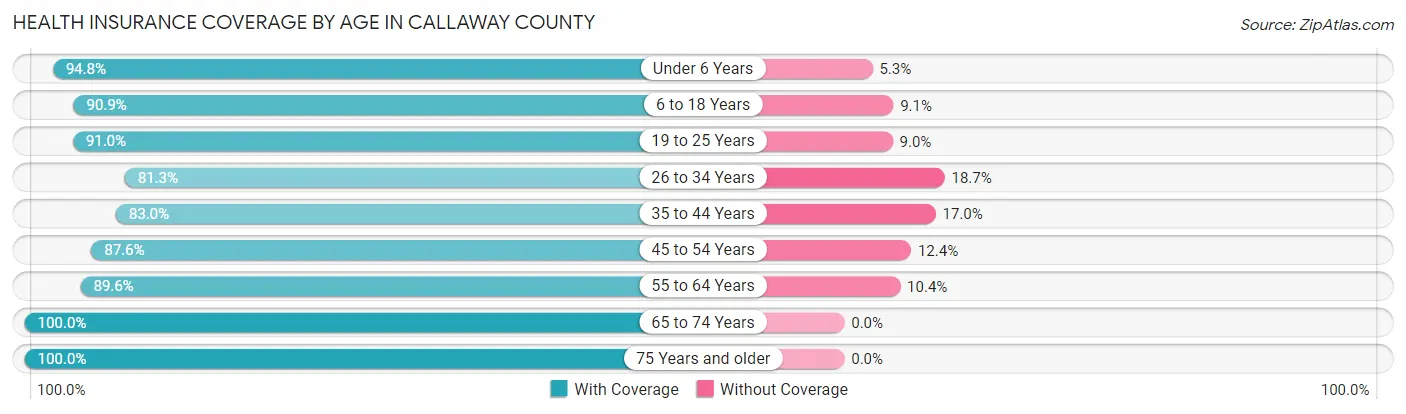
| Age Bracket | With Coverage | Without Coverage |
| Under 6 Years | 2,725 (94.8%) | 151 (5.2%) |
| 6 to 18 Years | 6,387 (90.9%) | 641 (9.1%) |
| 19 to 25 Years | 3,503 (91.0%) | 347 (9.0%) |
| 26 to 34 Years | 3,962 (81.3%) | 911 (18.7%) |
| 35 to 44 Years | 4,286 (83.0%) | 879 (17.0%) |
| 45 to 54 Years | 4,583 (87.6%) | 651 (12.4%) |
| 55 to 64 Years | 5,304 (89.6%) | 617 (10.4%) |
| 65 to 74 Years | 4,463 (100.0%) | 0 (0.0%) |
| 75 Years and older | 2,714 (100.0%) | 0 (0.0%) |
| Total | 37,927 (90.0%) | 4,197 (10.0%) |
Health Insurance Coverage by Citizenship Status in Callaway County
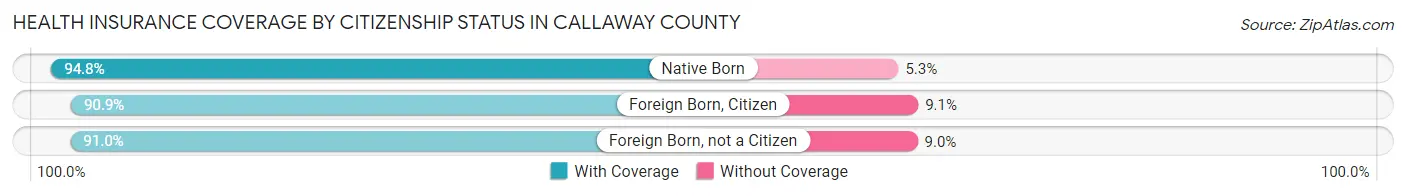
| Citizenship Status | With Coverage | Without Coverage |
| Native Born | 2,725 (94.8%) | 151 (5.2%) |
| Foreign Born, Citizen | 6,387 (90.9%) | 641 (9.1%) |
| Foreign Born, not a Citizen | 3,503 (91.0%) | 347 (9.0%) |
Health Insurance Coverage by Household Income in Callaway County
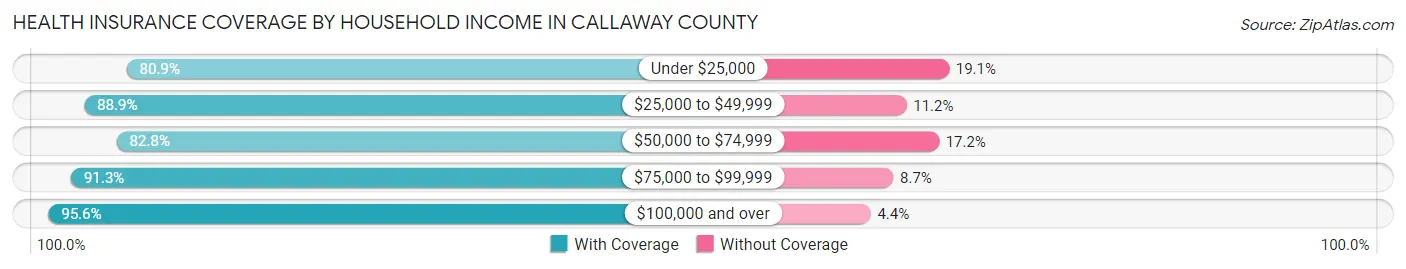
| Household Income | With Coverage | Without Coverage |
| Under $25,000 | 2,844 (80.9%) | 672 (19.1%) |
| $25,000 to $49,999 | 5,117 (88.8%) | 642 (11.2%) |
| $50,000 to $74,999 | 7,322 (82.8%) | 1,523 (17.2%) |
| $75,000 to $99,999 | 6,800 (91.3%) | 646 (8.7%) |
| $100,000 and over | 14,545 (95.6%) | 676 (4.4%) |
Public vs Private Health Insurance Coverage by Age in Callaway County
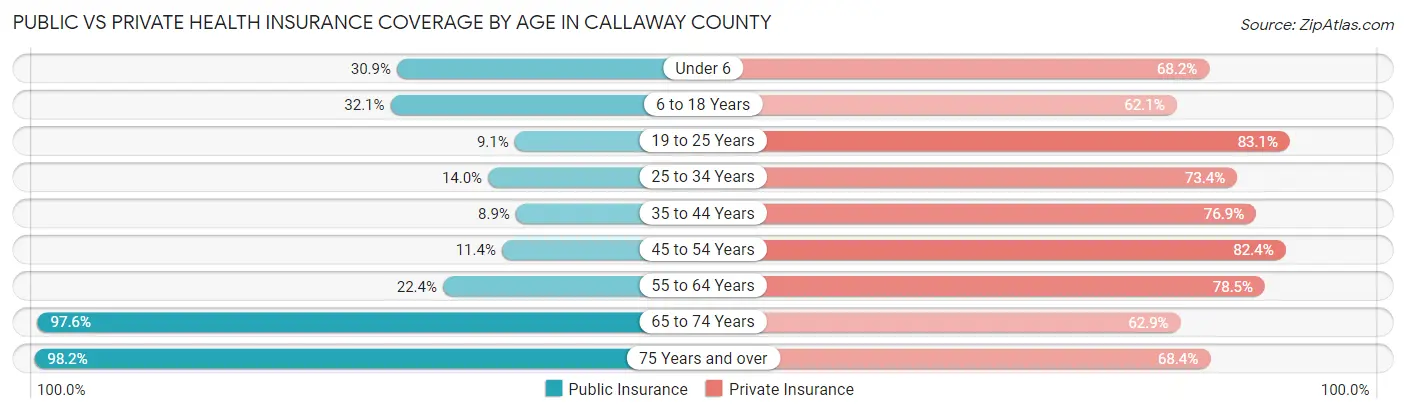
| Age Bracket | Public Insurance | Private Insurance |
| Under 6 | 889 (30.9%) | 1,961 (68.2%) |
| 6 to 18 Years | 2,257 (32.1%) | 4,366 (62.1%) |
| 19 to 25 Years | 349 (9.1%) | 3,201 (83.1%) |
| 25 to 34 Years | 682 (14.0%) | 3,575 (73.4%) |
| 35 to 44 Years | 457 (8.8%) | 3,971 (76.9%) |
| 45 to 54 Years | 599 (11.4%) | 4,310 (82.4%) |
| 55 to 64 Years | 1,325 (22.4%) | 4,649 (78.5%) |
| 65 to 74 Years | 4,355 (97.6%) | 2,805 (62.8%) |
| 75 Years and over | 2,665 (98.2%) | 1,855 (68.3%) |
| Total | 13,578 (32.2%) | 30,693 (72.9%) |
Disability Status by Sex by Age in Callaway County
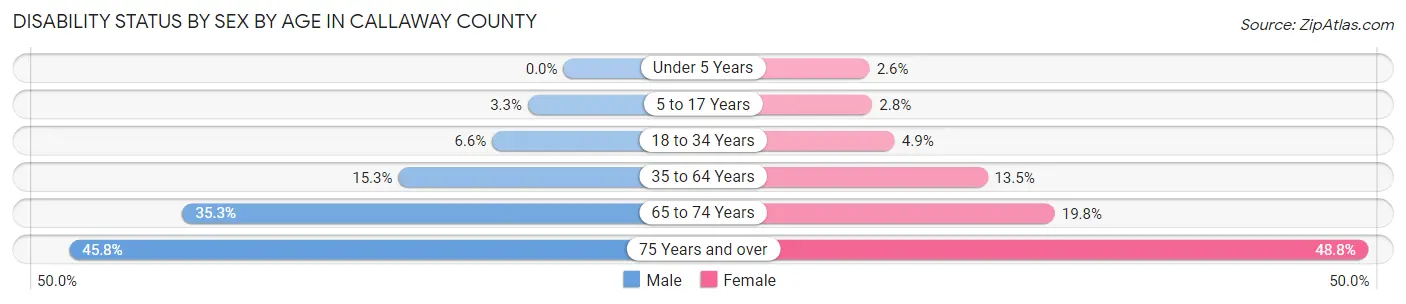
| Age Bracket | Male | Female |
| Under 5 Years | 0 (0.0%) | 28 (2.6%) |
| 5 to 17 Years | 115 (3.3%) | 93 (2.8%) |
| 18 to 34 Years | 307 (6.6%) | 237 (4.9%) |
| 35 to 64 Years | 1,243 (15.3%) | 1,109 (13.5%) |
| 65 to 74 Years | 785 (35.3%) | 443 (19.8%) |
| 75 Years and over | 545 (45.8%) | 744 (48.8%) |
Disability Class by Sex by Age in Callaway County
Disability Class: Hearing Difficulty
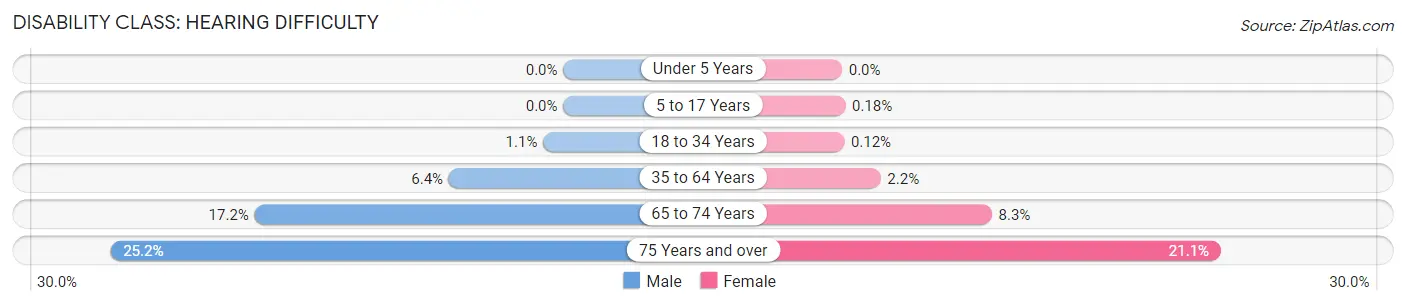
| Age Bracket | Male | Female |
| Under 5 Years | 0 (0.0%) | 0 (0.0%) |
| 5 to 17 Years | 0 (0.0%) | 6 (0.2%) |
| 18 to 34 Years | 52 (1.1%) | 6 (0.1%) |
| 35 to 64 Years | 517 (6.4%) | 176 (2.1%) |
| 65 to 74 Years | 382 (17.2%) | 187 (8.3%) |
| 75 Years and over | 300 (25.2%) | 322 (21.1%) |
Disability Class: Vision Difficulty
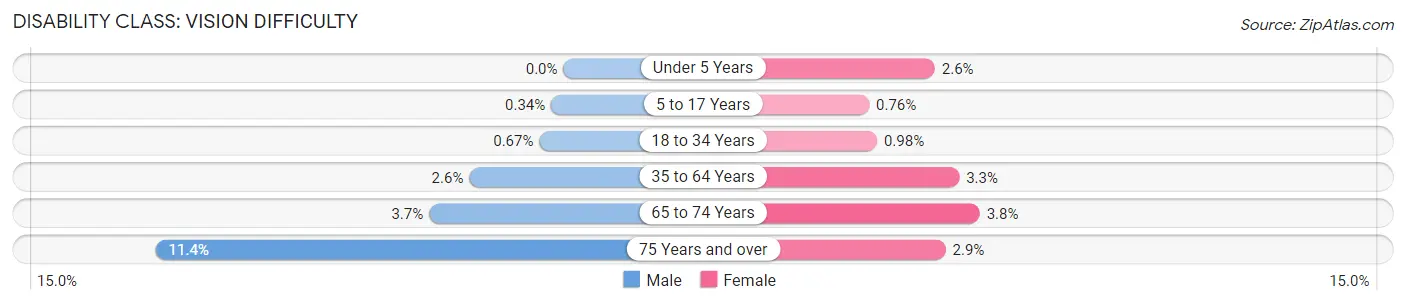
| Age Bracket | Male | Female |
| Under 5 Years | 0 (0.0%) | 28 (2.6%) |
| 5 to 17 Years | 12 (0.3%) | 25 (0.8%) |
| 18 to 34 Years | 31 (0.7%) | 47 (1.0%) |
| 35 to 64 Years | 213 (2.6%) | 268 (3.3%) |
| 65 to 74 Years | 83 (3.7%) | 86 (3.8%) |
| 75 Years and over | 135 (11.4%) | 44 (2.9%) |
Disability Class: Cognitive Difficulty
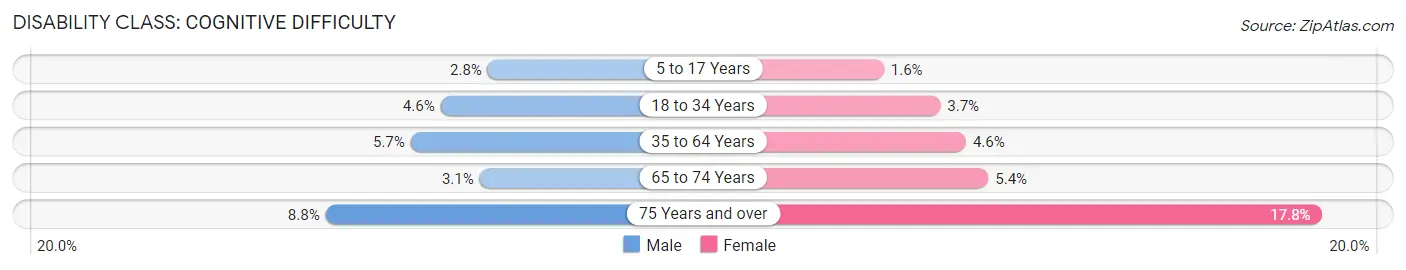
| Age Bracket | Male | Female |
| 5 to 17 Years | 98 (2.8%) | 51 (1.6%) |
| 18 to 34 Years | 212 (4.6%) | 176 (3.7%) |
| 35 to 64 Years | 460 (5.7%) | 378 (4.6%) |
| 65 to 74 Years | 69 (3.1%) | 122 (5.4%) |
| 75 Years and over | 105 (8.8%) | 272 (17.8%) |
Disability Class: Ambulatory Difficulty
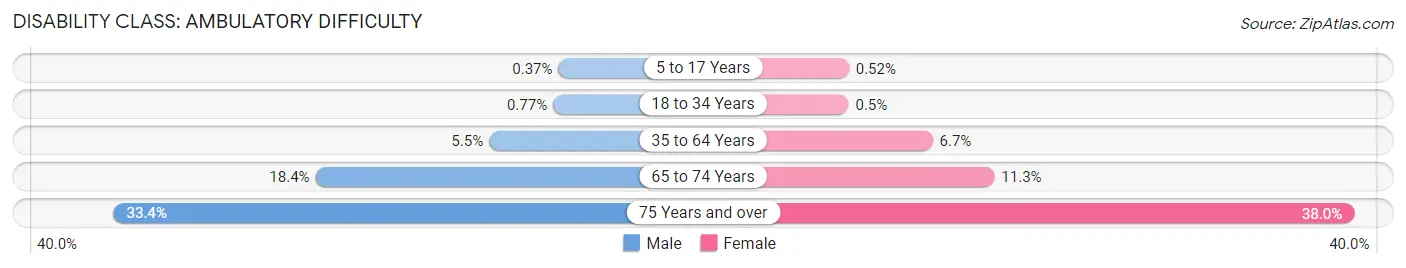
| Age Bracket | Male | Female |
| 5 to 17 Years | 13 (0.4%) | 17 (0.5%) |
| 18 to 34 Years | 36 (0.8%) | 24 (0.5%) |
| 35 to 64 Years | 448 (5.5%) | 553 (6.7%) |
| 65 to 74 Years | 409 (18.4%) | 254 (11.3%) |
| 75 Years and over | 397 (33.4%) | 580 (38.0%) |
Disability Class: Self-Care Difficulty
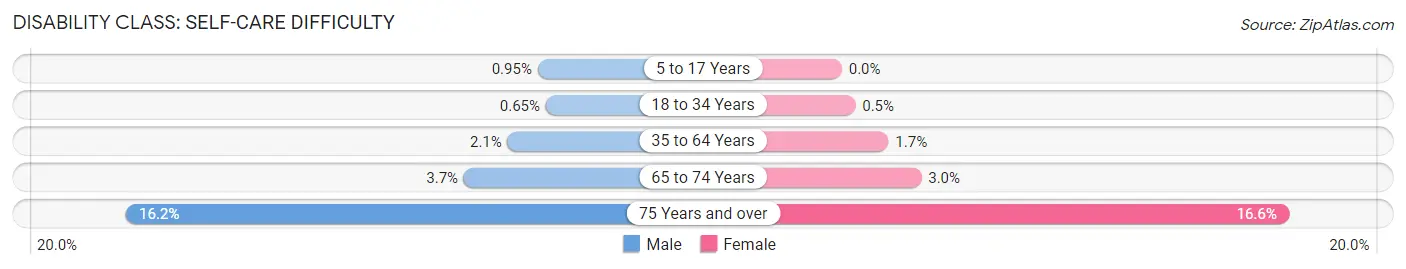
| Age Bracket | Male | Female |
| 5 to 17 Years | 33 (0.9%) | 0 (0.0%) |
| 18 to 34 Years | 30 (0.6%) | 24 (0.5%) |
| 35 to 64 Years | 168 (2.1%) | 142 (1.7%) |
| 65 to 74 Years | 82 (3.7%) | 66 (2.9%) |
| 75 Years and over | 193 (16.2%) | 253 (16.6%) |
Technology Access in Callaway County
Computing Device Access in Callaway County
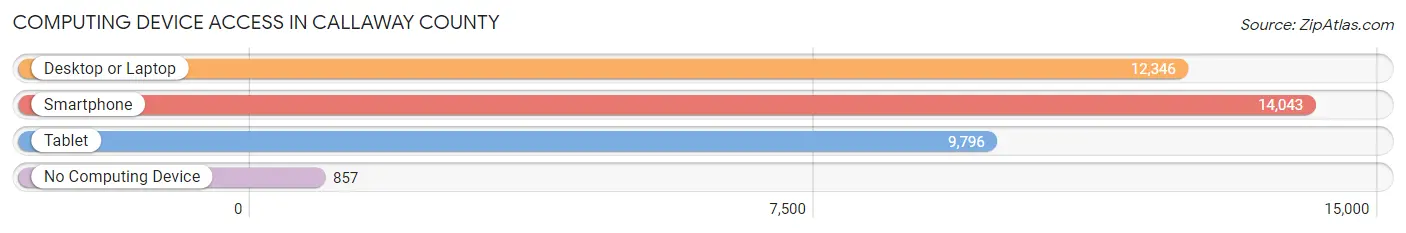
| Device Type | # Households | % Households |
| Desktop or Laptop | 12,346 | 77.2% |
| Smartphone | 14,043 | 87.9% |
| Tablet | 9,796 | 61.3% |
| No Computing Device | 857 | 5.4% |
| Total | 15,981 | 100.0% |
Internet Access in Callaway County
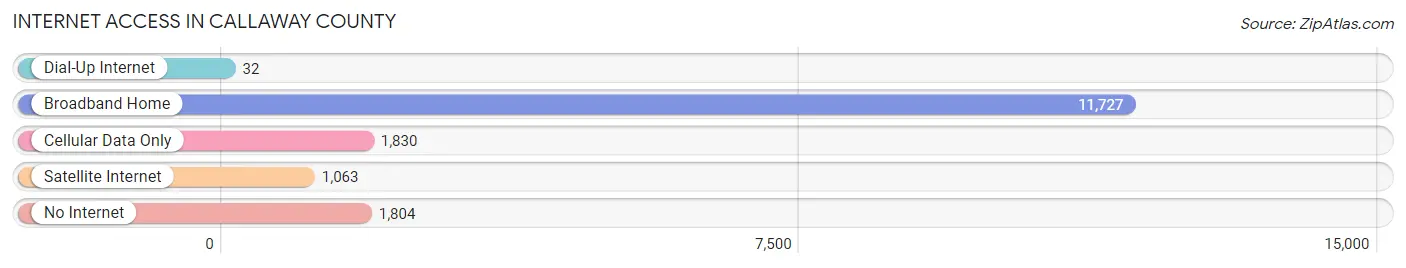
| Internet Type | # Households | % Households |
| Dial-Up Internet | 32 | 0.2% |
| Broadband Home | 11,727 | 73.4% |
| Cellular Data Only | 1,830 | 11.5% |
| Satellite Internet | 1,063 | 6.7% |
| No Internet | 1,804 | 11.3% |
| Total | 15,981 | 100.0% |
Callaway County Summary
Callaway County is located in the central part of Missouri, and is part of the Columbia, Missouri Metropolitan Statistical Area. The county was established in 1820 and named after Captain James Callaway, a Revolutionary War veteran. As of the 2010 census, the population was 44,332.
Geography
Callaway County is located in the central part of Missouri, and is bordered by Audrain County to the north, Montgomery County to the east, Boone County to the south, and Cole County to the west. The county covers an area of 576 square miles, with the majority of the land being used for agricultural purposes. The county is home to several small towns, including Fulton, Holts Summit, and New Bloomfield. The county seat is Fulton, which is also the largest city in the county.
The county is located in the Ozark Plateau region of Missouri, and is characterized by rolling hills and valleys. The county is home to several rivers and streams, including the Osage River, the Auxvasse Creek, and the Lamine River. The county is also home to several state parks, including the Mark Twain State Park, the Finger Lakes State Park, and the Rock Bridge Memorial State Park.
Economy
The economy of Callaway County is largely based on agriculture. The county is home to several large farms, and is a major producer of corn, soybeans, wheat, and hay. The county is also home to several manufacturing companies, including the Callaway Nuclear Power Plant, which is the largest nuclear power plant in the state. Other major employers in the county include the University of Missouri, the Fulton State Hospital, and the Fulton Medical Center.
Demographics
As of the 2010 census, the population of Callaway County was 44,332. The population is made up of a diverse mix of races and ethnicities, with the largest group being White (87.3%), followed by African American (7.2%), Hispanic (2.2%), and Asian (1.2%). The median household income in the county is $45,845, and the median home value is $133,400.
The county is home to several educational institutions, including the University of Missouri, William Woods University, and Westminster College. The county is also home to several religious institutions, including the First Presbyterian Church of Fulton, the First Baptist Church of Fulton, and the Church of Jesus Christ of Latter-day Saints.
Conclusion
Callaway County is a rural county located in the central part of Missouri. The county is home to several small towns, and is largely agricultural in nature. The population of the county is diverse, and the median household income is slightly above the state average. The county is home to several educational and religious institutions, and is a major producer of corn, soybeans, wheat, and hay.
Common Questions
What is Per Capita Income in Callaway County?
Per Capita income in Callaway County is $31,874.
What is the Median Family Income in Callaway County?
Median Family Income in Callaway County is $83,245.
What is the Median Household income in Callaway County?
Median Household Income in Callaway County is $70,599.
What is Income or Wage Gap in Callaway County?
Income or Wage Gap in Callaway County is 20.8%.
Women in Callaway County earn 79.2 cents for every dollar earned by a man.
What is Family Income Deficit in Callaway County?
Family Income Deficit in Callaway County is $8,616.
Families that are below poverty line in Callaway County earn $8,616 less on average than the poverty threshold level.
What is Inequality or Gini Index in Callaway County?
Inequality or Gini Index in Callaway County is 0.40.
What is the Total Population of Callaway County?
Total Population of Callaway County is 44,517.
What is the Total Male Population of Callaway County?
Total Male Population of Callaway County is 23,158.
What is the Total Female Population of Callaway County?
Total Female Population of Callaway County is 21,359.
What is the Ratio of Males per 100 Females in Callaway County?
There are 108.42 Males per 100 Females in Callaway County.
What is the Ratio of Females per 100 Males in Callaway County?
There are 92.23 Females per 100 Males in Callaway County.
What is the Median Population Age in Callaway County?
Median Population Age in Callaway County is 39.6 Years.
What is the Average Family Size in Callaway County
Average Family Size in Callaway County is 3.1 People.
What is the Average Household Size in Callaway County
Average Household Size in Callaway County is 2.5 People.
How Large is the Labor Force in Callaway County?
There are 21,746 People in the Labor Forcein in Callaway County.
What is the Percentage of People in the Labor Force in Callaway County?
59.7% of People are in the Labor Force in Callaway County.
What is the Unemployment Rate in Callaway County?
Unemployment Rate in Callaway County is 5.2%.