Boone County, MO Map & Demographics
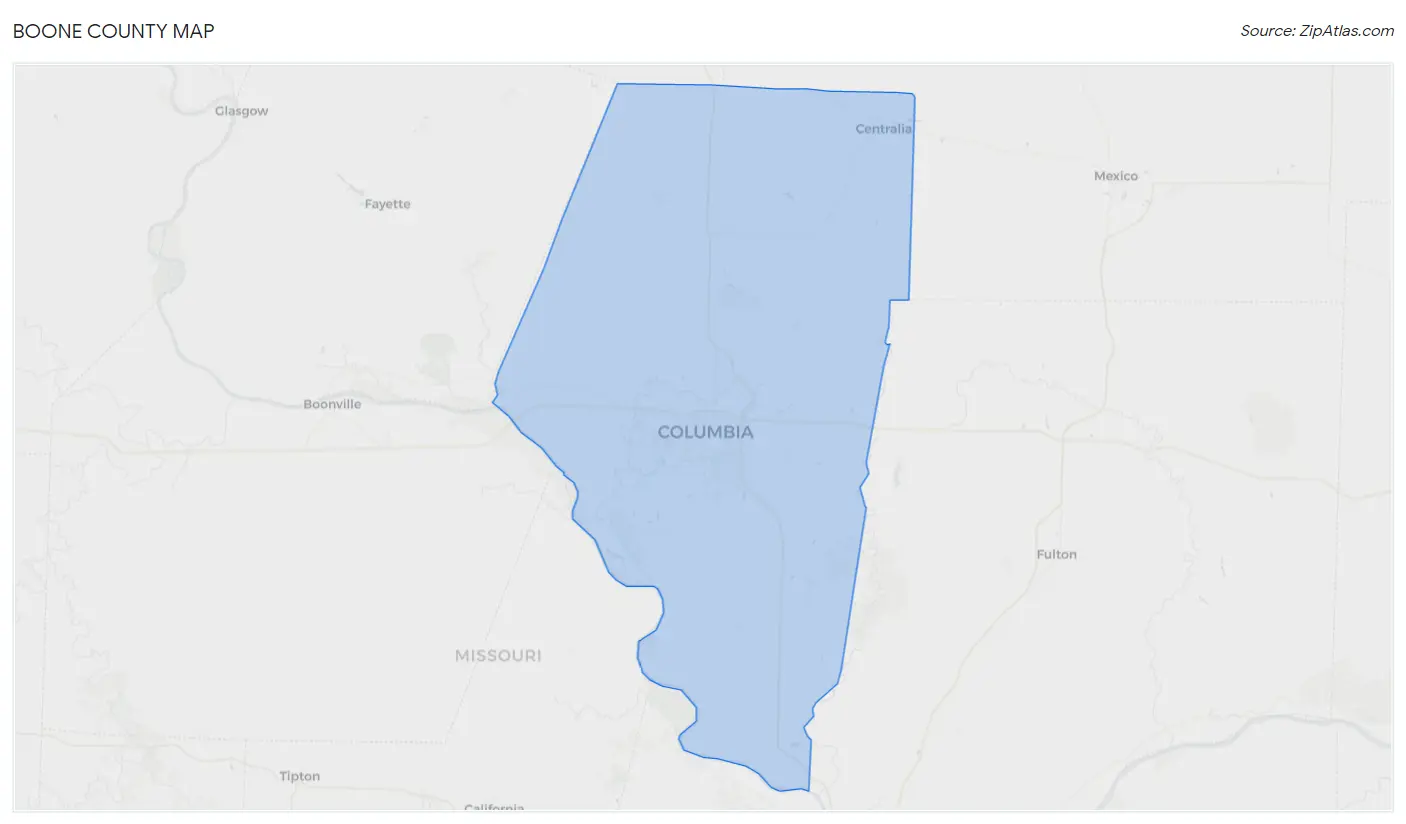
Boone County Map
Boone County Overview
$37,393
PER CAPITA INCOME
$96,219
AVG FAMILY INCOME
$66,564
AVG HOUSEHOLD INCOME
22.4%
WAGE / INCOME GAP [ % ]
77.6¢/ $1
WAGE / INCOME GAP [ $ ]
$9,415
FAMILY INCOME DEFICIT
0.48
INEQUALITY / GINI INDEX
184,043
TOTAL POPULATION
89,484
MALE POPULATION
94,559
FEMALE POPULATION
94.63
MALES / 100 FEMALES
105.67
FEMALES / 100 MALES
31.8
MEDIAN AGE
3.0
AVG FAMILY SIZE
2.4
AVG HOUSEHOLD SIZE
100,984
LABOR FORCE [ PEOPLE ]
66.7%
PERCENT IN LABOR FORCE
3.9%
UNEMPLOYMENT RATE
Boone County Area Codes
Income in Boone County
Income Overview in Boone County
Per Capita Income in Boone County is $37,393, while median incomes of families and households are $96,219 and $66,564 respectively.
| Characteristic | Number | Measure |
| Per Capita Income | 184,043 | $37,393 |
| Median Family Income | 41,225 | $96,219 |
| Mean Family Income | 41,225 | $120,826 |
| Median Household Income | 74,269 | $66,564 |
| Mean Household Income | 74,269 | $91,044 |
| Income Deficit | 41,225 | $9,415 |
| Wage / Income Gap (%) | 184,043 | 22.38% |
| Wage / Income Gap ($) | 184,043 | 77.62¢ per $1 |
| Gini / Inequality Index | 184,043 | 0.48 |
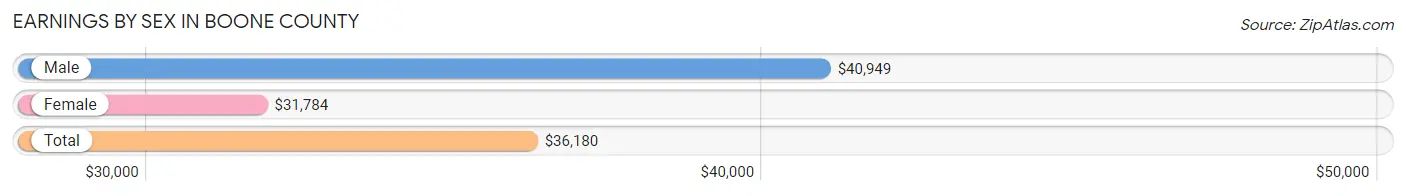
Earnings by Sex in Boone County
Average Earnings in Boone County are $36,180, $40,949 for men and $31,784 for women, a difference of 22.4%.
| Sex | Number | Average Earnings |
| Male | 55,459 (50.5%) | $40,949 |
| Female | 54,249 (49.4%) | $31,784 |
| Total | 109,708 (100.0%) | $36,180 |
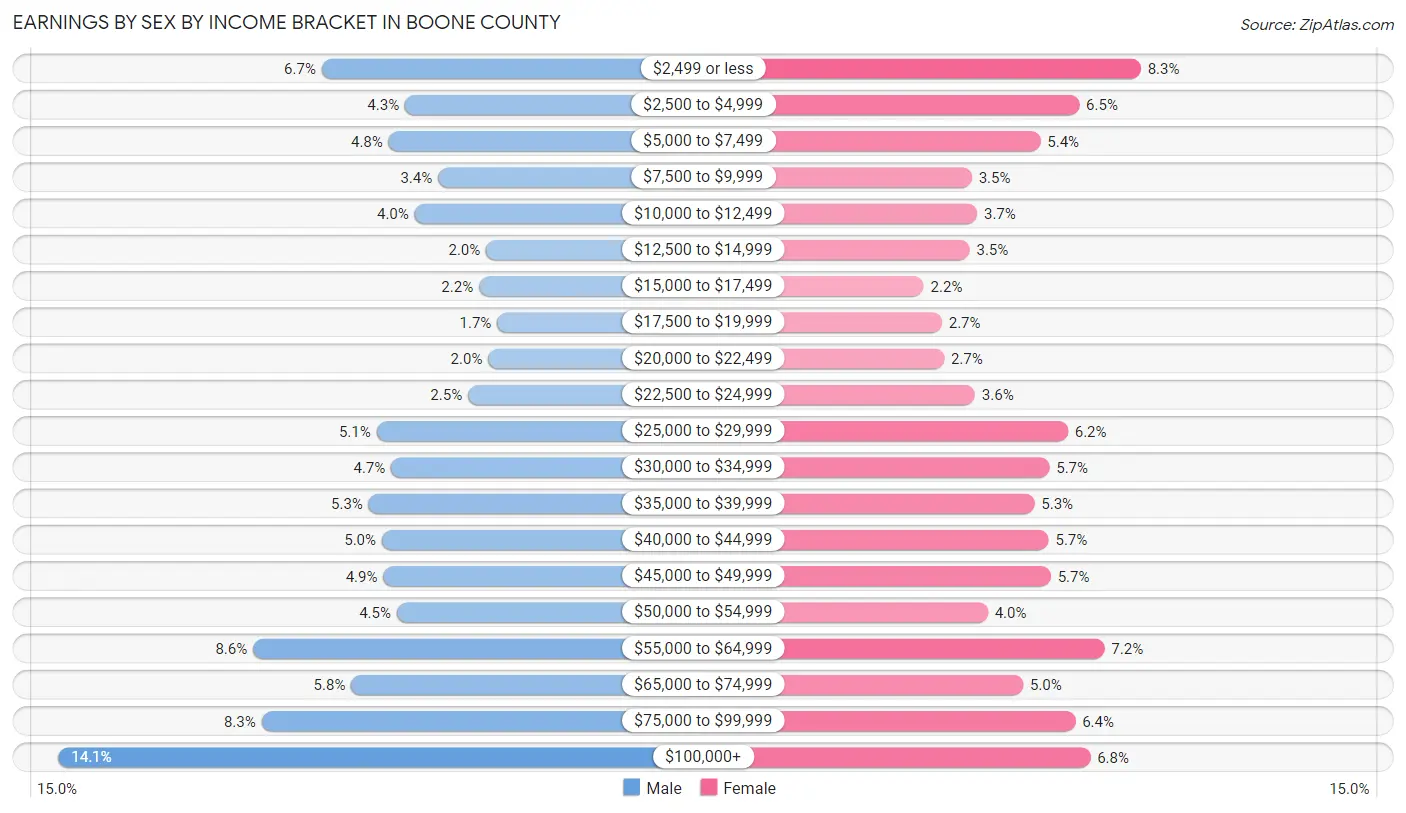
Earnings by Sex by Income Bracket in Boone County
The most common earnings brackets in Boone County are $100,000+ for men (7,793 | 14.1%) and $2,499 or less for women (4,482 | 8.3%).
| Income | Male | Female |
| $2,499 or less | 3,690 (6.7%) | 4,482 (8.3%) |
| $2,500 to $4,999 | 2,392 (4.3%) | 3,544 (6.5%) |
| $5,000 to $7,499 | 2,646 (4.8%) | 2,953 (5.4%) |
| $7,500 to $9,999 | 1,872 (3.4%) | 1,904 (3.5%) |
| $10,000 to $12,499 | 2,238 (4.0%) | 1,985 (3.7%) |
| $12,500 to $14,999 | 1,127 (2.0%) | 1,873 (3.5%) |
| $15,000 to $17,499 | 1,238 (2.2%) | 1,172 (2.2%) |
| $17,500 to $19,999 | 954 (1.7%) | 1,448 (2.7%) |
| $20,000 to $22,499 | 1,095 (2.0%) | 1,479 (2.7%) |
| $22,500 to $24,999 | 1,411 (2.5%) | 1,953 (3.6%) |
| $25,000 to $29,999 | 2,832 (5.1%) | 3,369 (6.2%) |
| $30,000 to $34,999 | 2,608 (4.7%) | 3,089 (5.7%) |
| $35,000 to $39,999 | 2,954 (5.3%) | 2,859 (5.3%) |
| $40,000 to $44,999 | 2,749 (5.0%) | 3,074 (5.7%) |
| $45,000 to $49,999 | 2,726 (4.9%) | 3,107 (5.7%) |
| $50,000 to $54,999 | 2,519 (4.5%) | 2,149 (4.0%) |
| $55,000 to $64,999 | 4,759 (8.6%) | 3,930 (7.2%) |
| $65,000 to $74,999 | 3,228 (5.8%) | 2,684 (5.0%) |
| $75,000 to $99,999 | 4,628 (8.3%) | 3,485 (6.4%) |
| $100,000+ | 7,793 (14.1%) | 3,710 (6.8%) |
| Total | 55,459 (100.0%) | 54,249 (100.0%) |
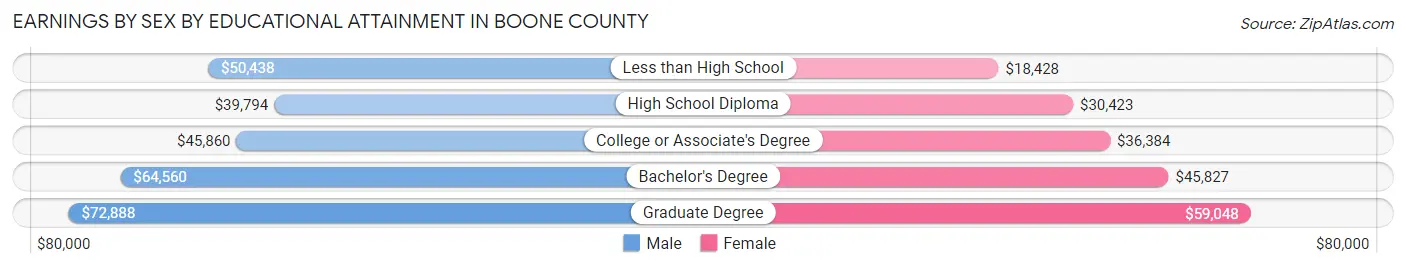
Earnings by Sex by Educational Attainment in Boone County
Average earnings in Boone County are $53,937 for men and $43,038 for women, a difference of 20.2%. Men with an educational attainment of graduate degree enjoy the highest average annual earnings of $72,888, while those with high school diploma education earn the least with $39,794. Women with an educational attainment of graduate degree earn the most with the average annual earnings of $59,048, while those with less than high school education have the smallest earnings of $18,428.
| Educational Attainment | Male Income | Female Income |
| Less than High School | $50,438 | $18,428 |
| High School Diploma | $39,794 | $30,423 |
| College or Associate's Degree | $45,860 | $36,384 |
| Bachelor's Degree | $64,560 | $45,827 |
| Graduate Degree | $72,888 | $59,048 |
| Total | $53,937 | $43,038 |
Family Income in Boone County
Family Income Brackets in Boone County
According to the Boone County family income data, there are 9,688 families falling into the $100,000 to $149,999 income range, which is the most common income bracket and makes up 23.5% of all families. Conversely, the less than $10,000 income bracket is the least frequent group with only 824 families (2.0%) belonging to this category.
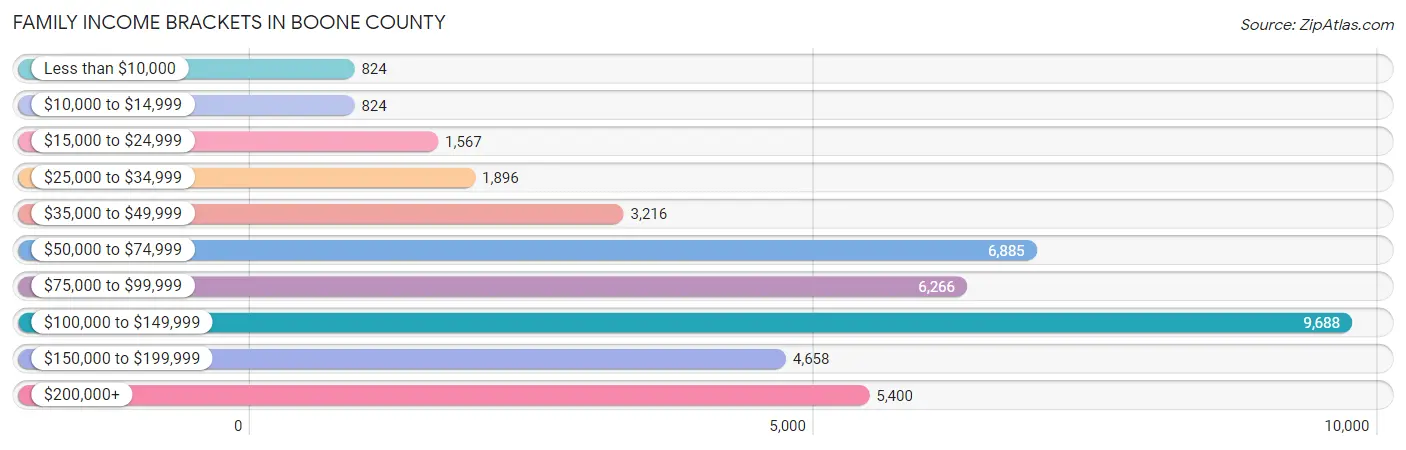
| Income Bracket | # Families | % Families |
| Less than $10,000 | 824 | 2.0% |
| $10,000 to $14,999 | 824 | 2.0% |
| $15,000 to $24,999 | 1,567 | 3.8% |
| $25,000 to $34,999 | 1,896 | 4.6% |
| $35,000 to $49,999 | 3,216 | 7.8% |
| $50,000 to $74,999 | 6,885 | 16.7% |
| $75,000 to $99,999 | 6,266 | 15.2% |
| $100,000 to $149,999 | 9,688 | 23.5% |
| $150,000 to $199,999 | 4,658 | 11.3% |
| $200,000+ | 5,400 | 13.1% |
Family Income by Famaliy Size in Boone County
4-person families (7,321 | 17.8%) account for the highest median family income in Boone County with $116,195 per family, while 2-person families (20,623 | 50.0%) have the highest median income of $41,502 per family member.
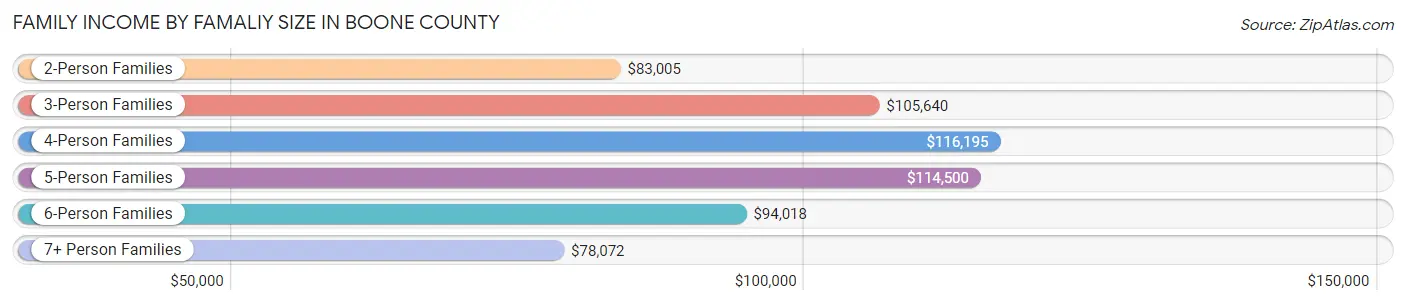
| Income Bracket | # Families | Median Income |
| 2-Person Families | 20,623 (50.0%) | $83,005 |
| 3-Person Families | 8,862 (21.5%) | $105,640 |
| 4-Person Families | 7,321 (17.8%) | $116,195 |
| 5-Person Families | 3,080 (7.5%) | $114,500 |
| 6-Person Families | 900 (2.2%) | $94,018 |
| 7+ Person Families | 439 (1.1%) | $78,072 |
| Total | 41,225 (100.0%) | $96,219 |
Family Income by Number of Earners in Boone County
The median family income in Boone County is $96,219, with families comprising 3+ earners (4,248) having the highest median family income of $140,022, while families with 1 earner (11,548) have the lowest median family income of $64,150, accounting for 10.3% and 28.0% of families, respectively.
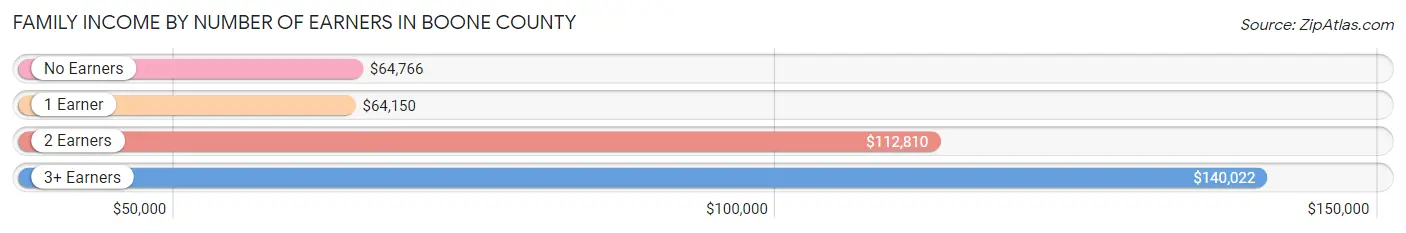
| Number of Earners | # Families | Median Income |
| No Earners | 5,346 (13.0%) | $64,766 |
| 1 Earner | 11,548 (28.0%) | $64,150 |
| 2 Earners | 20,083 (48.7%) | $112,810 |
| 3+ Earners | 4,248 (10.3%) | $140,022 |
| Total | 41,225 (100.0%) | $96,219 |
Household Income in Boone County
Household Income Brackets in Boone County
With 13,220 households falling in the category, the $50,000 to $74,999 income range is the most frequent in Boone County, accounting for 17.8% of all households. In contrast, only 3,491 households (4.7%) fall into the $10,000 to $14,999 income bracket, making it the least populous group.
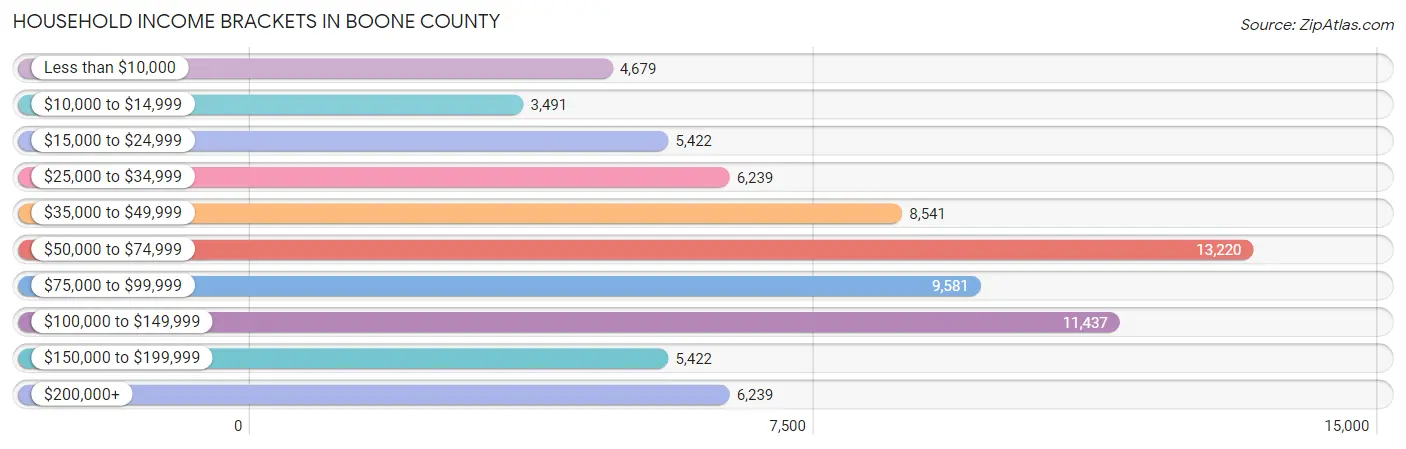
| Income Bracket | # Households | % Households |
| Less than $10,000 | 4,679 | 6.3% |
| $10,000 to $14,999 | 3,491 | 4.7% |
| $15,000 to $24,999 | 5,422 | 7.3% |
| $25,000 to $34,999 | 6,239 | 8.4% |
| $35,000 to $49,999 | 8,541 | 11.5% |
| $50,000 to $74,999 | 13,220 | 17.8% |
| $75,000 to $99,999 | 9,581 | 12.9% |
| $100,000 to $149,999 | 11,437 | 15.4% |
| $150,000 to $199,999 | 5,422 | 7.3% |
| $200,000+ | 6,239 | 8.4% |
Household Income by Householder Age in Boone County
The median household income in Boone County is $66,564, with the highest median household income of $91,696 found in the 45 to 64 years age bracket for the primary householder. A total of 22,405 households (30.2%) fall into this category. Meanwhile, the 15 to 24 years age bracket for the primary householder has the lowest median household income of $25,154, with 9,318 households (12.6%) in this group.
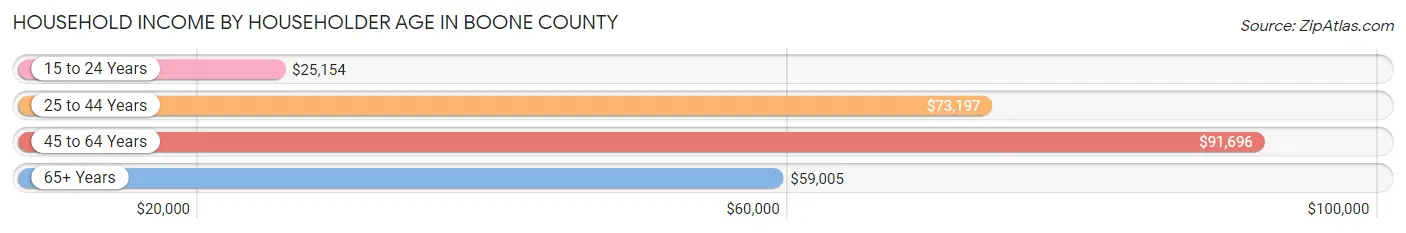
| Income Bracket | # Households | Median Income |
| 15 to 24 Years | 9,318 (12.6%) | $25,154 |
| 25 to 44 Years | 27,366 (36.8%) | $73,197 |
| 45 to 64 Years | 22,405 (30.2%) | $91,696 |
| 65+ Years | 15,180 (20.4%) | $59,005 |
| Total | 74,269 (100.0%) | $66,564 |
Poverty in Boone County
Income Below Poverty by Sex and Age in Boone County
With 16.3% poverty level for males and 19.3% for females among the residents of Boone County, 18 to 24 year old males and 18 to 24 year old females are the most vulnerable to poverty, with 6,497 males (48.2%) and 8,399 females (57.1%) in their respective age groups living below the poverty level.
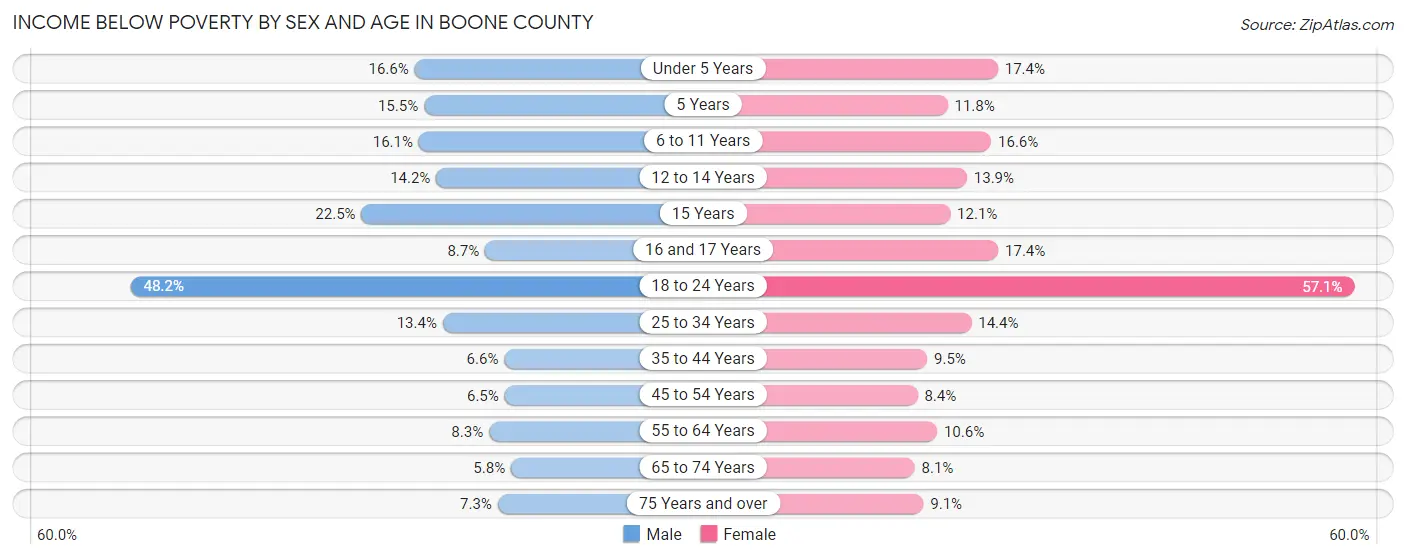
| Age Bracket | Male | Female |
| Under 5 Years | 817 (16.6%) | 833 (17.4%) |
| 5 Years | 173 (15.5%) | 122 (11.8%) |
| 6 to 11 Years | 1,050 (16.1%) | 999 (16.6%) |
| 12 to 14 Years | 424 (14.2%) | 400 (13.9%) |
| 15 Years | 235 (22.5%) | 92 (12.1%) |
| 16 and 17 Years | 188 (8.7%) | 366 (17.4%) |
| 18 to 24 Years | 6,497 (48.2%) | 8,399 (57.1%) |
| 25 to 34 Years | 1,782 (13.4%) | 1,941 (14.4%) |
| 35 to 44 Years | 731 (6.6%) | 1,069 (9.5%) |
| 45 to 54 Years | 599 (6.5%) | 787 (8.4%) |
| 55 to 64 Years | 768 (8.3%) | 1,064 (10.6%) |
| 65 to 74 Years | 399 (5.8%) | 614 (8.1%) |
| 75 Years and over | 259 (7.3%) | 466 (9.1%) |
| Total | 13,922 (16.3%) | 17,152 (19.3%) |
Income Above Poverty by Sex and Age in Boone County
According to the poverty statistics in Boone County, males aged 65 to 74 years and females aged 65 to 74 years are the age groups that are most secure financially, with 94.2% of males and 91.9% of females in these age groups living above the poverty line.
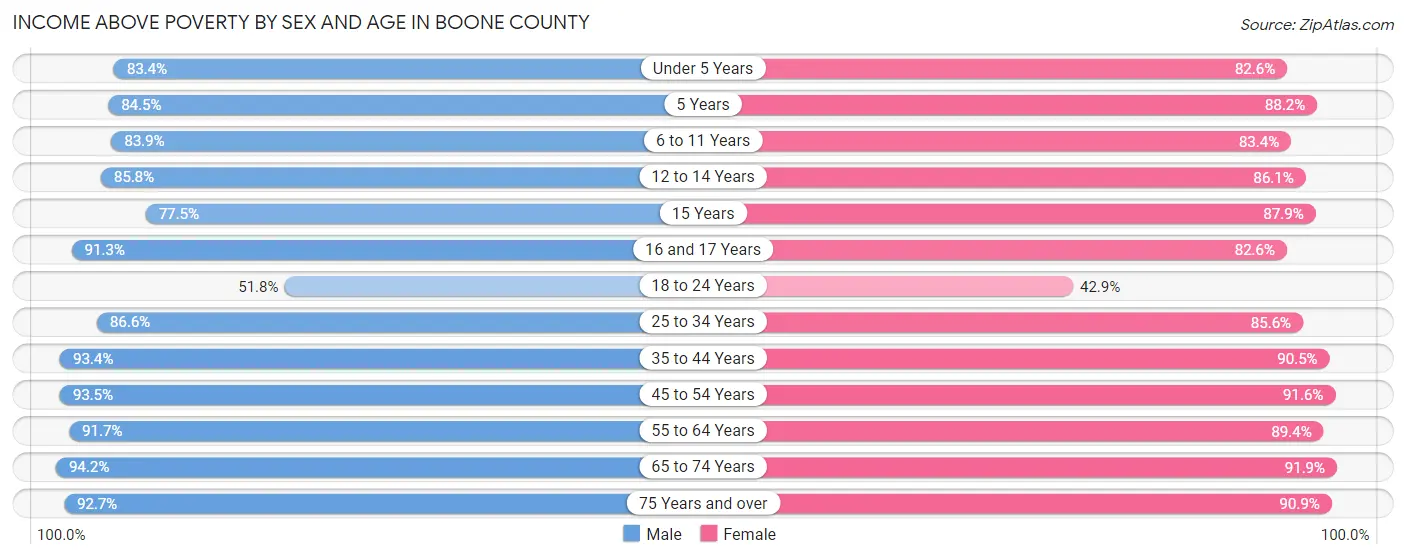
| Age Bracket | Male | Female |
| Under 5 Years | 4,115 (83.4%) | 3,964 (82.6%) |
| 5 Years | 942 (84.5%) | 914 (88.2%) |
| 6 to 11 Years | 5,471 (83.9%) | 5,009 (83.4%) |
| 12 to 14 Years | 2,571 (85.8%) | 2,471 (86.1%) |
| 15 Years | 810 (77.5%) | 670 (87.9%) |
| 16 and 17 Years | 1,967 (91.3%) | 1,736 (82.6%) |
| 18 to 24 Years | 6,981 (51.8%) | 6,318 (42.9%) |
| 25 to 34 Years | 11,487 (86.6%) | 11,522 (85.6%) |
| 35 to 44 Years | 10,386 (93.4%) | 10,186 (90.5%) |
| 45 to 54 Years | 8,564 (93.5%) | 8,550 (91.6%) |
| 55 to 64 Years | 8,508 (91.7%) | 8,972 (89.4%) |
| 65 to 74 Years | 6,449 (94.2%) | 6,958 (91.9%) |
| 75 Years and over | 3,284 (92.7%) | 4,666 (90.9%) |
| Total | 71,535 (83.7%) | 71,936 (80.7%) |
Income Below Poverty Among Married-Couple Families in Boone County
The poverty statistics for married-couple families in Boone County show that 3.0% or 974 of the total 32,271 families live below the poverty line. Families with 5 or more children have the highest poverty rate of 42.0%, comprising of 124 families. On the other hand, families with 1 or 2 children have the lowest poverty rate of 1.9%, which includes 210 families.
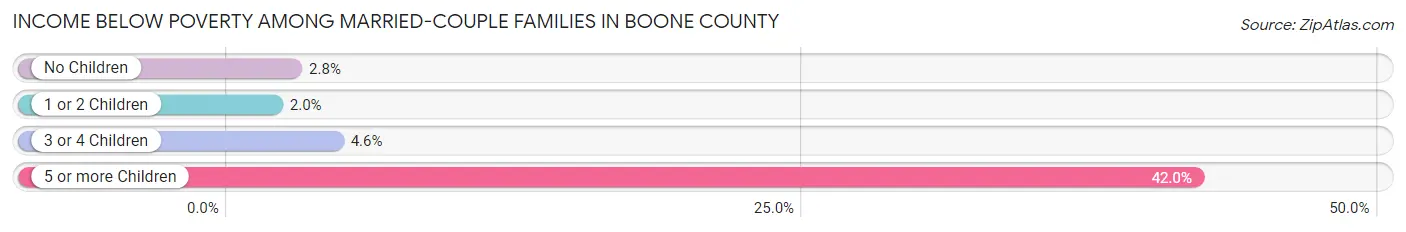
| Children | Above Poverty | Below Poverty |
| No Children | 18,005 (97.2%) | 516 (2.8%) |
| 1 or 2 Children | 10,548 (98.1%) | 210 (1.9%) |
| 3 or 4 Children | 2,573 (95.4%) | 124 (4.6%) |
| 5 or more Children | 171 (58.0%) | 124 (42.0%) |
| Total | 31,297 (97.0%) | 974 (3.0%) |
Income Below Poverty Among Single-Parent Households in Boone County
According to the poverty data in Boone County, 14.5% or 351 single-father households and 26.7% or 1,743 single-mother households are living below the poverty line. Among single-father households, those with 5 or more children have the highest poverty rate, with 28 households (100.0%) experiencing poverty. Likewise, among single-mother households, those with 5 or more children have the highest poverty rate, with 131 households (92.9%) falling below the poverty line.
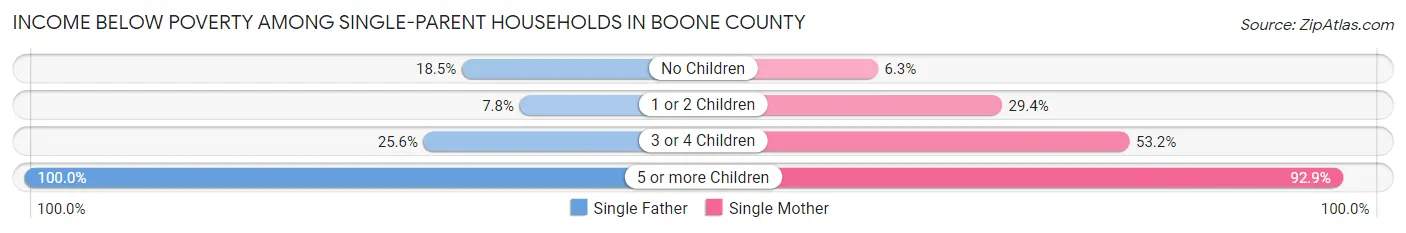
| Children | Single Father | Single Mother |
| No Children | 188 (18.5%) | 124 (6.3%) |
| 1 or 2 Children | 95 (7.8%) | 1,067 (29.4%) |
| 3 or 4 Children | 40 (25.6%) | 421 (53.2%) |
| 5 or more Children | 28 (100.0%) | 131 (92.9%) |
| Total | 351 (14.5%) | 1,743 (26.7%) |
Income Below Poverty Among Married-Couple vs Single-Parent Households in Boone County
The poverty data for Boone County shows that 974 of the married-couple family households (3.0%) and 2,094 of the single-parent households (23.4%) are living below the poverty level. Within the married-couple family households, those with 5 or more children have the highest poverty rate, with 124 households (42.0%) falling below the poverty line. Among the single-parent households, those with 5 or more children have the highest poverty rate, with 159 household (94.1%) living below poverty.
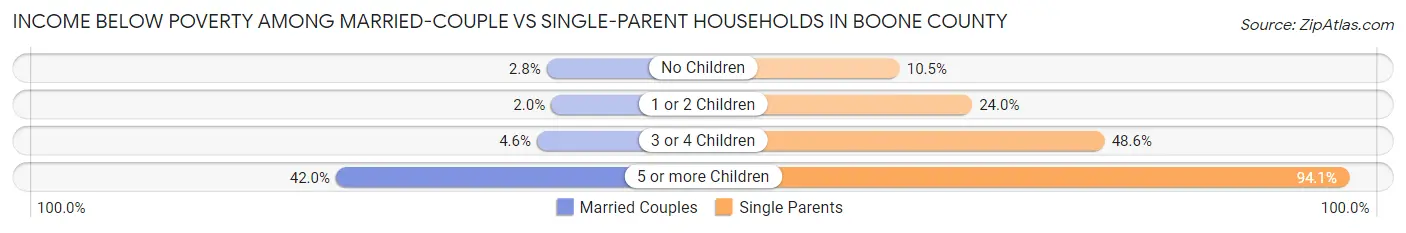
| Children | Married-Couple Families | Single-Parent Households |
| No Children | 516 (2.8%) | 312 (10.4%) |
| 1 or 2 Children | 210 (1.9%) | 1,162 (23.9%) |
| 3 or 4 Children | 124 (4.6%) | 461 (48.6%) |
| 5 or more Children | 124 (42.0%) | 159 (94.1%) |
| Total | 974 (3.0%) | 2,094 (23.4%) |
Race in Boone County
The most populous races in Boone County are White / Caucasian (145,293 | 78.9%), Black / African American (17,075 | 9.3%), and Two or more Races (10,250 | 5.6%).
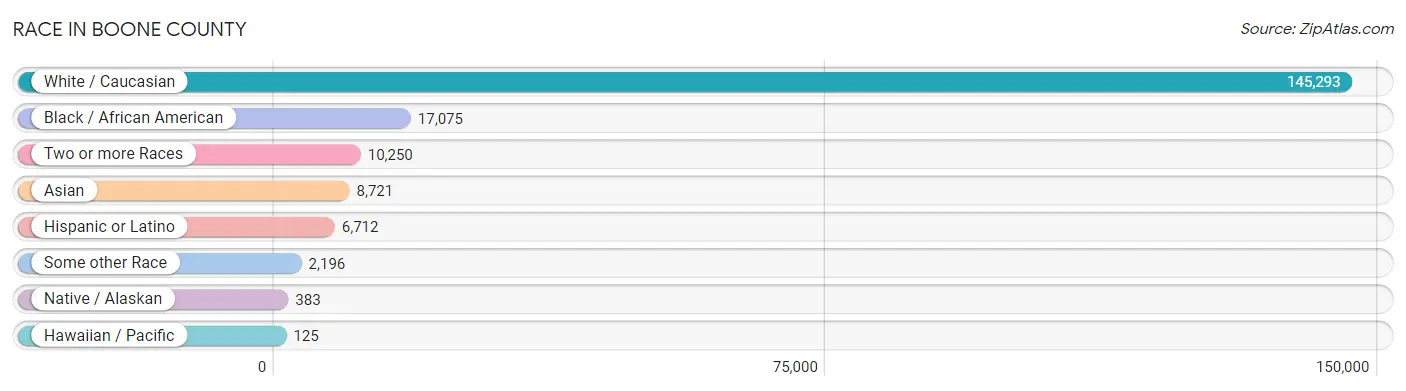
| Race | # Population | % Population |
| Asian | 8,721 | 4.7% |
| Black / African American | 17,075 | 9.3% |
| Hawaiian / Pacific | 125 | 0.1% |
| Hispanic or Latino | 6,712 | 3.6% |
| Native / Alaskan | 383 | 0.2% |
| White / Caucasian | 145,293 | 78.9% |
| Two or more Races | 10,250 | 5.6% |
| Some other Race | 2,196 | 1.2% |
| Total | 184,043 | 100.0% |
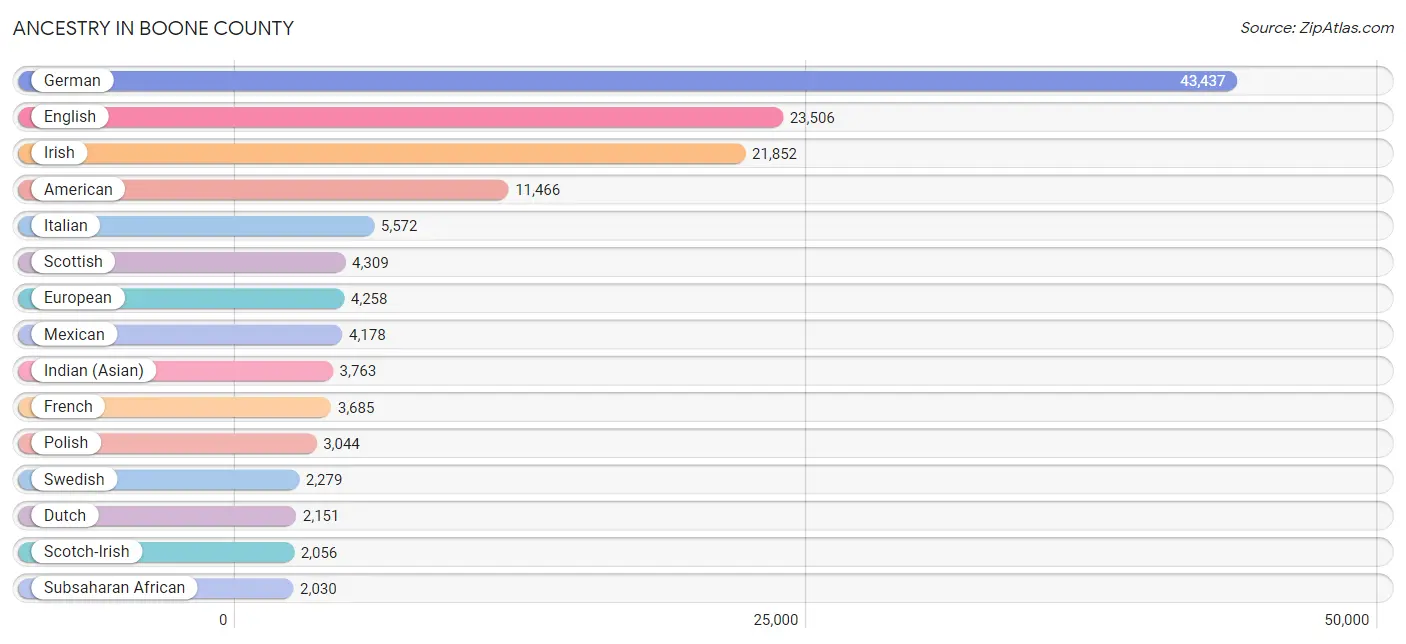
Ancestry in Boone County
The most populous ancestries reported in Boone County are German (43,437 | 23.6%), English (23,506 | 12.8%), Irish (21,852 | 11.9%), American (11,466 | 6.2%), and Italian (5,572 | 3.0%), together accounting for 57.5% of all Boone County residents.
| Ancestry | # Population | % Population |
| African | 824 | 0.4% |
| Albanian | 46 | 0.0% |
| Aleut | 5 | 0.0% |
| Alsatian | 17 | 0.0% |
| American | 11,466 | 6.2% |
| Apache | 35 | 0.0% |
| Arab | 904 | 0.5% |
| Argentinean | 10 | 0.0% |
| Armenian | 33 | 0.0% |
| Assyrian / Chaldean / Syriac | 18 | 0.0% |
| Australian | 89 | 0.1% |
| Austrian | 367 | 0.2% |
| Barbadian | 7 | 0.0% |
| Belgian | 361 | 0.2% |
| Belizean | 5 | 0.0% |
| Bhutanese | 731 | 0.4% |
| Blackfeet | 202 | 0.1% |
| Bolivian | 71 | 0.0% |
| Brazilian | 34 | 0.0% |
| British | 1,799 | 1.0% |
| Bulgarian | 364 | 0.2% |
| Burmese | 1,552 | 0.8% |
| Cajun | 53 | 0.0% |
| Cambodian | 19 | 0.0% |
| Canadian | 194 | 0.1% |
| Celtic | 78 | 0.0% |
| Central American | 569 | 0.3% |
| Central American Indian | 63 | 0.0% |
| Cherokee | 739 | 0.4% |
| Chickasaw | 4 | 0.0% |
| Chilean | 27 | 0.0% |
| Chippewa | 47 | 0.0% |
| Choctaw | 72 | 0.0% |
| Colombian | 215 | 0.1% |
| Comanche | 24 | 0.0% |
| Costa Rican | 14 | 0.0% |
| Croatian | 111 | 0.1% |
| Crow | 2 | 0.0% |
| Cuban | 218 | 0.1% |
| Czech | 614 | 0.3% |
| Czechoslovakian | 201 | 0.1% |
| Danish | 540 | 0.3% |
| Delaware | 38 | 0.0% |
| Dominican | 44 | 0.0% |
| Dutch | 2,151 | 1.2% |
| Dutch West Indian | 5 | 0.0% |
| Eastern European | 346 | 0.2% |
| Ecuadorian | 52 | 0.0% |
| Egyptian | 67 | 0.0% |
| English | 23,506 | 12.8% |
| Estonian | 12 | 0.0% |
| Ethiopian | 121 | 0.1% |
| European | 4,258 | 2.3% |
| Filipino | 124 | 0.1% |
| Finnish | 206 | 0.1% |
| French | 3,685 | 2.0% |
| French American Indian | 43 | 0.0% |
| French Canadian | 438 | 0.2% |
| German | 43,437 | 23.6% |
| Ghanaian | 270 | 0.2% |
| Greek | 549 | 0.3% |
| Guamanian / Chamorro | 33 | 0.0% |
| Guatemalan | 134 | 0.1% |
| Guyanese | 35 | 0.0% |
| Haitian | 121 | 0.1% |
| Honduran | 173 | 0.1% |
| Hopi | 9 | 0.0% |
| Hungarian | 341 | 0.2% |
| Icelander | 13 | 0.0% |
| Indian (Asian) | 3,763 | 2.0% |
| Indonesian | 33 | 0.0% |
| Iranian | 328 | 0.2% |
| Iraqi | 343 | 0.2% |
| Irish | 21,852 | 11.9% |
| Iroquois | 77 | 0.0% |
| Israeli | 93 | 0.1% |
| Italian | 5,572 | 3.0% |
| Jamaican | 158 | 0.1% |
| Japanese | 874 | 0.5% |
| Jordanian | 8 | 0.0% |
| Kenyan | 72 | 0.0% |
| Kiowa | 6 | 0.0% |
| Korean | 894 | 0.5% |
| Latvian | 15 | 0.0% |
| Lebanese | 140 | 0.1% |
| Lithuanian | 285 | 0.2% |
| Luxembourger | 18 | 0.0% |
| Macedonian | 8 | 0.0% |
| Mexican | 4,178 | 2.3% |
| Mexican American Indian | 11 | 0.0% |
| Moroccan | 22 | 0.0% |
| Native Hawaiian | 221 | 0.1% |
| Navajo | 22 | 0.0% |
| New Zealander | 5 | 0.0% |
| Nicaraguan | 150 | 0.1% |
| Nigerian | 223 | 0.1% |
| Northern European | 692 | 0.4% |
| Norwegian | 1,806 | 1.0% |
| Pakistani | 101 | 0.1% |
| Palestinian | 14 | 0.0% |
| Panamanian | 44 | 0.0% |
| Paraguayan | 13 | 0.0% |
| Pennsylvania German | 65 | 0.0% |
| Peruvian | 343 | 0.2% |
| Polish | 3,044 | 1.7% |
| Portuguese | 240 | 0.1% |
| Potawatomi | 57 | 0.0% |
| Puerto Rican | 448 | 0.2% |
| Romanian | 190 | 0.1% |
| Russian | 1,123 | 0.6% |
| Salvadoran | 54 | 0.0% |
| Samoan | 81 | 0.0% |
| Scandinavian | 859 | 0.5% |
| Scotch-Irish | 2,056 | 1.1% |
| Scottish | 4,309 | 2.3% |
| Seminole | 10 | 0.0% |
| Serbian | 13 | 0.0% |
| Sierra Leonean | 37 | 0.0% |
| Sioux | 172 | 0.1% |
| Slavic | 70 | 0.0% |
| Slovak | 168 | 0.1% |
| Slovene | 15 | 0.0% |
| Somali | 3 | 0.0% |
| South African | 119 | 0.1% |
| South American | 750 | 0.4% |
| Spaniard | 188 | 0.1% |
| Spanish | 162 | 0.1% |
| Sri Lankan | 999 | 0.5% |
| Subsaharan African | 2,030 | 1.1% |
| Sudanese | 244 | 0.1% |
| Swedish | 2,279 | 1.2% |
| Swiss | 954 | 0.5% |
| Syrian | 134 | 0.1% |
| Thai | 1,341 | 0.7% |
| Trinidadian and Tobagonian | 36 | 0.0% |
| Turkish | 105 | 0.1% |
| Ukrainian | 215 | 0.1% |
| Venezuelan | 13 | 0.0% |
| Vietnamese | 16 | 0.0% |
| Welsh | 1,315 | 0.7% |
| West Indian | 30 | 0.0% |
| Yugoslavian | 85 | 0.1% |
| Zimbabwean | 3 | 0.0% | View All 143 Rows |
Immigrants in Boone County
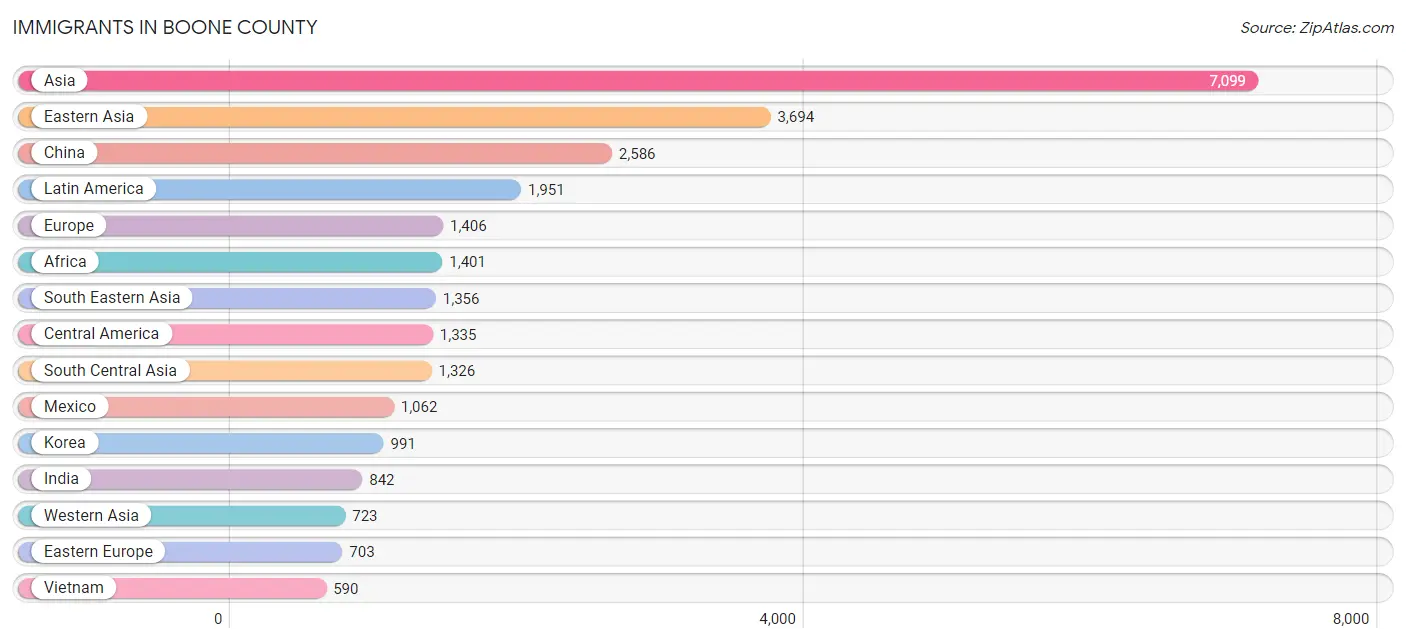
The most numerous immigrant groups reported in Boone County came from Asia (7,099 | 3.9%), Eastern Asia (3,694 | 2.0%), China (2,586 | 1.4%), Latin America (1,951 | 1.1%), and Europe (1,406 | 0.8%), together accounting for 9.1% of all Boone County residents.
| Immigration Origin | # Population | % Population |
| Africa | 1,401 | 0.8% |
| Argentina | 67 | 0.0% |
| Asia | 7,099 | 3.9% |
| Australia | 9 | 0.0% |
| Bahamas | 55 | 0.0% |
| Bangladesh | 20 | 0.0% |
| Belgium | 15 | 0.0% |
| Bolivia | 66 | 0.0% |
| Bosnia and Herzegovina | 38 | 0.0% |
| Brazil | 28 | 0.0% |
| Bulgaria | 378 | 0.2% |
| Cambodia | 282 | 0.2% |
| Cameroon | 16 | 0.0% |
| Canada | 70 | 0.0% |
| Caribbean | 124 | 0.1% |
| Central America | 1,335 | 0.7% |
| Chile | 27 | 0.0% |
| China | 2,586 | 1.4% |
| Colombia | 104 | 0.1% |
| Congo | 11 | 0.0% |
| Costa Rica | 10 | 0.0% |
| Croatia | 16 | 0.0% |
| Cuba | 20 | 0.0% |
| Czechoslovakia | 38 | 0.0% |
| Eastern Africa | 480 | 0.3% |
| Eastern Asia | 3,694 | 2.0% |
| Eastern Europe | 703 | 0.4% |
| Ecuador | 24 | 0.0% |
| Egypt | 140 | 0.1% |
| El Salvador | 35 | 0.0% |
| England | 31 | 0.0% |
| Eritrea | 205 | 0.1% |
| Ethiopia | 43 | 0.0% |
| Europe | 1,406 | 0.8% |
| France | 26 | 0.0% |
| Germany | 187 | 0.1% |
| Ghana | 136 | 0.1% |
| Greece | 8 | 0.0% |
| Guatemala | 49 | 0.0% |
| Haiti | 23 | 0.0% |
| Honduras | 172 | 0.1% |
| Hong Kong | 53 | 0.0% |
| India | 842 | 0.5% |
| Iran | 100 | 0.1% |
| Iraq | 436 | 0.2% |
| Ireland | 26 | 0.0% |
| Italy | 97 | 0.1% |
| Japan | 98 | 0.1% |
| Jordan | 8 | 0.0% |
| Kazakhstan | 2 | 0.0% |
| Kenya | 171 | 0.1% |
| Korea | 991 | 0.5% |
| Laos | 10 | 0.0% |
| Latin America | 1,951 | 1.1% |
| Lebanon | 51 | 0.0% |
| Mexico | 1,062 | 0.6% |
| Micronesia | 53 | 0.0% |
| Middle Africa | 79 | 0.0% |
| Morocco | 22 | 0.0% |
| Nepal | 210 | 0.1% |
| Nicaragua | 7 | 0.0% |
| Nigeria | 113 | 0.1% |
| Northern Africa | 242 | 0.1% |
| Northern Europe | 314 | 0.2% |
| Oceania | 111 | 0.1% |
| Pakistan | 82 | 0.0% |
| Peru | 155 | 0.1% |
| Philippines | 243 | 0.1% |
| Poland | 18 | 0.0% |
| Romania | 43 | 0.0% |
| Russia | 85 | 0.1% |
| Saudi Arabia | 23 | 0.0% |
| Scotland | 113 | 0.1% |
| Sierra Leone | 42 | 0.0% |
| Singapore | 1 | 0.0% |
| South Africa | 69 | 0.0% |
| South America | 492 | 0.3% |
| South Central Asia | 1,326 | 0.7% |
| South Eastern Asia | 1,356 | 0.7% |
| Southern Europe | 150 | 0.1% |
| Spain | 45 | 0.0% |
| Sri Lanka | 70 | 0.0% |
| Sudan | 73 | 0.0% |
| Switzerland | 11 | 0.0% |
| Syria | 47 | 0.0% |
| Taiwan | 90 | 0.1% |
| Thailand | 120 | 0.1% |
| Trinidad and Tobago | 26 | 0.0% |
| Turkey | 105 | 0.1% |
| Uganda | 12 | 0.0% |
| Ukraine | 50 | 0.0% |
| Venezuela | 8 | 0.0% |
| Vietnam | 590 | 0.3% |
| Western Africa | 350 | 0.2% |
| Western Asia | 723 | 0.4% |
| Western Europe | 239 | 0.1% |
| Zaire | 52 | 0.0% |
| Zimbabwe | 23 | 0.0% | View All 98 Rows |
Sex and Age in Boone County
Sex and Age in Boone County
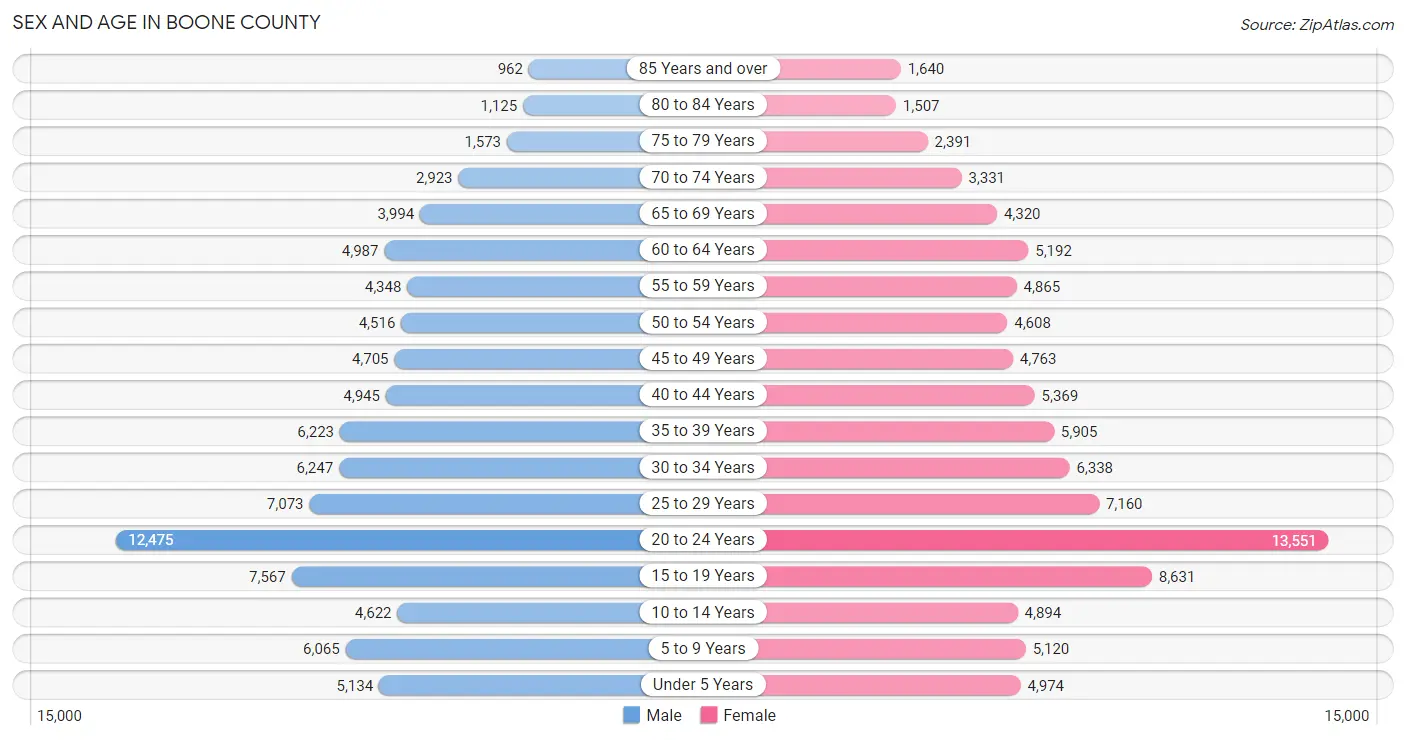
The most populous age groups in Boone County are 20 to 24 Years (12,475 | 13.9%) for men and 20 to 24 Years (13,551 | 14.3%) for women.
| Age Bracket | Male | Female |
| Under 5 Years | 5,134 (5.7%) | 4,974 (5.3%) |
| 5 to 9 Years | 6,065 (6.8%) | 5,120 (5.4%) |
| 10 to 14 Years | 4,622 (5.2%) | 4,894 (5.2%) |
| 15 to 19 Years | 7,567 (8.5%) | 8,631 (9.1%) |
| 20 to 24 Years | 12,475 (13.9%) | 13,551 (14.3%) |
| 25 to 29 Years | 7,073 (7.9%) | 7,160 (7.6%) |
| 30 to 34 Years | 6,247 (7.0%) | 6,338 (6.7%) |
| 35 to 39 Years | 6,223 (7.0%) | 5,905 (6.2%) |
| 40 to 44 Years | 4,945 (5.5%) | 5,369 (5.7%) |
| 45 to 49 Years | 4,705 (5.3%) | 4,763 (5.0%) |
| 50 to 54 Years | 4,516 (5.1%) | 4,608 (4.9%) |
| 55 to 59 Years | 4,348 (4.9%) | 4,865 (5.1%) |
| 60 to 64 Years | 4,987 (5.6%) | 5,192 (5.5%) |
| 65 to 69 Years | 3,994 (4.5%) | 4,320 (4.6%) |
| 70 to 74 Years | 2,923 (3.3%) | 3,331 (3.5%) |
| 75 to 79 Years | 1,573 (1.8%) | 2,391 (2.5%) |
| 80 to 84 Years | 1,125 (1.3%) | 1,507 (1.6%) |
| 85 Years and over | 962 (1.1%) | 1,640 (1.7%) |
| Total | 89,484 (100.0%) | 94,559 (100.0%) |
Families and Households in Boone County
Median Family Size in Boone County
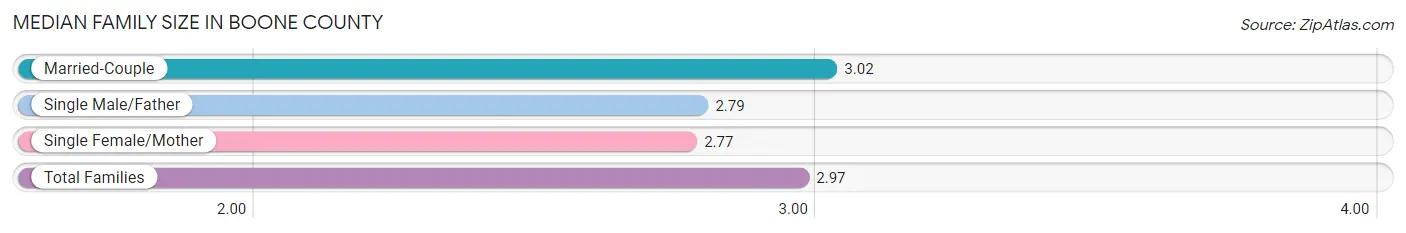
The median family size in Boone County is 2.97 persons per family, with married-couple families (32,271 | 78.3%) accounting for the largest median family size of 3.02 persons per family. On the other hand, single female/mother families (6,532 | 15.8%) represent the smallest median family size with 2.77 persons per family.
| Family Type | # Families | Family Size |
| Married-Couple | 32,271 (78.3%) | 3.02 |
| Single Male/Father | 2,422 (5.9%) | 2.79 |
| Single Female/Mother | 6,532 (15.8%) | 2.77 |
| Total Families | 41,225 (100.0%) | 2.97 |
Median Household Size in Boone County
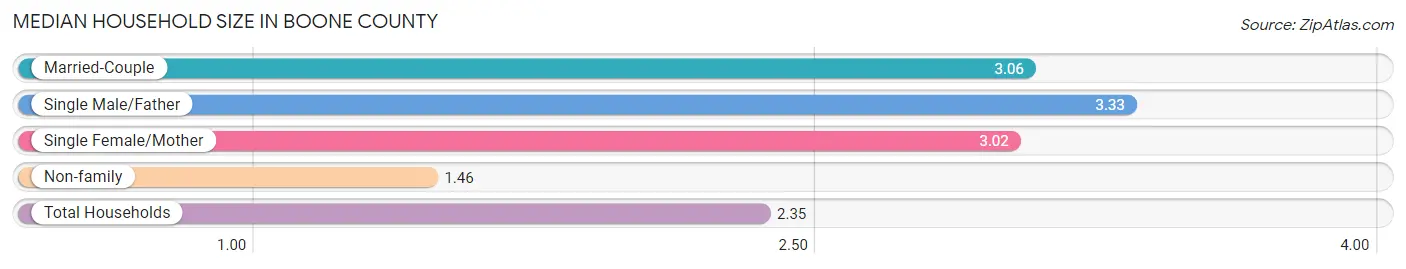
The median household size in Boone County is 2.35 persons per household, with single male/father households (2,422 | 3.3%) accounting for the largest median household size of 3.33 persons per household. non-family households (33,044 | 44.5%) represent the smallest median household size with 1.46 persons per household.
| Household Type | # Households | Household Size |
| Married-Couple | 32,271 (43.4%) | 3.06 |
| Single Male/Father | 2,422 (3.3%) | 3.33 |
| Single Female/Mother | 6,532 (8.8%) | 3.02 |
| Non-family | 33,044 (44.5%) | 1.46 |
| Total Households | 74,269 (100.0%) | 2.35 |
Household Size by Marriage Status in Boone County
Out of a total of 74,269 households in Boone County, 41,225 (55.5%) are family households, while 33,044 (44.5%) are nonfamily households. The most numerous type of family households are 2-person households, comprising 19,360, and the most common type of nonfamily households are 1-person households, comprising 23,740.
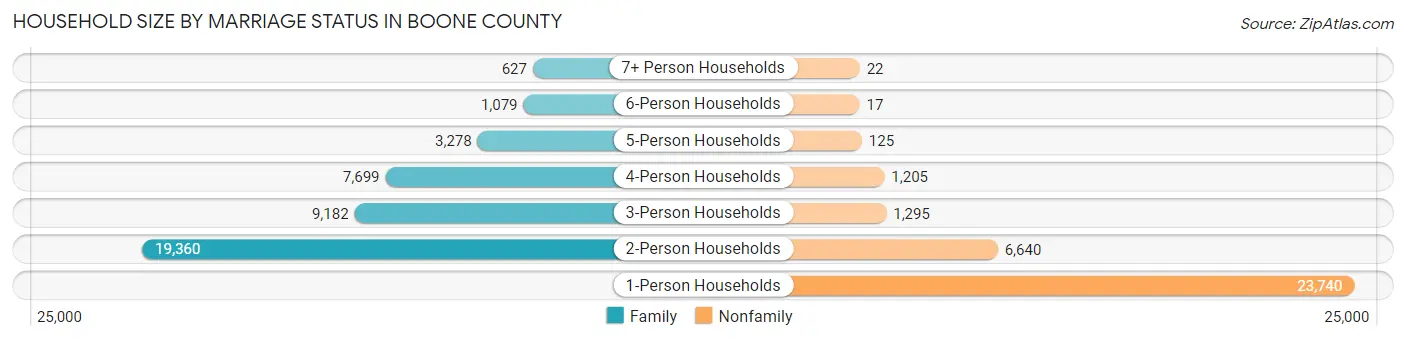
| Household Size | Family Households | Nonfamily Households |
| 1-Person Households | - | 23,740 (32.0%) |
| 2-Person Households | 19,360 (26.1%) | 6,640 (8.9%) |
| 3-Person Households | 9,182 (12.4%) | 1,295 (1.7%) |
| 4-Person Households | 7,699 (10.4%) | 1,205 (1.6%) |
| 5-Person Households | 3,278 (4.4%) | 125 (0.2%) |
| 6-Person Households | 1,079 (1.5%) | 17 (0.0%) |
| 7+ Person Households | 627 (0.8%) | 22 (0.0%) |
| Total | 41,225 (55.5%) | 33,044 (44.5%) |
Female Fertility in Boone County
Fertility by Age in Boone County
Average fertility rate in Boone County is 52.0 births per 1,000 women. Women in the age bracket of 20 to 34 years have the highest fertility rate with 83.0 births per 1,000 women. Women in the age bracket of 20 to 34 years acount for 82.5% of all women with births.
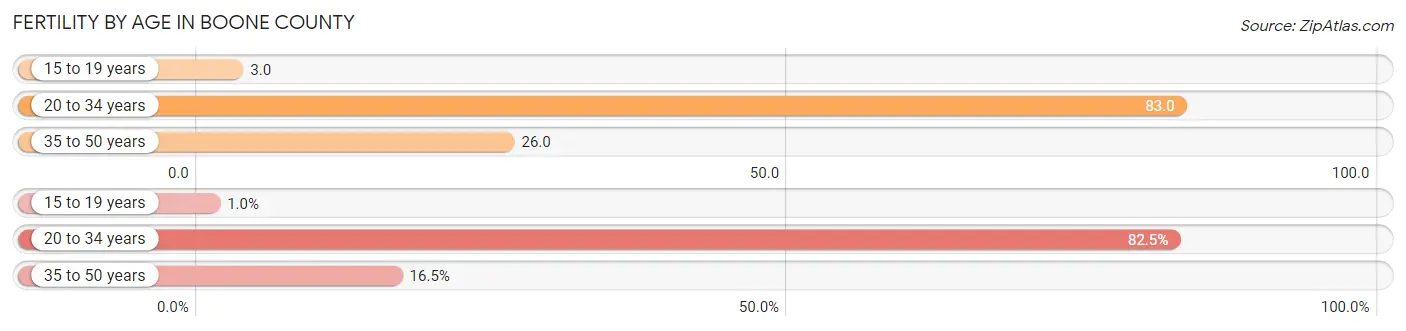
| Age Bracket | Women with Births | Births / 1,000 Women |
| 15 to 19 years | 28 (1.0%) | 3.0 |
| 20 to 34 years | 2,252 (82.5%) | 83.0 |
| 35 to 50 years | 451 (16.5%) | 26.0 |
| Total | 2,731 (100.0%) | 52.0 |
Fertility by Age by Marriage Status in Boone County
67.9% of women with births (2,731) in Boone County are married. The highest percentage of unmarried women with births falls into 15 to 19 years age bracket with 100.0% of them unmarried at the time of birth, while the lowest percentage of unmarried women with births belong to 35 to 50 years age bracket with 18.0% of them unmarried.
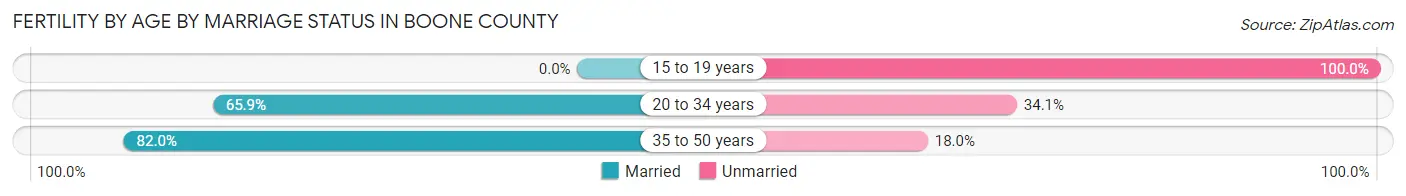
| Age Bracket | Married | Unmarried |
| 15 to 19 years | 0 (0.0%) | 28 (100.0%) |
| 20 to 34 years | 1,484 (65.9%) | 768 (34.1%) |
| 35 to 50 years | 370 (82.0%) | 81 (18.0%) |
| Total | 1,854 (67.9%) | 877 (32.1%) |
Fertility by Education in Boone County
Average fertility rate in Boone County is 52.0 births per 1,000 women. Women with the education attainment of bachelor's degree have the highest fertility rate of 60.0 births per 1,000 women, while women with the education attainment of less than high school have the lowest fertility at 29.0 births per 1,000 women. Women with the education attainment of college or associate's degree represent 39.5% of all women with births.
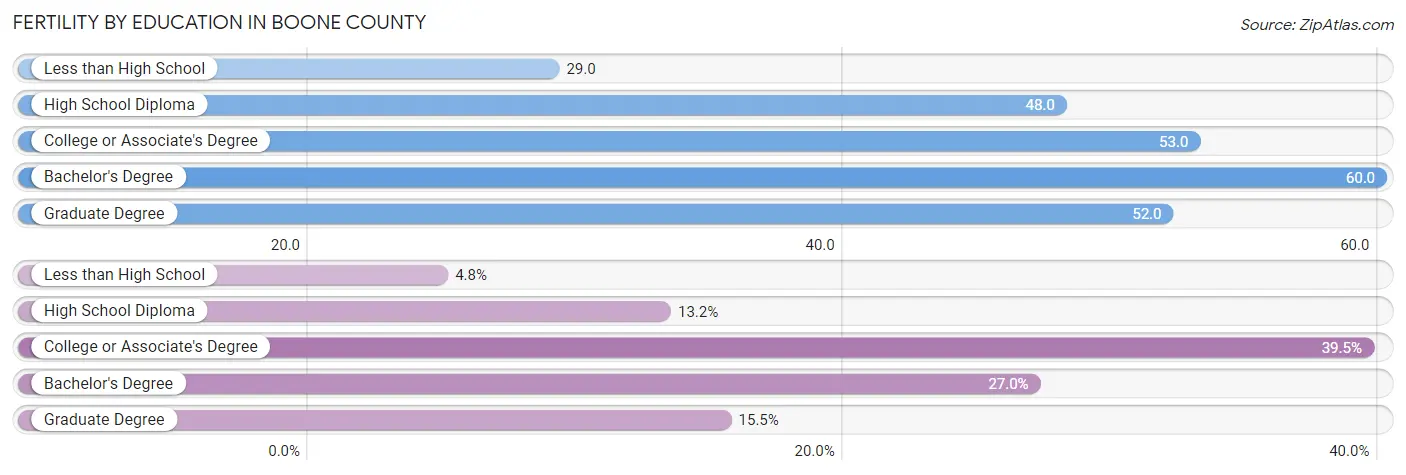
| Educational Attainment | Women with Births | Births / 1,000 Women |
| Less than High School | 132 (4.8%) | 29.0 |
| High School Diploma | 360 (13.2%) | 48.0 |
| College or Associate's Degree | 1,079 (39.5%) | 53.0 |
| Bachelor's Degree | 738 (27.0%) | 60.0 |
| Graduate Degree | 422 (15.4%) | 52.0 |
| Total | 2,731 (100.0%) | 52.0 |
Fertility by Education by Marriage Status in Boone County
32.1% of women with births in Boone County are unmarried. Women with the educational attainment of graduate degree are most likely to be married with 100.0% of them married at childbirth, while women with the educational attainment of less than high school are least likely to be married with 63.6% of them unmarried at childbirth.
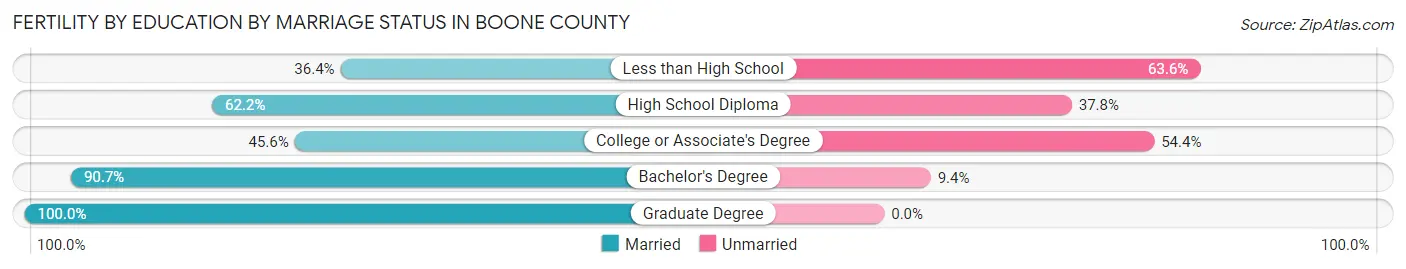
| Educational Attainment | Married | Unmarried |
| Less than High School | 48 (36.4%) | 84 (63.6%) |
| High School Diploma | 224 (62.2%) | 136 (37.8%) |
| College or Associate's Degree | 492 (45.6%) | 587 (54.4%) |
| Bachelor's Degree | 669 (90.6%) | 69 (9.3%) |
| Graduate Degree | 422 (100.0%) | 0 (0.0%) |
| Total | 1,854 (67.9%) | 877 (32.1%) |
Employment Characteristics in Boone County
Employment by Class of Employer in Boone County
Among the 95,304 employed individuals in Boone County, private company employees (57,260 | 60.1%), state government employees (13,208 | 13.9%), and not-for-profit organizations (8,731 | 9.2%) make up the most common classes of employment.
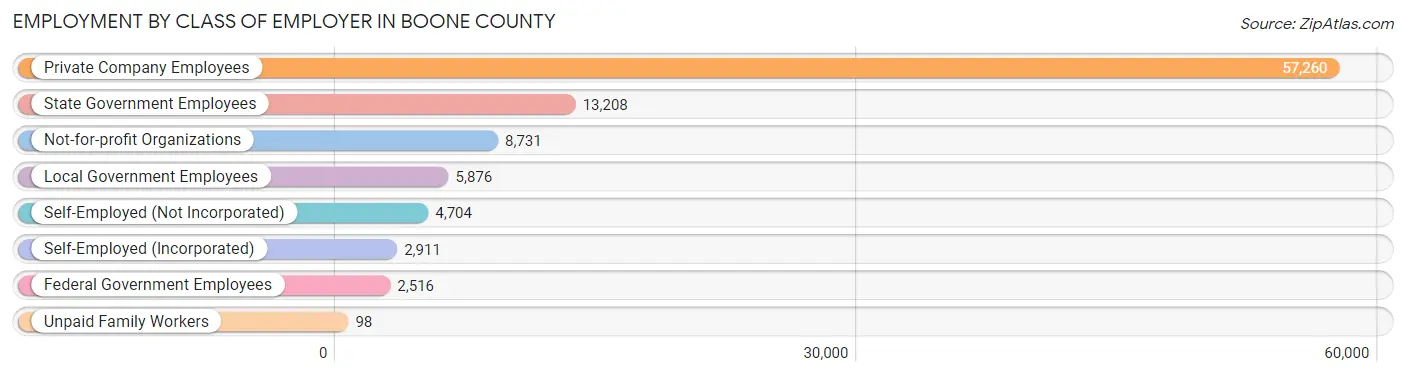
| Employer Class | # Employees | % Employees |
| Private Company Employees | 57,260 | 60.1% |
| Self-Employed (Incorporated) | 2,911 | 3.0% |
| Self-Employed (Not Incorporated) | 4,704 | 4.9% |
| Not-for-profit Organizations | 8,731 | 9.2% |
| Local Government Employees | 5,876 | 6.2% |
| State Government Employees | 13,208 | 13.9% |
| Federal Government Employees | 2,516 | 2.6% |
| Unpaid Family Workers | 98 | 0.1% |
| Total | 95,304 | 100.0% |
Employment Status by Age in Boone County
According to the labor force statistics for Boone County, out of the total population over 16 years of age (151,401), 66.7% or 100,984 individuals are in the labor force, with 3.9% or 3,938 of them unemployed. The age group with the highest labor force participation rate is 30 to 34 years, with 88.6% or 11,150 individuals in the labor force. Within the labor force, the 16 to 19 years age range has the highest percentage of unemployed individuals, with 14.2% or 938 of them being unemployed.
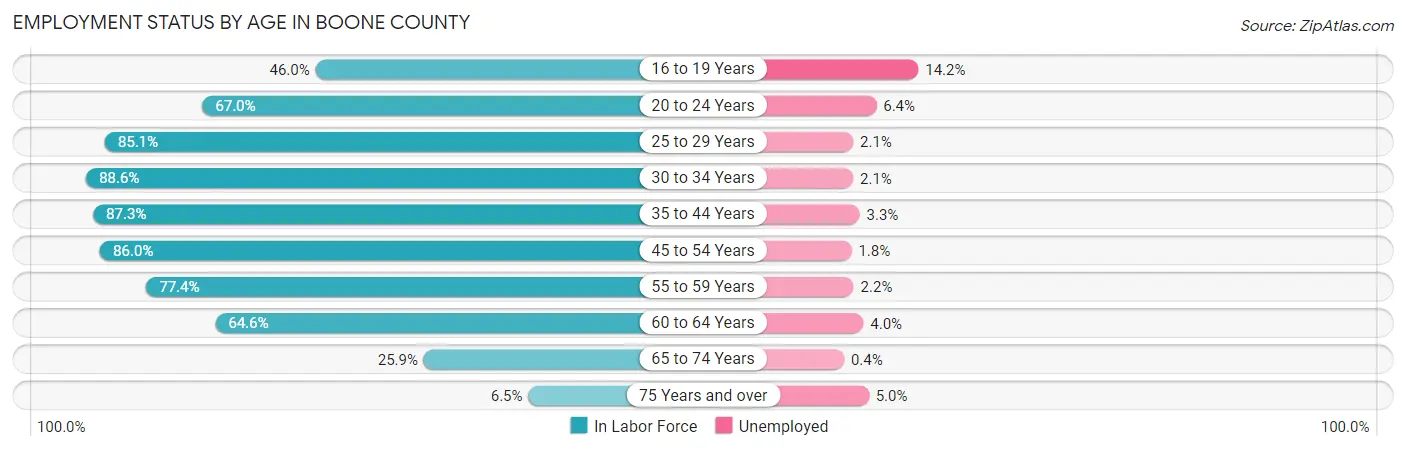
| Age Bracket | In Labor Force | Unemployed |
| 16 to 19 Years | 6,608 (46.0%) | 938 (14.2%) |
| 20 to 24 Years | 17,437 (67.0%) | 1,116 (6.4%) |
| 25 to 29 Years | 12,112 (85.1%) | 254 (2.1%) |
| 30 to 34 Years | 11,150 (88.6%) | 234 (2.1%) |
| 35 to 44 Years | 19,592 (87.3%) | 647 (3.3%) |
| 45 to 54 Years | 15,989 (86.0%) | 288 (1.8%) |
| 55 to 59 Years | 7,131 (77.4%) | 157 (2.2%) |
| 60 to 64 Years | 6,576 (64.6%) | 263 (4.0%) |
| 65 to 74 Years | 3,773 (25.9%) | 15 (0.4%) |
| 75 Years and over | 598 (6.5%) | 30 (5.0%) |
| Total | 100,984 (66.7%) | 3,938 (3.9%) |
Employment Status by Educational Attainment in Boone County
According to labor force statistics for Boone County, 83.2% of individuals (72,587) out of the total population between 25 and 64 years of age (87,244) are in the labor force, with 2.5% or 1,815 of them being unemployed. The group with the highest labor force participation rate are those with the educational attainment of bachelor's degree or higher, with 88.7% or 39,080 individuals in the labor force. Within the labor force, individuals with less than high school education have the highest percentage of unemployment, with 7.9% or 221 of them being unemployed.
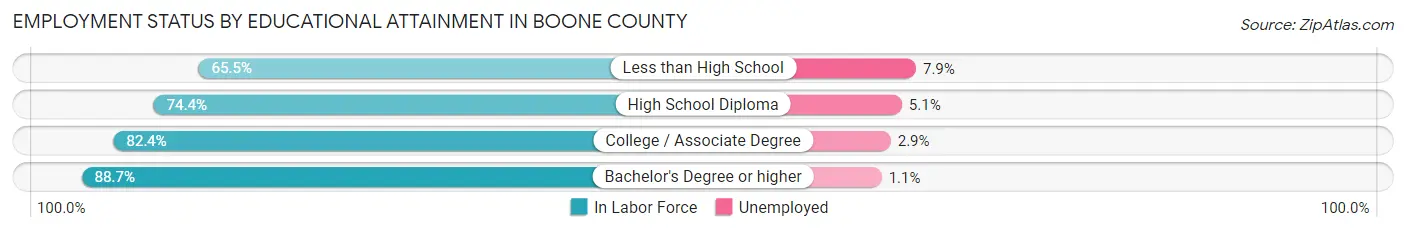
| Educational Attainment | In Labor Force | Unemployed |
| Less than High School | 2,795 (65.5%) | 337 (7.9%) |
| High School Diploma | 12,698 (74.4%) | 870 (5.1%) |
| College / Associate Degree | 18,005 (82.4%) | 634 (2.9%) |
| Bachelor's Degree or higher | 39,080 (88.7%) | 485 (1.1%) |
| Total | 72,587 (83.2%) | 2,181 (2.5%) |
Employment Occupations by Sex in Boone County
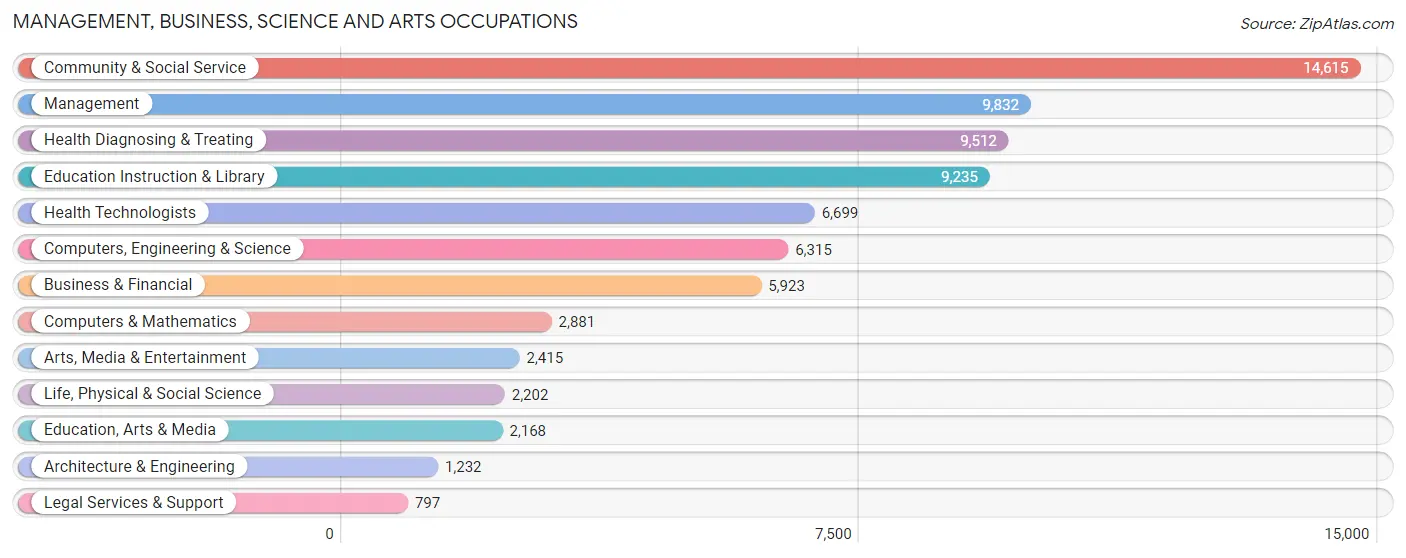
Management, Business, Science and Arts Occupations
The most common Management, Business, Science and Arts occupations in Boone County are Community & Social Service (14,615 | 15.1%), Management (9,832 | 10.2%), Health Diagnosing & Treating (9,512 | 9.8%), Education Instruction & Library (9,235 | 9.5%), and Health Technologists (6,699 | 6.9%).
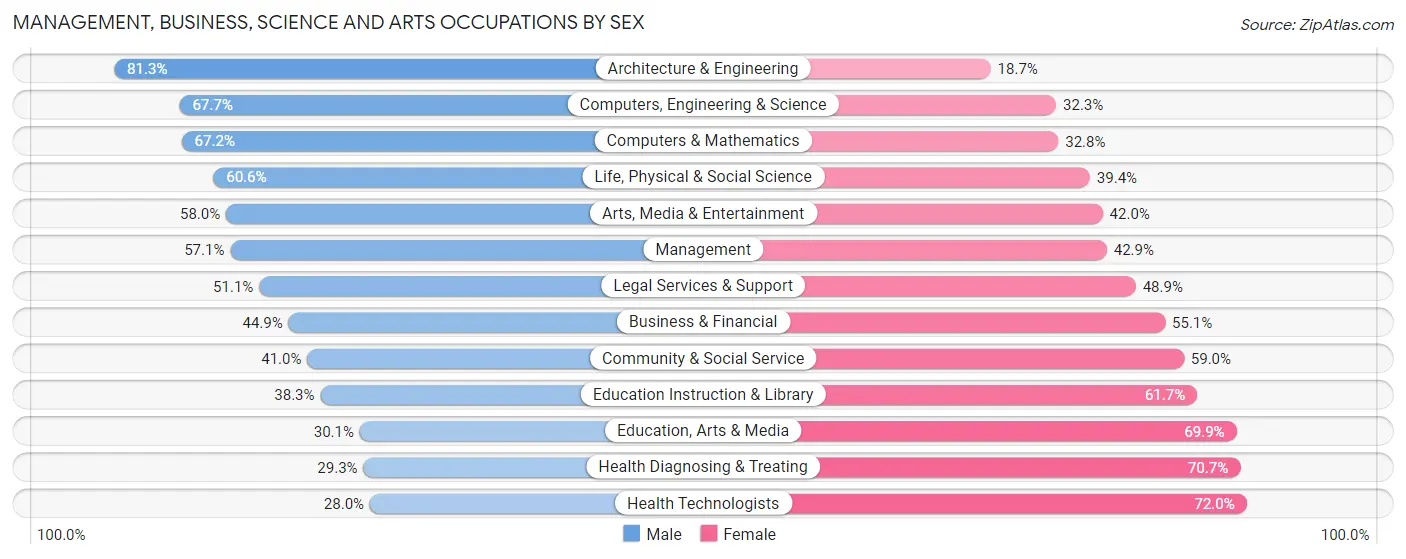
Management, Business, Science and Arts Occupations by Sex
Within the Management, Business, Science and Arts occupations in Boone County, the most male-oriented occupations are Architecture & Engineering (81.3%), Computers, Engineering & Science (67.7%), and Computers & Mathematics (67.2%), while the most female-oriented occupations are Health Technologists (72.0%), Health Diagnosing & Treating (70.7%), and Education, Arts & Media (69.9%).
| Occupation | Male | Female |
| Management | 5,614 (57.1%) | 4,218 (42.9%) |
| Business & Financial | 2,662 (44.9%) | 3,261 (55.1%) |
| Computers, Engineering & Science | 4,274 (67.7%) | 2,041 (32.3%) |
| Computers & Mathematics | 1,937 (67.2%) | 944 (32.8%) |
| Architecture & Engineering | 1,002 (81.3%) | 230 (18.7%) |
| Life, Physical & Social Science | 1,335 (60.6%) | 867 (39.4%) |
| Community & Social Service | 5,996 (41.0%) | 8,619 (59.0%) |
| Education, Arts & Media | 652 (30.1%) | 1,516 (69.9%) |
| Legal Services & Support | 407 (51.1%) | 390 (48.9%) |
| Education Instruction & Library | 3,537 (38.3%) | 5,698 (61.7%) |
| Arts, Media & Entertainment | 1,400 (58.0%) | 1,015 (42.0%) |
| Health Diagnosing & Treating | 2,789 (29.3%) | 6,723 (70.7%) |
| Health Technologists | 1,874 (28.0%) | 4,825 (72.0%) |
| Total (Category) | 21,335 (46.2%) | 24,862 (53.8%) |
| Total (Overall) | 49,228 (50.8%) | 47,587 (49.1%) |
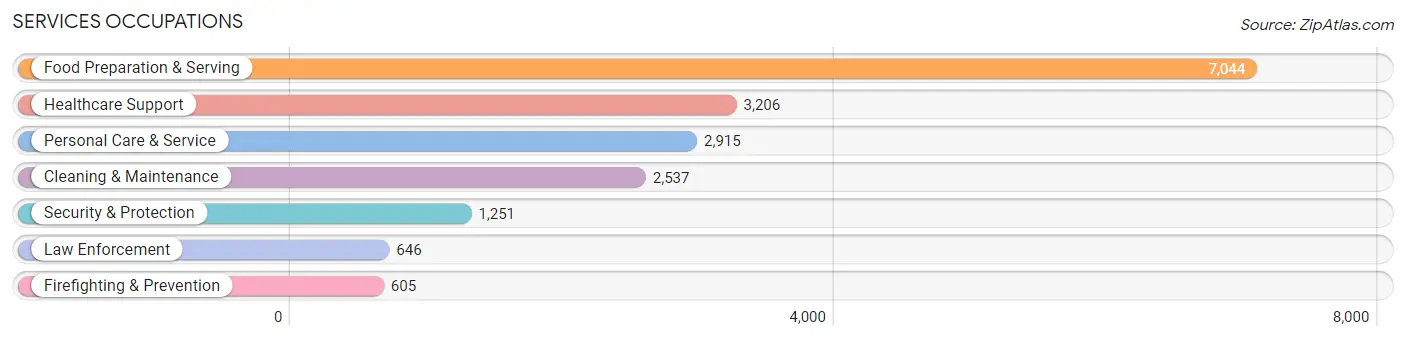
Services Occupations
The most common Services occupations in Boone County are Food Preparation & Serving (7,044 | 7.3%), Healthcare Support (3,206 | 3.3%), Personal Care & Service (2,915 | 3.0%), Cleaning & Maintenance (2,537 | 2.6%), and Security & Protection (1,251 | 1.3%).
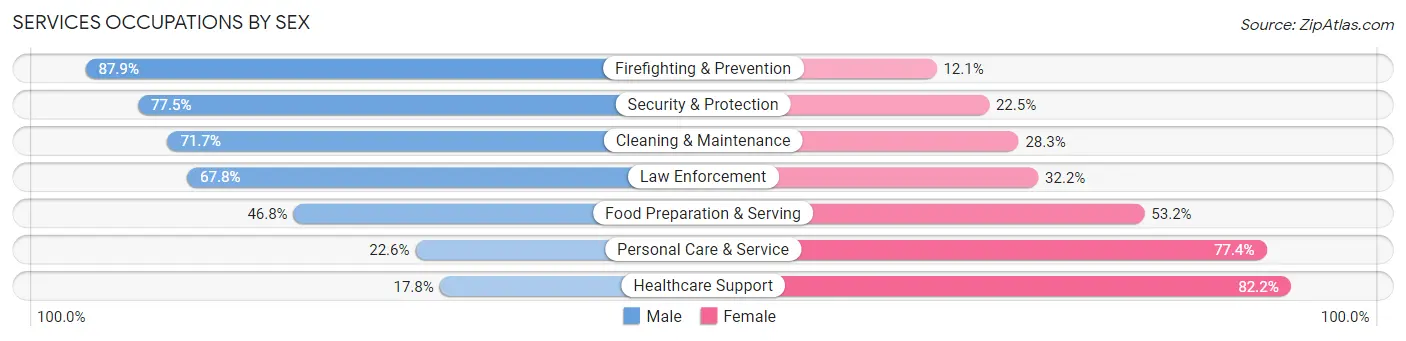
Services Occupations by Sex
Within the Services occupations in Boone County, the most male-oriented occupations are Firefighting & Prevention (87.9%), Security & Protection (77.5%), and Cleaning & Maintenance (71.7%), while the most female-oriented occupations are Healthcare Support (82.2%), Personal Care & Service (77.4%), and Food Preparation & Serving (53.2%).
| Occupation | Male | Female |
| Healthcare Support | 572 (17.8%) | 2,634 (82.2%) |
| Security & Protection | 970 (77.5%) | 281 (22.5%) |
| Firefighting & Prevention | 532 (87.9%) | 73 (12.1%) |
| Law Enforcement | 438 (67.8%) | 208 (32.2%) |
| Food Preparation & Serving | 3,294 (46.8%) | 3,750 (53.2%) |
| Cleaning & Maintenance | 1,819 (71.7%) | 718 (28.3%) |
| Personal Care & Service | 660 (22.6%) | 2,255 (77.4%) |
| Total (Category) | 7,315 (43.1%) | 9,638 (56.9%) |
| Total (Overall) | 49,228 (50.8%) | 47,587 (49.1%) |
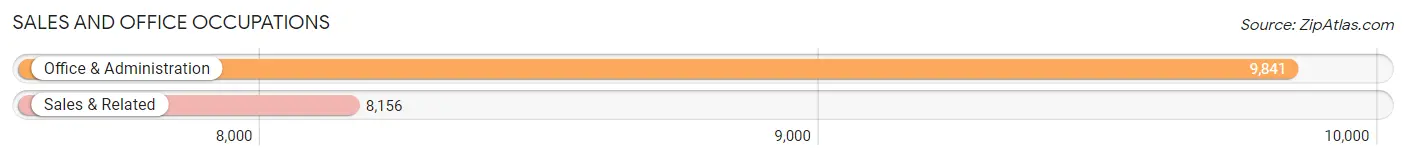
Sales and Office Occupations
The most common Sales and Office occupations in Boone County are Office & Administration (9,841 | 10.2%), and Sales & Related (8,156 | 8.4%).
Sales and Office Occupations by Sex
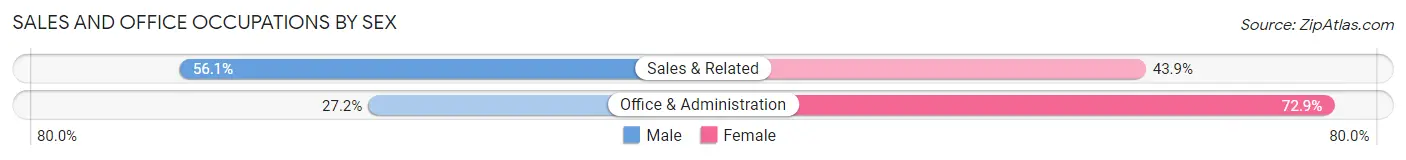
| Occupation | Male | Female |
| Sales & Related | 4,576 (56.1%) | 3,580 (43.9%) |
| Office & Administration | 2,672 (27.2%) | 7,169 (72.9%) |
| Total (Category) | 7,248 (40.3%) | 10,749 (59.7%) |
| Total (Overall) | 49,228 (50.8%) | 47,587 (49.1%) |
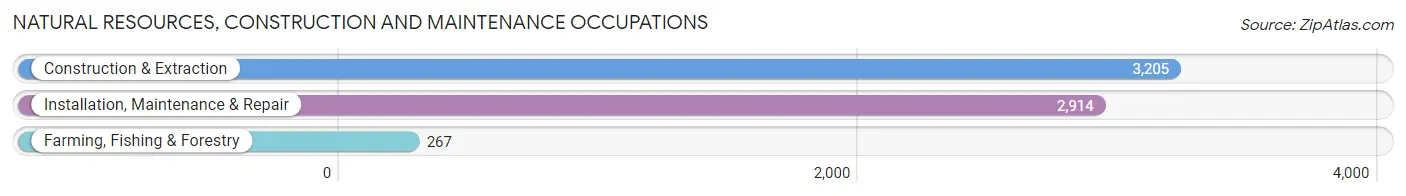
Natural Resources, Construction and Maintenance Occupations
The most common Natural Resources, Construction and Maintenance occupations in Boone County are Construction & Extraction (3,205 | 3.3%), Installation, Maintenance & Repair (2,914 | 3.0%), and Farming, Fishing & Forestry (267 | 0.3%).
Natural Resources, Construction and Maintenance Occupations by Sex
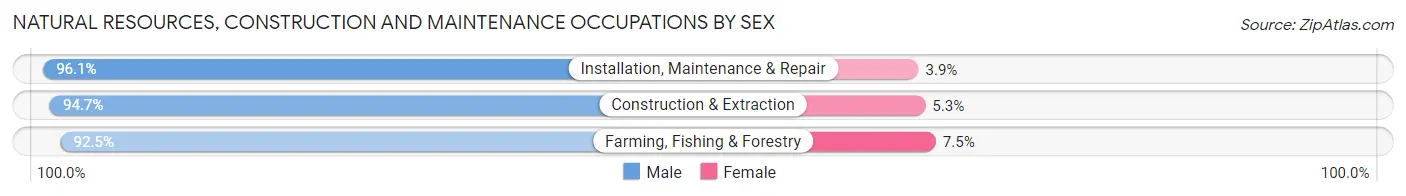
| Occupation | Male | Female |
| Farming, Fishing & Forestry | 247 (92.5%) | 20 (7.5%) |
| Construction & Extraction | 3,035 (94.7%) | 170 (5.3%) |
| Installation, Maintenance & Repair | 2,801 (96.1%) | 113 (3.9%) |
| Total (Category) | 6,083 (95.3%) | 303 (4.7%) |
| Total (Overall) | 49,228 (50.8%) | 47,587 (49.1%) |
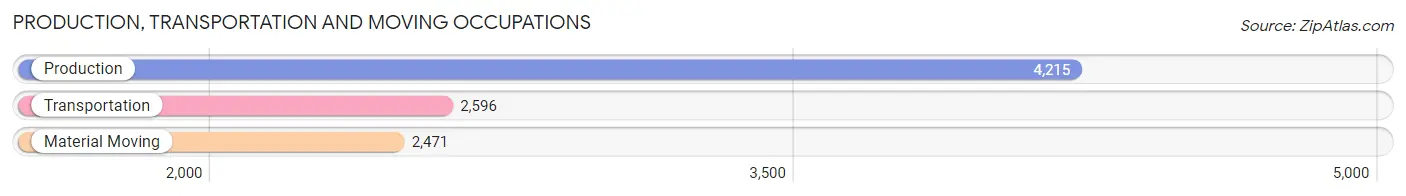
Production, Transportation and Moving Occupations
The most common Production, Transportation and Moving occupations in Boone County are Production (4,215 | 4.3%), Transportation (2,596 | 2.7%), and Material Moving (2,471 | 2.5%).
Production, Transportation and Moving Occupations by Sex
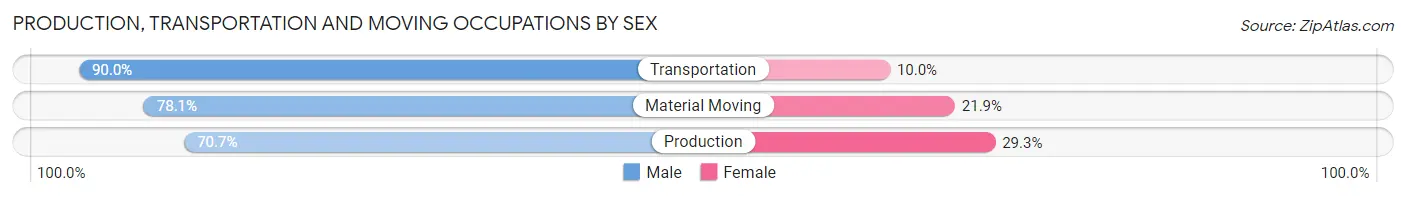
| Occupation | Male | Female |
| Production | 2,980 (70.7%) | 1,235 (29.3%) |
| Transportation | 2,337 (90.0%) | 259 (10.0%) |
| Material Moving | 1,930 (78.1%) | 541 (21.9%) |
| Total (Category) | 7,247 (78.1%) | 2,035 (21.9%) |
| Total (Overall) | 49,228 (50.8%) | 47,587 (49.1%) |
Employment Industries by Sex in Boone County
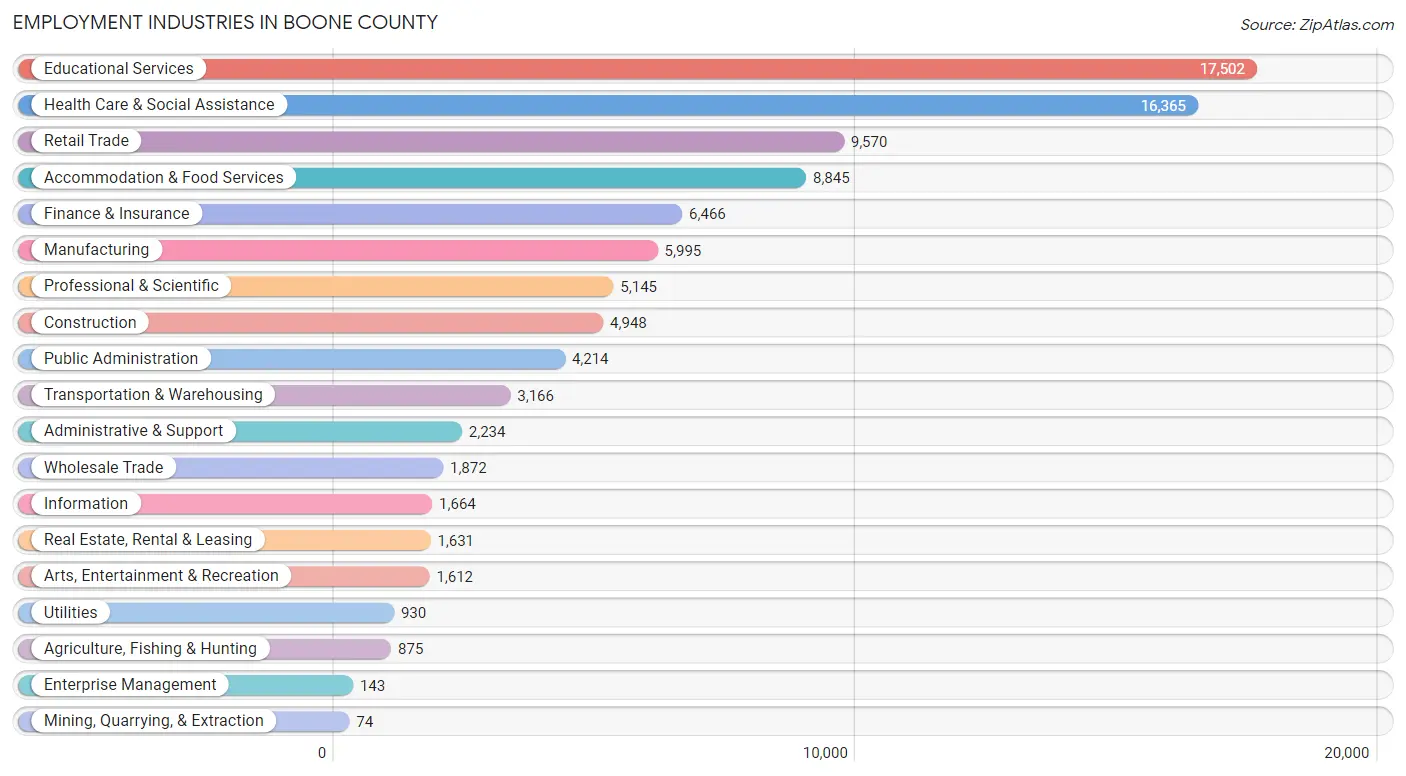
Employment Industries in Boone County
The major employment industries in Boone County include Educational Services (17,502 | 18.1%), Health Care & Social Assistance (16,365 | 16.9%), Retail Trade (9,570 | 9.9%), Accommodation & Food Services (8,845 | 9.1%), and Finance & Insurance (6,466 | 6.7%).
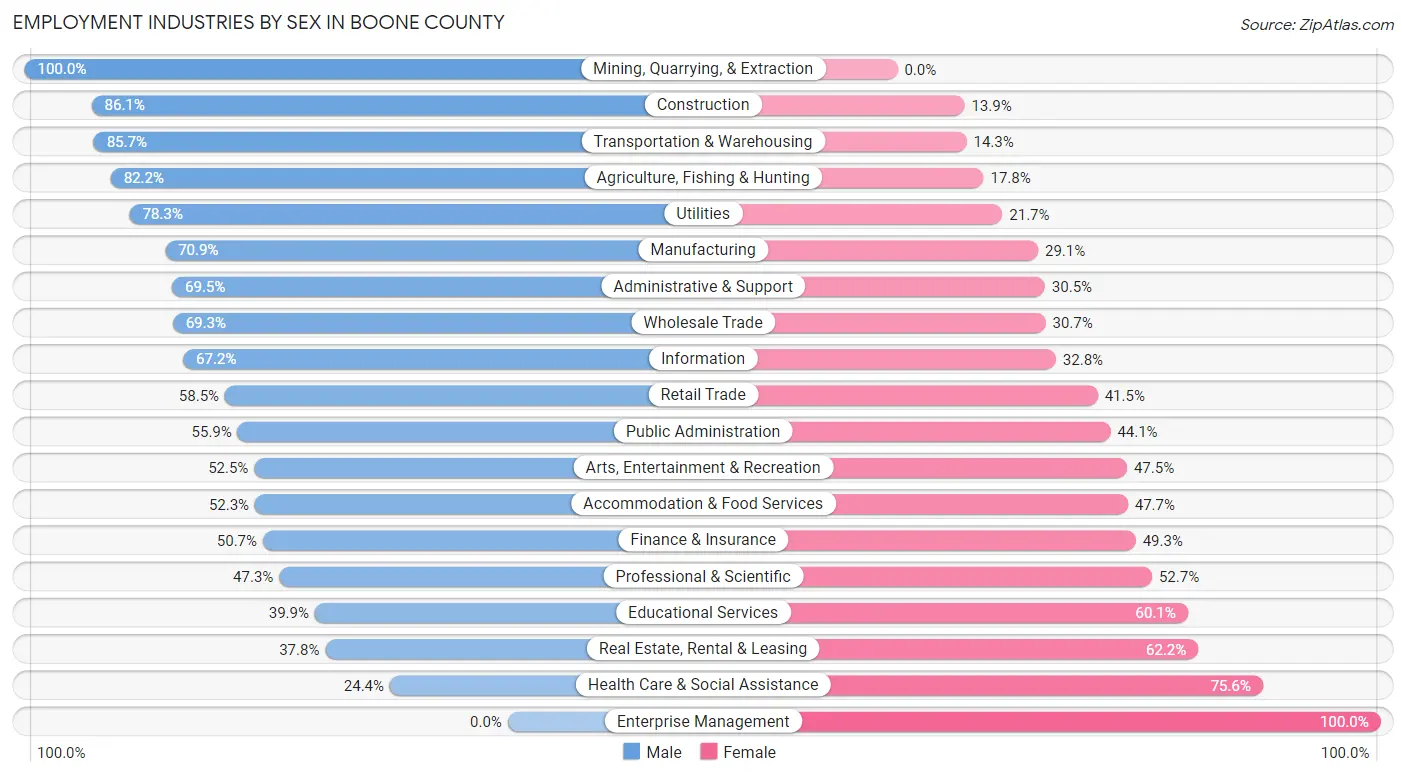
Employment Industries by Sex in Boone County
The Boone County industries that see more men than women are Mining, Quarrying, & Extraction (100.0%), Construction (86.1%), and Transportation & Warehousing (85.7%), whereas the industries that tend to have a higher number of women are Enterprise Management (100.0%), Health Care & Social Assistance (75.6%), and Real Estate, Rental & Leasing (62.2%).
| Industry | Male | Female |
| Agriculture, Fishing & Hunting | 719 (82.2%) | 156 (17.8%) |
| Mining, Quarrying, & Extraction | 74 (100.0%) | 0 (0.0%) |
| Construction | 4,261 (86.1%) | 687 (13.9%) |
| Manufacturing | 4,250 (70.9%) | 1,745 (29.1%) |
| Wholesale Trade | 1,298 (69.3%) | 574 (30.7%) |
| Retail Trade | 5,602 (58.5%) | 3,968 (41.5%) |
| Transportation & Warehousing | 2,713 (85.7%) | 453 (14.3%) |
| Utilities | 728 (78.3%) | 202 (21.7%) |
| Information | 1,118 (67.2%) | 546 (32.8%) |
| Finance & Insurance | 3,277 (50.7%) | 3,189 (49.3%) |
| Real Estate, Rental & Leasing | 616 (37.8%) | 1,015 (62.2%) |
| Professional & Scientific | 2,434 (47.3%) | 2,711 (52.7%) |
| Enterprise Management | 0 (0.0%) | 143 (100.0%) |
| Administrative & Support | 1,552 (69.5%) | 682 (30.5%) |
| Educational Services | 6,990 (39.9%) | 10,512 (60.1%) |
| Health Care & Social Assistance | 3,992 (24.4%) | 12,373 (75.6%) |
| Arts, Entertainment & Recreation | 846 (52.5%) | 766 (47.5%) |
| Accommodation & Food Services | 4,628 (52.3%) | 4,217 (47.7%) |
| Public Administration | 2,356 (55.9%) | 1,858 (44.1%) |
| Total | 49,228 (50.8%) | 47,587 (49.1%) |
Education in Boone County
School Enrollment in Boone County
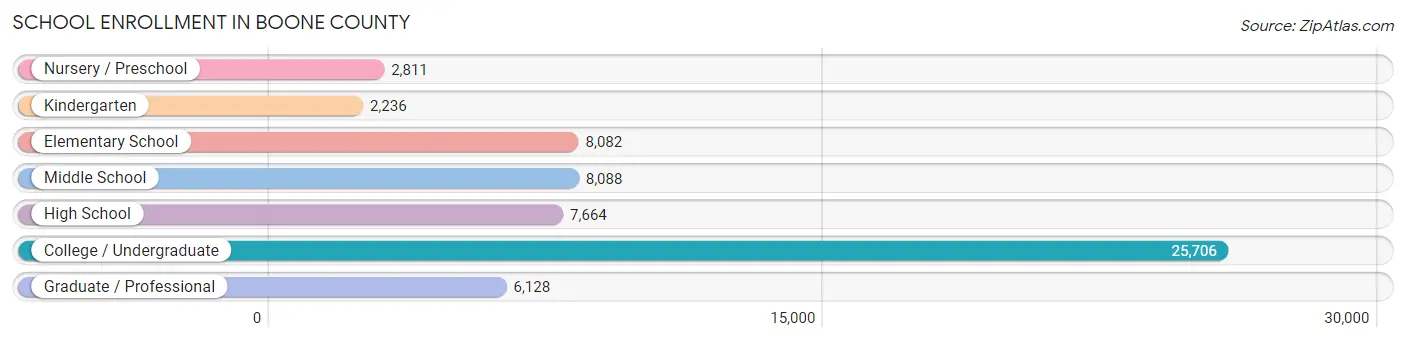
The most common levels of schooling among the 60,715 students in Boone County are college / undergraduate (25,706 | 42.3%), middle school (8,088 | 13.3%), and elementary school (8,082 | 13.3%).
| School Level | # Students | % Students |
| Nursery / Preschool | 2,811 | 4.6% |
| Kindergarten | 2,236 | 3.7% |
| Elementary School | 8,082 | 13.3% |
| Middle School | 8,088 | 13.3% |
| High School | 7,664 | 12.6% |
| College / Undergraduate | 25,706 | 42.3% |
| Graduate / Professional | 6,128 | 10.1% |
| Total | 60,715 | 100.0% |
School Enrollment by Age by Funding Source in Boone County
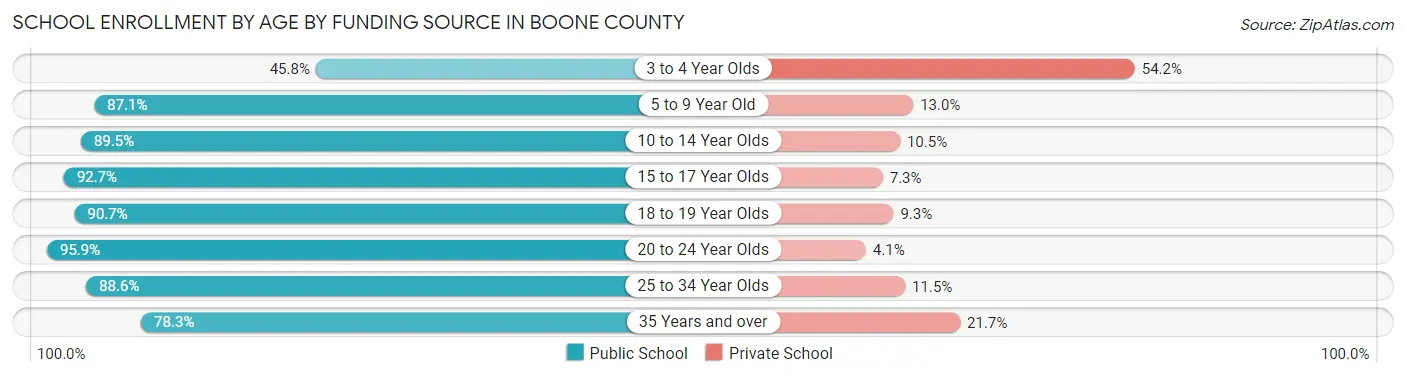
Out of a total of 60,715 students who are enrolled in schools in Boone County, 6,254 (10.3%) attend a private institution, while the remaining 54,461 (89.7%) are enrolled in public schools. The age group of 3 to 4 year olds has the highest likelihood of being enrolled in private schools, with 975 (54.2% in the age bracket) enrolled. Conversely, the age group of 20 to 24 year olds has the lowest likelihood of being enrolled in a private school, with 17,189 (95.9% in the age bracket) attending a public institution.
| Age Bracket | Public School | Private School |
| 3 to 4 Year Olds | 823 (45.8%) | 975 (54.2%) |
| 5 to 9 Year Old | 9,203 (87.1%) | 1,369 (13.0%) |
| 10 to 14 Year Olds | 8,479 (89.5%) | 994 (10.5%) |
| 15 to 17 Year Olds | 5,544 (92.7%) | 436 (7.3%) |
| 18 to 19 Year Olds | 7,710 (90.7%) | 788 (9.3%) |
| 20 to 24 Year Olds | 17,189 (95.9%) | 743 (4.1%) |
| 25 to 34 Year Olds | 3,799 (88.5%) | 491 (11.5%) |
| 35 Years and over | 1,701 (78.3%) | 471 (21.7%) |
| Total | 54,461 (89.7%) | 6,254 (10.3%) |
Educational Attainment by Field of Study in Boone County
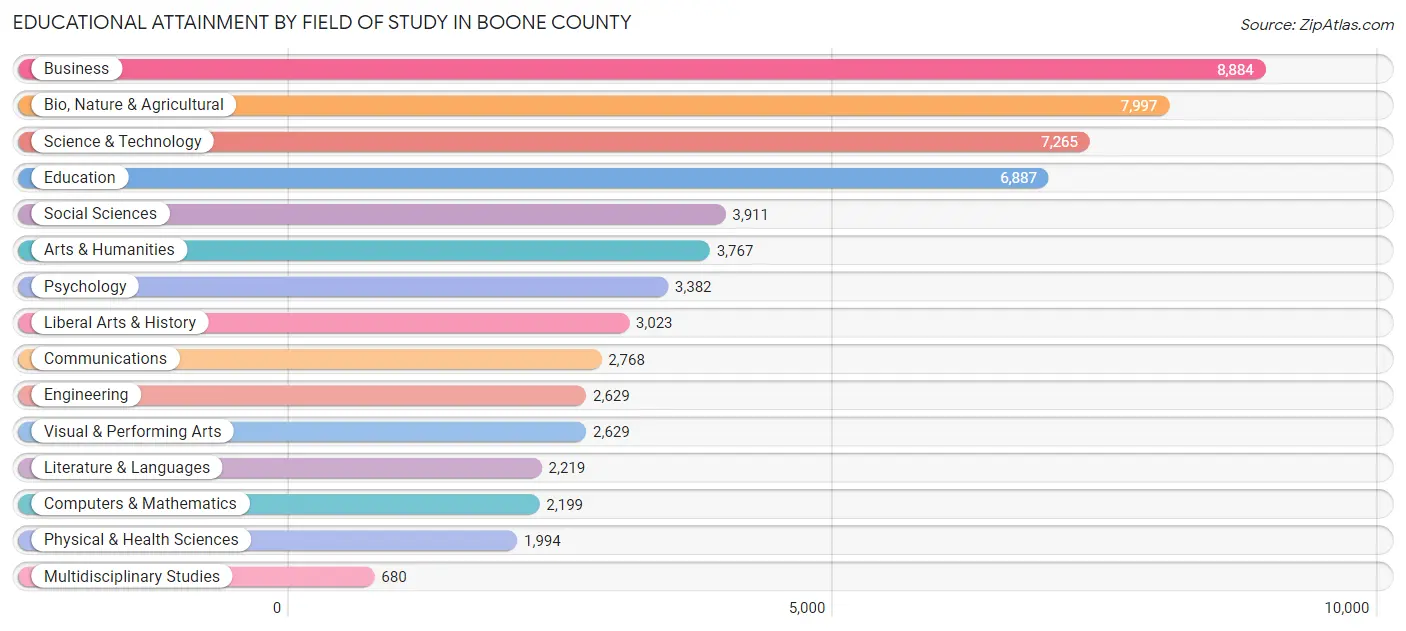
Business (8,884 | 14.7%), bio, nature & agricultural (7,997 | 13.3%), science & technology (7,265 | 12.1%), education (6,887 | 11.4%), and social sciences (3,911 | 6.5%) are the most common fields of study among 60,234 individuals in Boone County who have obtained a bachelor's degree or higher.
| Field of Study | # Graduates | % Graduates |
| Computers & Mathematics | 2,199 | 3.6% |
| Bio, Nature & Agricultural | 7,997 | 13.3% |
| Physical & Health Sciences | 1,994 | 3.3% |
| Psychology | 3,382 | 5.6% |
| Social Sciences | 3,911 | 6.5% |
| Engineering | 2,629 | 4.4% |
| Multidisciplinary Studies | 680 | 1.1% |
| Science & Technology | 7,265 | 12.1% |
| Business | 8,884 | 14.7% |
| Education | 6,887 | 11.4% |
| Literature & Languages | 2,219 | 3.7% |
| Liberal Arts & History | 3,023 | 5.0% |
| Visual & Performing Arts | 2,629 | 4.4% |
| Communications | 2,768 | 4.6% |
| Arts & Humanities | 3,767 | 6.2% |
| Total | 60,234 | 100.0% |
Transportation & Commute in Boone County
Vehicle Availability by Sex in Boone County
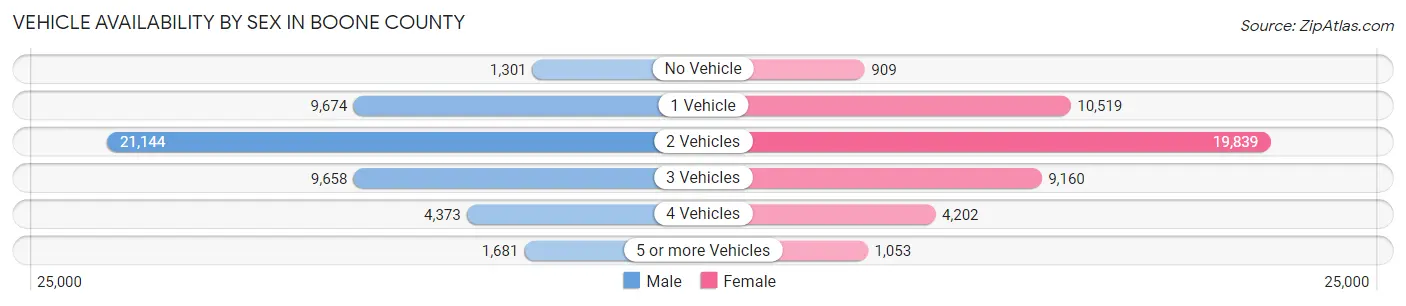
The most prevalent vehicle ownership categories in Boone County are males with 2 vehicles (21,144, accounting for 44.2%) and females with 2 vehicles (19,839, making up 46.3%).
| Vehicles Available | Male | Female |
| No Vehicle | 1,301 (2.7%) | 909 (2.0%) |
| 1 Vehicle | 9,674 (20.2%) | 10,519 (23.0%) |
| 2 Vehicles | 21,144 (44.2%) | 19,839 (43.4%) |
| 3 Vehicles | 9,658 (20.2%) | 9,160 (20.1%) |
| 4 Vehicles | 4,373 (9.1%) | 4,202 (9.2%) |
| 5 or more Vehicles | 1,681 (3.5%) | 1,053 (2.3%) |
| Total | 47,831 (100.0%) | 45,682 (100.0%) |
Commute Time in Boone County
The most frequently occuring commute durations in Boone County are 15 to 19 minutes (22,737 commuters, 25.9%), 10 to 14 minutes (18,610 commuters, 21.1%), and 20 to 24 minutes (13,405 commuters, 15.2%).
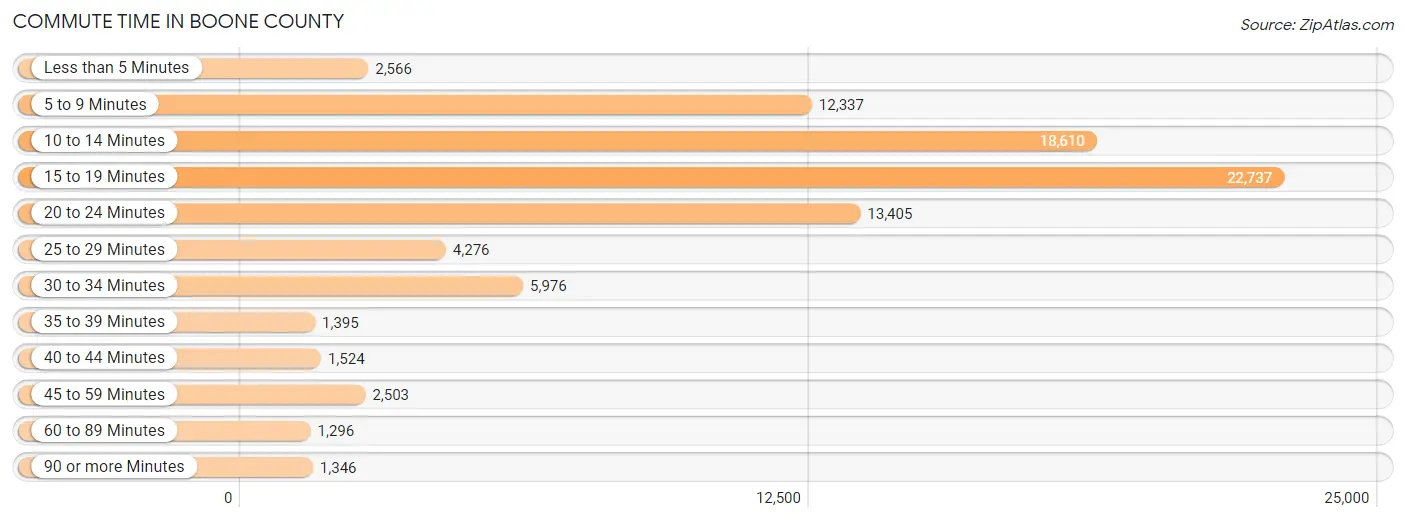
| Commute Time | # Commuters | % Commuters |
| Less than 5 Minutes | 2,566 | 2.9% |
| 5 to 9 Minutes | 12,337 | 14.0% |
| 10 to 14 Minutes | 18,610 | 21.1% |
| 15 to 19 Minutes | 22,737 | 25.9% |
| 20 to 24 Minutes | 13,405 | 15.2% |
| 25 to 29 Minutes | 4,276 | 4.9% |
| 30 to 34 Minutes | 5,976 | 6.8% |
| 35 to 39 Minutes | 1,395 | 1.6% |
| 40 to 44 Minutes | 1,524 | 1.7% |
| 45 to 59 Minutes | 2,503 | 2.9% |
| 60 to 89 Minutes | 1,296 | 1.5% |
| 90 or more Minutes | 1,346 | 1.5% |
Commute Time by Sex in Boone County
The most common commute times in Boone County are 15 to 19 minutes (10,985 commuters, 24.2%) for males and 15 to 19 minutes (11,752 commuters, 27.6%) for females.
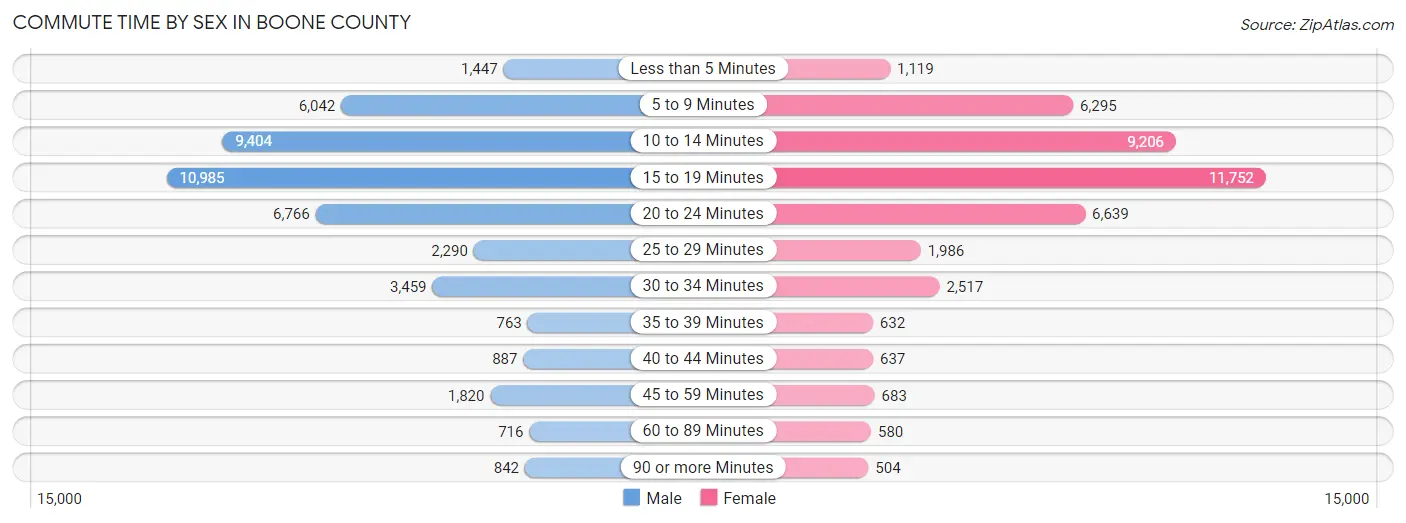
| Commute Time | Male | Female |
| Less than 5 Minutes | 1,447 (3.2%) | 1,119 (2.6%) |
| 5 to 9 Minutes | 6,042 (13.3%) | 6,295 (14.8%) |
| 10 to 14 Minutes | 9,404 (20.7%) | 9,206 (21.6%) |
| 15 to 19 Minutes | 10,985 (24.2%) | 11,752 (27.6%) |
| 20 to 24 Minutes | 6,766 (14.9%) | 6,639 (15.6%) |
| 25 to 29 Minutes | 2,290 (5.0%) | 1,986 (4.7%) |
| 30 to 34 Minutes | 3,459 (7.6%) | 2,517 (5.9%) |
| 35 to 39 Minutes | 763 (1.7%) | 632 (1.5%) |
| 40 to 44 Minutes | 887 (1.9%) | 637 (1.5%) |
| 45 to 59 Minutes | 1,820 (4.0%) | 683 (1.6%) |
| 60 to 89 Minutes | 716 (1.6%) | 580 (1.4%) |
| 90 or more Minutes | 842 (1.8%) | 504 (1.2%) |
Time of Departure to Work by Sex in Boone County
The most frequent times of departure to work in Boone County are 7:30 AM to 7:59 AM (6,899, 15.2%) for males and 7:30 AM to 7:59 AM (8,694, 20.4%) for females.
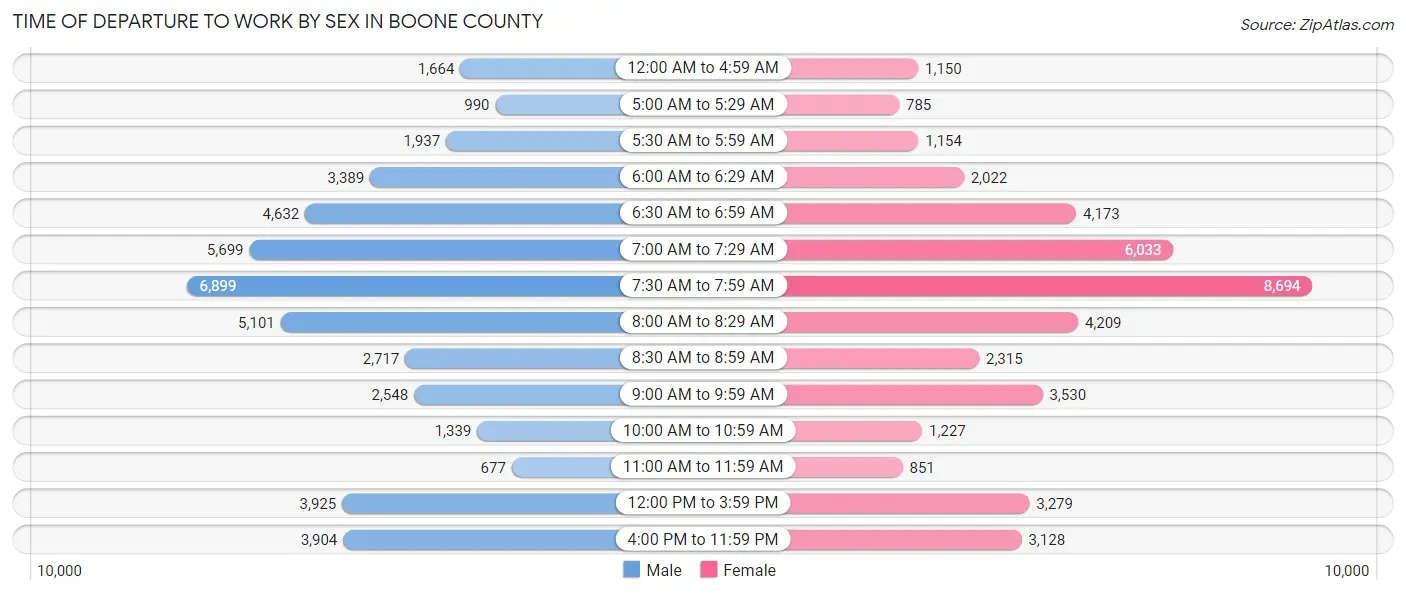
| Time of Departure | Male | Female |
| 12:00 AM to 4:59 AM | 1,664 (3.7%) | 1,150 (2.7%) |
| 5:00 AM to 5:29 AM | 990 (2.2%) | 785 (1.8%) |
| 5:30 AM to 5:59 AM | 1,937 (4.3%) | 1,154 (2.7%) |
| 6:00 AM to 6:29 AM | 3,389 (7.5%) | 2,022 (4.8%) |
| 6:30 AM to 6:59 AM | 4,632 (10.2%) | 4,173 (9.8%) |
| 7:00 AM to 7:29 AM | 5,699 (12.6%) | 6,033 (14.2%) |
| 7:30 AM to 7:59 AM | 6,899 (15.2%) | 8,694 (20.4%) |
| 8:00 AM to 8:29 AM | 5,101 (11.2%) | 4,209 (9.9%) |
| 8:30 AM to 8:59 AM | 2,717 (6.0%) | 2,315 (5.4%) |
| 9:00 AM to 9:59 AM | 2,548 (5.6%) | 3,530 (8.3%) |
| 10:00 AM to 10:59 AM | 1,339 (2.9%) | 1,227 (2.9%) |
| 11:00 AM to 11:59 AM | 677 (1.5%) | 851 (2.0%) |
| 12:00 PM to 3:59 PM | 3,925 (8.6%) | 3,279 (7.7%) |
| 4:00 PM to 11:59 PM | 3,904 (8.6%) | 3,128 (7.3%) |
| Total | 45,421 (100.0%) | 42,550 (100.0%) |
Housing Occupancy in Boone County
Occupancy by Ownership in Boone County
Of the total 74,269 dwellings in Boone County, owner-occupied units account for 42,753 (57.6%), while renter-occupied units make up 31,516 (42.4%).
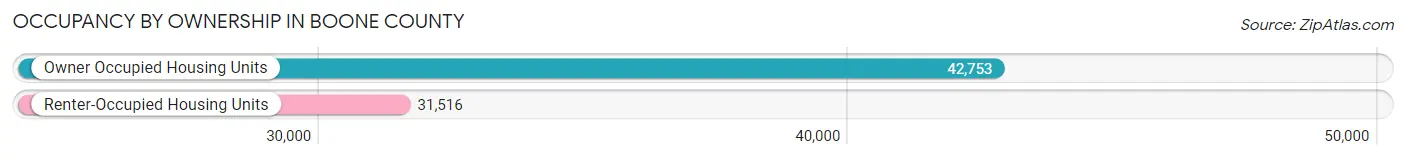
| Occupancy | # Housing Units | % Housing Units |
| Owner Occupied Housing Units | 42,753 | 57.6% |
| Renter-Occupied Housing Units | 31,516 | 42.4% |
| Total Occupied Housing Units | 74,269 | 100.0% |
Occupancy by Household Size in Boone County
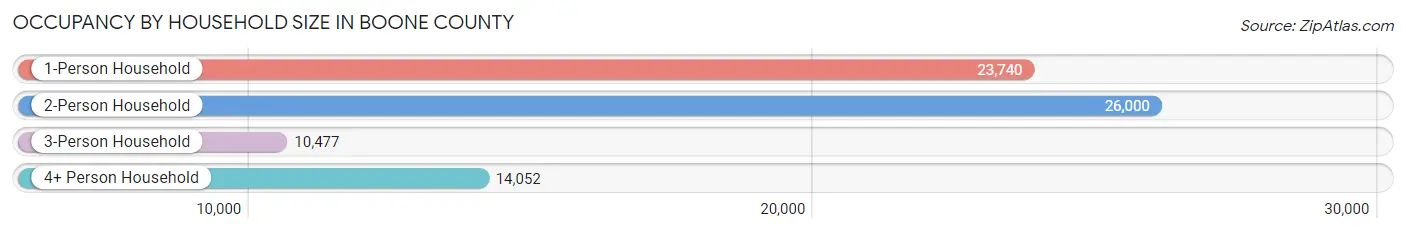
| Household Size | # Housing Units | % Housing Units |
| 1-Person Household | 23,740 | 32.0% |
| 2-Person Household | 26,000 | 35.0% |
| 3-Person Household | 10,477 | 14.1% |
| 4+ Person Household | 14,052 | 18.9% |
| Total Housing Units | 74,269 | 100.0% |
Occupancy by Ownership by Household Size in Boone County
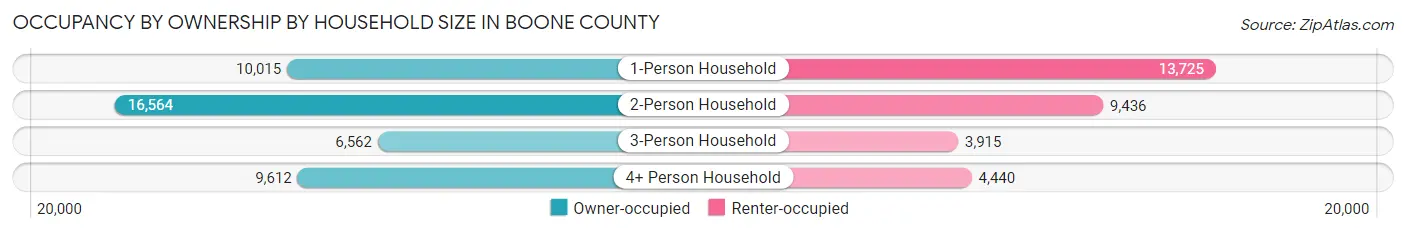
| Household Size | Owner-occupied | Renter-occupied |
| 1-Person Household | 10,015 (42.2%) | 13,725 (57.8%) |
| 2-Person Household | 16,564 (63.7%) | 9,436 (36.3%) |
| 3-Person Household | 6,562 (62.6%) | 3,915 (37.4%) |
| 4+ Person Household | 9,612 (68.4%) | 4,440 (31.6%) |
| Total Housing Units | 42,753 (57.6%) | 31,516 (42.4%) |
Occupancy by Educational Attainment in Boone County
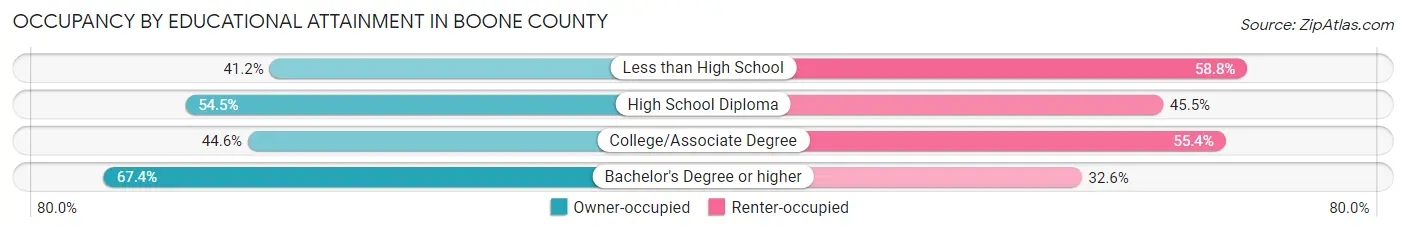
| Household Size | Owner-occupied | Renter-occupied |
| Less than High School | 1,140 (41.2%) | 1,630 (58.8%) |
| High School Diploma | 7,255 (54.5%) | 6,053 (45.5%) |
| College/Associate Degree | 9,512 (44.6%) | 11,826 (55.4%) |
| Bachelor's Degree or higher | 24,846 (67.4%) | 12,007 (32.6%) |
Occupancy by Age of Householder in Boone County
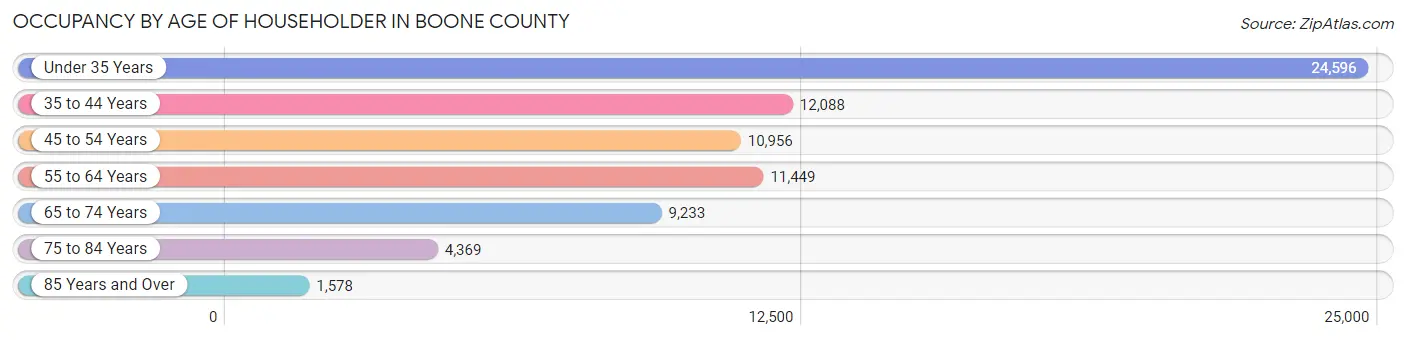
| Age Bracket | # Households | % Households |
| Under 35 Years | 24,596 | 33.1% |
| 35 to 44 Years | 12,088 | 16.3% |
| 45 to 54 Years | 10,956 | 14.7% |
| 55 to 64 Years | 11,449 | 15.4% |
| 65 to 74 Years | 9,233 | 12.4% |
| 75 to 84 Years | 4,369 | 5.9% |
| 85 Years and Over | 1,578 | 2.1% |
| Total | 74,269 | 100.0% |
Housing Finances in Boone County
Median Income by Occupancy in Boone County
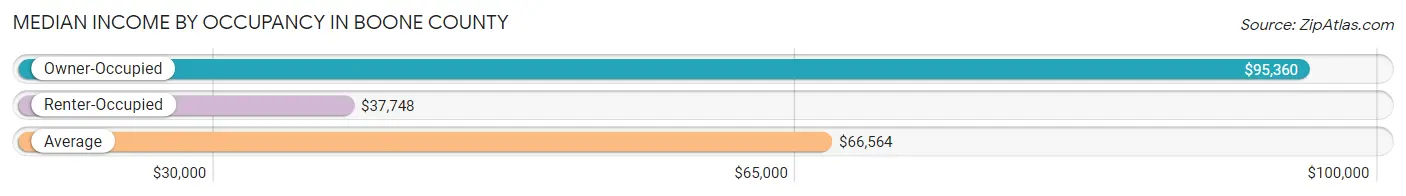
| Occupancy Type | # Households | Median Income |
| Owner-Occupied | 42,753 (57.6%) | $95,360 |
| Renter-Occupied | 31,516 (42.4%) | $37,748 |
| Average | 74,269 (100.0%) | $66,564 |
Occupancy by Householder Income Bracket in Boone County
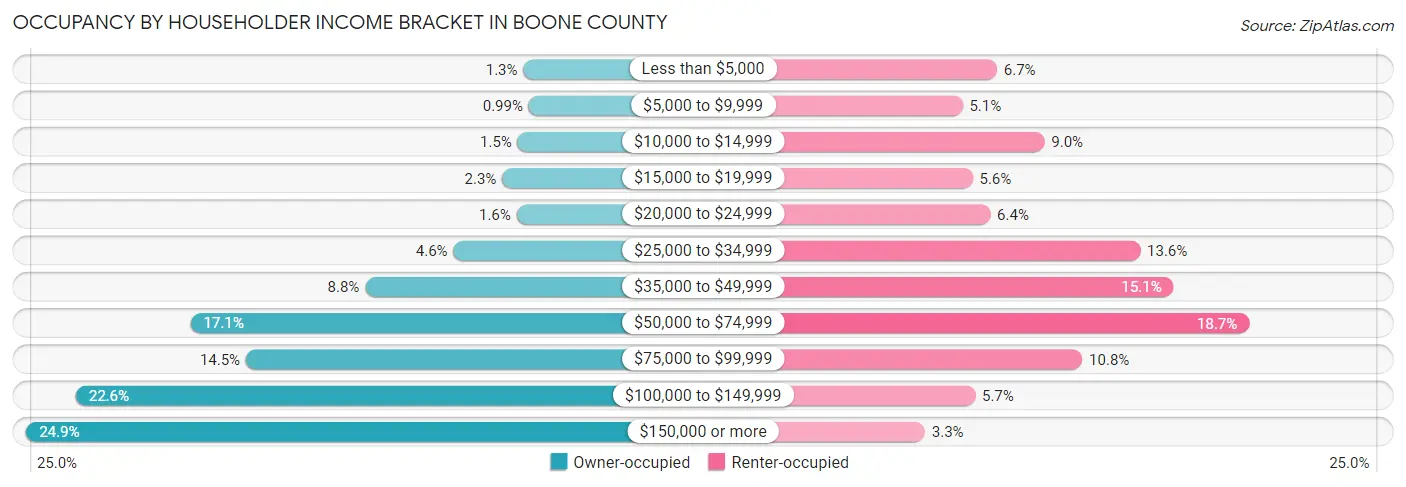
| Income Bracket | Owner-occupied | Renter-occupied |
| Less than $5,000 | 535 (1.3%) | 2,120 (6.7%) |
| $5,000 to $9,999 | 423 (1.0%) | 1,605 (5.1%) |
| $10,000 to $14,999 | 648 (1.5%) | 2,834 (9.0%) |
| $15,000 to $19,999 | 967 (2.3%) | 1,755 (5.6%) |
| $20,000 to $24,999 | 673 (1.6%) | 2,021 (6.4%) |
| $25,000 to $34,999 | 1,960 (4.6%) | 4,269 (13.6%) |
| $35,000 to $49,999 | 3,755 (8.8%) | 4,772 (15.1%) |
| $50,000 to $74,999 | 7,312 (17.1%) | 5,906 (18.7%) |
| $75,000 to $99,999 | 6,182 (14.5%) | 3,402 (10.8%) |
| $100,000 to $149,999 | 9,645 (22.6%) | 1,793 (5.7%) |
| $150,000 or more | 10,653 (24.9%) | 1,039 (3.3%) |
| Total | 42,753 (100.0%) | 31,516 (100.0%) |
Monthly Housing Cost Tiers in Boone County
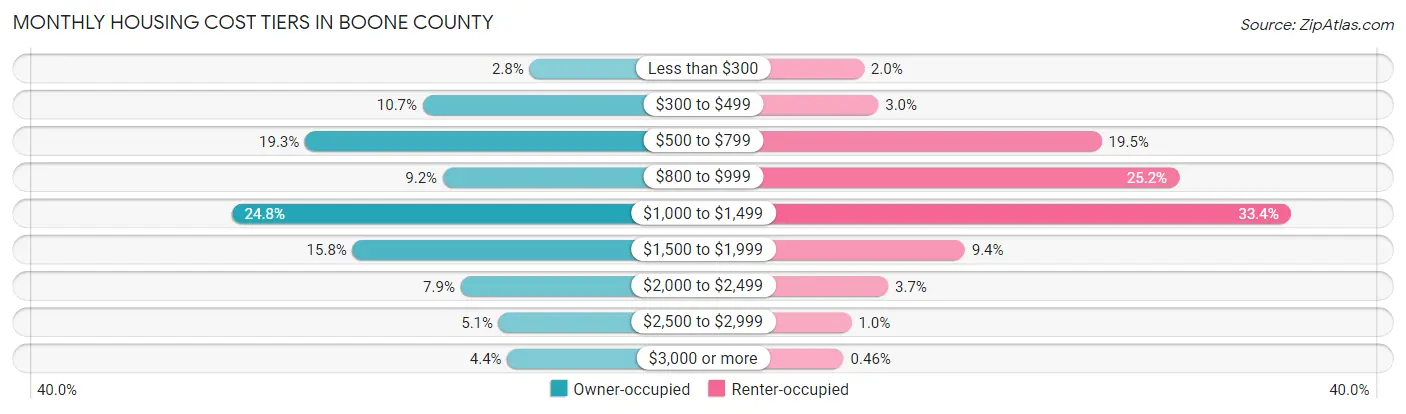
| Monthly Cost | Owner-occupied | Renter-occupied |
| Less than $300 | 1,201 (2.8%) | 615 (1.9%) |
| $300 to $499 | 4,562 (10.7%) | 950 (3.0%) |
| $500 to $799 | 8,269 (19.3%) | 6,132 (19.5%) |
| $800 to $999 | 3,929 (9.2%) | 7,927 (25.2%) |
| $1,000 to $1,499 | 10,581 (24.7%) | 10,516 (33.4%) |
| $1,500 to $1,999 | 6,773 (15.8%) | 2,955 (9.4%) |
| $2,000 to $2,499 | 3,370 (7.9%) | 1,175 (3.7%) |
| $2,500 to $2,999 | 2,169 (5.1%) | 327 (1.0%) |
| $3,000 or more | 1,899 (4.4%) | 144 (0.5%) |
| Total | 42,753 (100.0%) | 31,516 (100.0%) |
Physical Housing Characteristics in Boone County
Housing Structures in Boone County
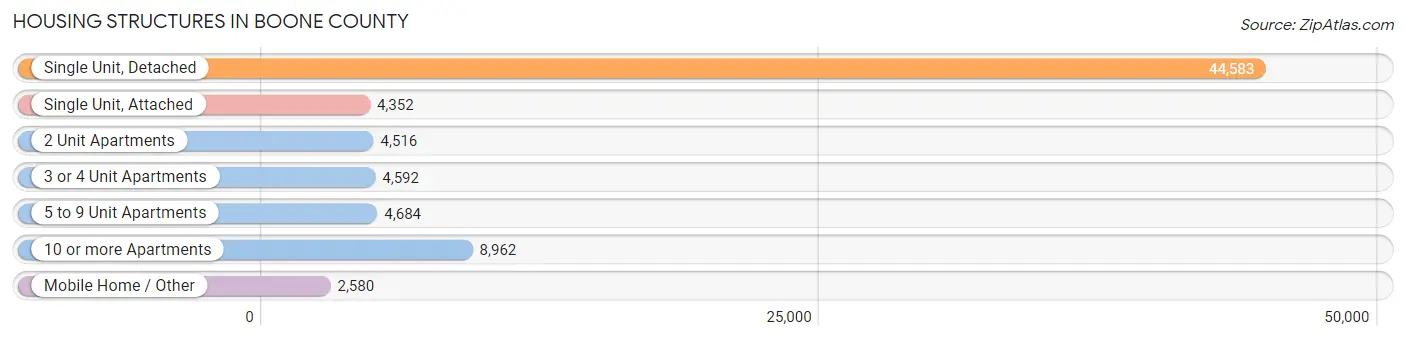
| Structure Type | # Housing Units | % Housing Units |
| Single Unit, Detached | 44,583 | 60.0% |
| Single Unit, Attached | 4,352 | 5.9% |
| 2 Unit Apartments | 4,516 | 6.1% |
| 3 or 4 Unit Apartments | 4,592 | 6.2% |
| 5 to 9 Unit Apartments | 4,684 | 6.3% |
| 10 or more Apartments | 8,962 | 12.1% |
| Mobile Home / Other | 2,580 | 3.5% |
| Total | 74,269 | 100.0% |
Housing Structures by Occupancy in Boone County
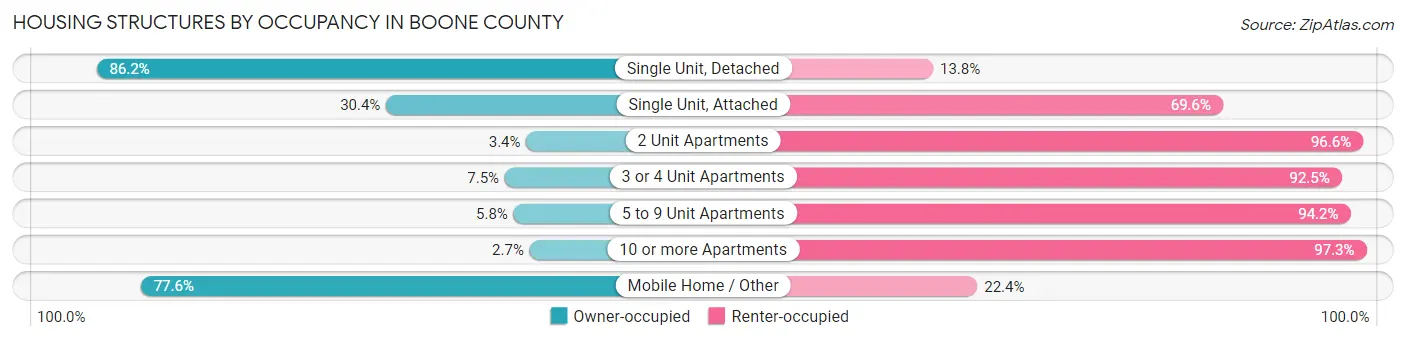
| Structure Type | Owner-occupied | Renter-occupied |
| Single Unit, Detached | 38,411 (86.2%) | 6,172 (13.8%) |
| Single Unit, Attached | 1,322 (30.4%) | 3,030 (69.6%) |
| 2 Unit Apartments | 153 (3.4%) | 4,363 (96.6%) |
| 3 or 4 Unit Apartments | 345 (7.5%) | 4,247 (92.5%) |
| 5 to 9 Unit Apartments | 273 (5.8%) | 4,411 (94.2%) |
| 10 or more Apartments | 246 (2.7%) | 8,716 (97.3%) |
| Mobile Home / Other | 2,003 (77.6%) | 577 (22.4%) |
| Total | 42,753 (57.6%) | 31,516 (42.4%) |
Housing Structures by Number of Rooms in Boone County
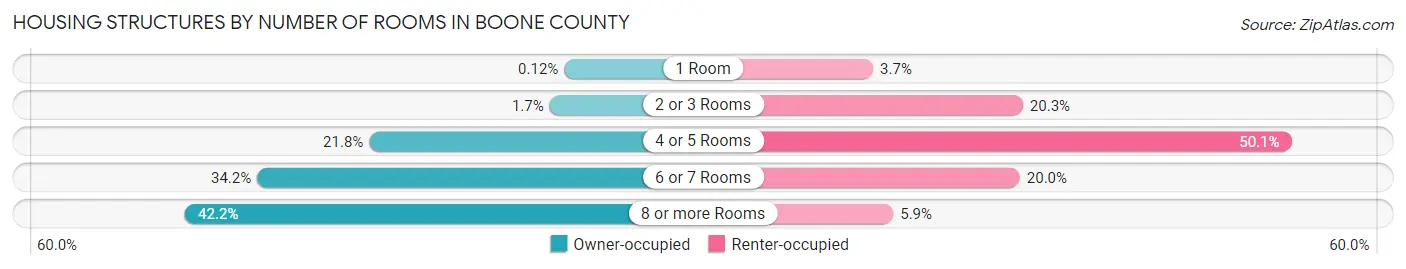
| Number of Rooms | Owner-occupied | Renter-occupied |
| 1 Room | 50 (0.1%) | 1,163 (3.7%) |
| 2 or 3 Rooms | 746 (1.7%) | 6,401 (20.3%) |
| 4 or 5 Rooms | 9,302 (21.8%) | 15,790 (50.1%) |
| 6 or 7 Rooms | 14,623 (34.2%) | 6,295 (20.0%) |
| 8 or more Rooms | 18,032 (42.2%) | 1,867 (5.9%) |
| Total | 42,753 (100.0%) | 31,516 (100.0%) |
Housing Structure by Heating Type in Boone County
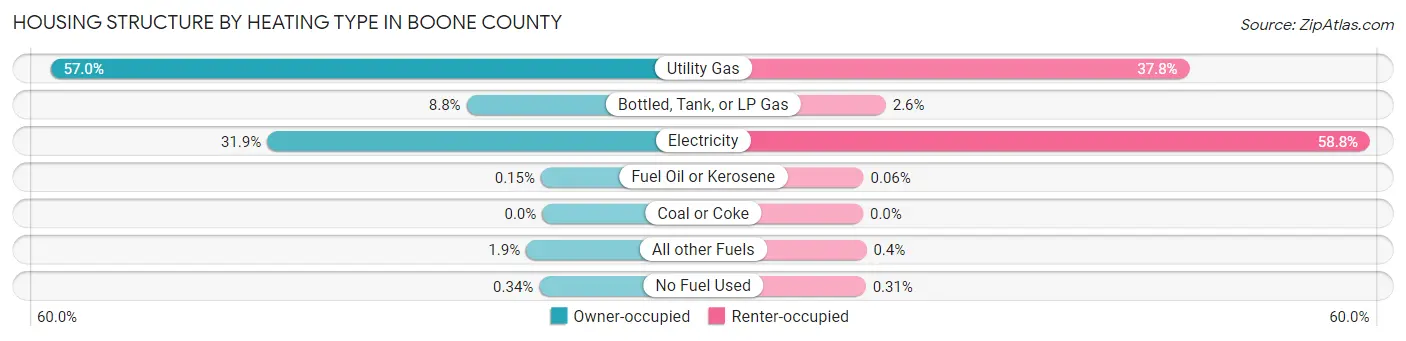
| Heating Type | Owner-occupied | Renter-occupied |
| Utility Gas | 24,363 (57.0%) | 11,925 (37.8%) |
| Bottled, Tank, or LP Gas | 3,748 (8.8%) | 832 (2.6%) |
| Electricity | 13,633 (31.9%) | 18,518 (58.8%) |
| Fuel Oil or Kerosene | 64 (0.2%) | 18 (0.1%) |
| Coal or Coke | 0 (0.0%) | 0 (0.0%) |
| All other Fuels | 798 (1.9%) | 126 (0.4%) |
| No Fuel Used | 147 (0.3%) | 97 (0.3%) |
| Total | 42,753 (100.0%) | 31,516 (100.0%) |
Household Vehicle Usage in Boone County
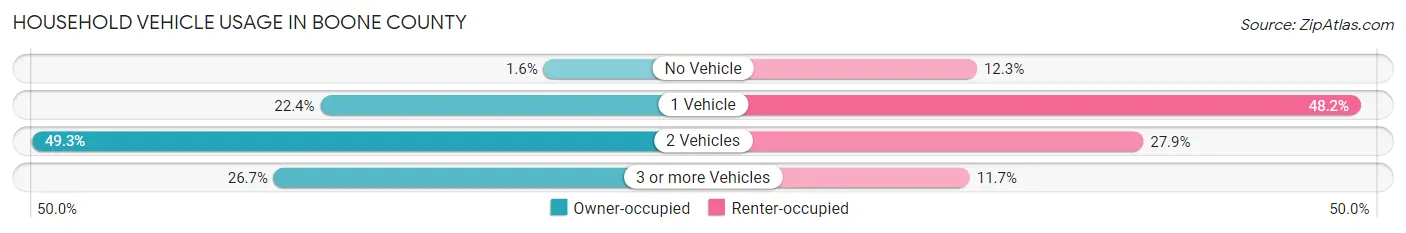
| Vehicles per Household | Owner-occupied | Renter-occupied |
| No Vehicle | 668 (1.6%) | 3,886 (12.3%) |
| 1 Vehicle | 9,571 (22.4%) | 15,179 (48.2%) |
| 2 Vehicles | 21,082 (49.3%) | 8,776 (27.9%) |
| 3 or more Vehicles | 11,432 (26.7%) | 3,675 (11.7%) |
| Total | 42,753 (100.0%) | 31,516 (100.0%) |
Real Estate & Mortgages in Boone County
Real Estate and Mortgage Overview in Boone County
| Characteristic | Without Mortgage | With Mortgage |
| Housing Units | 15,107 | 27,646 |
| Median Property Value | $227,500 | $242,800 |
| Median Household Income | $71,978 | $7,637 |
| Monthly Housing Costs | $561 | $1,868 |
| Real Estate Taxes | $2,138 | $486 |
Property Value by Mortgage Status in Boone County
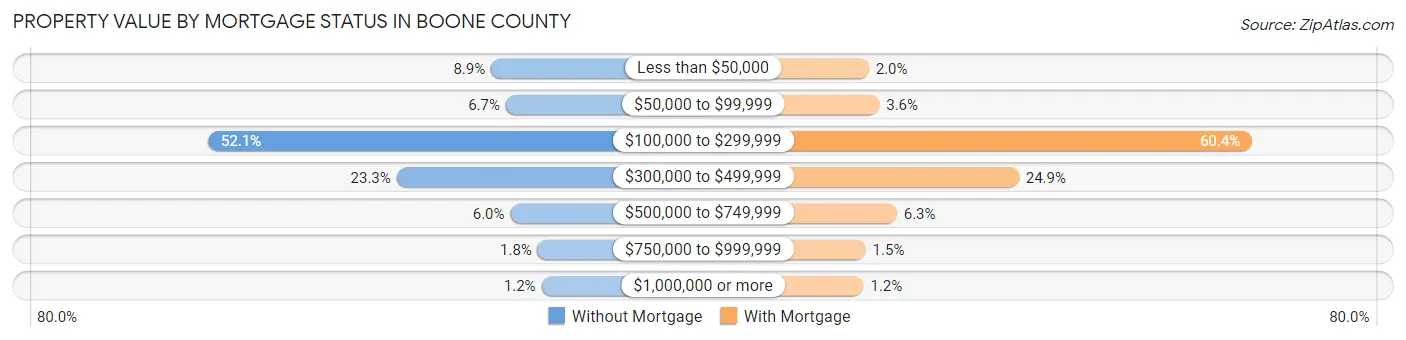
| Property Value | Without Mortgage | With Mortgage |
| Less than $50,000 | 1,347 (8.9%) | 558 (2.0%) |
| $50,000 to $99,999 | 1,008 (6.7%) | 1,000 (3.6%) |
| $100,000 to $299,999 | 7,865 (52.1%) | 16,709 (60.4%) |
| $300,000 to $499,999 | 3,521 (23.3%) | 6,879 (24.9%) |
| $500,000 to $749,999 | 903 (6.0%) | 1,737 (6.3%) |
| $750,000 to $999,999 | 275 (1.8%) | 426 (1.5%) |
| $1,000,000 or more | 188 (1.2%) | 337 (1.2%) |
| Total | 15,107 (100.0%) | 27,646 (100.0%) |
Household Income by Mortgage Status in Boone County
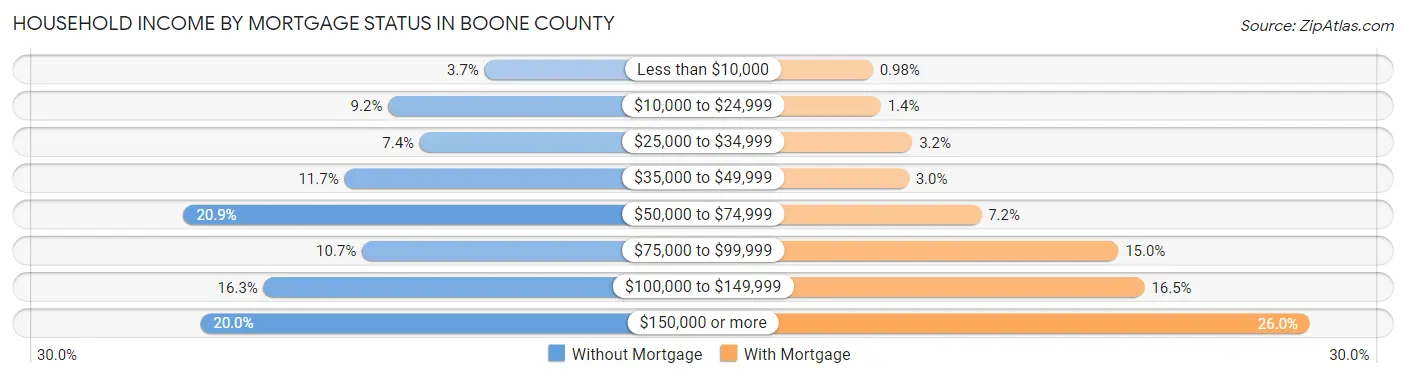
| Household Income | Without Mortgage | With Mortgage |
| Less than $10,000 | 560 (3.7%) | 271 (1.0%) |
| $10,000 to $24,999 | 1,393 (9.2%) | 398 (1.4%) |
| $25,000 to $34,999 | 1,119 (7.4%) | 895 (3.2%) |
| $35,000 to $49,999 | 1,771 (11.7%) | 841 (3.0%) |
| $50,000 to $74,999 | 3,161 (20.9%) | 1,984 (7.2%) |
| $75,000 to $99,999 | 1,618 (10.7%) | 4,151 (15.0%) |
| $100,000 to $149,999 | 2,469 (16.3%) | 4,564 (16.5%) |
| $150,000 or more | 3,016 (20.0%) | 7,176 (26.0%) |
| Total | 15,107 (100.0%) | 27,646 (100.0%) |
Property Value to Household Income Ratio in Boone County
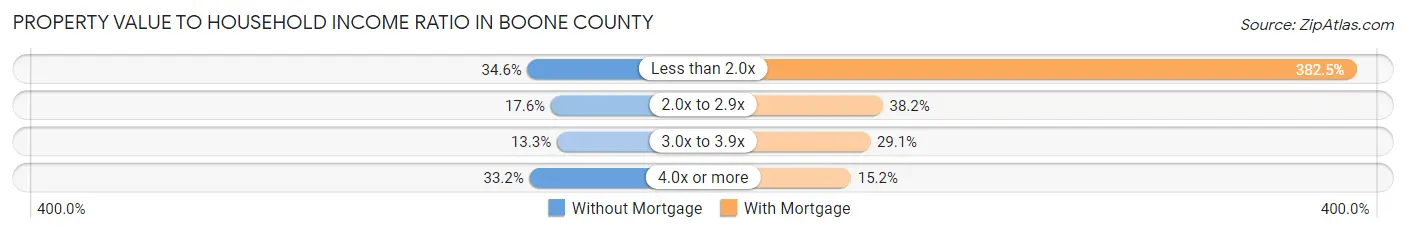
| Value-to-Income Ratio | Without Mortgage | With Mortgage |
| Less than 2.0x | 5,220 (34.5%) | 105,731 (382.5%) |
| 2.0x to 2.9x | 2,664 (17.6%) | 10,560 (38.2%) |
| 3.0x to 3.9x | 2,003 (13.3%) | 8,035 (29.1%) |
| 4.0x or more | 5,013 (33.2%) | 4,197 (15.2%) |
| Total | 15,107 (100.0%) | 27,646 (100.0%) |
Real Estate Taxes by Mortgage Status in Boone County
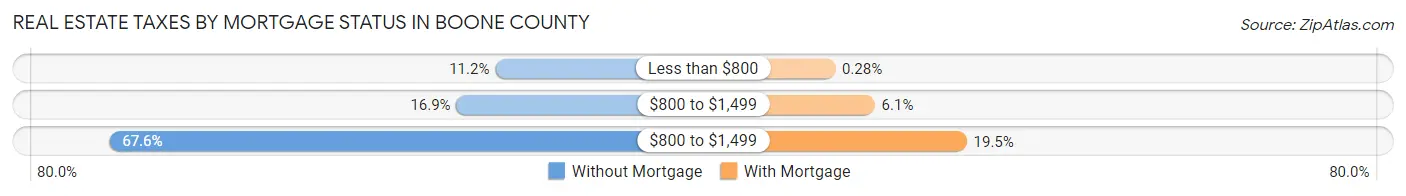
| Property Taxes | Without Mortgage | With Mortgage |
| Less than $800 | 1,697 (11.2%) | 77 (0.3%) |
| $800 to $1,499 | 2,553 (16.9%) | 1,681 (6.1%) |
| $800 to $1,499 | 10,215 (67.6%) | 5,397 (19.5%) |
| Total | 15,107 (100.0%) | 27,646 (100.0%) |
Health & Disability in Boone County
Health Insurance Coverage by Age in Boone County
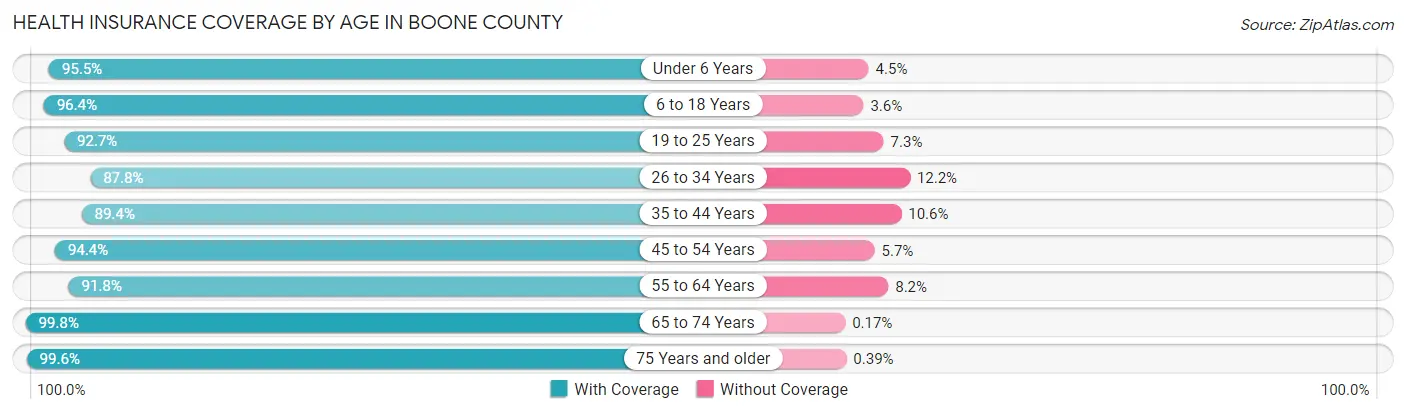
| Age Bracket | With Coverage | Without Coverage |
| Under 6 Years | 11,705 (95.5%) | 557 (4.5%) |
| 6 to 18 Years | 27,155 (96.4%) | 1,005 (3.6%) |
| 19 to 25 Years | 32,801 (92.7%) | 2,597 (7.3%) |
| 26 to 34 Years | 20,800 (87.8%) | 2,900 (12.2%) |
| 35 to 44 Years | 19,984 (89.4%) | 2,376 (10.6%) |
| 45 to 54 Years | 17,422 (94.4%) | 1,044 (5.7%) |
| 55 to 64 Years | 17,729 (91.8%) | 1,583 (8.2%) |
| 65 to 74 Years | 14,405 (99.8%) | 25 (0.2%) |
| 75 Years and older | 8,641 (99.6%) | 34 (0.4%) |
| Total | 170,642 (93.4%) | 12,121 (6.6%) |
Health Insurance Coverage by Citizenship Status in Boone County
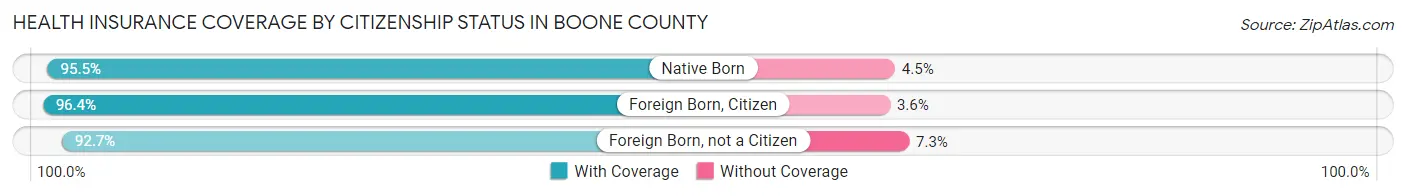
| Citizenship Status | With Coverage | Without Coverage |
| Native Born | 11,705 (95.5%) | 557 (4.5%) |
| Foreign Born, Citizen | 27,155 (96.4%) | 1,005 (3.6%) |
| Foreign Born, not a Citizen | 32,801 (92.7%) | 2,597 (7.3%) |
Health Insurance Coverage by Household Income in Boone County
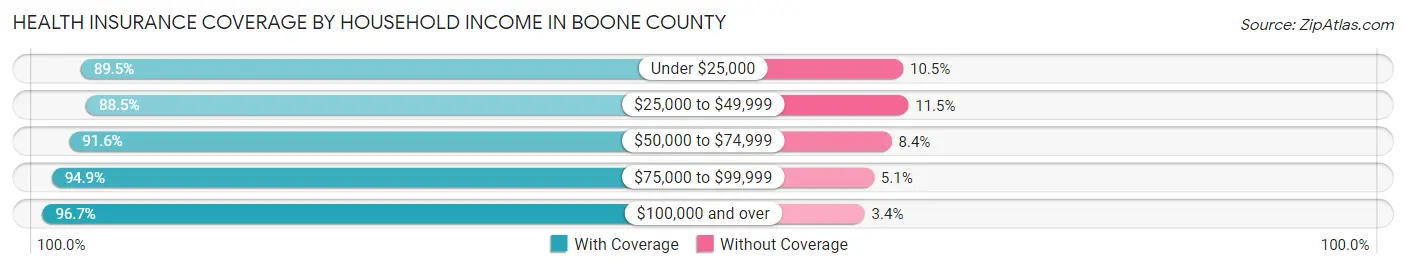
| Household Income | With Coverage | Without Coverage |
| Under $25,000 | 21,898 (89.5%) | 2,579 (10.5%) |
| $25,000 to $49,999 | 25,085 (88.5%) | 3,265 (11.5%) |
| $50,000 to $74,999 | 26,100 (91.6%) | 2,393 (8.4%) |
| $75,000 to $99,999 | 23,458 (94.9%) | 1,255 (5.1%) |
| $100,000 and over | 66,101 (96.7%) | 2,292 (3.4%) |
Public vs Private Health Insurance Coverage by Age in Boone County
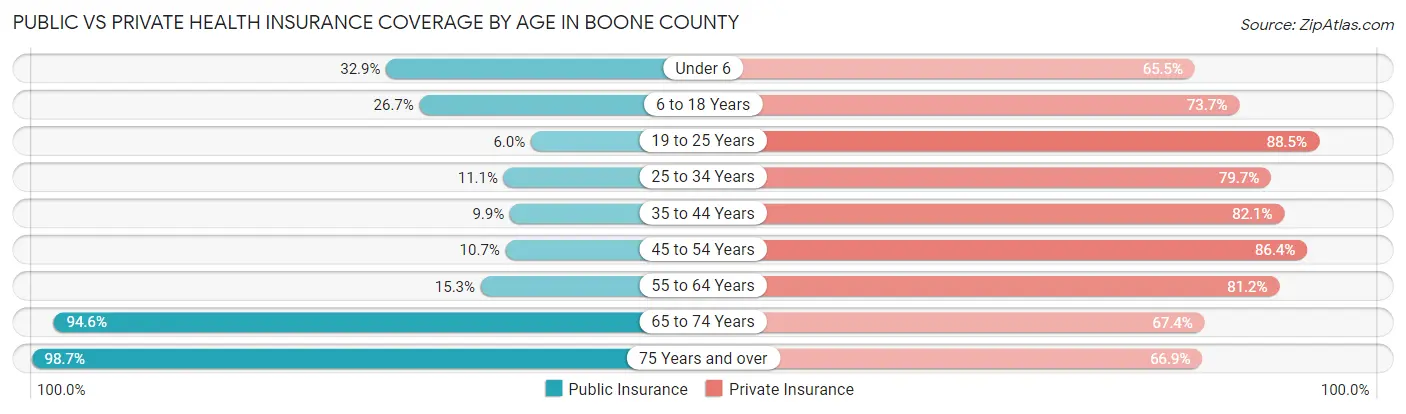
| Age Bracket | Public Insurance | Private Insurance |
| Under 6 | 4,029 (32.9%) | 8,033 (65.5%) |
| 6 to 18 Years | 7,514 (26.7%) | 20,760 (73.7%) |
| 19 to 25 Years | 2,125 (6.0%) | 31,337 (88.5%) |
| 25 to 34 Years | 2,620 (11.1%) | 18,882 (79.7%) |
| 35 to 44 Years | 2,213 (9.9%) | 18,366 (82.1%) |
| 45 to 54 Years | 1,978 (10.7%) | 15,950 (86.4%) |
| 55 to 64 Years | 2,957 (15.3%) | 15,681 (81.2%) |
| 65 to 74 Years | 13,653 (94.6%) | 9,719 (67.3%) |
| 75 Years and over | 8,562 (98.7%) | 5,804 (66.9%) |
| Total | 45,651 (25.0%) | 144,532 (79.1%) |
Disability Status by Sex by Age in Boone County
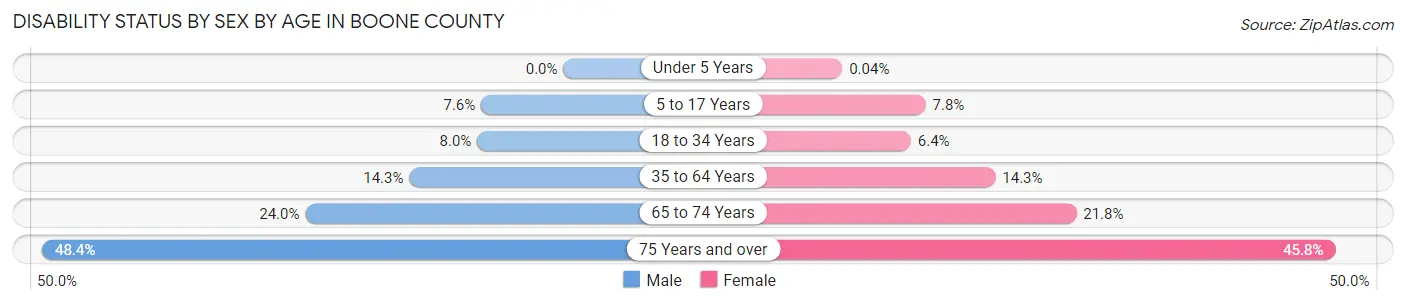
| Age Bracket | Male | Female |
| Under 5 Years | 0 (0.0%) | 2 (0.0%) |
| 5 to 17 Years | 1,059 (7.6%) | 1,001 (7.8%) |
| 18 to 34 Years | 2,394 (8.0%) | 2,099 (6.4%) |
| 35 to 64 Years | 4,221 (14.3%) | 4,364 (14.2%) |
| 65 to 74 Years | 1,640 (23.9%) | 1,650 (21.8%) |
| 75 Years and over | 1,714 (48.4%) | 2,350 (45.8%) |
Disability Class by Sex by Age in Boone County
Disability Class: Hearing Difficulty
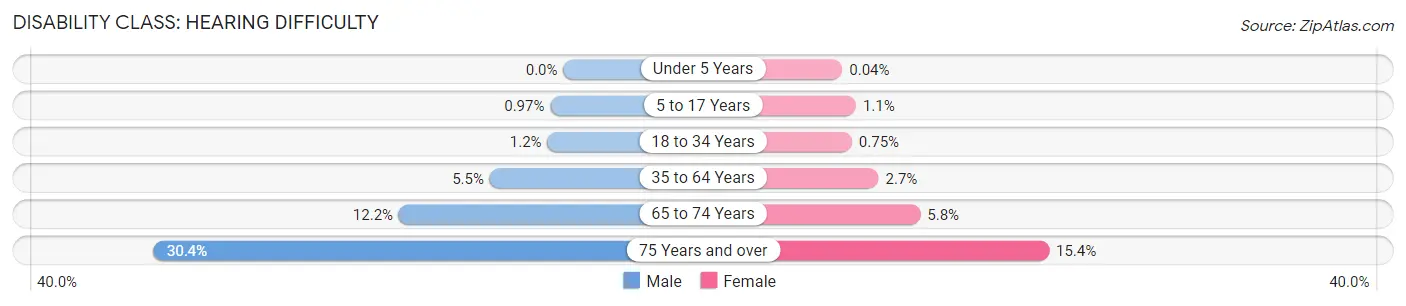
| Age Bracket | Male | Female |
| Under 5 Years | 0 (0.0%) | 2 (0.0%) |
| 5 to 17 Years | 134 (1.0%) | 135 (1.1%) |
| 18 to 34 Years | 352 (1.2%) | 246 (0.7%) |
| 35 to 64 Years | 1,611 (5.5%) | 837 (2.7%) |
| 65 to 74 Years | 836 (12.2%) | 442 (5.8%) |
| 75 Years and over | 1,077 (30.4%) | 790 (15.4%) |
Disability Class: Vision Difficulty
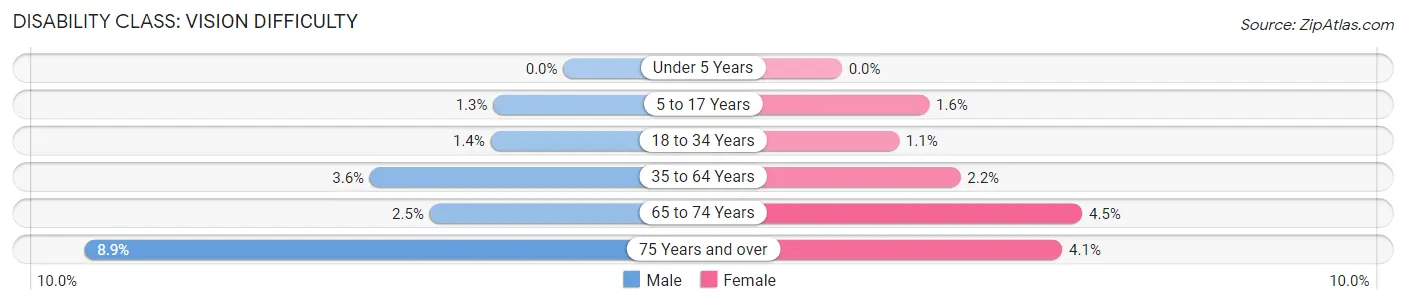
| Age Bracket | Male | Female |
| Under 5 Years | 0 (0.0%) | 0 (0.0%) |
| 5 to 17 Years | 180 (1.3%) | 208 (1.6%) |
| 18 to 34 Years | 405 (1.3%) | 347 (1.1%) |
| 35 to 64 Years | 1,058 (3.6%) | 675 (2.2%) |
| 65 to 74 Years | 170 (2.5%) | 338 (4.5%) |
| 75 Years and over | 315 (8.9%) | 210 (4.1%) |
Disability Class: Cognitive Difficulty
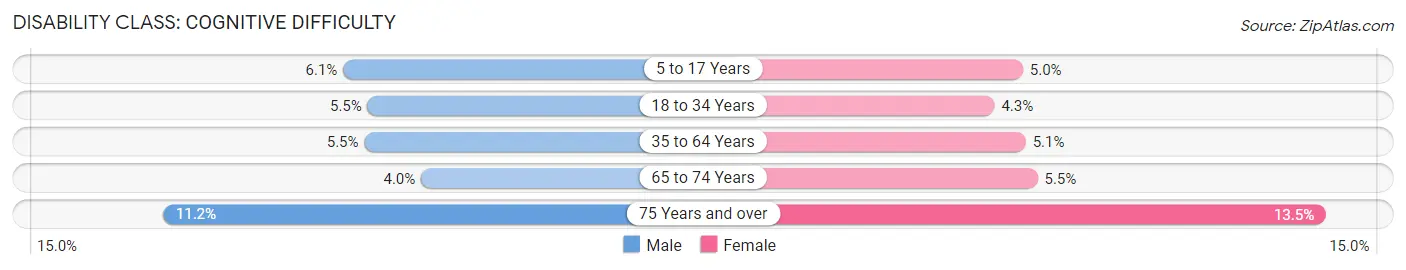
| Age Bracket | Male | Female |
| 5 to 17 Years | 850 (6.1%) | 648 (5.0%) |
| 18 to 34 Years | 1,632 (5.4%) | 1,392 (4.3%) |
| 35 to 64 Years | 1,636 (5.5%) | 1,567 (5.1%) |
| 65 to 74 Years | 271 (4.0%) | 413 (5.4%) |
| 75 Years and over | 395 (11.2%) | 692 (13.5%) |
Disability Class: Ambulatory Difficulty
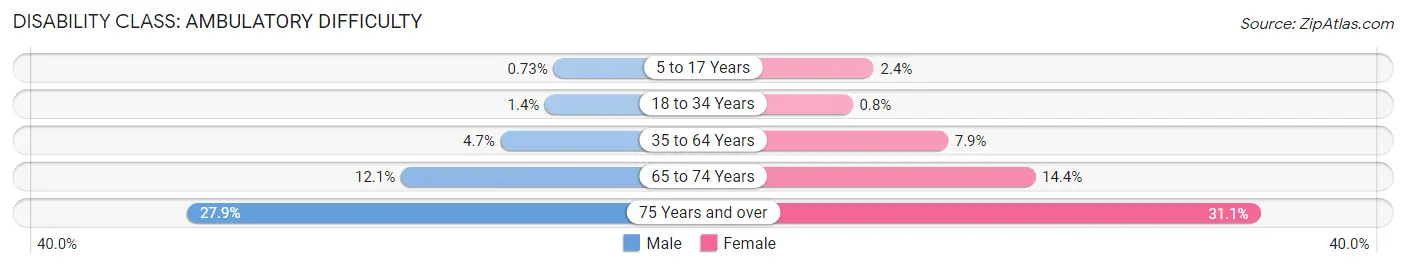
| Age Bracket | Male | Female |
| 5 to 17 Years | 101 (0.7%) | 304 (2.4%) |
| 18 to 34 Years | 405 (1.3%) | 261 (0.8%) |
| 35 to 64 Years | 1,371 (4.6%) | 2,410 (7.9%) |
| 65 to 74 Years | 825 (12.0%) | 1,088 (14.3%) |
| 75 Years and over | 990 (27.9%) | 1,595 (31.1%) |
Disability Class: Self-Care Difficulty
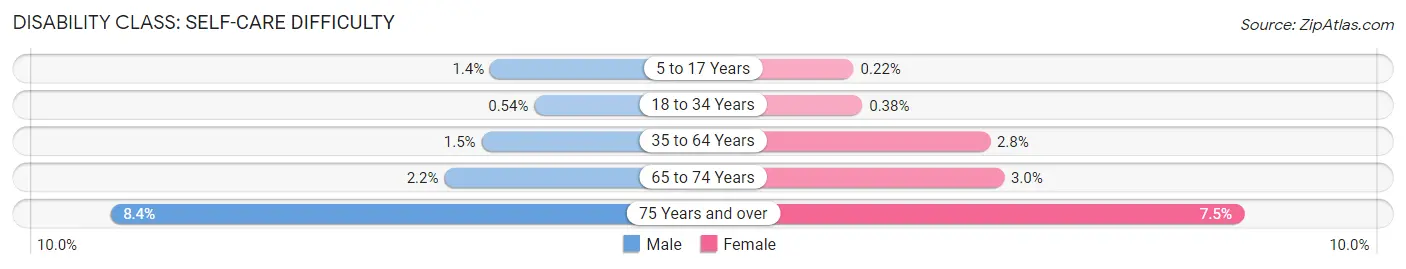
| Age Bracket | Male | Female |
| 5 to 17 Years | 189 (1.4%) | 28 (0.2%) |
| 18 to 34 Years | 163 (0.5%) | 125 (0.4%) |
| 35 to 64 Years | 448 (1.5%) | 843 (2.8%) |
| 65 to 74 Years | 151 (2.2%) | 228 (3.0%) |
| 75 Years and over | 298 (8.4%) | 383 (7.5%) |
Technology Access in Boone County
Computing Device Access in Boone County
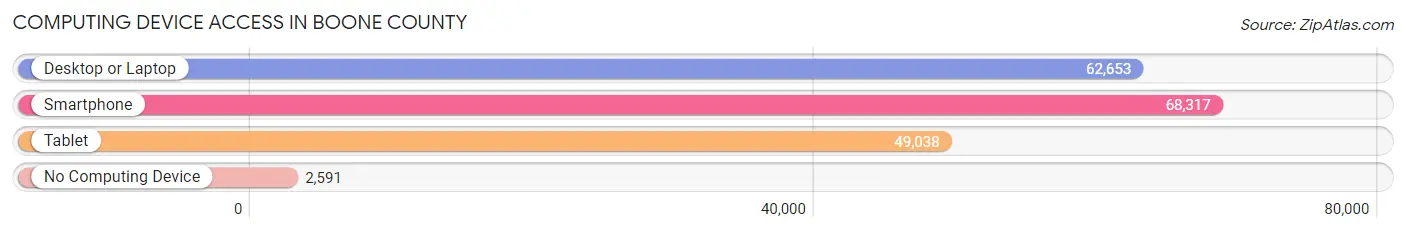
| Device Type | # Households | % Households |
| Desktop or Laptop | 62,653 | 84.4% |
| Smartphone | 68,317 | 92.0% |
| Tablet | 49,038 | 66.0% |
| No Computing Device | 2,591 | 3.5% |
| Total | 74,269 | 100.0% |
Internet Access in Boone County
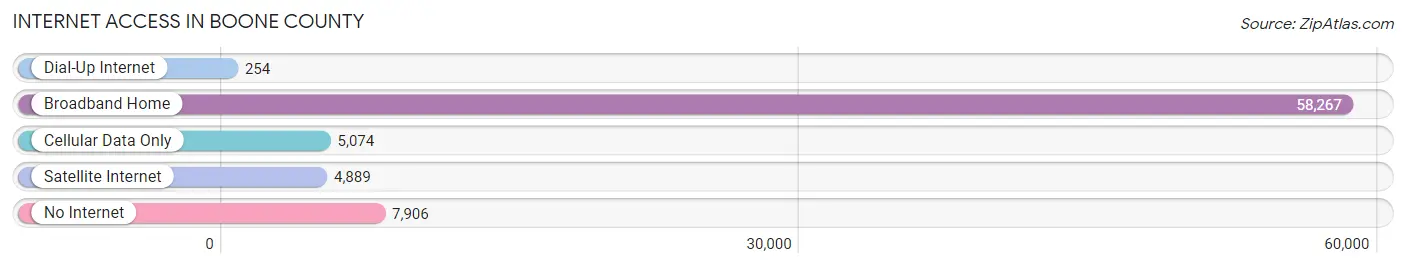
| Internet Type | # Households | % Households |
| Dial-Up Internet | 254 | 0.3% |
| Broadband Home | 58,267 | 78.4% |
| Cellular Data Only | 5,074 | 6.8% |
| Satellite Internet | 4,889 | 6.6% |
| No Internet | 7,906 | 10.6% |
| Total | 74,269 | 100.0% |
Boone County Summary
Boone County, Missouri is located in the central part of the state and is part of the Columbia Metropolitan Statistical Area. It is bordered by Callaway County to the north, Audrain County to the east, Randolph County to the south, and Cooper County to the west. The county seat is Columbia, which is also the state’s fifth-largest city.
Geography
Boone County covers an area of 645 square miles and is located in the Ozark Plateau region of Missouri. The county is mostly hilly and is drained by the Missouri River and its tributaries. The highest point in the county is at an elevation of 1,068 feet, located in the northern part of the county. The county is home to several state parks, including Rock Bridge Memorial State Park, Finger Lakes State Park, and Mark Twain State Park.
Demographics
As of the 2010 census, Boone County had a population of 162,642, making it the sixth-most populous county in Missouri. The racial makeup of the county was 87.3% White, 8.2% Black or African American, 0.5% Native American, 2.2% Asian, 0.2% Pacific Islander, 0.7% from other races, and 1.1% from two or more races. Hispanic or Latino of any race were 2.7% of the population.
Economy
Boone County’s economy is largely based on agriculture, manufacturing, and services. The county’s major agricultural products include corn, soybeans, hay, and livestock. Manufacturing is centered around the production of food products, chemicals, and machinery. The county is also home to several large employers, including the University of Missouri, Columbia College, and Boone Hospital Center.
History
Boone County was established in 1820 and named after Daniel Boone, the famous frontiersman. The county was originally part of the Louisiana Purchase and was home to several Native American tribes, including the Osage, Shawnee, and Delaware. The county was also home to several early settlers, including the Boones, who established a trading post in the area in 1810.
In the early 19th century, Boone County was a major center of the fur trade, and the county seat of Columbia was established in 1821. The county was also home to several Civil War battles, including the Battle of Centralia in 1864. After the war, the county experienced a period of growth and development, with the establishment of several railroads and the University of Missouri in 1839.
Today, Boone County is a thriving community with a diverse economy and a strong sense of history. The county is home to several major employers, including the University of Missouri, Columbia College, and Boone Hospital Center. The county is also home to several state parks, including Rock Bridge Memorial State Park, Finger Lakes State Park, and Mark Twain State Park.
Common Questions
What is Per Capita Income in Boone County?
Per Capita income in Boone County is $37,393.
What is the Median Family Income in Boone County?
Median Family Income in Boone County is $96,219.
What is the Median Household income in Boone County?
Median Household Income in Boone County is $66,564.
What is Income or Wage Gap in Boone County?
Income or Wage Gap in Boone County is 22.4%.
Women in Boone County earn 77.6 cents for every dollar earned by a man.
What is Family Income Deficit in Boone County?
Family Income Deficit in Boone County is $9,415.
Families that are below poverty line in Boone County earn $9,415 less on average than the poverty threshold level.
What is Inequality or Gini Index in Boone County?
Inequality or Gini Index in Boone County is 0.48.
What is the Total Population of Boone County?
Total Population of Boone County is 184,043.
What is the Total Male Population of Boone County?
Total Male Population of Boone County is 89,484.
What is the Total Female Population of Boone County?
Total Female Population of Boone County is 94,559.
What is the Ratio of Males per 100 Females in Boone County?
There are 94.63 Males per 100 Females in Boone County.
What is the Ratio of Females per 100 Males in Boone County?
There are 105.67 Females per 100 Males in Boone County.
What is the Median Population Age in Boone County?
Median Population Age in Boone County is 31.8 Years.
What is the Average Family Size in Boone County
Average Family Size in Boone County is 3.0 People.
What is the Average Household Size in Boone County
Average Household Size in Boone County is 2.4 People.
How Large is the Labor Force in Boone County?
There are 100,984 People in the Labor Forcein in Boone County.
What is the Percentage of People in the Labor Force in Boone County?
66.7% of People are in the Labor Force in Boone County.
What is the Unemployment Rate in Boone County?
Unemployment Rate in Boone County is 3.9%.