Bollinger County, MO Map & Demographics
Bollinger County Map
Bollinger County Overview
$24,647
PER CAPITA INCOME
$73,240
AVG FAMILY INCOME
$52,306
AVG HOUSEHOLD INCOME
43.1%
WAGE / INCOME GAP [ % ]
56.9¢/ $1
WAGE / INCOME GAP [ $ ]
0.40
INEQUALITY / GINI INDEX
10,658
TOTAL POPULATION
5,298
MALE POPULATION
5,360
FEMALE POPULATION
98.84
MALES / 100 FEMALES
101.17
FEMALES / 100 MALES
44.7
MEDIAN AGE
3.5
AVG FAMILY SIZE
2.8
AVG HOUSEHOLD SIZE
4,903
LABOR FORCE [ PEOPLE ]
56.5%
PERCENT IN LABOR FORCE
4.9%
UNEMPLOYMENT RATE
Bollinger County Area Codes
Income in Bollinger County
Income Overview in Bollinger County
Per Capita Income in Bollinger County is $24,647, while median incomes of families and households are $73,240 and $52,306 respectively.
| Characteristic | Number | Measure |
| Per Capita Income | 10,658 | $24,647 |
| Median Family Income | 2,539 | $73,240 |
| Mean Family Income | 2,539 | $76,616 |
| Median Household Income | 3,791 | $52,306 |
| Mean Household Income | 3,791 | $62,011 |
| Income Deficit | 2,539 | $0 |
| Wage / Income Gap (%) | 10,658 | 43.11% |
| Wage / Income Gap ($) | 10,658 | 56.89¢ per $1 |
| Gini / Inequality Index | 10,658 | 0.40 |
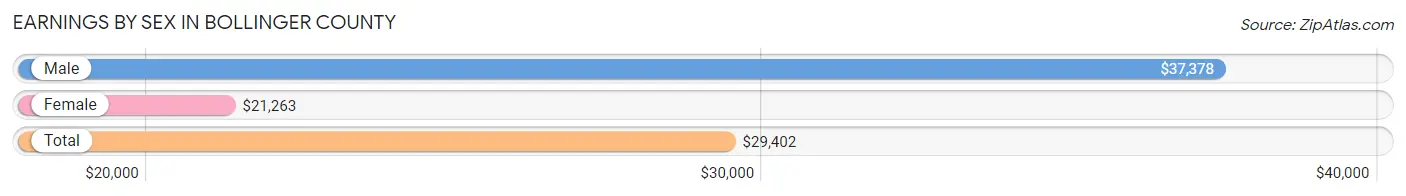
Earnings by Sex in Bollinger County
Average Earnings in Bollinger County are $29,402, $37,378 for men and $21,263 for women, a difference of 43.1%.
| Sex | Number | Average Earnings |
| Male | 2,659 (51.6%) | $37,378 |
| Female | 2,495 (48.4%) | $21,263 |
| Total | 5,154 (100.0%) | $29,402 |
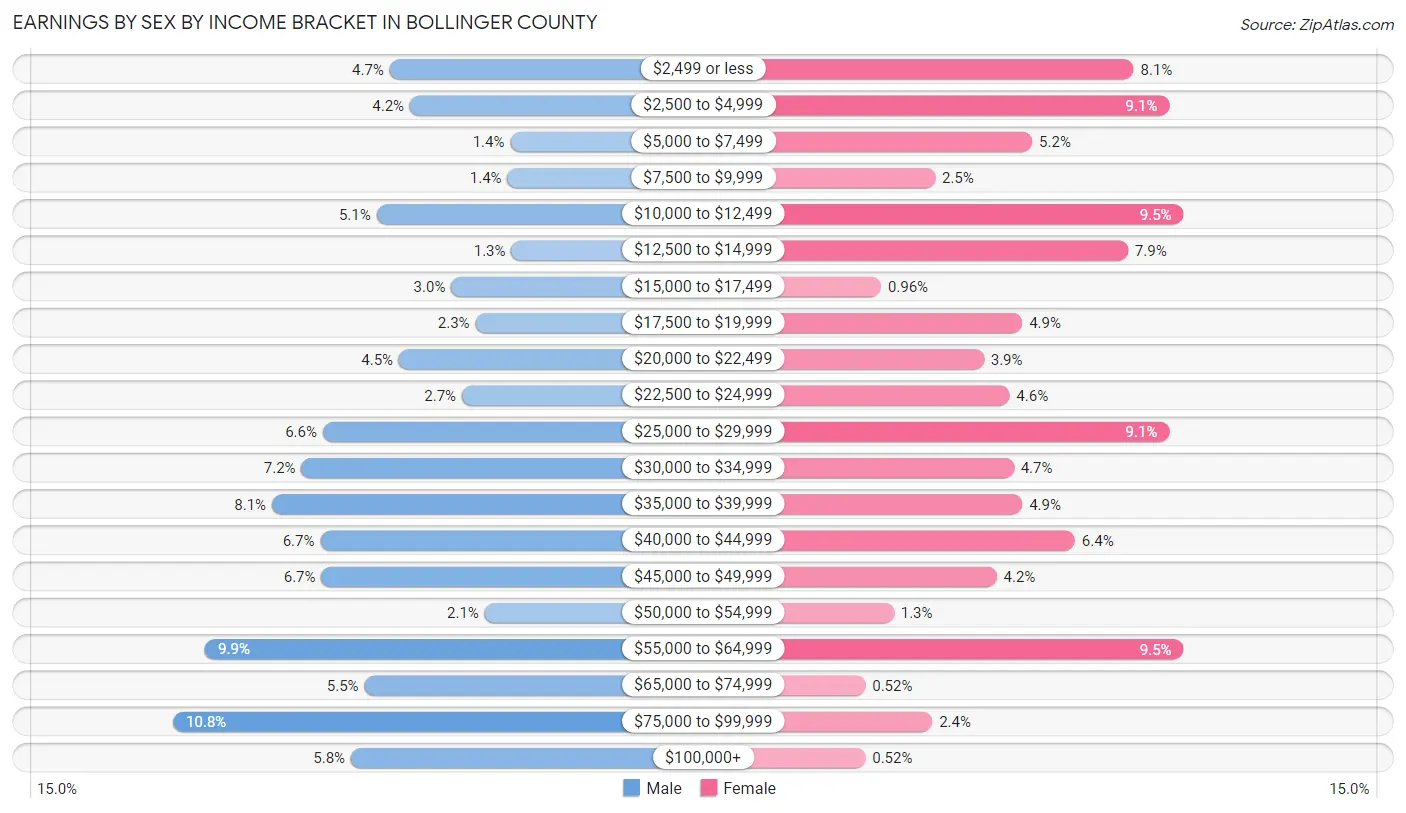
Earnings by Sex by Income Bracket in Bollinger County
The most common earnings brackets in Bollinger County are $75,000 to $99,999 for men (288 | 10.8%) and $10,000 to $12,499 for women (236 | 9.5%).
| Income | Male | Female |
| $2,499 or less | 126 (4.7%) | 201 (8.1%) |
| $2,500 to $4,999 | 111 (4.2%) | 226 (9.1%) |
| $5,000 to $7,499 | 36 (1.3%) | 130 (5.2%) |
| $7,500 to $9,999 | 38 (1.4%) | 62 (2.5%) |
| $10,000 to $12,499 | 136 (5.1%) | 236 (9.5%) |
| $12,500 to $14,999 | 35 (1.3%) | 197 (7.9%) |
| $15,000 to $17,499 | 80 (3.0%) | 24 (1.0%) |
| $17,500 to $19,999 | 62 (2.3%) | 123 (4.9%) |
| $20,000 to $22,499 | 119 (4.5%) | 96 (3.8%) |
| $22,500 to $24,999 | 72 (2.7%) | 114 (4.6%) |
| $25,000 to $29,999 | 176 (6.6%) | 226 (9.1%) |
| $30,000 to $34,999 | 192 (7.2%) | 117 (4.7%) |
| $35,000 to $39,999 | 214 (8.1%) | 123 (4.9%) |
| $40,000 to $44,999 | 178 (6.7%) | 160 (6.4%) |
| $45,000 to $49,999 | 177 (6.7%) | 105 (4.2%) |
| $50,000 to $54,999 | 55 (2.1%) | 33 (1.3%) |
| $55,000 to $64,999 | 264 (9.9%) | 236 (9.5%) |
| $65,000 to $74,999 | 145 (5.4%) | 13 (0.5%) |
| $75,000 to $99,999 | 288 (10.8%) | 60 (2.4%) |
| $100,000+ | 155 (5.8%) | 13 (0.5%) |
| Total | 2,659 (100.0%) | 2,495 (100.0%) |
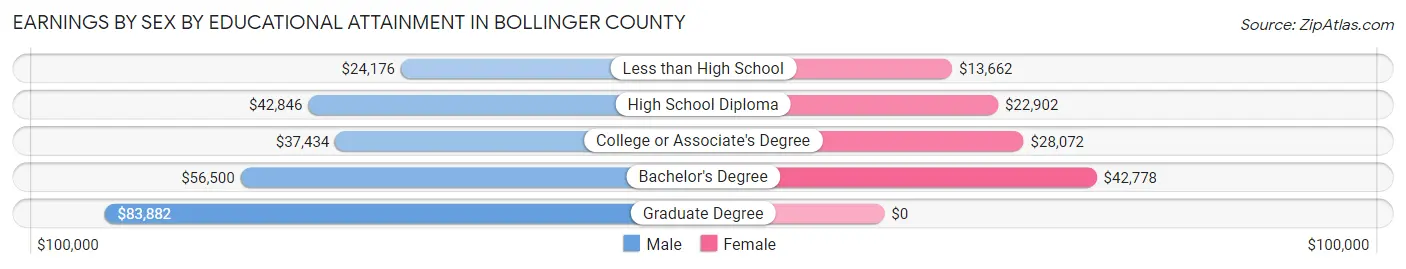
Earnings by Sex by Educational Attainment in Bollinger County
Average earnings in Bollinger County are $41,923 for men and $23,454 for women, a difference of 44.1%. Men with an educational attainment of graduate degree enjoy the highest average annual earnings of $83,882, while those with less than high school education earn the least with $24,176. Women with an educational attainment of bachelor's degree earn the most with the average annual earnings of $42,778, while those with less than high school education have the smallest earnings of $13,662.
| Educational Attainment | Male Income | Female Income |
| Less than High School | $24,176 | $13,662 |
| High School Diploma | $42,846 | $22,902 |
| College or Associate's Degree | $37,434 | $28,072 |
| Bachelor's Degree | $56,500 | $42,778 |
| Graduate Degree | $83,882 | $0 |
| Total | $41,923 | $23,454 |
Family Income in Bollinger County
Family Income Brackets in Bollinger County
According to the Bollinger County family income data, there are 579 families falling into the $50,000 to $74,999 income range, which is the most common income bracket and makes up 22.8% of all families. Conversely, the $200,000+ income bracket is the least frequent group with only 33 families (1.3%) belonging to this category.
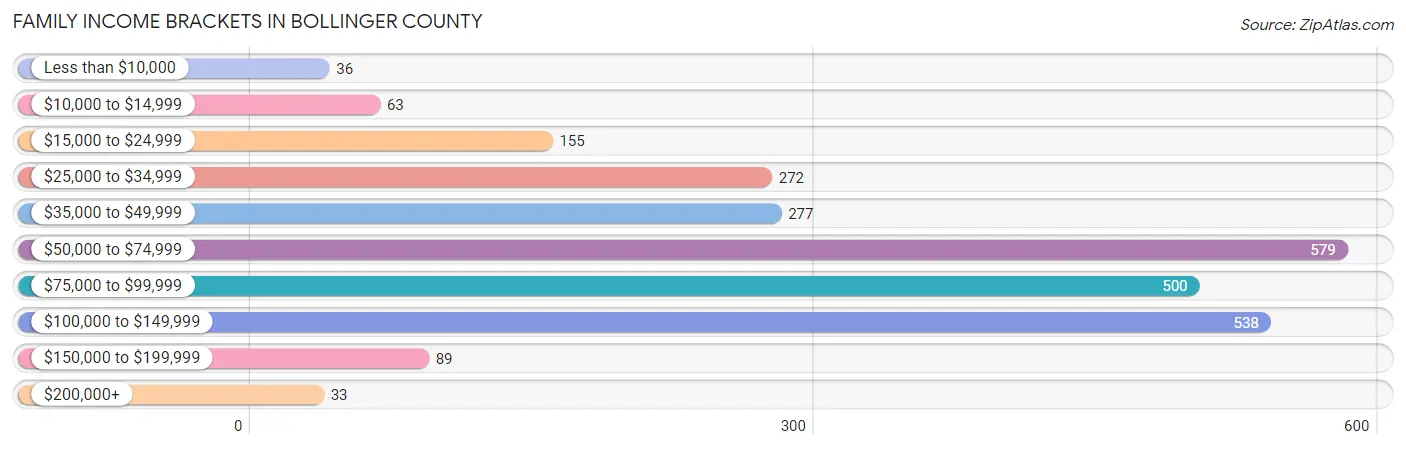
| Income Bracket | # Families | % Families |
| Less than $10,000 | 36 | 1.4% |
| $10,000 to $14,999 | 63 | 2.5% |
| $15,000 to $24,999 | 155 | 6.1% |
| $25,000 to $34,999 | 272 | 10.7% |
| $35,000 to $49,999 | 277 | 10.9% |
| $50,000 to $74,999 | 579 | 22.8% |
| $75,000 to $99,999 | 500 | 19.7% |
| $100,000 to $149,999 | 538 | 21.2% |
| $150,000 to $199,999 | 89 | 3.5% |
| $200,000+ | 33 | 1.3% |
Family Income by Famaliy Size in Bollinger County
5-person families (102 | 4.0%) account for the highest median family income in Bollinger County with $114,038 per family, while 2-person families (1,525 | 60.1%) have the highest median income of $33,553 per family member.
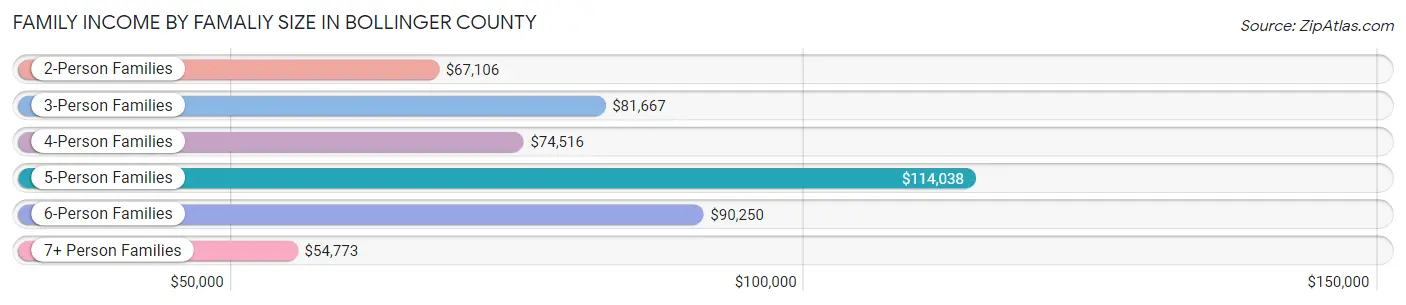
| Income Bracket | # Families | Median Income |
| 2-Person Families | 1,525 (60.1%) | $67,106 |
| 3-Person Families | 452 (17.8%) | $81,667 |
| 4-Person Families | 324 (12.8%) | $74,516 |
| 5-Person Families | 102 (4.0%) | $114,038 |
| 6-Person Families | 78 (3.1%) | $90,250 |
| 7+ Person Families | 58 (2.3%) | $54,773 |
| Total | 2,539 (100.0%) | $73,240 |
Family Income by Number of Earners in Bollinger County
The median family income in Bollinger County is $73,240, with families comprising 3+ earners (266) having the highest median family income of $97,727, while families with no earners (557) have the lowest median family income of $34,137, accounting for 10.5% and 21.9% of families, respectively.
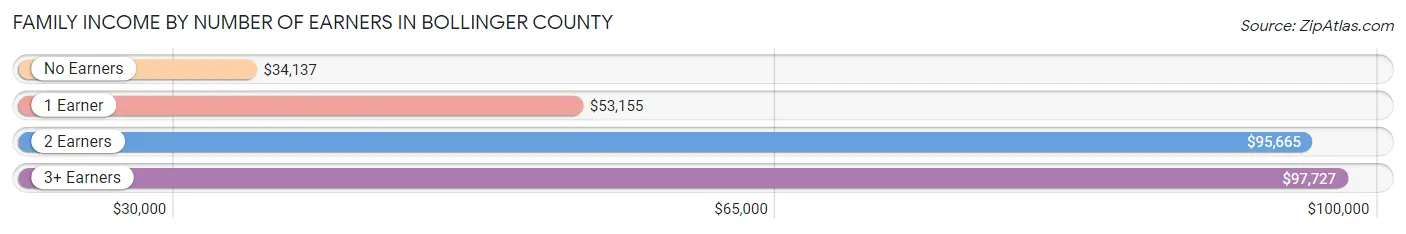
| Number of Earners | # Families | Median Income |
| No Earners | 557 (21.9%) | $34,137 |
| 1 Earner | 811 (31.9%) | $53,155 |
| 2 Earners | 905 (35.6%) | $95,665 |
| 3+ Earners | 266 (10.5%) | $97,727 |
| Total | 2,539 (100.0%) | $73,240 |
Household Income in Bollinger County
Household Income Brackets in Bollinger County
With 694 households falling in the category, the $50,000 to $74,999 income range is the most frequent in Bollinger County, accounting for 18.3% of all households. In contrast, only 45 households (1.2%) fall into the $200,000+ income bracket, making it the least populous group.
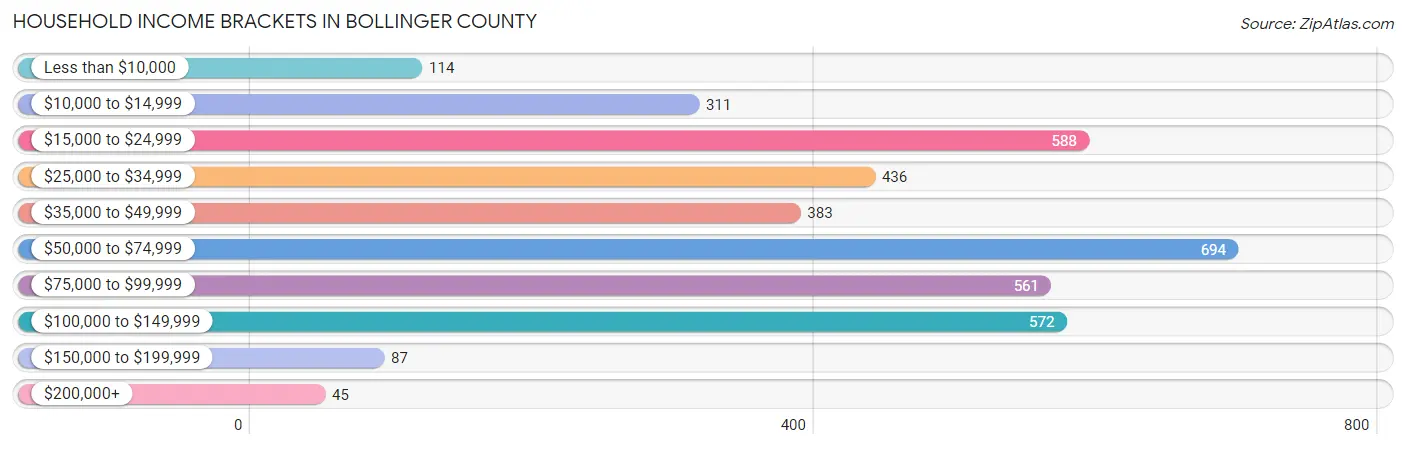
| Income Bracket | # Households | % Households |
| Less than $10,000 | 114 | 3.0% |
| $10,000 to $14,999 | 311 | 8.2% |
| $15,000 to $24,999 | 588 | 15.5% |
| $25,000 to $34,999 | 436 | 11.5% |
| $35,000 to $49,999 | 383 | 10.1% |
| $50,000 to $74,999 | 694 | 18.3% |
| $75,000 to $99,999 | 561 | 14.8% |
| $100,000 to $149,999 | 572 | 15.1% |
| $150,000 to $199,999 | 87 | 2.3% |
| $200,000+ | 45 | 1.2% |
Household Income by Householder Age in Bollinger County
The median household income in Bollinger County is $52,306, with the highest median household income of $73,790 found in the 25 to 44 years age bracket for the primary householder. A total of 836 households (22.1%) fall into this category. Meanwhile, the 65+ years age bracket for the primary householder has the lowest median household income of $31,299, with 1,307 households (34.5%) in this group.
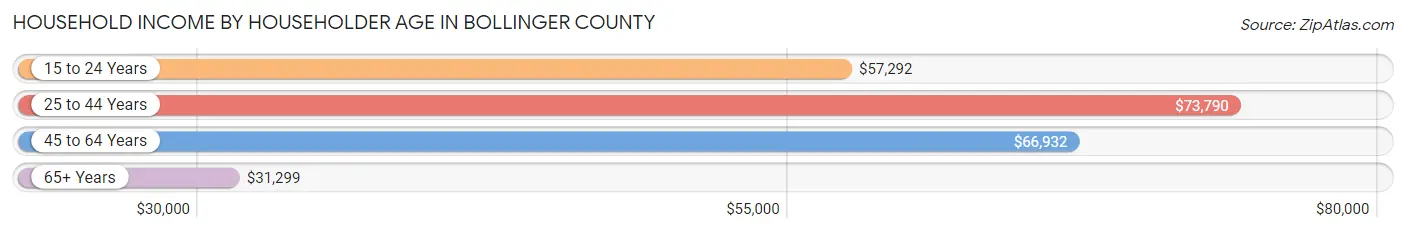
| Income Bracket | # Households | Median Income |
| 15 to 24 Years | 51 (1.3%) | $57,292 |
| 25 to 44 Years | 836 (22.1%) | $73,790 |
| 45 to 64 Years | 1,597 (42.1%) | $66,932 |
| 65+ Years | 1,307 (34.5%) | $31,299 |
| Total | 3,791 (100.0%) | $52,306 |
Poverty in Bollinger County
Income Below Poverty by Sex and Age in Bollinger County
With 12.3% poverty level for males and 17.5% for females among the residents of Bollinger County, 6 to 11 year old males and 15 year old females are the most vulnerable to poverty, with 140 males (36.7%) and 67 females (84.8%) in their respective age groups living below the poverty level.
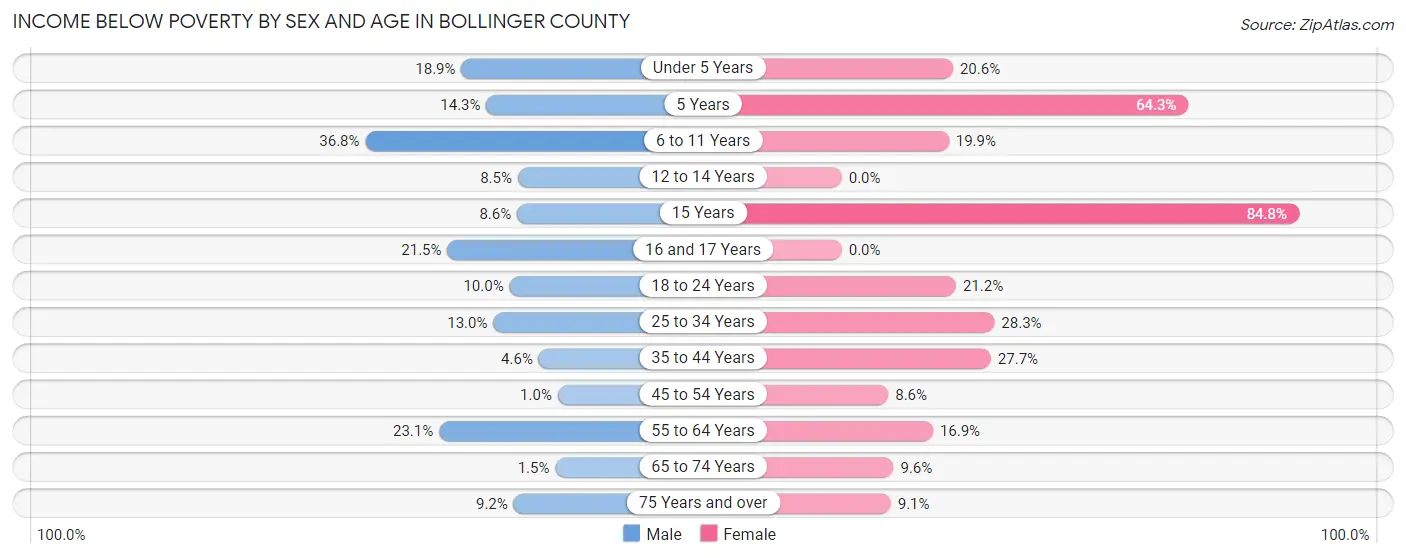
| Age Bracket | Male | Female |
| Under 5 Years | 53 (18.9%) | 58 (20.6%) |
| 5 Years | 5 (14.3%) | 9 (64.3%) |
| 6 to 11 Years | 140 (36.7%) | 84 (19.9%) |
| 12 to 14 Years | 18 (8.5%) | 0 (0.0%) |
| 15 Years | 8 (8.6%) | 67 (84.8%) |
| 16 and 17 Years | 31 (21.5%) | 0 (0.0%) |
| 18 to 24 Years | 39 (10.0%) | 78 (21.2%) |
| 25 to 34 Years | 71 (13.0%) | 151 (28.3%) |
| 35 to 44 Years | 28 (4.6%) | 165 (27.7%) |
| 45 to 54 Years | 7 (1.0%) | 58 (8.6%) |
| 55 to 64 Years | 203 (23.1%) | 143 (16.9%) |
| 65 to 74 Years | 9 (1.5%) | 65 (9.6%) |
| 75 Years and over | 37 (9.2%) | 43 (9.1%) |
| Total | 649 (12.3%) | 921 (17.5%) |
Income Above Poverty by Sex and Age in Bollinger County
According to the poverty statistics in Bollinger County, males aged 45 to 54 years and females aged 12 to 14 years are the age groups that are most secure financially, with 99.0% of males and 100.0% of females in these age groups living above the poverty line.
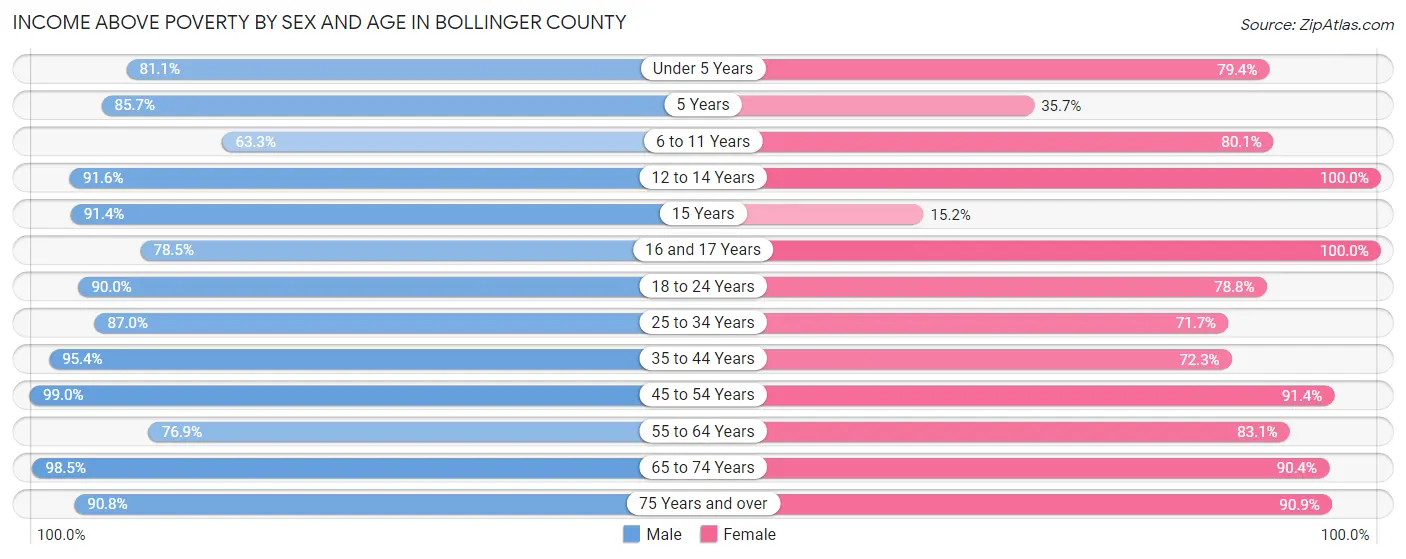
| Age Bracket | Male | Female |
| Under 5 Years | 227 (81.1%) | 223 (79.4%) |
| 5 Years | 30 (85.7%) | 5 (35.7%) |
| 6 to 11 Years | 241 (63.2%) | 339 (80.1%) |
| 12 to 14 Years | 195 (91.5%) | 158 (100.0%) |
| 15 Years | 85 (91.4%) | 12 (15.2%) |
| 16 and 17 Years | 113 (78.5%) | 151 (100.0%) |
| 18 to 24 Years | 351 (90.0%) | 290 (78.8%) |
| 25 to 34 Years | 475 (87.0%) | 382 (71.7%) |
| 35 to 44 Years | 585 (95.4%) | 431 (72.3%) |
| 45 to 54 Years | 665 (99.0%) | 614 (91.4%) |
| 55 to 64 Years | 677 (76.9%) | 702 (83.1%) |
| 65 to 74 Years | 597 (98.5%) | 612 (90.4%) |
| 75 Years and over | 364 (90.8%) | 430 (90.9%) |
| Total | 4,605 (87.6%) | 4,349 (82.5%) |
Income Below Poverty Among Married-Couple Families in Bollinger County
The poverty statistics for married-couple families in Bollinger County show that 3.5% or 76 of the total 2,183 families live below the poverty line. Families with 3 or 4 children have the highest poverty rate of 14.3%, comprising of 19 families. On the other hand, families with 5 or more children have the lowest poverty rate of 0.0%, which includes 0 families.
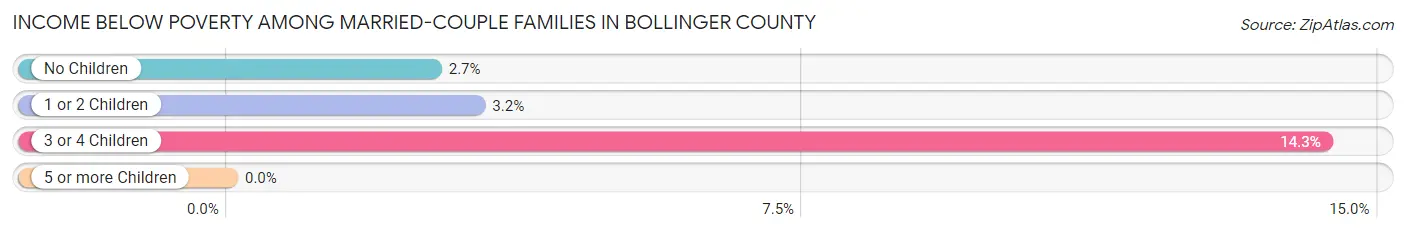
| Children | Above Poverty | Below Poverty |
| No Children | 1,534 (97.3%) | 42 (2.7%) |
| 1 or 2 Children | 449 (96.8%) | 15 (3.2%) |
| 3 or 4 Children | 114 (85.7%) | 19 (14.3%) |
| 5 or more Children | 10 (100.0%) | 0 (0.0%) |
| Total | 2,107 (96.5%) | 76 (3.5%) |
Income Below Poverty Among Single-Parent Households in Bollinger County
According to the poverty data in Bollinger County, 19.6% or 11 single-father households and 40.0% or 120 single-mother households are living below the poverty line. Among single-father households, those with 1 or 2 children have the highest poverty rate, with 11 households (64.7%) experiencing poverty. Likewise, among single-mother households, those with 3 or 4 children have the highest poverty rate, with 34 households (100.0%) falling below the poverty line.
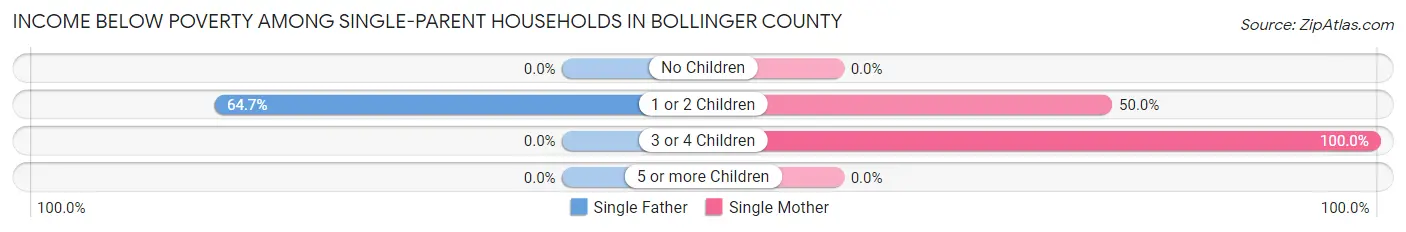
| Children | Single Father | Single Mother |
| No Children | 0 (0.0%) | 0 (0.0%) |
| 1 or 2 Children | 11 (64.7%) | 86 (50.0%) |
| 3 or 4 Children | 0 (0.0%) | 34 (100.0%) |
| 5 or more Children | 0 (0.0%) | 0 (0.0%) |
| Total | 11 (19.6%) | 120 (40.0%) |
Income Below Poverty Among Married-Couple vs Single-Parent Households in Bollinger County
The poverty data for Bollinger County shows that 76 of the married-couple family households (3.5%) and 131 of the single-parent households (36.8%) are living below the poverty level. Within the married-couple family households, those with 3 or 4 children have the highest poverty rate, with 19 households (14.3%) falling below the poverty line. Among the single-parent households, those with 3 or 4 children have the highest poverty rate, with 34 household (100.0%) living below poverty.
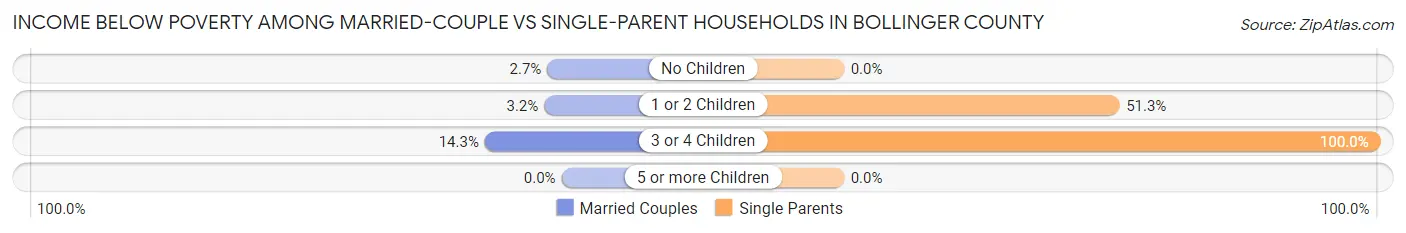
| Children | Married-Couple Families | Single-Parent Households |
| No Children | 42 (2.7%) | 0 (0.0%) |
| 1 or 2 Children | 15 (3.2%) | 97 (51.3%) |
| 3 or 4 Children | 19 (14.3%) | 34 (100.0%) |
| 5 or more Children | 0 (0.0%) | 0 (0.0%) |
| Total | 76 (3.5%) | 131 (36.8%) |
Race in Bollinger County
The most populous races in Bollinger County are White / Caucasian (10,110 | 94.9%), Two or more Races (392 | 3.7%), and Hispanic or Latino (180 | 1.7%).
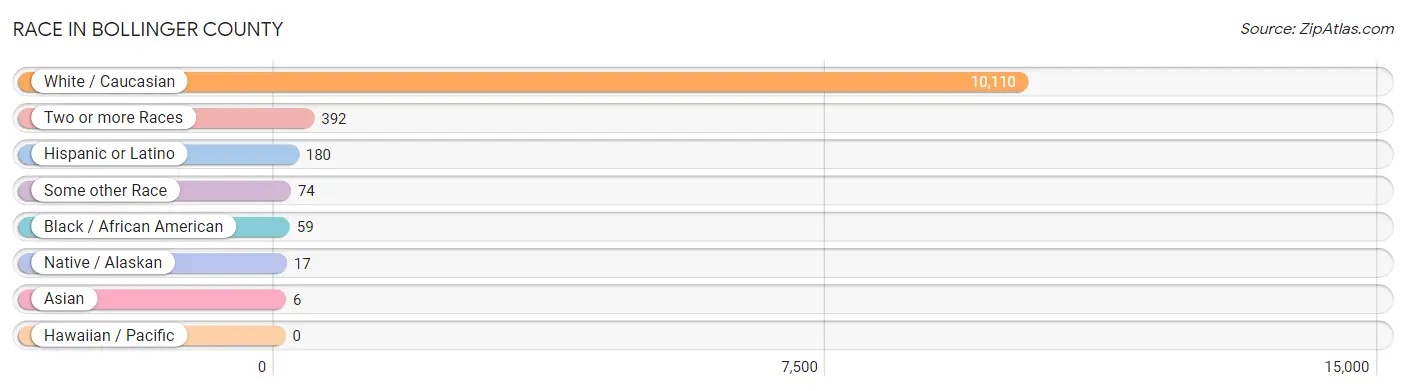
| Race | # Population | % Population |
| Asian | 6 | 0.1% |
| Black / African American | 59 | 0.5% |
| Hawaiian / Pacific | 0 | 0.0% |
| Hispanic or Latino | 180 | 1.7% |
| Native / Alaskan | 17 | 0.2% |
| White / Caucasian | 10,110 | 94.9% |
| Two or more Races | 392 | 3.7% |
| Some other Race | 74 | 0.7% |
| Total | 10,658 | 100.0% |
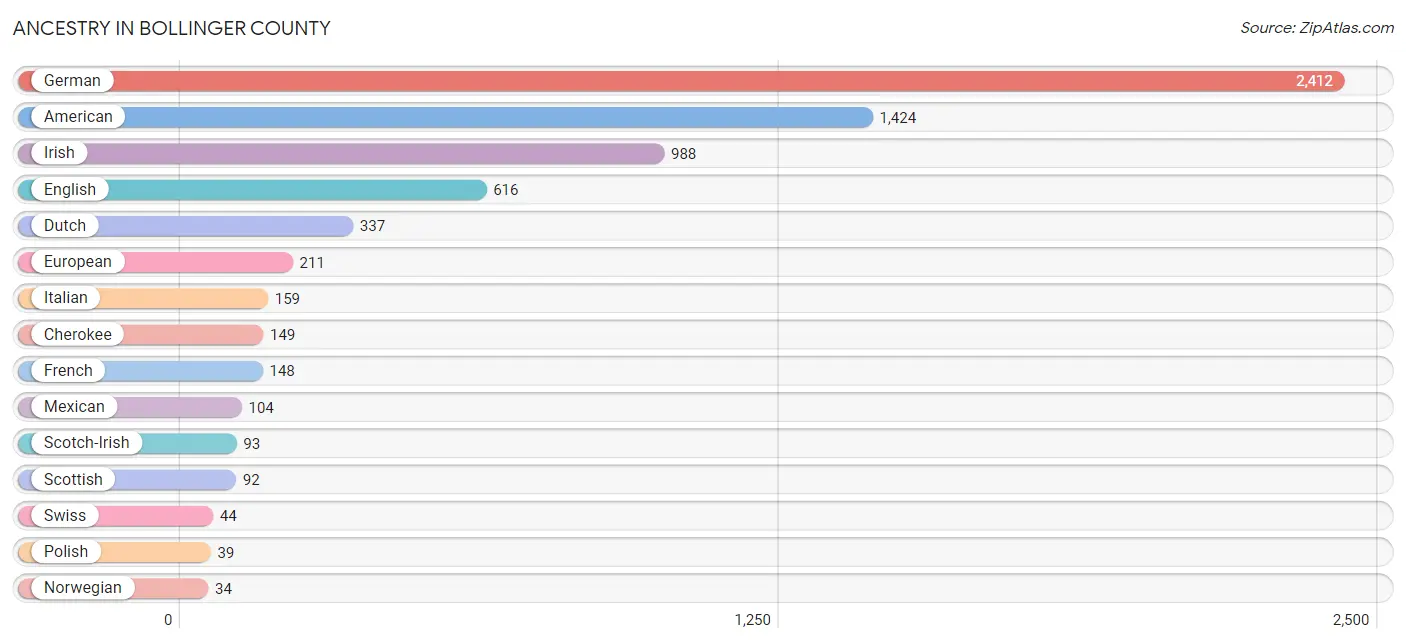
Ancestry in Bollinger County
The most populous ancestries reported in Bollinger County are German (2,412 | 22.6%), American (1,424 | 13.4%), Irish (988 | 9.3%), English (616 | 5.8%), and Dutch (337 | 3.2%), together accounting for 54.2% of all Bollinger County residents.
| Ancestry | # Population | % Population |
| American | 1,424 | 13.4% |
| Austrian | 18 | 0.2% |
| Blackfeet | 30 | 0.3% |
| British | 3 | 0.0% |
| Cherokee | 149 | 1.4% |
| Chippewa | 15 | 0.1% |
| Croatian | 4 | 0.0% |
| Danish | 23 | 0.2% |
| Dutch | 337 | 3.2% |
| Ecuadorian | 27 | 0.3% |
| English | 616 | 5.8% |
| European | 211 | 2.0% |
| French | 148 | 1.4% |
| French Canadian | 17 | 0.2% |
| German | 2,412 | 22.6% |
| Greek | 19 | 0.2% |
| Hopi | 19 | 0.2% |
| Indian (Asian) | 3 | 0.0% |
| Irish | 988 | 9.3% |
| Italian | 159 | 1.5% |
| Korean | 4 | 0.0% |
| Lithuanian | 23 | 0.2% |
| Mexican | 104 | 1.0% |
| Norwegian | 34 | 0.3% |
| Osage | 1 | 0.0% |
| Polish | 39 | 0.4% |
| Puerto Rican | 16 | 0.2% |
| Russian | 7 | 0.1% |
| Scotch-Irish | 93 | 0.9% |
| Scottish | 92 | 0.9% |
| South American | 27 | 0.3% |
| Spanish | 3 | 0.0% |
| Swedish | 27 | 0.3% |
| Swiss | 44 | 0.4% |
| Welsh | 12 | 0.1% |
| Yugoslavian | 3 | 0.0% | View All 36 Rows |
Immigrants in Bollinger County
The most numerous immigrant groups reported in Bollinger County came from Europe (61 | 0.6%), Germany (47 | 0.4%), Western Europe (47 | 0.4%), Eastern Europe (14 | 0.1%), and Lithuania (14 | 0.1%), together accounting for 1.7% of all Bollinger County residents.

| Immigration Origin | # Population | % Population |
| Africa | 3 | 0.0% |
| Asia | 3 | 0.0% |
| Central America | 1 | 0.0% |
| Eastern Europe | 14 | 0.1% |
| Europe | 61 | 0.6% |
| Germany | 47 | 0.4% |
| Latin America | 1 | 0.0% |
| Lithuania | 14 | 0.1% |
| Mexico | 1 | 0.0% |
| Philippines | 3 | 0.0% |
| South Africa | 3 | 0.0% |
| South Eastern Asia | 3 | 0.0% |
| Western Europe | 47 | 0.4% | View All 13 Rows |
Sex and Age in Bollinger County
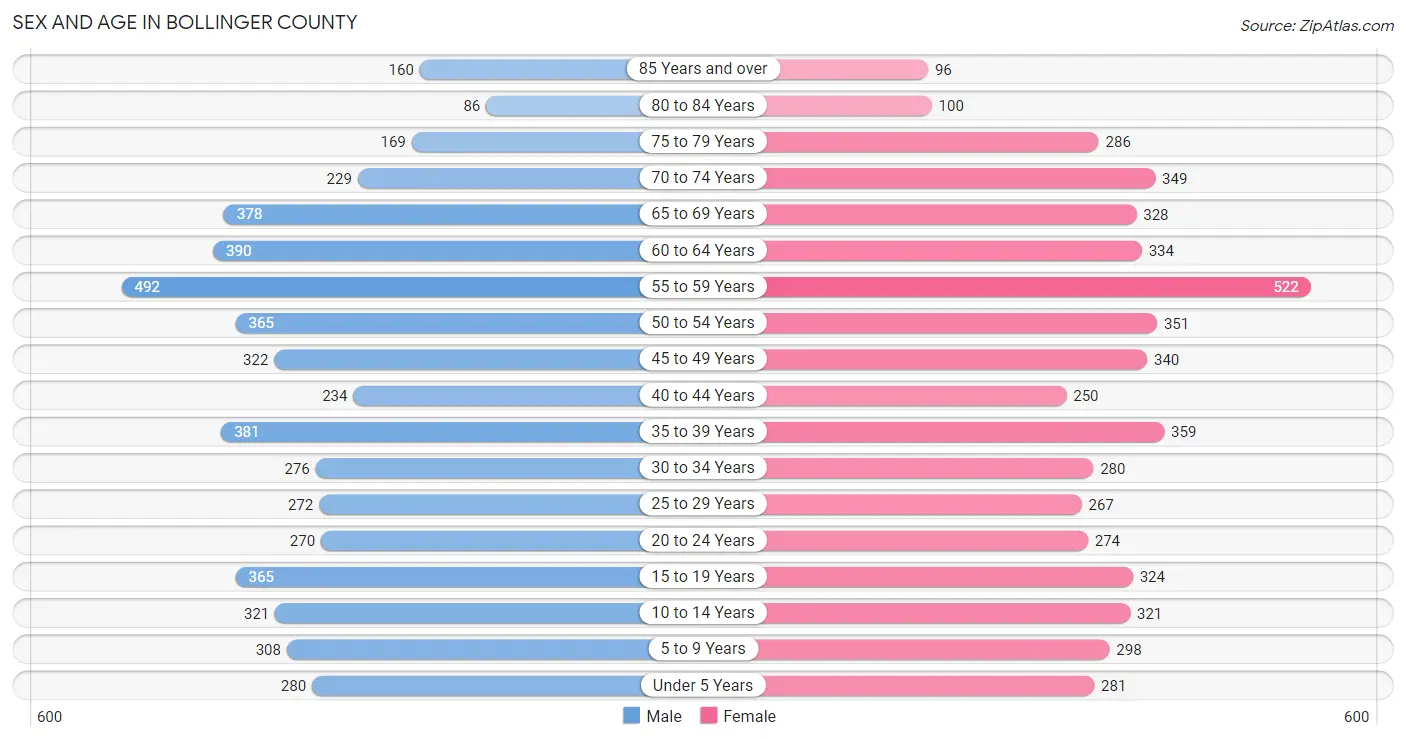
Sex and Age in Bollinger County
The most populous age groups in Bollinger County are 55 to 59 Years (492 | 9.3%) for men and 55 to 59 Years (522 | 9.7%) for women.
| Age Bracket | Male | Female |
| Under 5 Years | 280 (5.3%) | 281 (5.2%) |
| 5 to 9 Years | 308 (5.8%) | 298 (5.6%) |
| 10 to 14 Years | 321 (6.1%) | 321 (6.0%) |
| 15 to 19 Years | 365 (6.9%) | 324 (6.0%) |
| 20 to 24 Years | 270 (5.1%) | 274 (5.1%) |
| 25 to 29 Years | 272 (5.1%) | 267 (5.0%) |
| 30 to 34 Years | 276 (5.2%) | 280 (5.2%) |
| 35 to 39 Years | 381 (7.2%) | 359 (6.7%) |
| 40 to 44 Years | 234 (4.4%) | 250 (4.7%) |
| 45 to 49 Years | 322 (6.1%) | 340 (6.3%) |
| 50 to 54 Years | 365 (6.9%) | 351 (6.6%) |
| 55 to 59 Years | 492 (9.3%) | 522 (9.7%) |
| 60 to 64 Years | 390 (7.4%) | 334 (6.2%) |
| 65 to 69 Years | 378 (7.1%) | 328 (6.1%) |
| 70 to 74 Years | 229 (4.3%) | 349 (6.5%) |
| 75 to 79 Years | 169 (3.2%) | 286 (5.3%) |
| 80 to 84 Years | 86 (1.6%) | 100 (1.9%) |
| 85 Years and over | 160 (3.0%) | 96 (1.8%) |
| Total | 5,298 (100.0%) | 5,360 (100.0%) |
Families and Households in Bollinger County
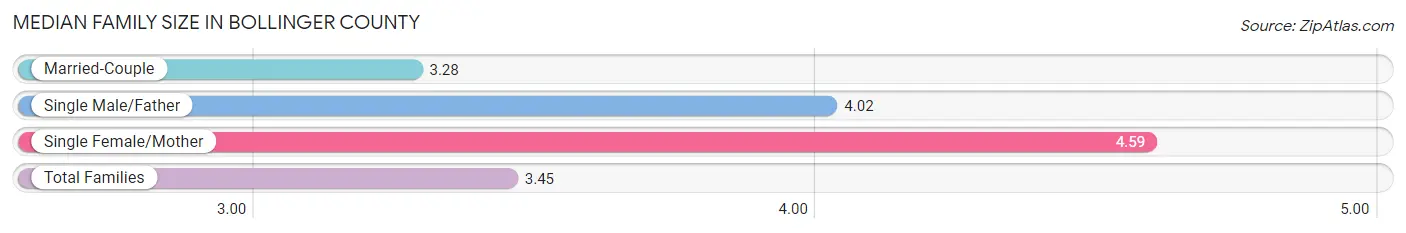
Median Family Size in Bollinger County
The median family size in Bollinger County is 3.45 persons per family, with single female/mother families (300 | 11.8%) accounting for the largest median family size of 4.59 persons per family. On the other hand, married-couple families (2,183 | 86.0%) represent the smallest median family size with 3.28 persons per family.
| Family Type | # Families | Family Size |
| Married-Couple | 2,183 (86.0%) | 3.28 |
| Single Male/Father | 56 (2.2%) | 4.02 |
| Single Female/Mother | 300 (11.8%) | 4.59 |
| Total Families | 2,539 (100.0%) | 3.45 |
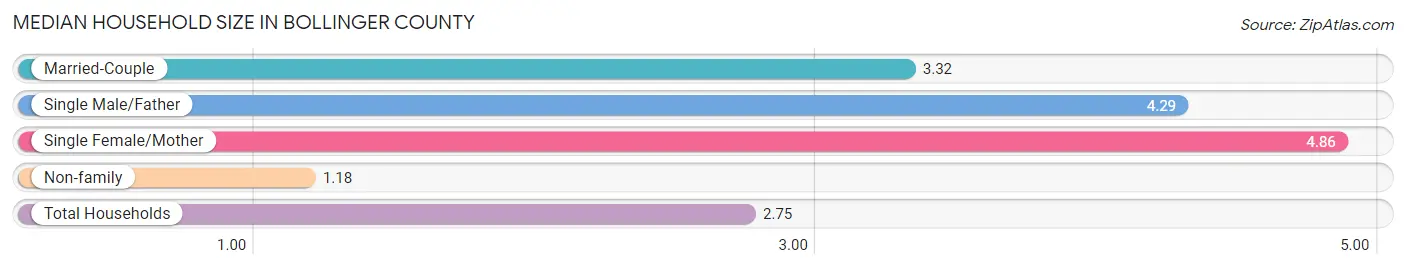
Median Household Size in Bollinger County
The median household size in Bollinger County is 2.75 persons per household, with single female/mother households (300 | 7.9%) accounting for the largest median household size of 4.86 persons per household. non-family households (1,252 | 33.0%) represent the smallest median household size with 1.18 persons per household.
| Household Type | # Households | Household Size |
| Married-Couple | 2,183 (57.6%) | 3.32 |
| Single Male/Father | 56 (1.5%) | 4.29 |
| Single Female/Mother | 300 (7.9%) | 4.86 |
| Non-family | 1,252 (33.0%) | 1.18 |
| Total Households | 3,791 (100.0%) | 2.75 |
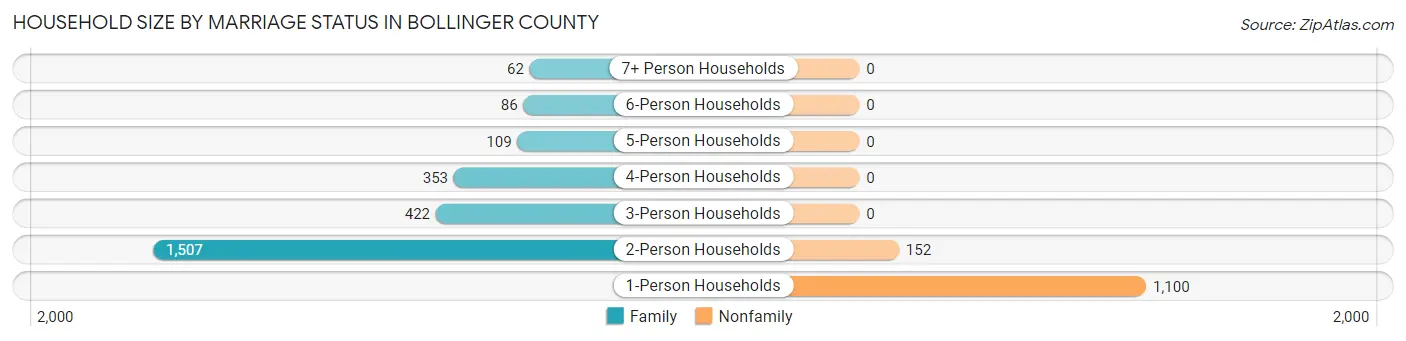
Household Size by Marriage Status in Bollinger County
Out of a total of 3,791 households in Bollinger County, 2,539 (67.0%) are family households, while 1,252 (33.0%) are nonfamily households. The most numerous type of family households are 2-person households, comprising 1,507, and the most common type of nonfamily households are 1-person households, comprising 1,100.
| Household Size | Family Households | Nonfamily Households |
| 1-Person Households | - | 1,100 (29.0%) |
| 2-Person Households | 1,507 (39.8%) | 152 (4.0%) |
| 3-Person Households | 422 (11.1%) | 0 (0.0%) |
| 4-Person Households | 353 (9.3%) | 0 (0.0%) |
| 5-Person Households | 109 (2.9%) | 0 (0.0%) |
| 6-Person Households | 86 (2.3%) | 0 (0.0%) |
| 7+ Person Households | 62 (1.6%) | 0 (0.0%) |
| Total | 2,539 (67.0%) | 1,252 (33.0%) |
Female Fertility in Bollinger County
Fertility by Age in Bollinger County
Average fertility rate in Bollinger County is 29.0 births per 1,000 women. Women in the age bracket of 20 to 34 years have the highest fertility rate with 44.0 births per 1,000 women. Women in the age bracket of 20 to 34 years acount for 56.2% of all women with births.
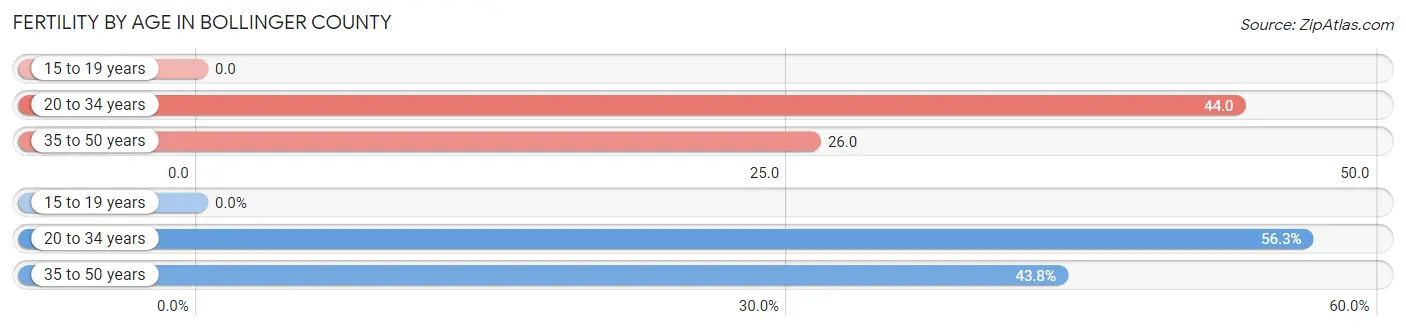
| Age Bracket | Women with Births | Births / 1,000 Women |
| 15 to 19 years | 0 (0.0%) | 0.0 |
| 20 to 34 years | 36 (56.2%) | 44.0 |
| 35 to 50 years | 28 (43.8%) | 26.0 |
| Total | 64 (100.0%) | 29.0 |
Fertility by Age by Marriage Status in Bollinger County
40.6% of women with births (64) in Bollinger County are married. The highest percentage of unmarried women with births falls into 35 to 50 years age bracket with 64.3% of them unmarried at the time of birth, while the lowest percentage of unmarried women with births belong to 20 to 34 years age bracket with 55.6% of them unmarried.
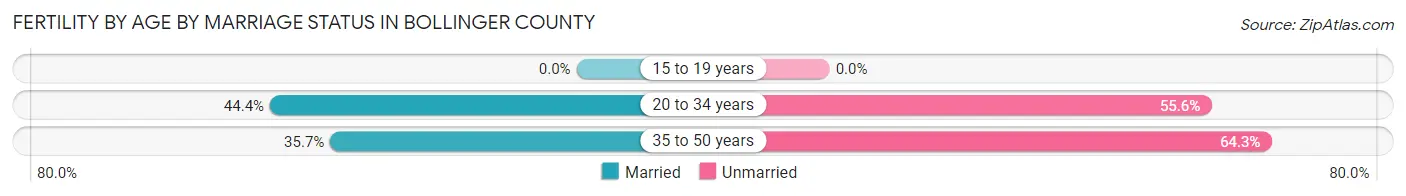
| Age Bracket | Married | Unmarried |
| 15 to 19 years | 0 (0.0%) | 0 (0.0%) |
| 20 to 34 years | 16 (44.4%) | 20 (55.6%) |
| 35 to 50 years | 10 (35.7%) | 18 (64.3%) |
| Total | 26 (40.6%) | 38 (59.4%) |
Fertility by Education in Bollinger County
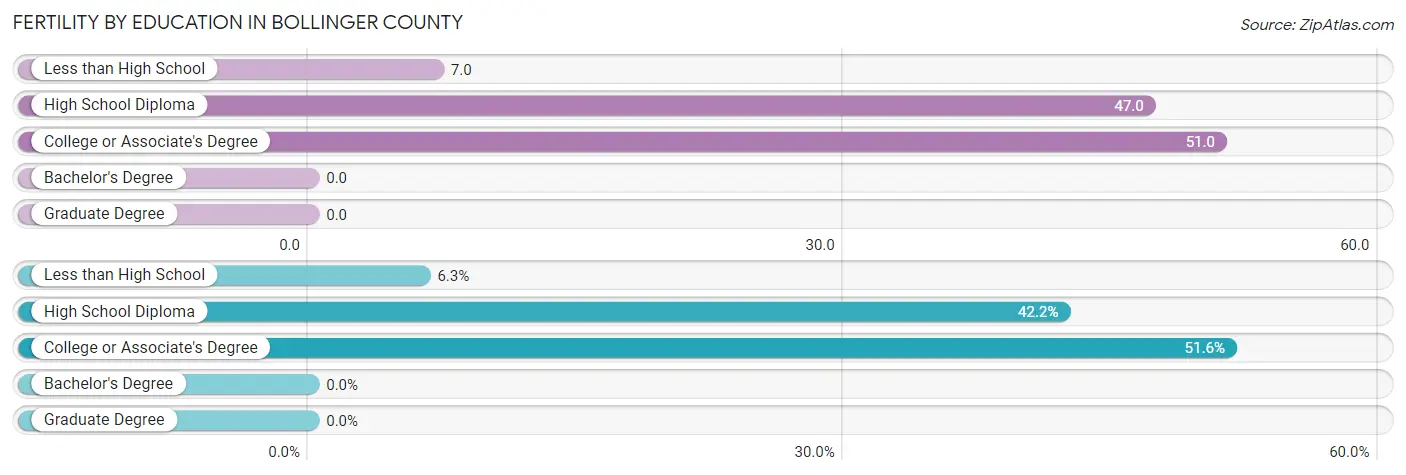
| Educational Attainment | Women with Births | Births / 1,000 Women |
| Less than High School | 4 (6.2%) | 7.0 |
| High School Diploma | 27 (42.2%) | 47.0 |
| College or Associate's Degree | 33 (51.6%) | 51.0 |
| Bachelor's Degree | 0 (0.0%) | 0.0 |
| Graduate Degree | 0 (0.0%) | 0.0 |
| Total | 64 (100.0%) | 29.0 |
Fertility by Education by Marriage Status in Bollinger County
59.4% of women with births in Bollinger County are unmarried. Women with the educational attainment of less than high school are most likely to be married with 100.0% of them married at childbirth, while women with the educational attainment of college or associate's degree are least likely to be married with 66.7% of them unmarried at childbirth.
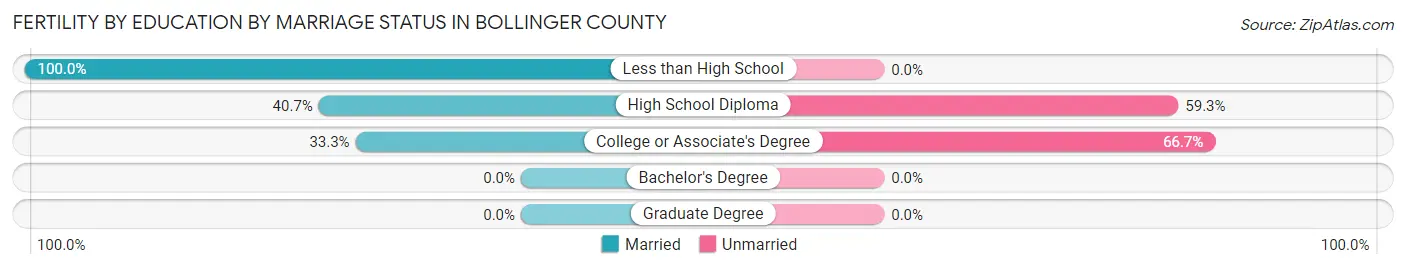
| Educational Attainment | Married | Unmarried |
| Less than High School | 4 (100.0%) | 0 (0.0%) |
| High School Diploma | 11 (40.7%) | 16 (59.3%) |
| College or Associate's Degree | 11 (33.3%) | 22 (66.7%) |
| Bachelor's Degree | 0 (0.0%) | 0 (0.0%) |
| Graduate Degree | 0 (0.0%) | 0 (0.0%) |
| Total | 26 (40.6%) | 38 (59.4%) |
Employment Characteristics in Bollinger County
Employment by Class of Employer in Bollinger County
Among the 4,464 employed individuals in Bollinger County, private company employees (3,204 | 71.8%), not-for-profit organizations (319 | 7.1%), and local government employees (249 | 5.6%) make up the most common classes of employment.
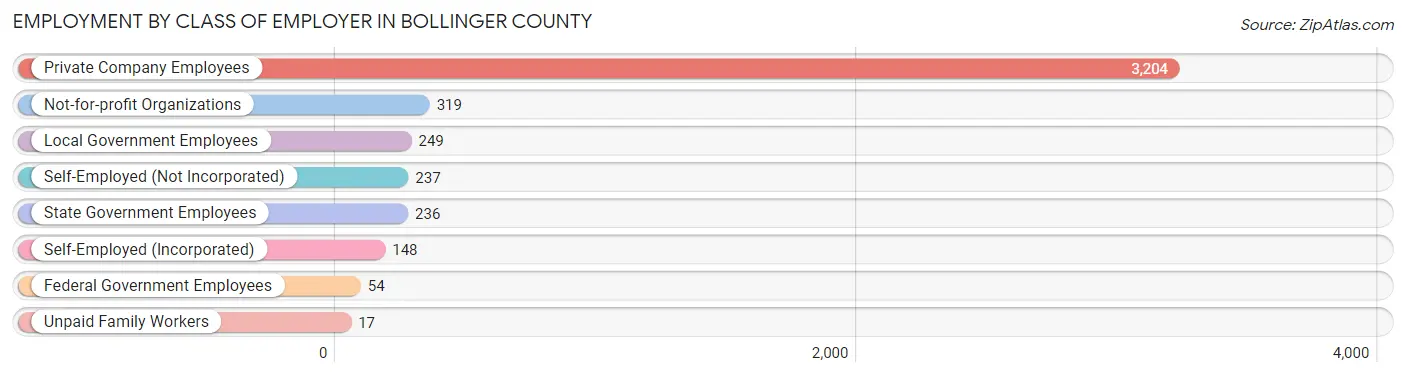
| Employer Class | # Employees | % Employees |
| Private Company Employees | 3,204 | 71.8% |
| Self-Employed (Incorporated) | 148 | 3.3% |
| Self-Employed (Not Incorporated) | 237 | 5.3% |
| Not-for-profit Organizations | 319 | 7.1% |
| Local Government Employees | 249 | 5.6% |
| State Government Employees | 236 | 5.3% |
| Federal Government Employees | 54 | 1.2% |
| Unpaid Family Workers | 17 | 0.4% |
| Total | 4,464 | 100.0% |
Employment Status by Age in Bollinger County
According to the labor force statistics for Bollinger County, out of the total population over 16 years of age (8,677), 56.5% or 4,903 individuals are in the labor force, with 4.9% or 240 of them unemployed. The age group with the highest labor force participation rate is 20 to 24 years, with 90.6% or 493 individuals in the labor force. Within the labor force, the 30 to 34 years age range has the highest percentage of unemployed individuals, with 24.0% or 102 of them being unemployed.
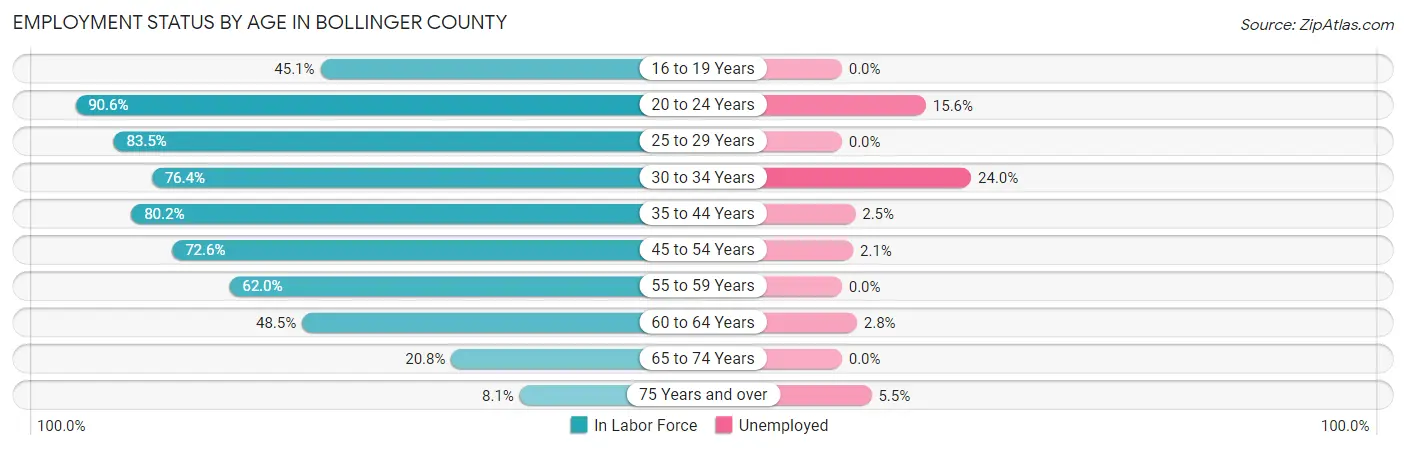
| Age Bracket | In Labor Force | Unemployed |
| 16 to 19 Years | 233 (45.1%) | 0 (0.0%) |
| 20 to 24 Years | 493 (90.6%) | 77 (15.6%) |
| 25 to 29 Years | 450 (83.5%) | 0 (0.0%) |
| 30 to 34 Years | 425 (76.4%) | 102 (24.0%) |
| 35 to 44 Years | 982 (80.2%) | 25 (2.5%) |
| 45 to 54 Years | 1,000 (72.6%) | 21 (2.1%) |
| 55 to 59 Years | 629 (62.0%) | 0 (0.0%) |
| 60 to 64 Years | 351 (48.5%) | 10 (2.8%) |
| 65 to 74 Years | 267 (20.8%) | 0 (0.0%) |
| 75 Years and over | 73 (8.1%) | 4 (5.5%) |
| Total | 4,903 (56.5%) | 240 (4.9%) |
Employment Status by Educational Attainment in Bollinger County
According to labor force statistics for Bollinger County, 70.6% of individuals (3,837) out of the total population between 25 and 64 years of age (5,435) are in the labor force, with 4.1% or 157 of them being unemployed. The group with the highest labor force participation rate are those with the educational attainment of college / associate degree, with 76.4% or 1,171 individuals in the labor force. Within the labor force, individuals with less than high school education have the highest percentage of unemployment, with 19.5% or 86 of them being unemployed.
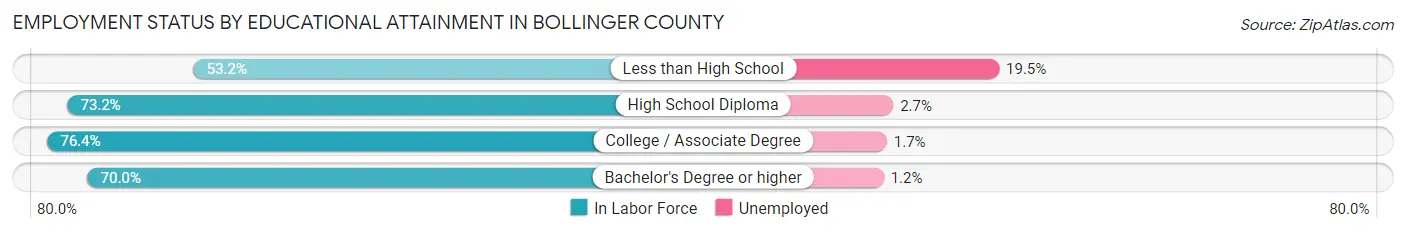
| Educational Attainment | In Labor Force | Unemployed |
| Less than High School | 442 (53.2%) | 162 (19.5%) |
| High School Diploma | 1,709 (73.2%) | 63 (2.7%) |
| College / Associate Degree | 1,171 (76.4%) | 26 (1.7%) |
| Bachelor's Degree or higher | 515 (70.0%) | 9 (1.2%) |
| Total | 3,837 (70.6%) | 223 (4.1%) |
Employment Occupations by Sex in Bollinger County
Management, Business, Science and Arts Occupations
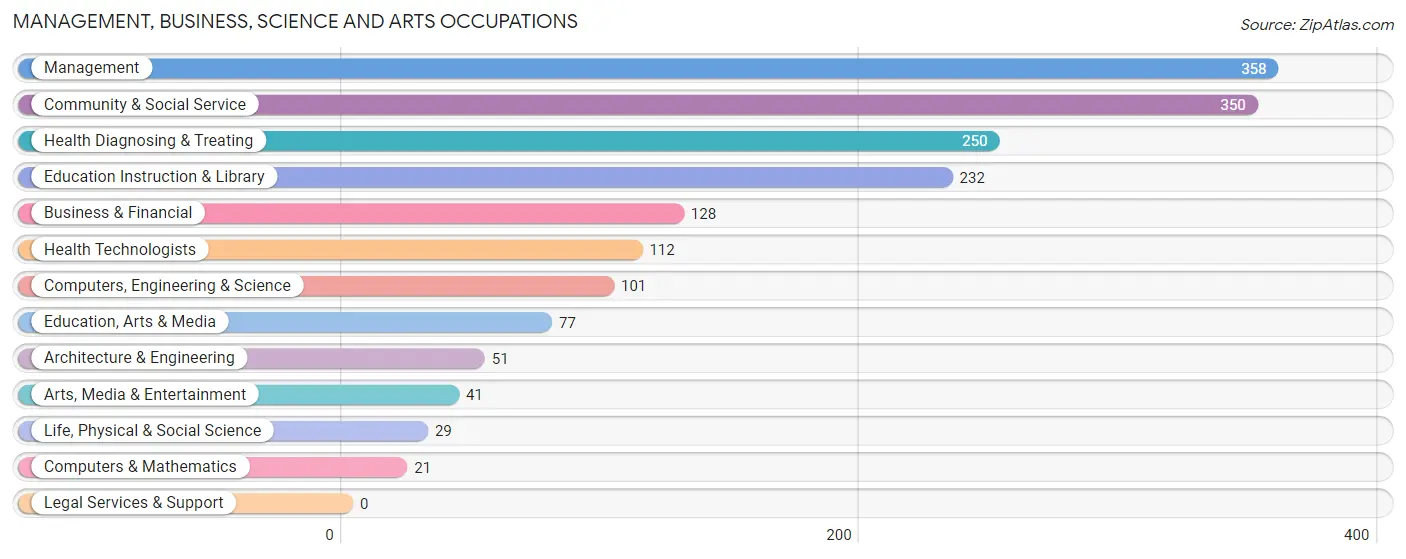
The most common Management, Business, Science and Arts occupations in Bollinger County are Management (358 | 7.7%), Community & Social Service (350 | 7.5%), Health Diagnosing & Treating (250 | 5.4%), Education Instruction & Library (232 | 5.0%), and Business & Financial (128 | 2.7%).
Management, Business, Science and Arts Occupations by Sex
Within the Management, Business, Science and Arts occupations in Bollinger County, the most male-oriented occupations are Life, Physical & Social Science (100.0%), Management (79.3%), and Arts, Media & Entertainment (75.6%), while the most female-oriented occupations are Computers & Mathematics (100.0%), Education, Arts & Media (96.1%), and Health Technologists (88.4%).
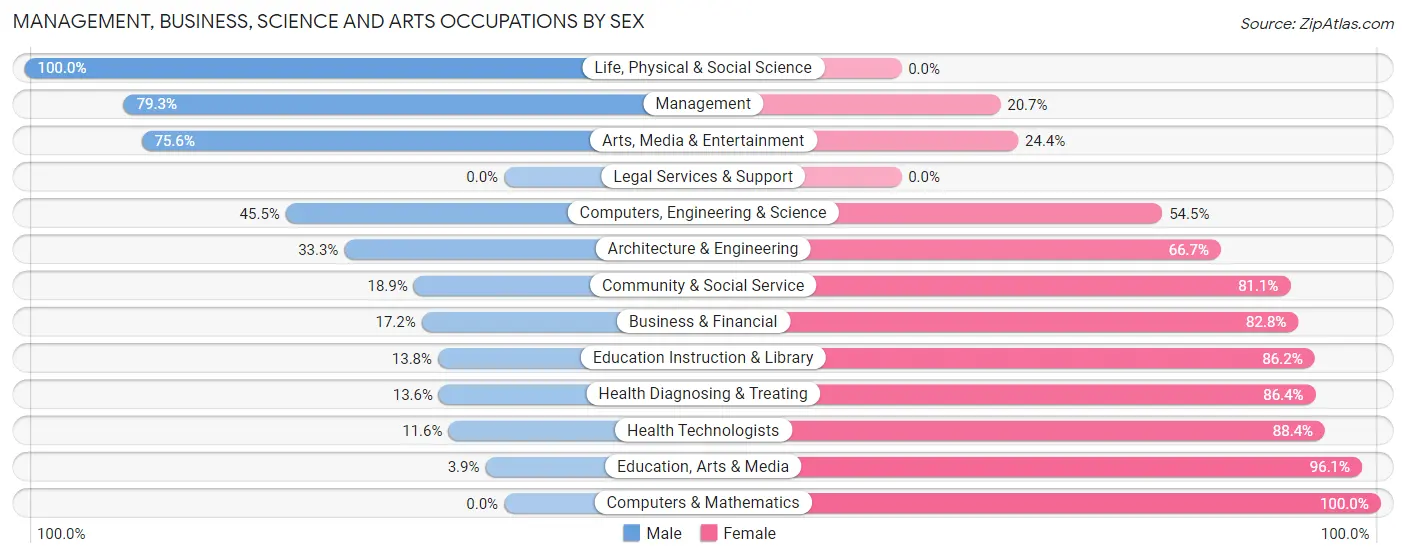
| Occupation | Male | Female |
| Management | 284 (79.3%) | 74 (20.7%) |
| Business & Financial | 22 (17.2%) | 106 (82.8%) |
| Computers, Engineering & Science | 46 (45.5%) | 55 (54.5%) |
| Computers & Mathematics | 0 (0.0%) | 21 (100.0%) |
| Architecture & Engineering | 17 (33.3%) | 34 (66.7%) |
| Life, Physical & Social Science | 29 (100.0%) | 0 (0.0%) |
| Community & Social Service | 66 (18.9%) | 284 (81.1%) |
| Education, Arts & Media | 3 (3.9%) | 74 (96.1%) |
| Legal Services & Support | 0 (0.0%) | 0 (0.0%) |
| Education Instruction & Library | 32 (13.8%) | 200 (86.2%) |
| Arts, Media & Entertainment | 31 (75.6%) | 10 (24.4%) |
| Health Diagnosing & Treating | 34 (13.6%) | 216 (86.4%) |
| Health Technologists | 13 (11.6%) | 99 (88.4%) |
| Total (Category) | 452 (38.1%) | 735 (61.9%) |
| Total (Overall) | 2,585 (55.4%) | 2,079 (44.6%) |
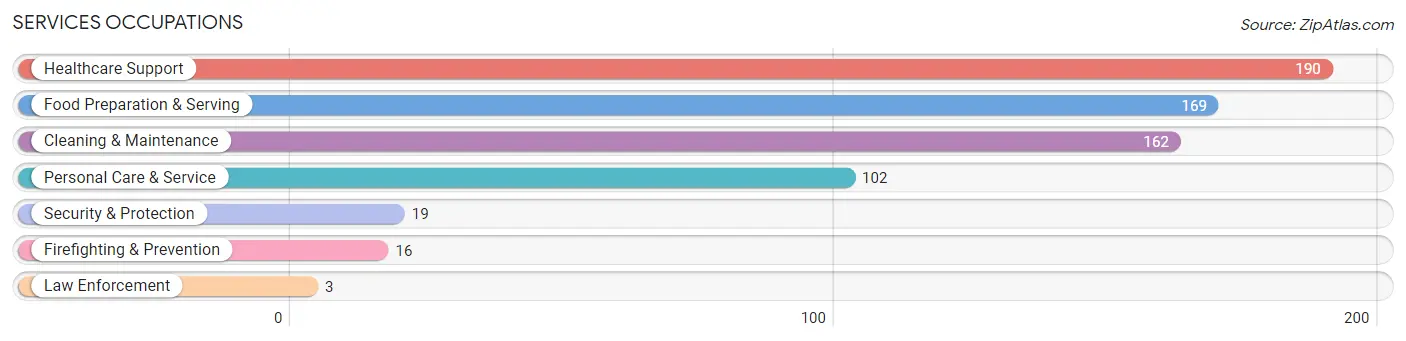
Services Occupations
The most common Services occupations in Bollinger County are Healthcare Support (190 | 4.1%), Food Preparation & Serving (169 | 3.6%), Cleaning & Maintenance (162 | 3.5%), Personal Care & Service (102 | 2.2%), and Security & Protection (19 | 0.4%).
Services Occupations by Sex
Within the Services occupations in Bollinger County, the most male-oriented occupations are Firefighting & Prevention (100.0%), Security & Protection (84.2%), and Cleaning & Maintenance (48.1%), while the most female-oriented occupations are Law Enforcement (100.0%), Personal Care & Service (78.4%), and Healthcare Support (73.7%).
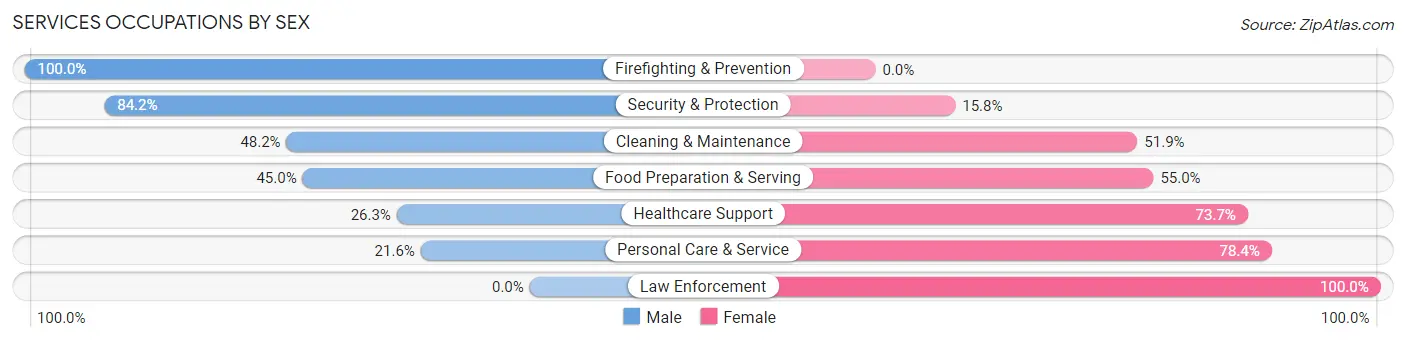
| Occupation | Male | Female |
| Healthcare Support | 50 (26.3%) | 140 (73.7%) |
| Security & Protection | 16 (84.2%) | 3 (15.8%) |
| Firefighting & Prevention | 16 (100.0%) | 0 (0.0%) |
| Law Enforcement | 0 (0.0%) | 3 (100.0%) |
| Food Preparation & Serving | 76 (45.0%) | 93 (55.0%) |
| Cleaning & Maintenance | 78 (48.1%) | 84 (51.8%) |
| Personal Care & Service | 22 (21.6%) | 80 (78.4%) |
| Total (Category) | 242 (37.7%) | 400 (62.3%) |
| Total (Overall) | 2,585 (55.4%) | 2,079 (44.6%) |
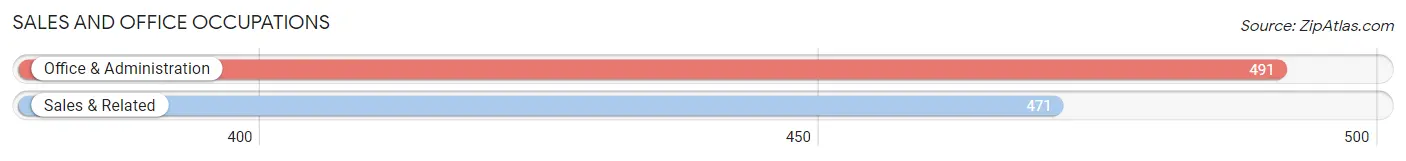
Sales and Office Occupations
The most common Sales and Office occupations in Bollinger County are Office & Administration (491 | 10.5%), and Sales & Related (471 | 10.1%).
Sales and Office Occupations by Sex
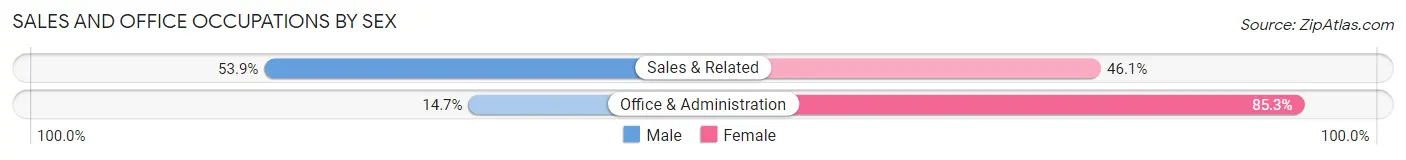
| Occupation | Male | Female |
| Sales & Related | 254 (53.9%) | 217 (46.1%) |
| Office & Administration | 72 (14.7%) | 419 (85.3%) |
| Total (Category) | 326 (33.9%) | 636 (66.1%) |
| Total (Overall) | 2,585 (55.4%) | 2,079 (44.6%) |
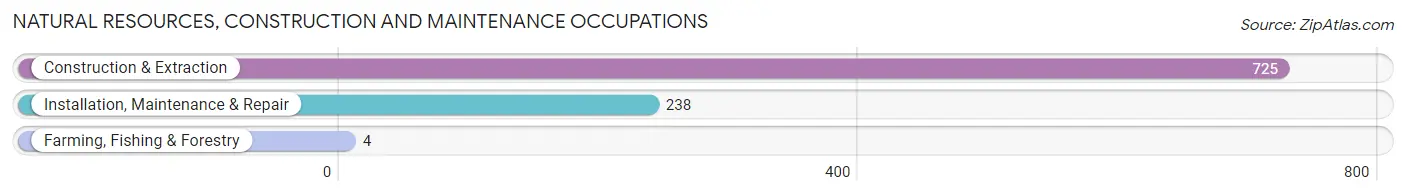
Natural Resources, Construction and Maintenance Occupations
The most common Natural Resources, Construction and Maintenance occupations in Bollinger County are Construction & Extraction (725 | 15.5%), Installation, Maintenance & Repair (238 | 5.1%), and Farming, Fishing & Forestry (4 | 0.1%).
Natural Resources, Construction and Maintenance Occupations by Sex
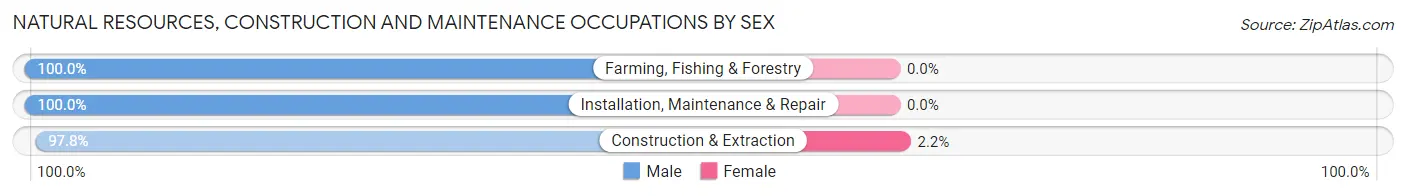
| Occupation | Male | Female |
| Farming, Fishing & Forestry | 4 (100.0%) | 0 (0.0%) |
| Construction & Extraction | 709 (97.8%) | 16 (2.2%) |
| Installation, Maintenance & Repair | 238 (100.0%) | 0 (0.0%) |
| Total (Category) | 951 (98.4%) | 16 (1.7%) |
| Total (Overall) | 2,585 (55.4%) | 2,079 (44.6%) |
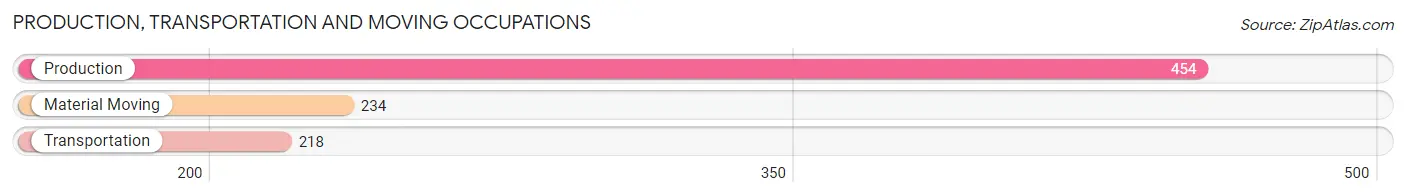
Production, Transportation and Moving Occupations
The most common Production, Transportation and Moving occupations in Bollinger County are Production (454 | 9.7%), Material Moving (234 | 5.0%), and Transportation (218 | 4.7%).
Production, Transportation and Moving Occupations by Sex
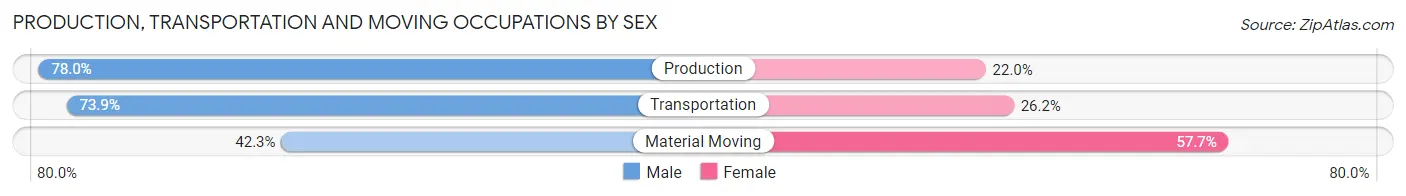
| Occupation | Male | Female |
| Production | 354 (78.0%) | 100 (22.0%) |
| Transportation | 161 (73.9%) | 57 (26.2%) |
| Material Moving | 99 (42.3%) | 135 (57.7%) |
| Total (Category) | 614 (67.8%) | 292 (32.2%) |
| Total (Overall) | 2,585 (55.4%) | 2,079 (44.6%) |
Employment Industries by Sex in Bollinger County
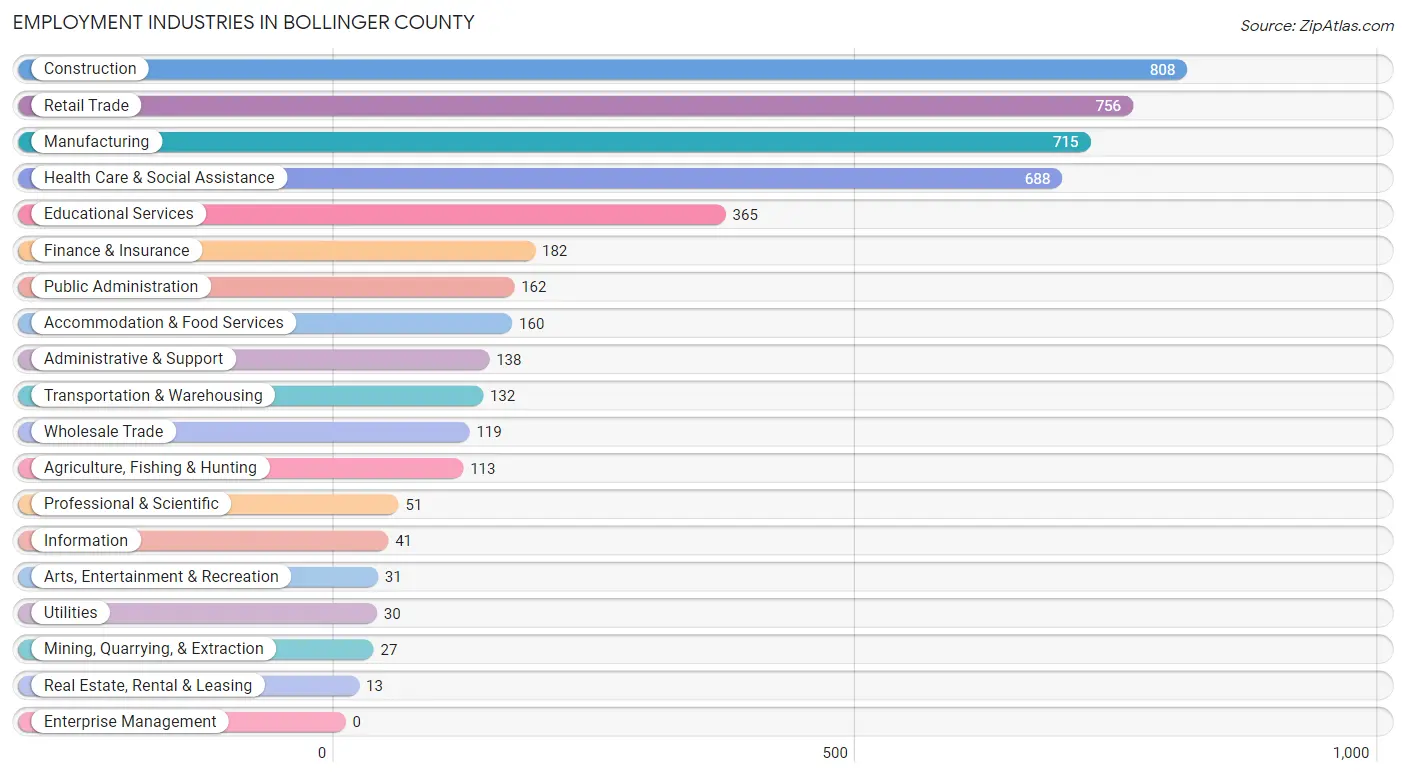
Employment Industries in Bollinger County
The major employment industries in Bollinger County include Construction (808 | 17.3%), Retail Trade (756 | 16.2%), Manufacturing (715 | 15.3%), Health Care & Social Assistance (688 | 14.7%), and Educational Services (365 | 7.8%).
Employment Industries by Sex in Bollinger County
The Bollinger County industries that see more men than women are Mining, Quarrying, & Extraction (100.0%), Arts, Entertainment & Recreation (100.0%), and Construction (93.1%), whereas the industries that tend to have a higher number of women are Accommodation & Food Services (80.6%), Educational Services (75.6%), and Health Care & Social Assistance (73.7%).
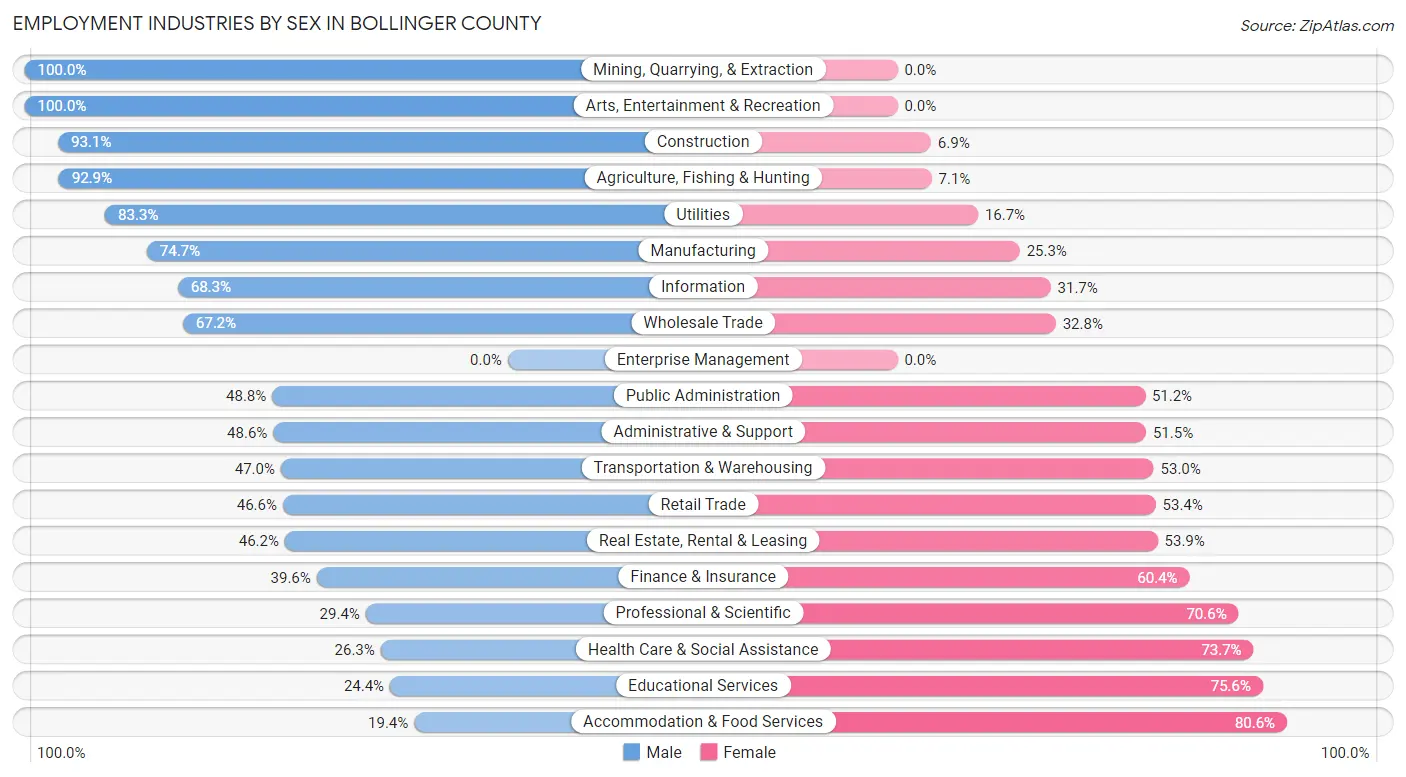
| Industry | Male | Female |
| Agriculture, Fishing & Hunting | 105 (92.9%) | 8 (7.1%) |
| Mining, Quarrying, & Extraction | 27 (100.0%) | 0 (0.0%) |
| Construction | 752 (93.1%) | 56 (6.9%) |
| Manufacturing | 534 (74.7%) | 181 (25.3%) |
| Wholesale Trade | 80 (67.2%) | 39 (32.8%) |
| Retail Trade | 352 (46.6%) | 404 (53.4%) |
| Transportation & Warehousing | 62 (47.0%) | 70 (53.0%) |
| Utilities | 25 (83.3%) | 5 (16.7%) |
| Information | 28 (68.3%) | 13 (31.7%) |
| Finance & Insurance | 72 (39.6%) | 110 (60.4%) |
| Real Estate, Rental & Leasing | 6 (46.2%) | 7 (53.8%) |
| Professional & Scientific | 15 (29.4%) | 36 (70.6%) |
| Enterprise Management | 0 (0.0%) | 0 (0.0%) |
| Administrative & Support | 67 (48.5%) | 71 (51.4%) |
| Educational Services | 89 (24.4%) | 276 (75.6%) |
| Health Care & Social Assistance | 181 (26.3%) | 507 (73.7%) |
| Arts, Entertainment & Recreation | 31 (100.0%) | 0 (0.0%) |
| Accommodation & Food Services | 31 (19.4%) | 129 (80.6%) |
| Public Administration | 79 (48.8%) | 83 (51.2%) |
| Total | 2,585 (55.4%) | 2,079 (44.6%) |
Education in Bollinger County
School Enrollment in Bollinger County
The most common levels of schooling among the 2,123 students in Bollinger County are elementary school (587 | 27.7%), high school (583 | 27.5%), and middle school (519 | 24.4%).
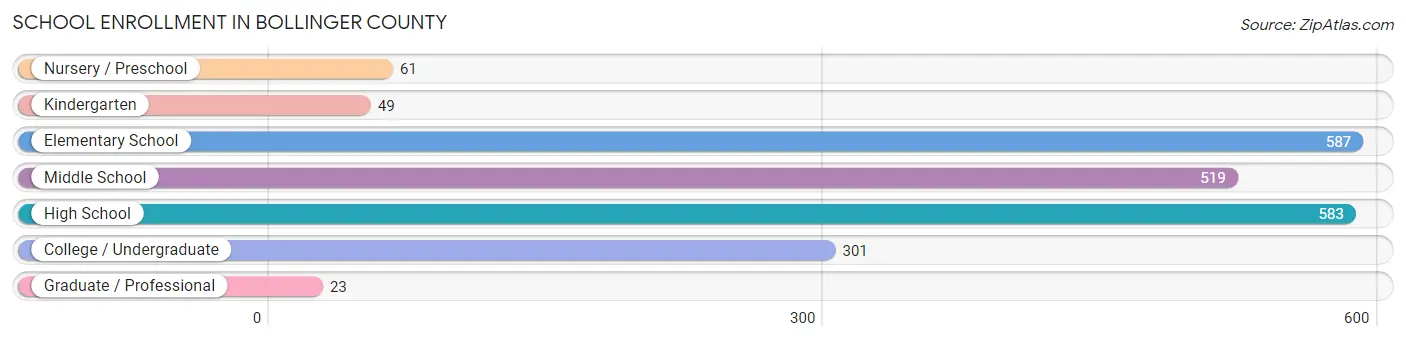
| School Level | # Students | % Students |
| Nursery / Preschool | 61 | 2.9% |
| Kindergarten | 49 | 2.3% |
| Elementary School | 587 | 27.7% |
| Middle School | 519 | 24.4% |
| High School | 583 | 27.5% |
| College / Undergraduate | 301 | 14.2% |
| Graduate / Professional | 23 | 1.1% |
| Total | 2,123 | 100.0% |
School Enrollment by Age by Funding Source in Bollinger County
Out of a total of 2,123 students who are enrolled in schools in Bollinger County, 170 (8.0%) attend a private institution, while the remaining 1,953 (92.0%) are enrolled in public schools. The age group of 25 to 34 year olds has the highest likelihood of being enrolled in private schools, with 17 (100.0% in the age bracket) enrolled. Conversely, the age group of 3 to 4 year olds has the lowest likelihood of being enrolled in a private school, with 49 (100.0% in the age bracket) attending a public institution.
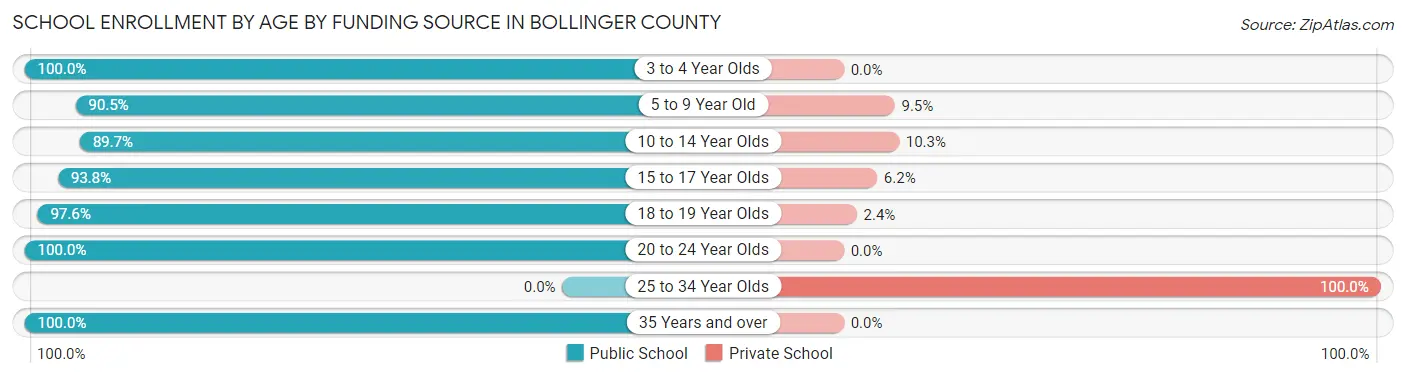
| Age Bracket | Public School | Private School |
| 3 to 4 Year Olds | 49 (100.0%) | 0 (0.0%) |
| 5 to 9 Year Old | 545 (90.5%) | 57 (9.5%) |
| 10 to 14 Year Olds | 568 (89.7%) | 65 (10.3%) |
| 15 to 17 Year Olds | 409 (93.8%) | 27 (6.2%) |
| 18 to 19 Year Olds | 162 (97.6%) | 4 (2.4%) |
| 20 to 24 Year Olds | 216 (100.0%) | 0 (0.0%) |
| 25 to 34 Year Olds | 0 (0.0%) | 17 (100.0%) |
| 35 Years and over | 4 (100.0%) | 0 (0.0%) |
| Total | 1,953 (92.0%) | 170 (8.0%) |
Educational Attainment by Field of Study in Bollinger County
Education (189 | 19.4%), communications (144 | 14.8%), science & technology (136 | 14.0%), liberal arts & history (92 | 9.5%), and bio, nature & agricultural (79 | 8.1%) are the most common fields of study among 974 individuals in Bollinger County who have obtained a bachelor's degree or higher.
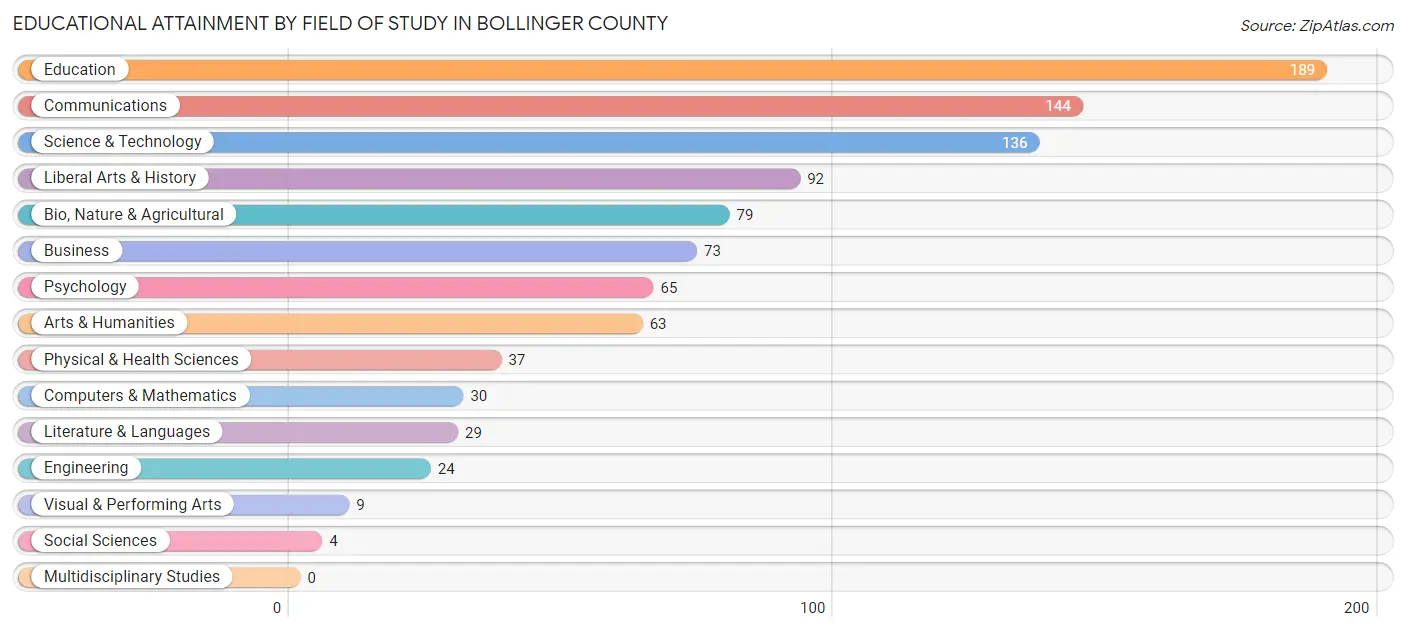
| Field of Study | # Graduates | % Graduates |
| Computers & Mathematics | 30 | 3.1% |
| Bio, Nature & Agricultural | 79 | 8.1% |
| Physical & Health Sciences | 37 | 3.8% |
| Psychology | 65 | 6.7% |
| Social Sciences | 4 | 0.4% |
| Engineering | 24 | 2.5% |
| Multidisciplinary Studies | 0 | 0.0% |
| Science & Technology | 136 | 14.0% |
| Business | 73 | 7.5% |
| Education | 189 | 19.4% |
| Literature & Languages | 29 | 3.0% |
| Liberal Arts & History | 92 | 9.5% |
| Visual & Performing Arts | 9 | 0.9% |
| Communications | 144 | 14.8% |
| Arts & Humanities | 63 | 6.5% |
| Total | 974 | 100.0% |
Transportation & Commute in Bollinger County
Vehicle Availability by Sex in Bollinger County
The most prevalent vehicle ownership categories in Bollinger County are males with 2 vehicles (982, accounting for 40.4%) and females with 2 vehicles (839, making up 48.5%).
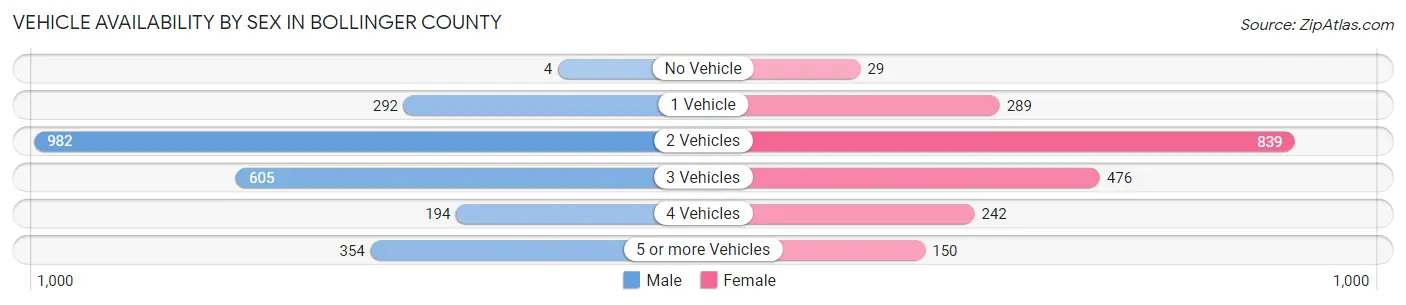
| Vehicles Available | Male | Female |
| No Vehicle | 4 (0.2%) | 29 (1.4%) |
| 1 Vehicle | 292 (12.0%) | 289 (14.3%) |
| 2 Vehicles | 982 (40.4%) | 839 (41.4%) |
| 3 Vehicles | 605 (24.9%) | 476 (23.5%) |
| 4 Vehicles | 194 (8.0%) | 242 (11.9%) |
| 5 or more Vehicles | 354 (14.6%) | 150 (7.4%) |
| Total | 2,431 (100.0%) | 2,025 (100.0%) |
Commute Time in Bollinger County
The most frequently occuring commute durations in Bollinger County are 45 to 59 minutes (837 commuters, 20.5%), 30 to 34 minutes (534 commuters, 13.1%), and 15 to 19 minutes (533 commuters, 13.1%).
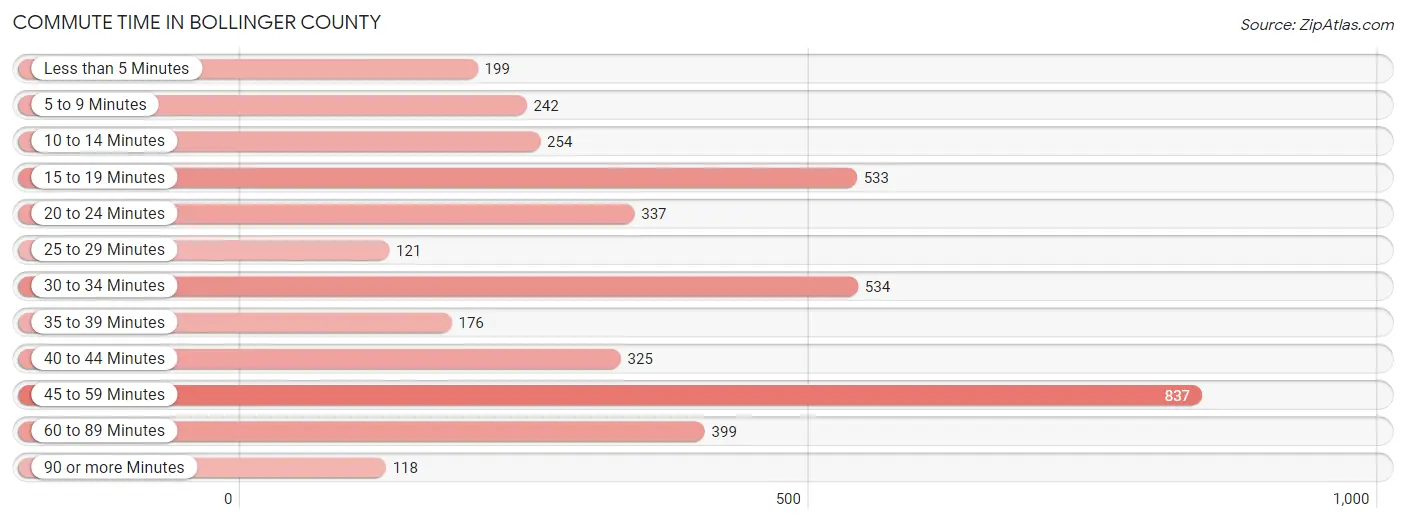
| Commute Time | # Commuters | % Commuters |
| Less than 5 Minutes | 199 | 4.9% |
| 5 to 9 Minutes | 242 | 5.9% |
| 10 to 14 Minutes | 254 | 6.2% |
| 15 to 19 Minutes | 533 | 13.1% |
| 20 to 24 Minutes | 337 | 8.3% |
| 25 to 29 Minutes | 121 | 3.0% |
| 30 to 34 Minutes | 534 | 13.1% |
| 35 to 39 Minutes | 176 | 4.3% |
| 40 to 44 Minutes | 325 | 8.0% |
| 45 to 59 Minutes | 837 | 20.5% |
| 60 to 89 Minutes | 399 | 9.8% |
| 90 or more Minutes | 118 | 2.9% |
Commute Time by Sex in Bollinger County
The most common commute times in Bollinger County are 45 to 59 minutes (523 commuters, 24.9%) for males and 45 to 59 minutes (314 commuters, 15.9%) for females.
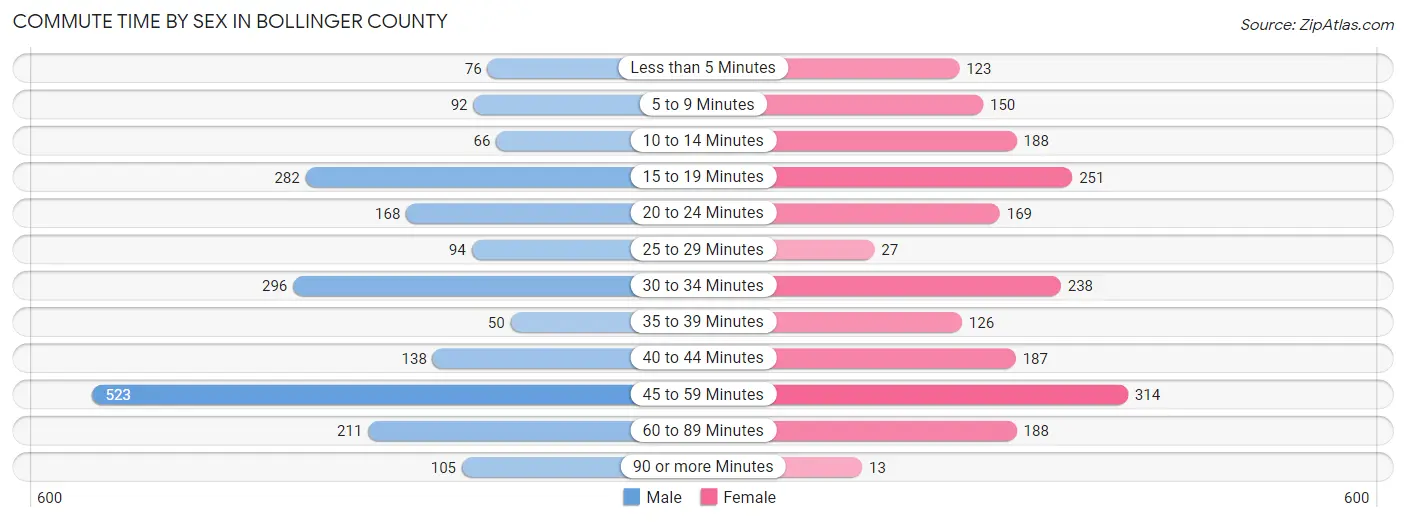
| Commute Time | Male | Female |
| Less than 5 Minutes | 76 (3.6%) | 123 (6.2%) |
| 5 to 9 Minutes | 92 (4.4%) | 150 (7.6%) |
| 10 to 14 Minutes | 66 (3.1%) | 188 (9.5%) |
| 15 to 19 Minutes | 282 (13.4%) | 251 (12.7%) |
| 20 to 24 Minutes | 168 (8.0%) | 169 (8.6%) |
| 25 to 29 Minutes | 94 (4.5%) | 27 (1.4%) |
| 30 to 34 Minutes | 296 (14.1%) | 238 (12.1%) |
| 35 to 39 Minutes | 50 (2.4%) | 126 (6.4%) |
| 40 to 44 Minutes | 138 (6.6%) | 187 (9.5%) |
| 45 to 59 Minutes | 523 (24.9%) | 314 (15.9%) |
| 60 to 89 Minutes | 211 (10.0%) | 188 (9.5%) |
| 90 or more Minutes | 105 (5.0%) | 13 (0.7%) |
Time of Departure to Work by Sex in Bollinger County
The most frequent times of departure to work in Bollinger County are 7:00 AM to 7:29 AM (419, 19.9%) for males and 7:00 AM to 7:29 AM (336, 17.0%) for females.
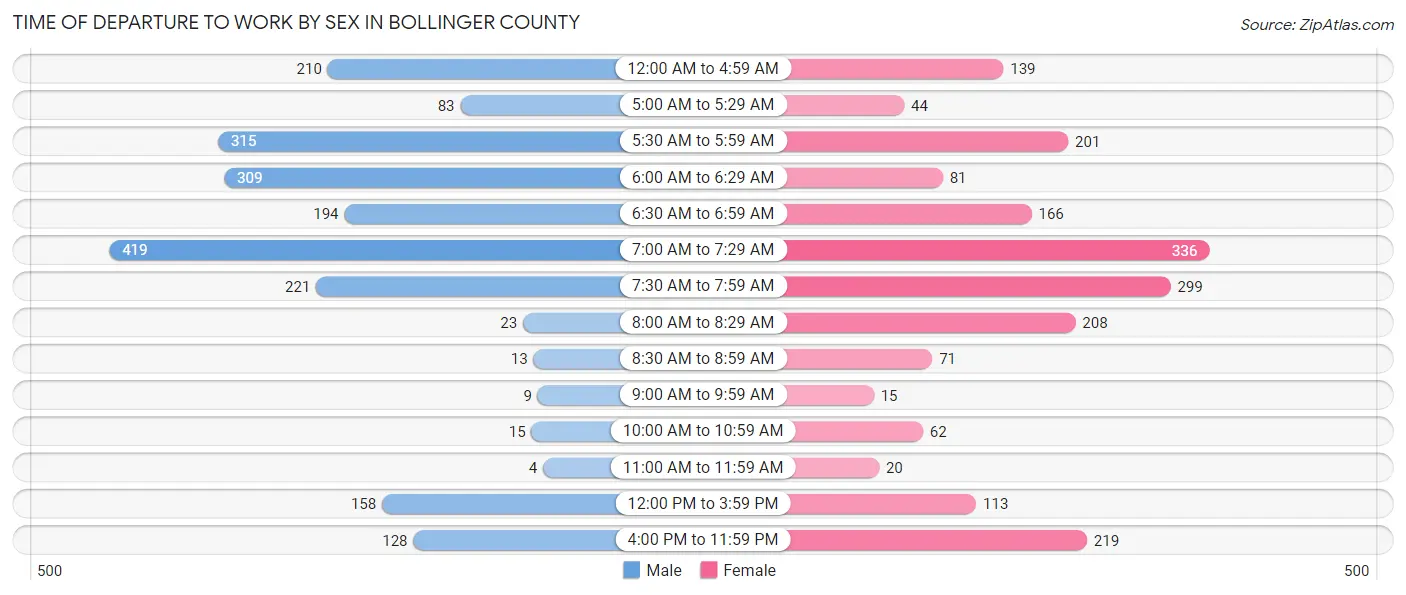
| Time of Departure | Male | Female |
| 12:00 AM to 4:59 AM | 210 (10.0%) | 139 (7.0%) |
| 5:00 AM to 5:29 AM | 83 (4.0%) | 44 (2.2%) |
| 5:30 AM to 5:59 AM | 315 (15.0%) | 201 (10.2%) |
| 6:00 AM to 6:29 AM | 309 (14.7%) | 81 (4.1%) |
| 6:30 AM to 6:59 AM | 194 (9.2%) | 166 (8.4%) |
| 7:00 AM to 7:29 AM | 419 (19.9%) | 336 (17.0%) |
| 7:30 AM to 7:59 AM | 221 (10.5%) | 299 (15.1%) |
| 8:00 AM to 8:29 AM | 23 (1.1%) | 208 (10.5%) |
| 8:30 AM to 8:59 AM | 13 (0.6%) | 71 (3.6%) |
| 9:00 AM to 9:59 AM | 9 (0.4%) | 15 (0.8%) |
| 10:00 AM to 10:59 AM | 15 (0.7%) | 62 (3.1%) |
| 11:00 AM to 11:59 AM | 4 (0.2%) | 20 (1.0%) |
| 12:00 PM to 3:59 PM | 158 (7.5%) | 113 (5.7%) |
| 4:00 PM to 11:59 PM | 128 (6.1%) | 219 (11.1%) |
| Total | 2,101 (100.0%) | 1,974 (100.0%) |
Housing Occupancy in Bollinger County
Occupancy by Ownership in Bollinger County
Of the total 3,791 dwellings in Bollinger County, owner-occupied units account for 3,052 (80.5%), while renter-occupied units make up 739 (19.5%).
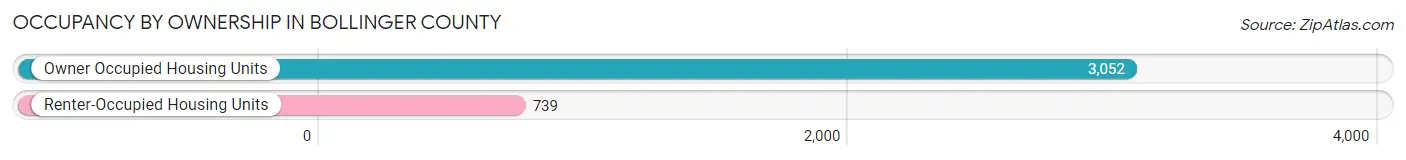
| Occupancy | # Housing Units | % Housing Units |
| Owner Occupied Housing Units | 3,052 | 80.5% |
| Renter-Occupied Housing Units | 739 | 19.5% |
| Total Occupied Housing Units | 3,791 | 100.0% |
Occupancy by Household Size in Bollinger County
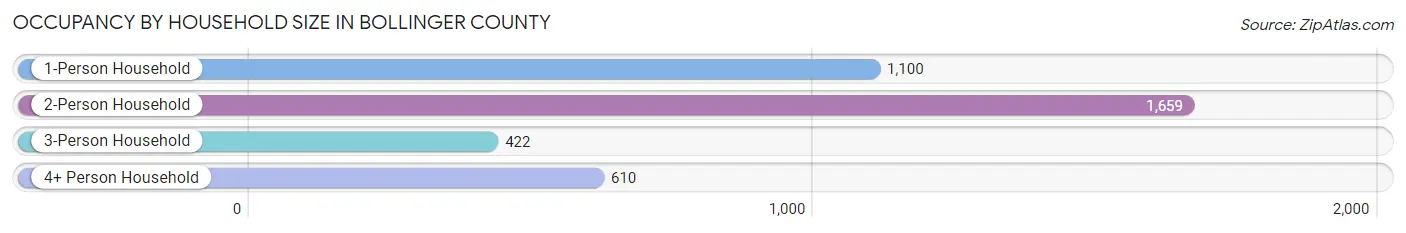
| Household Size | # Housing Units | % Housing Units |
| 1-Person Household | 1,100 | 29.0% |
| 2-Person Household | 1,659 | 43.8% |
| 3-Person Household | 422 | 11.1% |
| 4+ Person Household | 610 | 16.1% |
| Total Housing Units | 3,791 | 100.0% |
Occupancy by Ownership by Household Size in Bollinger County
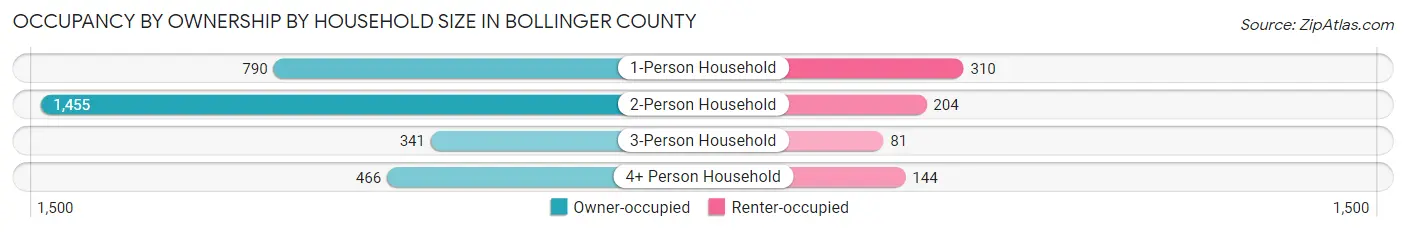
| Household Size | Owner-occupied | Renter-occupied |
| 1-Person Household | 790 (71.8%) | 310 (28.2%) |
| 2-Person Household | 1,455 (87.7%) | 204 (12.3%) |
| 3-Person Household | 341 (80.8%) | 81 (19.2%) |
| 4+ Person Household | 466 (76.4%) | 144 (23.6%) |
| Total Housing Units | 3,052 (80.5%) | 739 (19.5%) |
Occupancy by Educational Attainment in Bollinger County
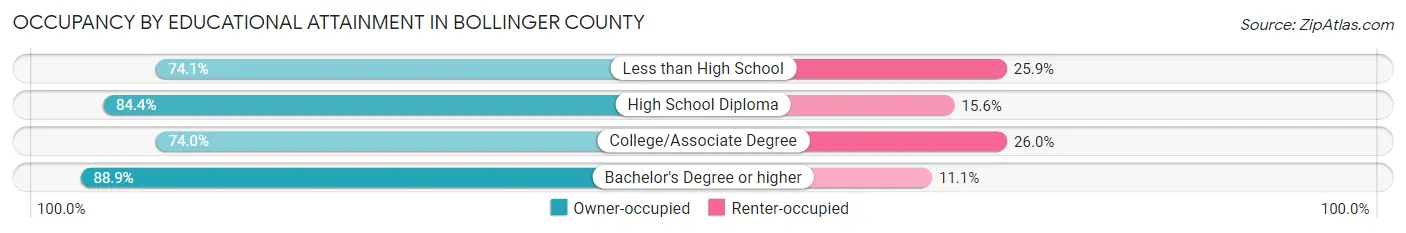
| Household Size | Owner-occupied | Renter-occupied |
| Less than High School | 363 (74.1%) | 127 (25.9%) |
| High School Diploma | 1,520 (84.4%) | 280 (15.6%) |
| College/Associate Degree | 824 (74.0%) | 289 (26.0%) |
| Bachelor's Degree or higher | 345 (88.9%) | 43 (11.1%) |
Occupancy by Age of Householder in Bollinger County
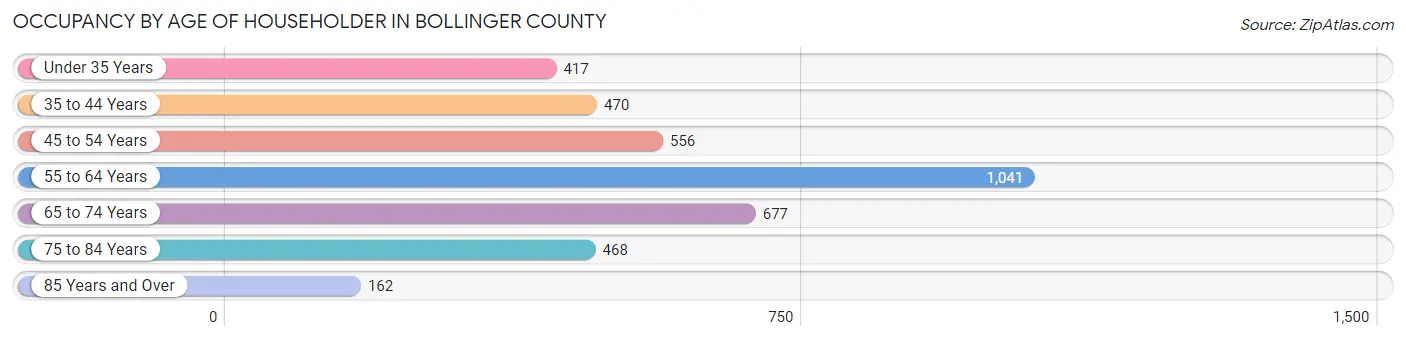
| Age Bracket | # Households | % Households |
| Under 35 Years | 417 | 11.0% |
| 35 to 44 Years | 470 | 12.4% |
| 45 to 54 Years | 556 | 14.7% |
| 55 to 64 Years | 1,041 | 27.5% |
| 65 to 74 Years | 677 | 17.9% |
| 75 to 84 Years | 468 | 12.3% |
| 85 Years and Over | 162 | 4.3% |
| Total | 3,791 | 100.0% |
Housing Finances in Bollinger County
Median Income by Occupancy in Bollinger County
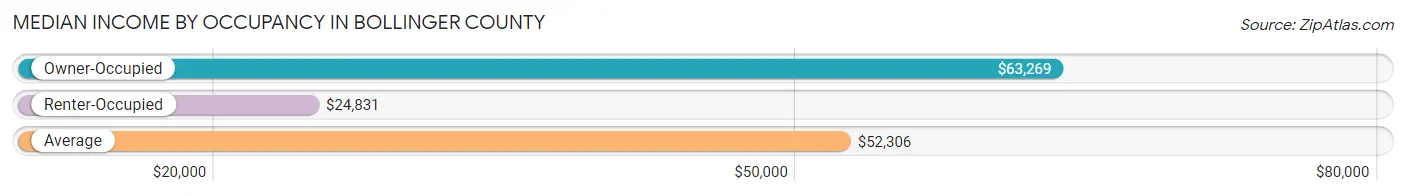
| Occupancy Type | # Households | Median Income |
| Owner-Occupied | 3,052 (80.5%) | $63,269 |
| Renter-Occupied | 739 (19.5%) | $24,831 |
| Average | 3,791 (100.0%) | $52,306 |
Occupancy by Householder Income Bracket in Bollinger County
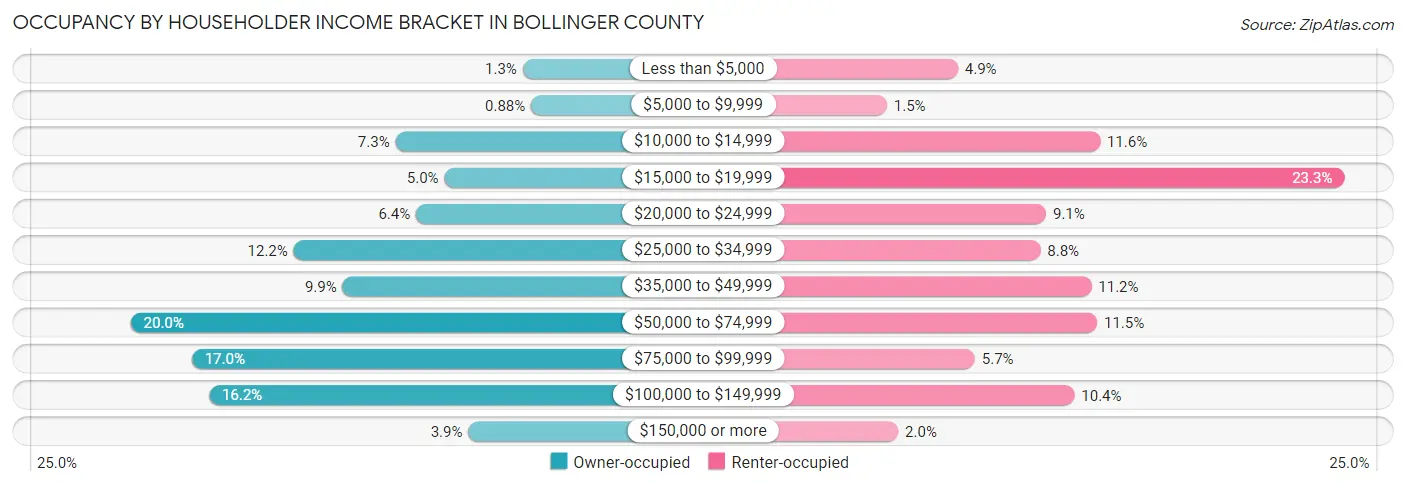
| Income Bracket | Owner-occupied | Renter-occupied |
| Less than $5,000 | 39 (1.3%) | 36 (4.9%) |
| $5,000 to $9,999 | 27 (0.9%) | 11 (1.5%) |
| $10,000 to $14,999 | 224 (7.3%) | 86 (11.6%) |
| $15,000 to $19,999 | 153 (5.0%) | 172 (23.3%) |
| $20,000 to $24,999 | 194 (6.4%) | 67 (9.1%) |
| $25,000 to $34,999 | 372 (12.2%) | 65 (8.8%) |
| $35,000 to $49,999 | 301 (9.9%) | 83 (11.2%) |
| $50,000 to $74,999 | 609 (20.0%) | 85 (11.5%) |
| $75,000 to $99,999 | 520 (17.0%) | 42 (5.7%) |
| $100,000 to $149,999 | 495 (16.2%) | 77 (10.4%) |
| $150,000 or more | 118 (3.9%) | 15 (2.0%) |
| Total | 3,052 (100.0%) | 739 (100.0%) |
Monthly Housing Cost Tiers in Bollinger County
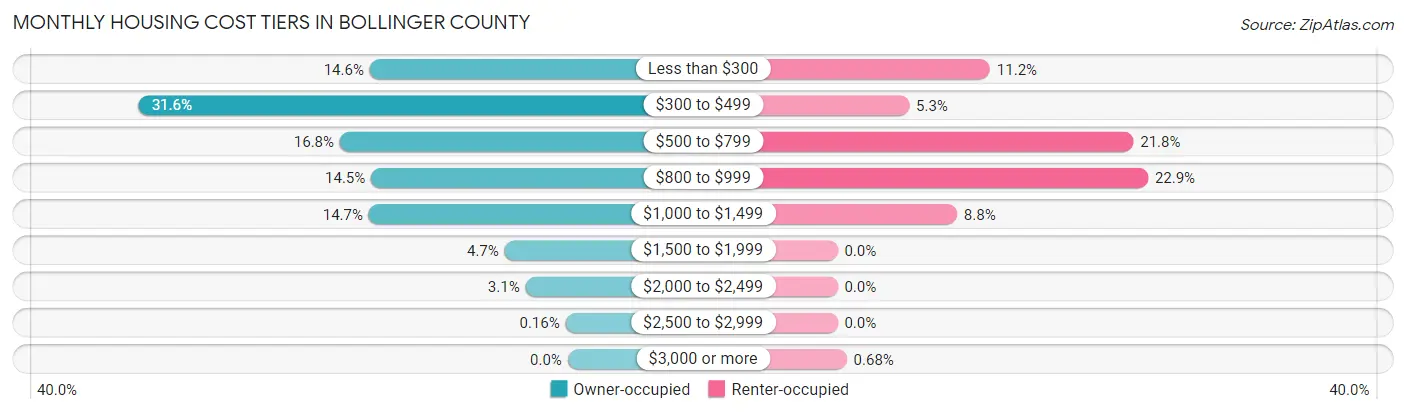
| Monthly Cost | Owner-occupied | Renter-occupied |
| Less than $300 | 445 (14.6%) | 83 (11.2%) |
| $300 to $499 | 964 (31.6%) | 39 (5.3%) |
| $500 to $799 | 512 (16.8%) | 161 (21.8%) |
| $800 to $999 | 442 (14.5%) | 169 (22.9%) |
| $1,000 to $1,499 | 447 (14.6%) | 65 (8.8%) |
| $1,500 to $1,999 | 142 (4.6%) | 0 (0.0%) |
| $2,000 to $2,499 | 95 (3.1%) | 0 (0.0%) |
| $2,500 to $2,999 | 5 (0.2%) | 0 (0.0%) |
| $3,000 or more | 0 (0.0%) | 5 (0.7%) |
| Total | 3,052 (100.0%) | 739 (100.0%) |
Physical Housing Characteristics in Bollinger County
Housing Structures in Bollinger County
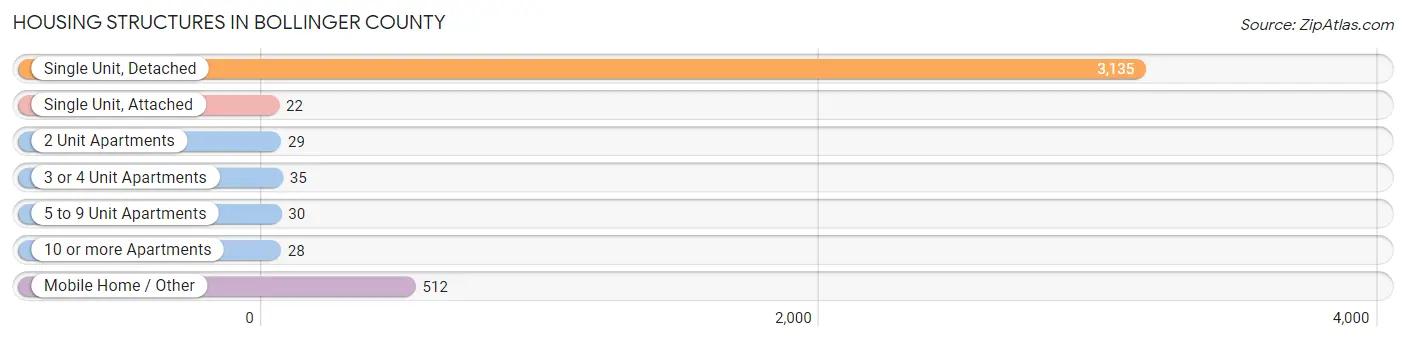
| Structure Type | # Housing Units | % Housing Units |
| Single Unit, Detached | 3,135 | 82.7% |
| Single Unit, Attached | 22 | 0.6% |
| 2 Unit Apartments | 29 | 0.8% |
| 3 or 4 Unit Apartments | 35 | 0.9% |
| 5 to 9 Unit Apartments | 30 | 0.8% |
| 10 or more Apartments | 28 | 0.7% |
| Mobile Home / Other | 512 | 13.5% |
| Total | 3,791 | 100.0% |
Housing Structures by Occupancy in Bollinger County
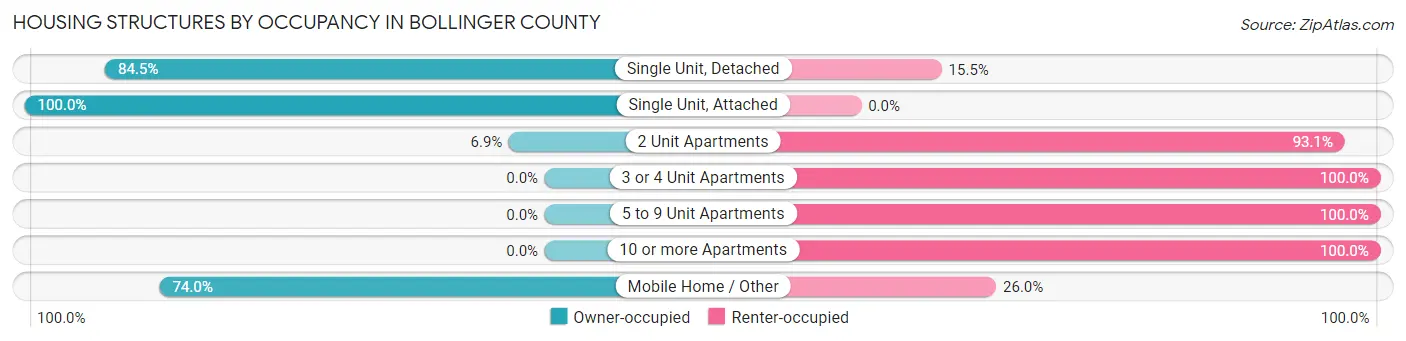
| Structure Type | Owner-occupied | Renter-occupied |
| Single Unit, Detached | 2,649 (84.5%) | 486 (15.5%) |
| Single Unit, Attached | 22 (100.0%) | 0 (0.0%) |
| 2 Unit Apartments | 2 (6.9%) | 27 (93.1%) |
| 3 or 4 Unit Apartments | 0 (0.0%) | 35 (100.0%) |
| 5 to 9 Unit Apartments | 0 (0.0%) | 30 (100.0%) |
| 10 or more Apartments | 0 (0.0%) | 28 (100.0%) |
| Mobile Home / Other | 379 (74.0%) | 133 (26.0%) |
| Total | 3,052 (80.5%) | 739 (19.5%) |
Housing Structures by Number of Rooms in Bollinger County
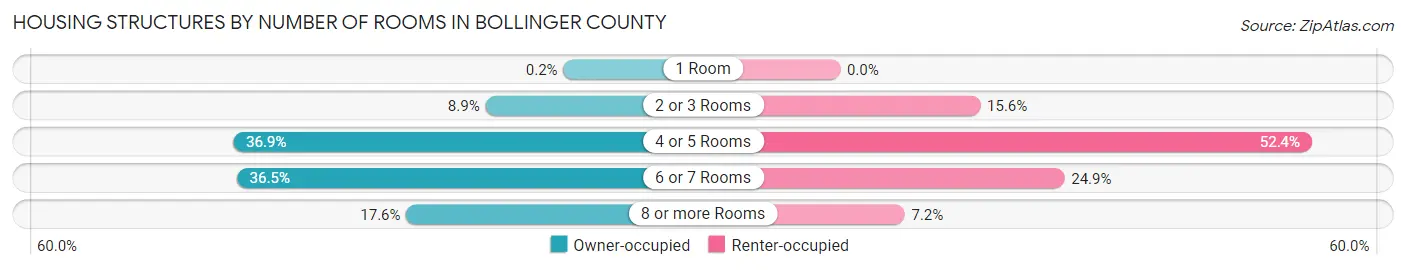
| Number of Rooms | Owner-occupied | Renter-occupied |
| 1 Room | 6 (0.2%) | 0 (0.0%) |
| 2 or 3 Rooms | 270 (8.8%) | 115 (15.6%) |
| 4 or 5 Rooms | 1,125 (36.9%) | 387 (52.4%) |
| 6 or 7 Rooms | 1,113 (36.5%) | 184 (24.9%) |
| 8 or more Rooms | 538 (17.6%) | 53 (7.2%) |
| Total | 3,052 (100.0%) | 739 (100.0%) |
Housing Structure by Heating Type in Bollinger County
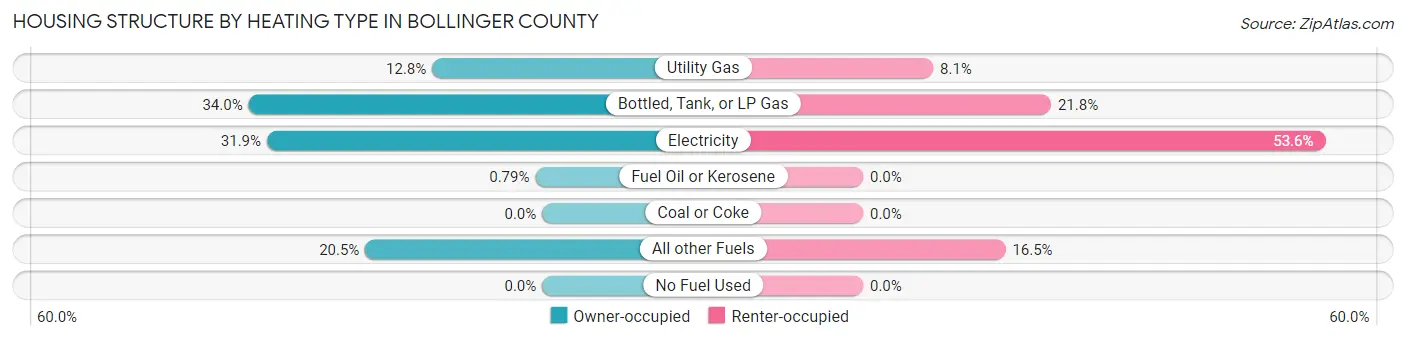
| Heating Type | Owner-occupied | Renter-occupied |
| Utility Gas | 389 (12.8%) | 60 (8.1%) |
| Bottled, Tank, or LP Gas | 1,039 (34.0%) | 161 (21.8%) |
| Electricity | 974 (31.9%) | 396 (53.6%) |
| Fuel Oil or Kerosene | 24 (0.8%) | 0 (0.0%) |
| Coal or Coke | 0 (0.0%) | 0 (0.0%) |
| All other Fuels | 626 (20.5%) | 122 (16.5%) |
| No Fuel Used | 0 (0.0%) | 0 (0.0%) |
| Total | 3,052 (100.0%) | 739 (100.0%) |
Household Vehicle Usage in Bollinger County
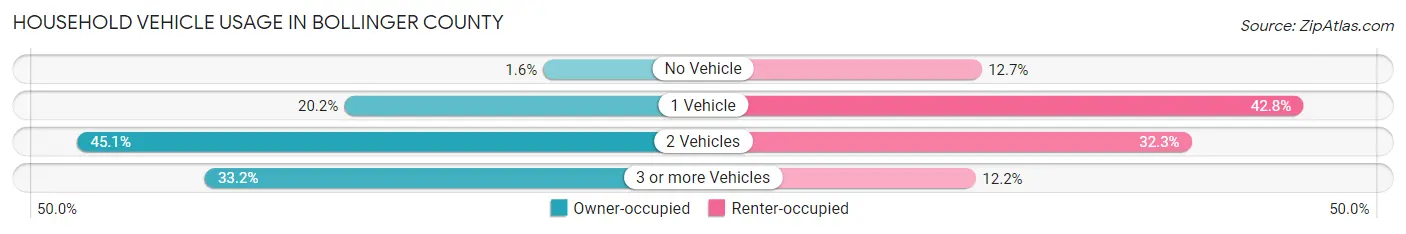
| Vehicles per Household | Owner-occupied | Renter-occupied |
| No Vehicle | 49 (1.6%) | 94 (12.7%) |
| 1 Vehicle | 616 (20.2%) | 316 (42.8%) |
| 2 Vehicles | 1,375 (45.1%) | 239 (32.3%) |
| 3 or more Vehicles | 1,012 (33.2%) | 90 (12.2%) |
| Total | 3,052 (100.0%) | 739 (100.0%) |
Real Estate & Mortgages in Bollinger County
Real Estate and Mortgage Overview in Bollinger County
| Characteristic | Without Mortgage | With Mortgage |
| Housing Units | 1,729 | 1,323 |
| Median Property Value | $107,300 | $157,900 |
| Median Household Income | $37,634 | $58 |
| Monthly Housing Costs | $377 | $0 |
| Real Estate Taxes | $592 | $13 |
Property Value by Mortgage Status in Bollinger County
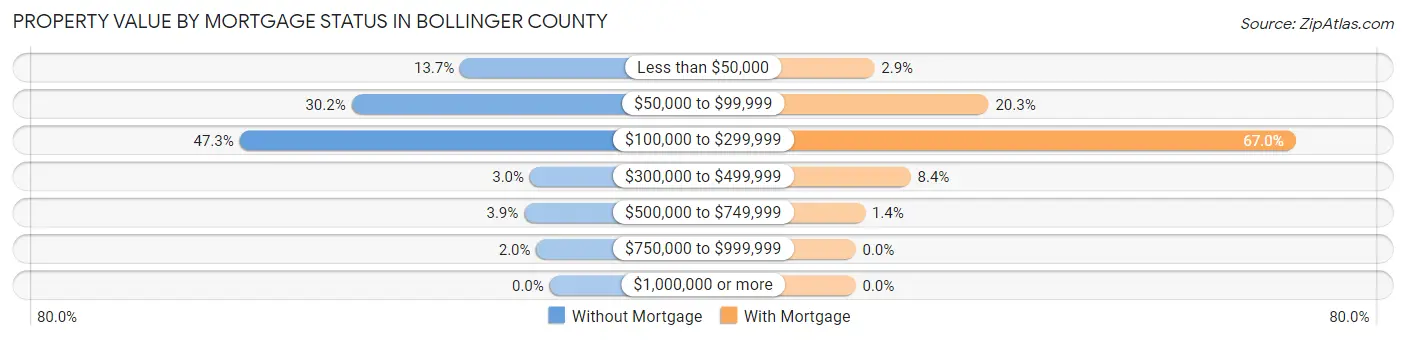
| Property Value | Without Mortgage | With Mortgage |
| Less than $50,000 | 236 (13.7%) | 38 (2.9%) |
| $50,000 to $99,999 | 522 (30.2%) | 268 (20.3%) |
| $100,000 to $299,999 | 817 (47.2%) | 887 (67.0%) |
| $300,000 to $499,999 | 52 (3.0%) | 111 (8.4%) |
| $500,000 to $749,999 | 67 (3.9%) | 19 (1.4%) |
| $750,000 to $999,999 | 35 (2.0%) | 0 (0.0%) |
| $1,000,000 or more | 0 (0.0%) | 0 (0.0%) |
| Total | 1,729 (100.0%) | 1,323 (100.0%) |
Household Income by Mortgage Status in Bollinger County
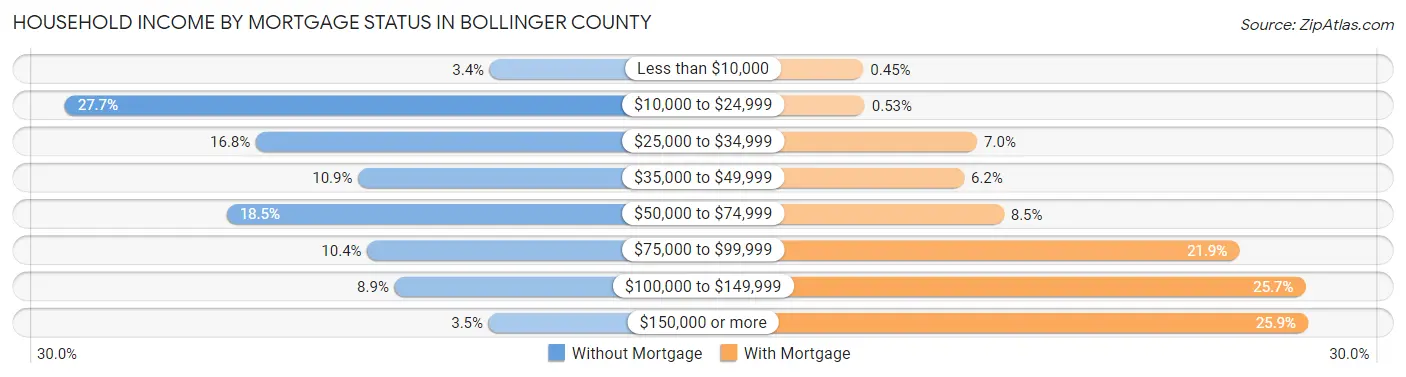
| Household Income | Without Mortgage | With Mortgage |
| Less than $10,000 | 59 (3.4%) | 6 (0.4%) |
| $10,000 to $24,999 | 479 (27.7%) | 7 (0.5%) |
| $25,000 to $34,999 | 290 (16.8%) | 92 (7.0%) |
| $35,000 to $49,999 | 189 (10.9%) | 82 (6.2%) |
| $50,000 to $74,999 | 319 (18.4%) | 112 (8.5%) |
| $75,000 to $99,999 | 180 (10.4%) | 290 (21.9%) |
| $100,000 to $149,999 | 153 (8.8%) | 340 (25.7%) |
| $150,000 or more | 60 (3.5%) | 342 (25.9%) |
| Total | 1,729 (100.0%) | 1,323 (100.0%) |
Property Value to Household Income Ratio in Bollinger County
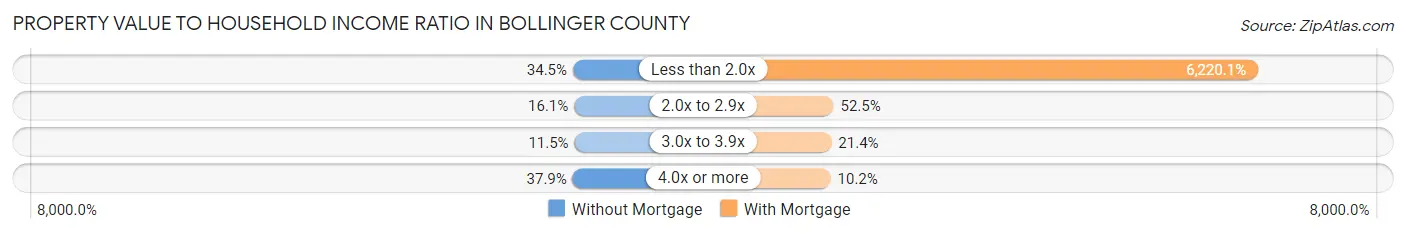
| Value-to-Income Ratio | Without Mortgage | With Mortgage |
| Less than 2.0x | 597 (34.5%) | 82,292 (6,220.1%) |
| 2.0x to 2.9x | 279 (16.1%) | 694 (52.5%) |
| 3.0x to 3.9x | 198 (11.5%) | 283 (21.4%) |
| 4.0x or more | 655 (37.9%) | 135 (10.2%) |
| Total | 1,729 (100.0%) | 1,323 (100.0%) |
Real Estate Taxes by Mortgage Status in Bollinger County
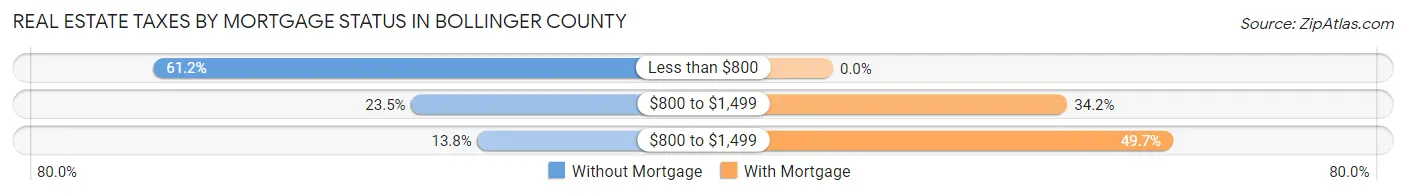
| Property Taxes | Without Mortgage | With Mortgage |
| Less than $800 | 1,058 (61.2%) | 0 (0.0%) |
| $800 to $1,499 | 406 (23.5%) | 453 (34.2%) |
| $800 to $1,499 | 239 (13.8%) | 657 (49.7%) |
| Total | 1,729 (100.0%) | 1,323 (100.0%) |
Health & Disability in Bollinger County
Health Insurance Coverage by Age in Bollinger County
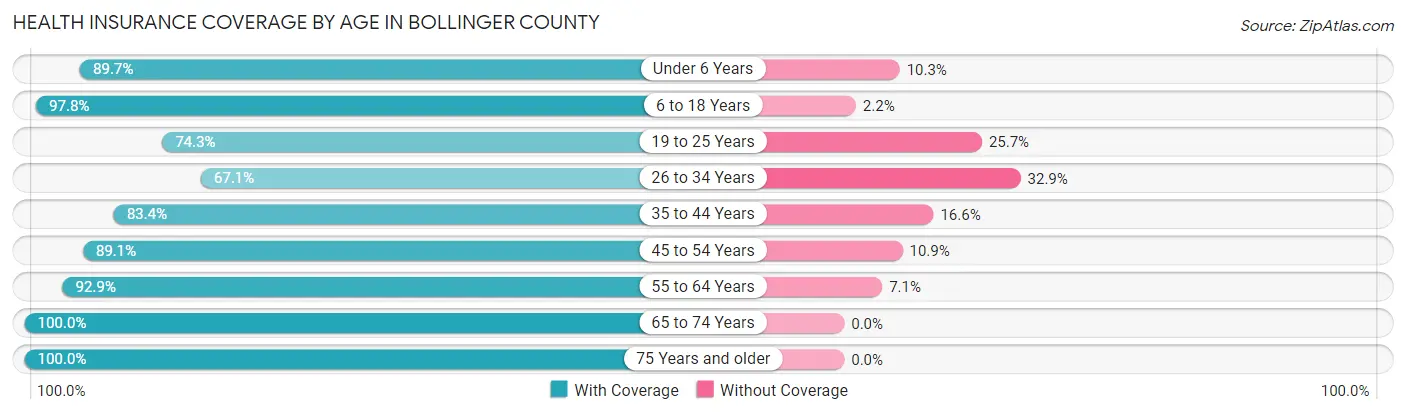
| Age Bracket | With Coverage | Without Coverage |
| Under 6 Years | 547 (89.7%) | 63 (10.3%) |
| 6 to 18 Years | 1,724 (97.8%) | 38 (2.2%) |
| 19 to 25 Years | 530 (74.3%) | 183 (25.7%) |
| 26 to 34 Years | 690 (67.1%) | 338 (32.9%) |
| 35 to 44 Years | 1,008 (83.4%) | 201 (16.6%) |
| 45 to 54 Years | 1,198 (89.1%) | 146 (10.9%) |
| 55 to 64 Years | 1,603 (92.9%) | 122 (7.1%) |
| 65 to 74 Years | 1,283 (100.0%) | 0 (0.0%) |
| 75 Years and older | 874 (100.0%) | 0 (0.0%) |
| Total | 9,457 (89.7%) | 1,091 (10.3%) |
Health Insurance Coverage by Citizenship Status in Bollinger County
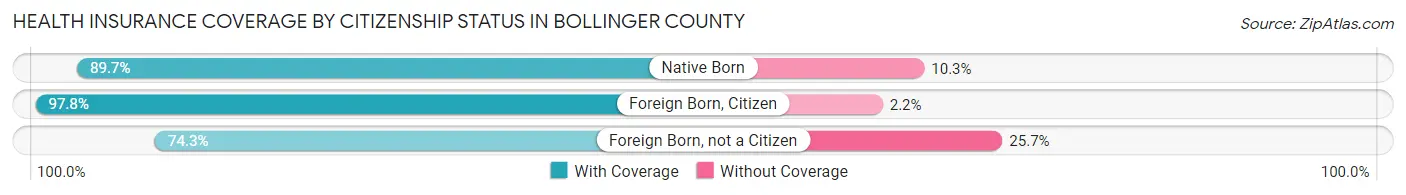
| Citizenship Status | With Coverage | Without Coverage |
| Native Born | 547 (89.7%) | 63 (10.3%) |
| Foreign Born, Citizen | 1,724 (97.8%) | 38 (2.2%) |
| Foreign Born, not a Citizen | 530 (74.3%) | 183 (25.7%) |
Health Insurance Coverage by Household Income in Bollinger County
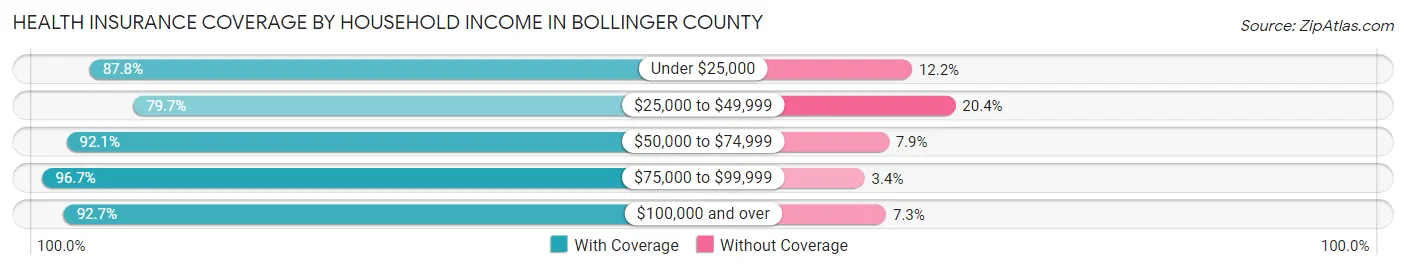
| Household Income | With Coverage | Without Coverage |
| Under $25,000 | 1,489 (87.8%) | 207 (12.2%) |
| $25,000 to $49,999 | 1,757 (79.6%) | 449 (20.3%) |
| $50,000 to $74,999 | 1,947 (92.1%) | 166 (7.9%) |
| $75,000 to $99,999 | 1,588 (96.7%) | 55 (3.4%) |
| $100,000 and over | 2,564 (92.7%) | 203 (7.3%) |
Public vs Private Health Insurance Coverage by Age in Bollinger County
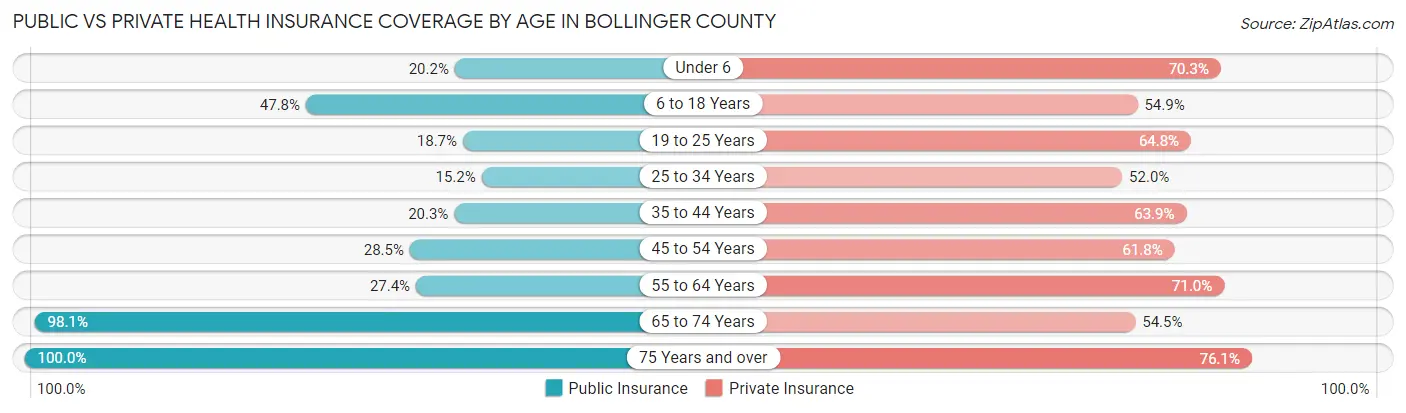
| Age Bracket | Public Insurance | Private Insurance |
| Under 6 | 123 (20.2%) | 429 (70.3%) |
| 6 to 18 Years | 842 (47.8%) | 967 (54.9%) |
| 19 to 25 Years | 133 (18.6%) | 462 (64.8%) |
| 25 to 34 Years | 156 (15.2%) | 535 (52.0%) |
| 35 to 44 Years | 245 (20.3%) | 773 (63.9%) |
| 45 to 54 Years | 383 (28.5%) | 830 (61.8%) |
| 55 to 64 Years | 472 (27.4%) | 1,224 (71.0%) |
| 65 to 74 Years | 1,259 (98.1%) | 699 (54.5%) |
| 75 Years and over | 874 (100.0%) | 665 (76.1%) |
| Total | 4,487 (42.5%) | 6,584 (62.4%) |
Disability Status by Sex by Age in Bollinger County
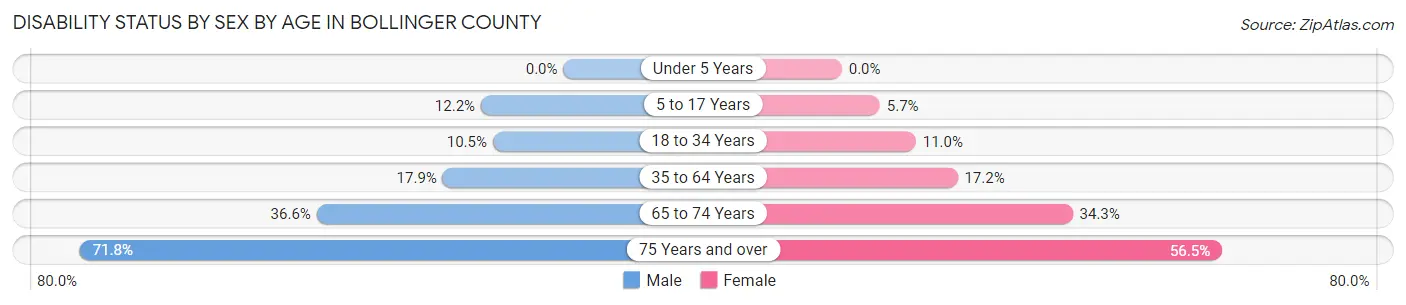
| Age Bracket | Male | Female |
| Under 5 Years | 0 (0.0%) | 0 (0.0%) |
| 5 to 17 Years | 106 (12.2%) | 48 (5.7%) |
| 18 to 34 Years | 98 (10.5%) | 99 (11.0%) |
| 35 to 64 Years | 388 (17.9%) | 363 (17.2%) |
| 65 to 74 Years | 222 (36.6%) | 232 (34.3%) |
| 75 Years and over | 288 (71.8%) | 267 (56.5%) |
Disability Class by Sex by Age in Bollinger County
Disability Class: Hearing Difficulty
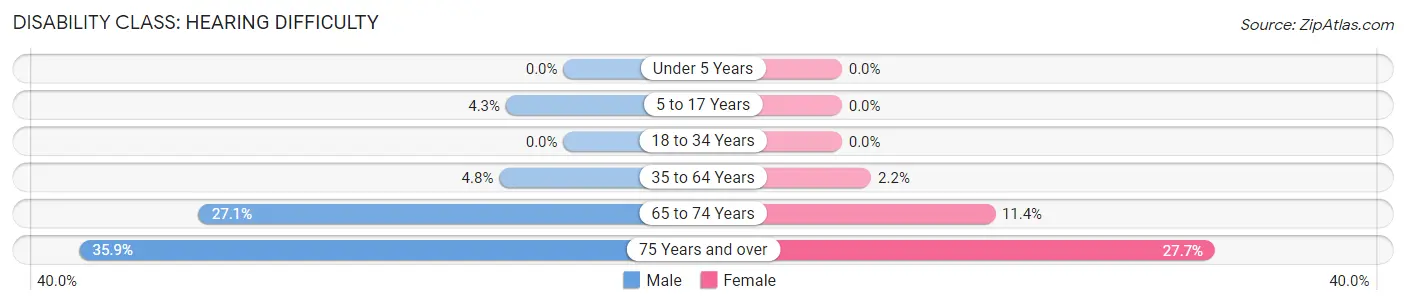
| Age Bracket | Male | Female |
| Under 5 Years | 0 (0.0%) | 0 (0.0%) |
| 5 to 17 Years | 37 (4.3%) | 0 (0.0%) |
| 18 to 34 Years | 0 (0.0%) | 0 (0.0%) |
| 35 to 64 Years | 103 (4.8%) | 46 (2.2%) |
| 65 to 74 Years | 164 (27.1%) | 77 (11.4%) |
| 75 Years and over | 144 (35.9%) | 131 (27.7%) |
Disability Class: Vision Difficulty
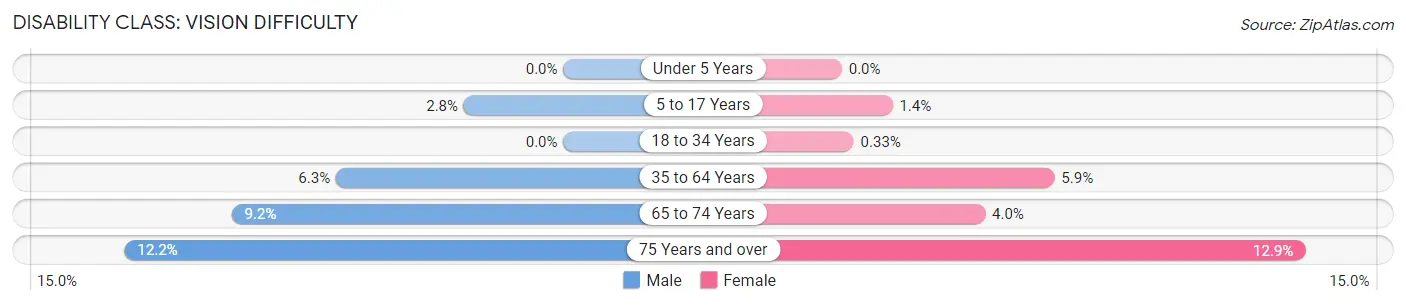
| Age Bracket | Male | Female |
| Under 5 Years | 0 (0.0%) | 0 (0.0%) |
| 5 to 17 Years | 24 (2.8%) | 12 (1.4%) |
| 18 to 34 Years | 0 (0.0%) | 3 (0.3%) |
| 35 to 64 Years | 137 (6.3%) | 125 (5.9%) |
| 65 to 74 Years | 56 (9.2%) | 27 (4.0%) |
| 75 Years and over | 49 (12.2%) | 61 (12.9%) |
Disability Class: Cognitive Difficulty
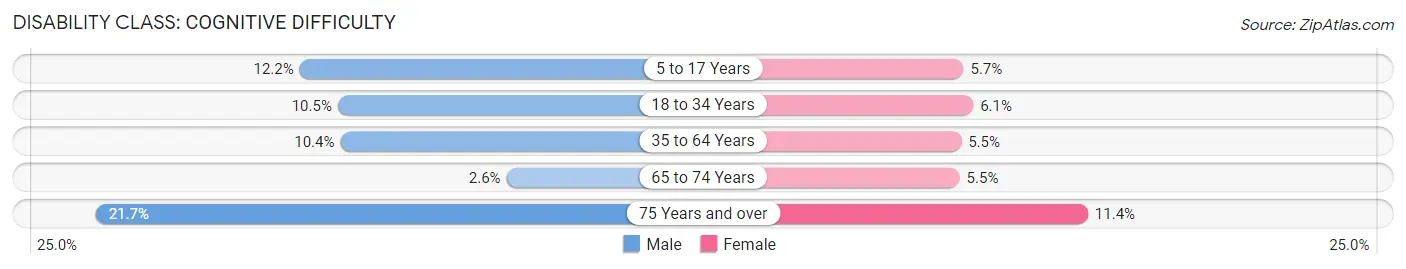
| Age Bracket | Male | Female |
| 5 to 17 Years | 106 (12.2%) | 48 (5.7%) |
| 18 to 34 Years | 98 (10.5%) | 55 (6.1%) |
| 35 to 64 Years | 224 (10.3%) | 117 (5.5%) |
| 65 to 74 Years | 16 (2.6%) | 37 (5.5%) |
| 75 Years and over | 87 (21.7%) | 54 (11.4%) |
Disability Class: Ambulatory Difficulty
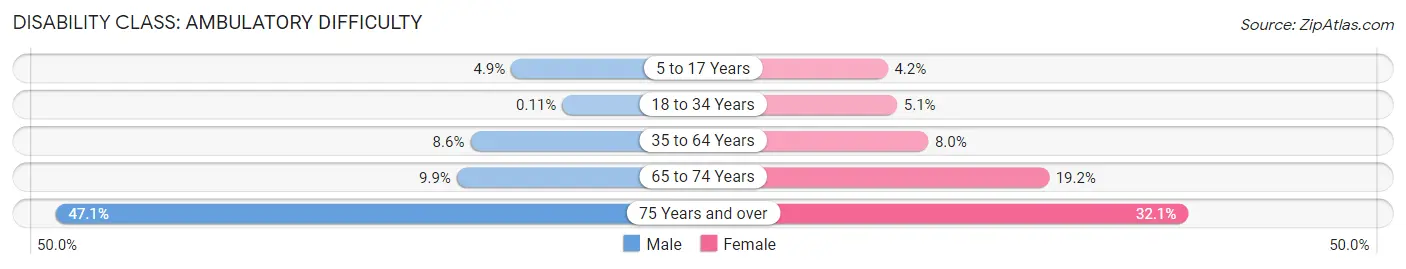
| Age Bracket | Male | Female |
| 5 to 17 Years | 42 (4.9%) | 36 (4.2%) |
| 18 to 34 Years | 1 (0.1%) | 46 (5.1%) |
| 35 to 64 Years | 187 (8.6%) | 169 (8.0%) |
| 65 to 74 Years | 60 (9.9%) | 130 (19.2%) |
| 75 Years and over | 189 (47.1%) | 152 (32.1%) |
Disability Class: Self-Care Difficulty
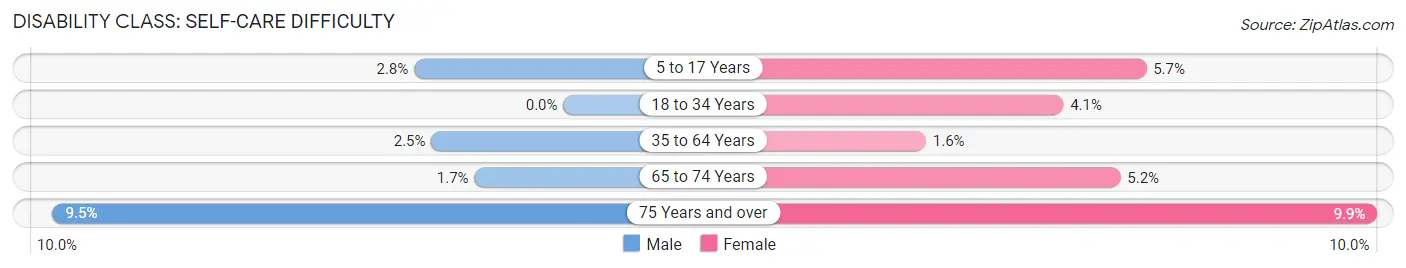
| Age Bracket | Male | Female |
| 5 to 17 Years | 24 (2.8%) | 48 (5.7%) |
| 18 to 34 Years | 0 (0.0%) | 37 (4.1%) |
| 35 to 64 Years | 53 (2.5%) | 33 (1.6%) |
| 65 to 74 Years | 10 (1.7%) | 35 (5.2%) |
| 75 Years and over | 38 (9.5%) | 47 (9.9%) |
Technology Access in Bollinger County
Computing Device Access in Bollinger County
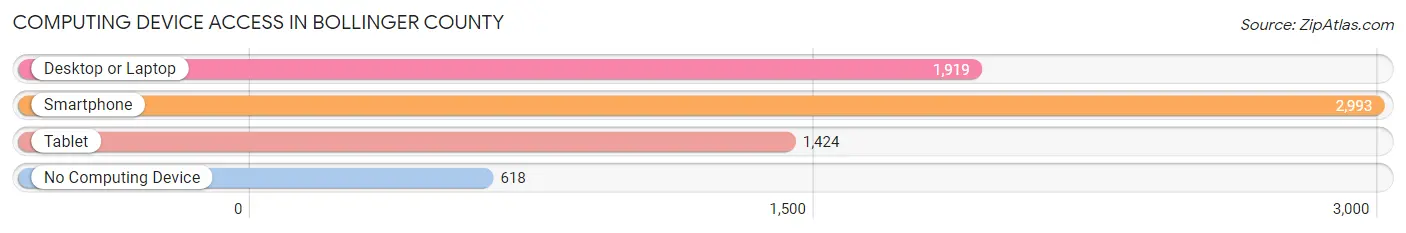
| Device Type | # Households | % Households |
| Desktop or Laptop | 1,919 | 50.6% |
| Smartphone | 2,993 | 78.9% |
| Tablet | 1,424 | 37.6% |
| No Computing Device | 618 | 16.3% |
| Total | 3,791 | 100.0% |
Internet Access in Bollinger County
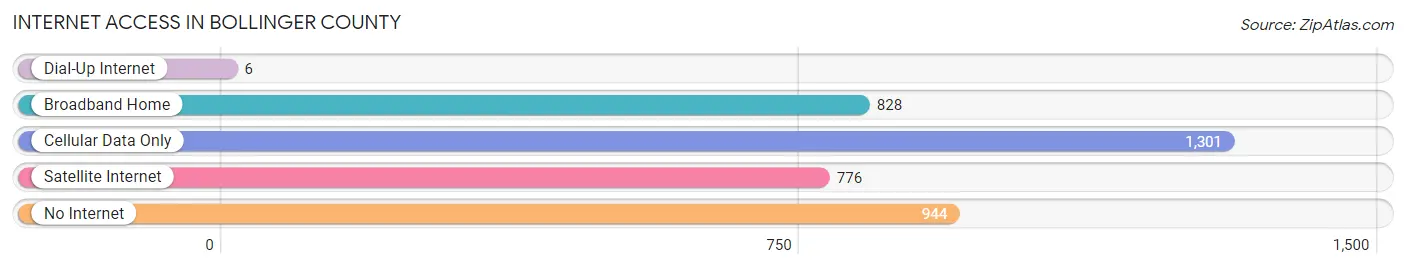
| Internet Type | # Households | % Households |
| Dial-Up Internet | 6 | 0.2% |
| Broadband Home | 828 | 21.8% |
| Cellular Data Only | 1,301 | 34.3% |
| Satellite Internet | 776 | 20.5% |
| No Internet | 944 | 24.9% |
| Total | 3,791 | 100.0% |
Bollinger County Summary
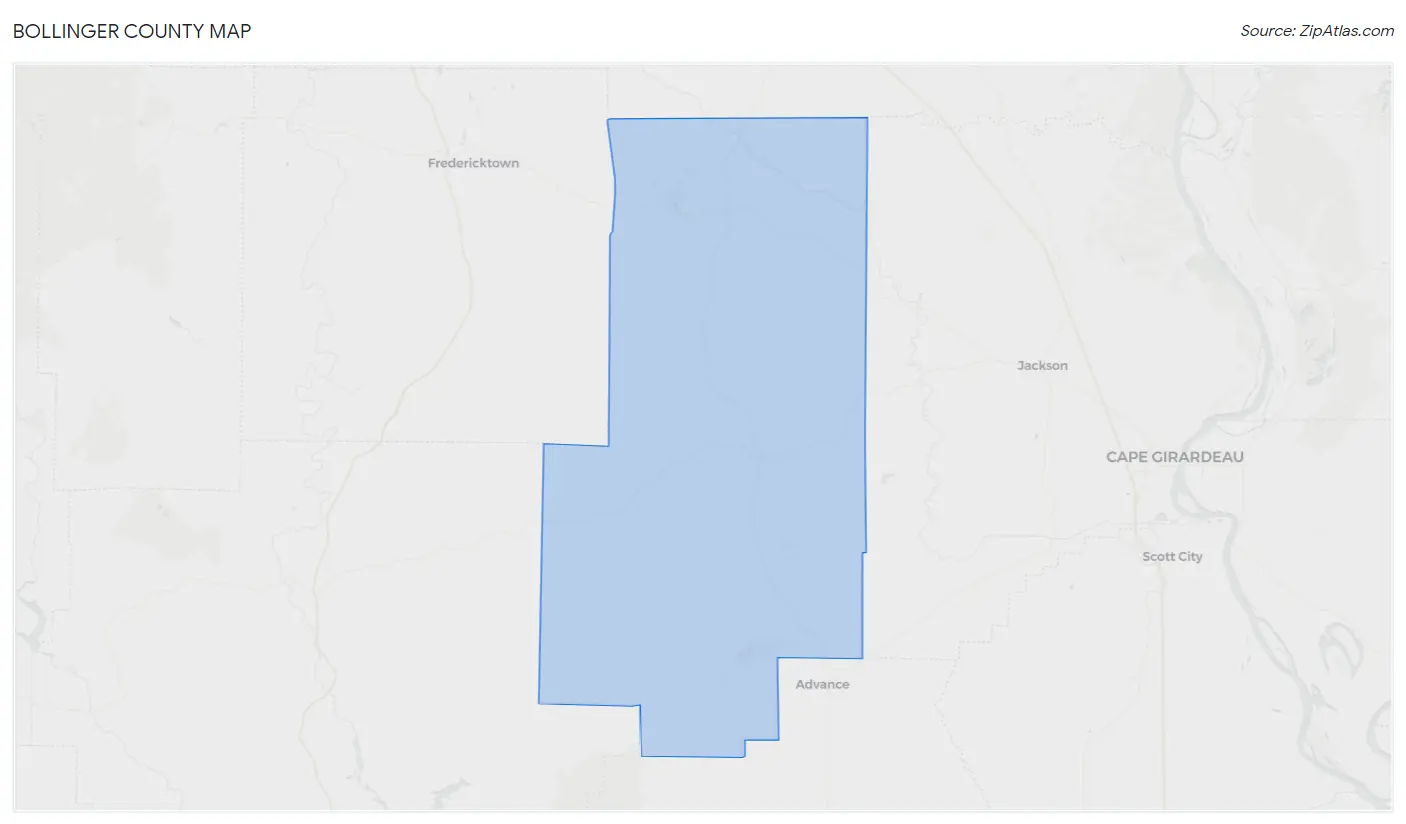
Bollinger County is located in the southeastern corner of Missouri, and is bordered by Cape Girardeau County to the north, Perry County to the east, Stoddard County to the south, and Scott County to the west. The county seat is Marble Hill, and the county was named after George Frederick Bollinger, a state senator from Cape Girardeau County.
Geography
Bollinger County is located in the Ozark Plateau region of Missouri, and is characterized by rolling hills and valleys. The county is drained by the Castor River, which flows through the county from north to south. The county is mostly forested, with the majority of the land being used for timber production. The county is also home to several state parks, including Johnson's Shut-Ins State Park, which is located in the northern part of the county.
The county has a total area of 517 square miles, of which 514 square miles is land and 3 square miles is water. The highest point in the county is located in the northern part of the county, at an elevation of 1,068 feet.
Demographics
As of the 2010 census, there were 12,363 people, 4,845 households, and 3,521 families residing in the county. The population density was 24 people per square mile. There were 5,541 housing units at an average density of 11 per square mile. The racial makeup of the county was 97.3% White, 0.5% African American, 0.3% Native American, 0.2% Asian, 0.1% Pacific Islander, 0.5% from other races, and 1.1% from two or more races. Hispanic or Latino of any race were 1.3% of the population.
There were 4,845 households, out of which 32.2% had children under the age of 18 living with them, 57.2% were married couples living together, 9.7% had a female householder with no husband present, and 28.7% were non-families. 24.7% of all households were made up of individuals, and 11.2% had someone living alone who was 65 years of age or older. The average household size was 2.51 and the average family size was 2.98.
The median income for a household in the county was $35,945, and the median income for a family was $41,945. Males had a median income of $30,945 versus $21,945 for females. The per capita income for the county was $17,945. About 11.2% of families and 14.2% of the population were below the poverty line, including 19.2% of those under age 18 and 11.2% of those age 65 or over.
Economy
Bollinger County is primarily an agricultural county, with the majority of the land being used for farming and timber production. The county is also home to several manufacturing companies, including a furniture factory, a plastics factory, and a metal fabrication plant. The county is also home to several wineries, and is a popular destination for wine enthusiasts.
The county is also home to several tourist attractions, including Johnson's Shut-Ins State Park, which is located in the northern part of the county. The park is a popular destination for camping, hiking, and swimming. The county is also home to several historic sites, including the Bollinger County Museum of Natural History, which is located in Marble Hill.
Conclusion
Bollinger County is a rural county located in the southeastern corner of Missouri. The county is characterized by rolling hills and valleys, and is mostly forested. The county is primarily an agricultural county, with the majority of the land being used for farming and timber production. The county is also home to several manufacturing companies, wineries, and tourist attractions. The county has a population of 12,363, and the median income for a household is $35,945.
Common Questions
What is Per Capita Income in Bollinger County?
Per Capita income in Bollinger County is $24,647.
What is the Median Family Income in Bollinger County?
Median Family Income in Bollinger County is $73,240.
What is the Median Household income in Bollinger County?
Median Household Income in Bollinger County is $52,306.
What is Income or Wage Gap in Bollinger County?
Income or Wage Gap in Bollinger County is 43.1%.
Women in Bollinger County earn 56.9 cents for every dollar earned by a man.
What is Inequality or Gini Index in Bollinger County?
Inequality or Gini Index in Bollinger County is 0.40.
What is the Total Population of Bollinger County?
Total Population of Bollinger County is 10,658.
What is the Total Male Population of Bollinger County?
Total Male Population of Bollinger County is 5,298.
What is the Total Female Population of Bollinger County?
Total Female Population of Bollinger County is 5,360.
What is the Ratio of Males per 100 Females in Bollinger County?
There are 98.84 Males per 100 Females in Bollinger County.
What is the Ratio of Females per 100 Males in Bollinger County?
There are 101.17 Females per 100 Males in Bollinger County.
What is the Median Population Age in Bollinger County?
Median Population Age in Bollinger County is 44.7 Years.
What is the Average Family Size in Bollinger County
Average Family Size in Bollinger County is 3.5 People.
What is the Average Household Size in Bollinger County
Average Household Size in Bollinger County is 2.8 People.
How Large is the Labor Force in Bollinger County?
There are 4,903 People in the Labor Forcein in Bollinger County.
What is the Percentage of People in the Labor Force in Bollinger County?
56.5% of People are in the Labor Force in Bollinger County.
What is the Unemployment Rate in Bollinger County?
Unemployment Rate in Bollinger County is 4.9%.