Audrain County, MO Map & Demographics
Audrain County Map
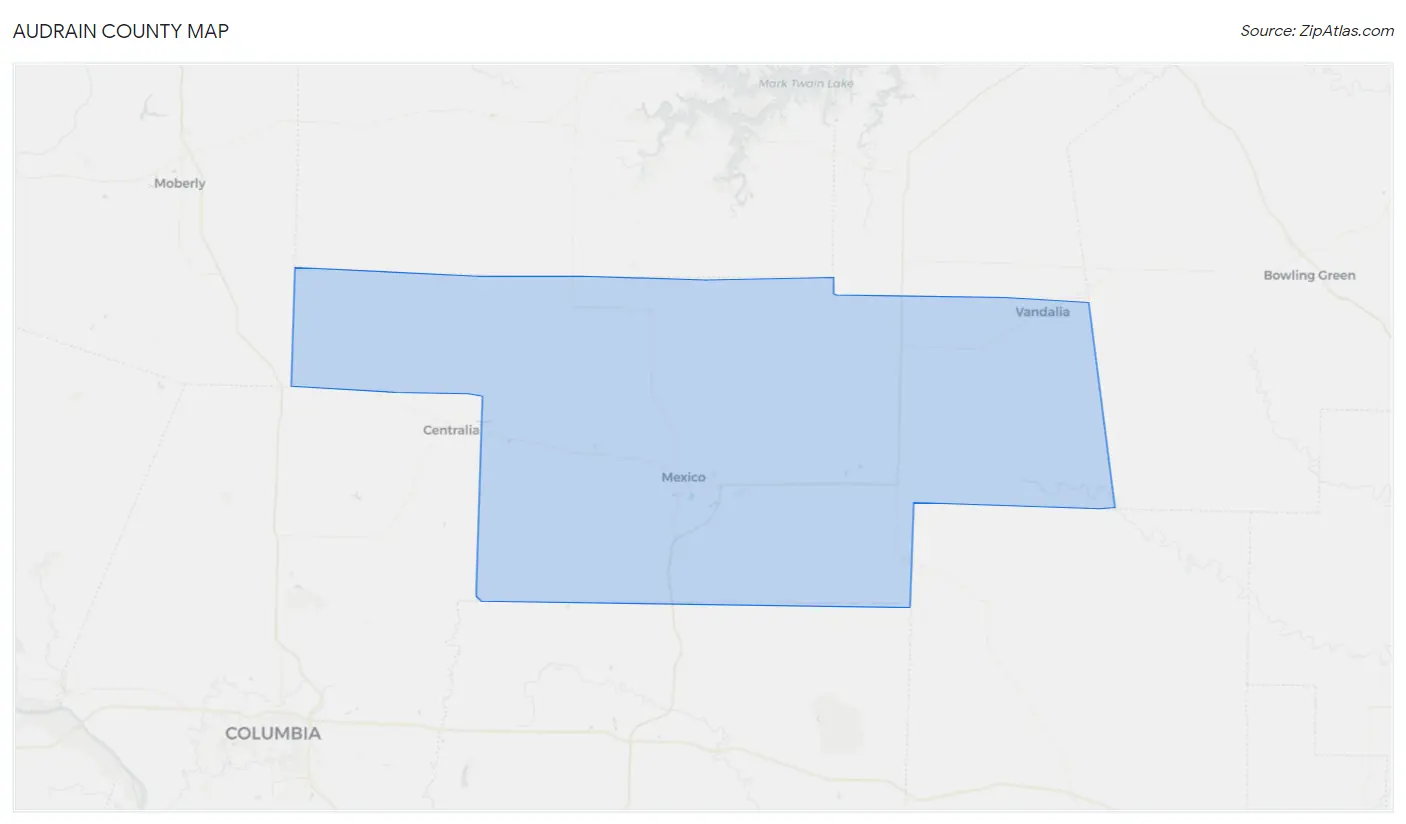
Audrain County Overview
$27,133
PER CAPITA INCOME
$63,310
AVG FAMILY INCOME
$51,745
AVG HOUSEHOLD INCOME
30.4%
WAGE / INCOME GAP [ % ]
69.6¢/ $1
WAGE / INCOME GAP [ $ ]
$13,454
FAMILY INCOME DEFICIT
0.44
INEQUALITY / GINI INDEX
24,873
TOTAL POPULATION
11,771
MALE POPULATION
13,102
FEMALE POPULATION
89.84
MALES / 100 FEMALES
111.31
FEMALES / 100 MALES
40.4
MEDIAN AGE
3.3
AVG FAMILY SIZE
2.6
AVG HOUSEHOLD SIZE
11,544
LABOR FORCE [ PEOPLE ]
57.9%
PERCENT IN LABOR FORCE
3.9%
UNEMPLOYMENT RATE
Audrain County Area Codes
Income in Audrain County
Income Overview in Audrain County
Per Capita Income in Audrain County is $27,133, while median incomes of families and households are $63,310 and $51,745 respectively.
| Characteristic | Number | Measure |
| Per Capita Income | 24,873 | $27,133 |
| Median Family Income | 5,804 | $63,310 |
| Mean Family Income | 5,804 | $79,324 |
| Median Household Income | 8,968 | $51,745 |
| Mean Household Income | 8,968 | $70,321 |
| Income Deficit | 5,804 | $13,454 |
| Wage / Income Gap (%) | 24,873 | 30.42% |
| Wage / Income Gap ($) | 24,873 | 69.58¢ per $1 |
| Gini / Inequality Index | 24,873 | 0.44 |
Earnings by Sex in Audrain County
Average Earnings in Audrain County are $32,955, $40,030 for men and $27,851 for women, a difference of 30.4%.
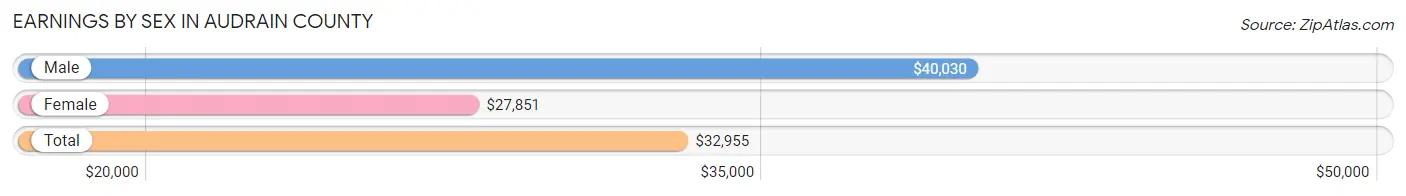
| Sex | Number | Average Earnings |
| Male | 5,963 (48.9%) | $40,030 |
| Female | 6,235 (51.1%) | $27,851 |
| Total | 12,198 (100.0%) | $32,955 |
Earnings by Sex by Income Bracket in Audrain County
The most common earnings brackets in Audrain County are $100,000+ for men (593 | 9.9%) and $25,000 to $29,999 for women (766 | 12.3%).
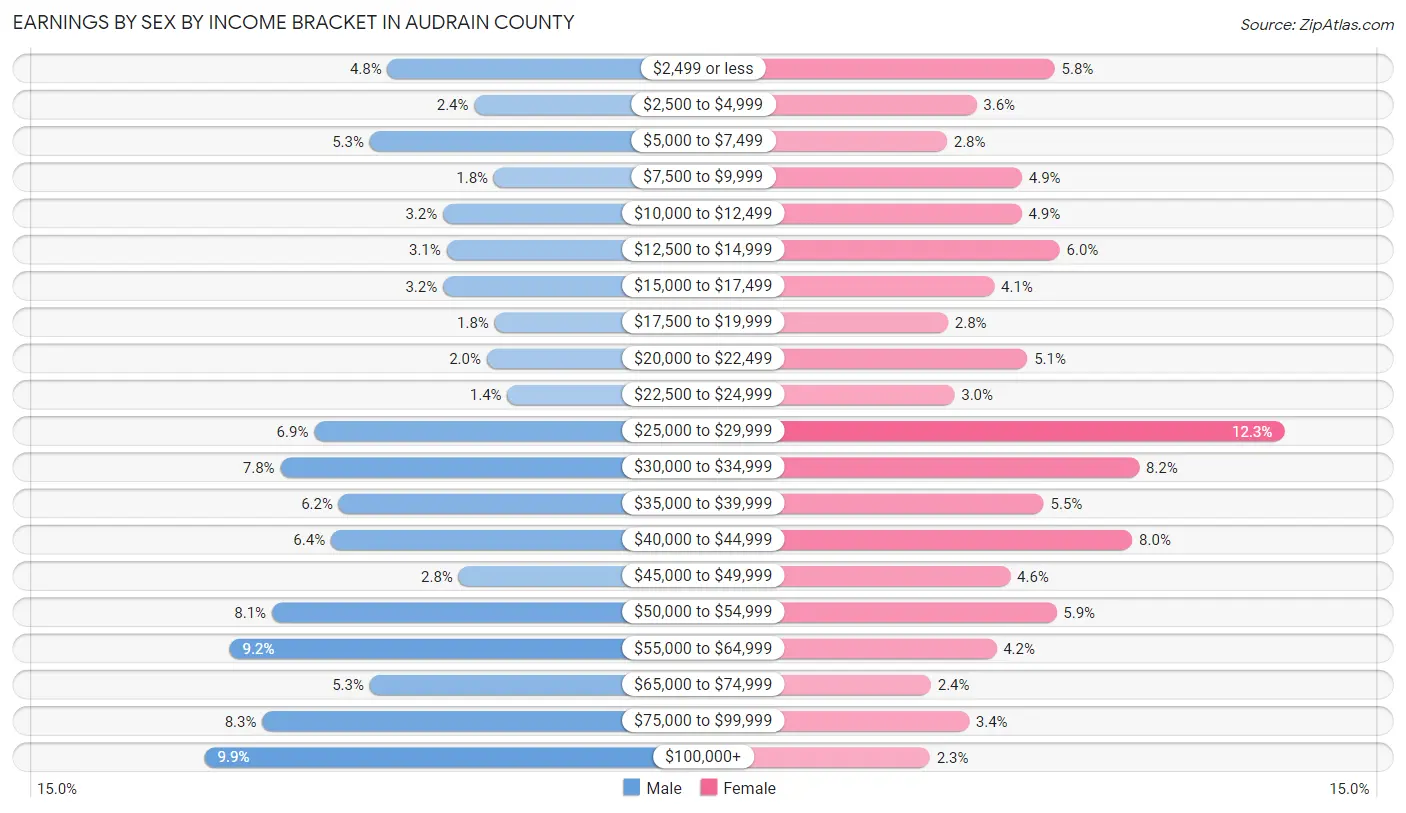
| Income | Male | Female |
| $2,499 or less | 286 (4.8%) | 364 (5.8%) |
| $2,500 to $4,999 | 141 (2.4%) | 227 (3.6%) |
| $5,000 to $7,499 | 316 (5.3%) | 175 (2.8%) |
| $7,500 to $9,999 | 108 (1.8%) | 307 (4.9%) |
| $10,000 to $12,499 | 193 (3.2%) | 306 (4.9%) |
| $12,500 to $14,999 | 187 (3.1%) | 373 (6.0%) |
| $15,000 to $17,499 | 193 (3.2%) | 258 (4.1%) |
| $17,500 to $19,999 | 107 (1.8%) | 177 (2.8%) |
| $20,000 to $22,499 | 120 (2.0%) | 316 (5.1%) |
| $22,500 to $24,999 | 85 (1.4%) | 188 (3.0%) |
| $25,000 to $29,999 | 409 (6.9%) | 766 (12.3%) |
| $30,000 to $34,999 | 466 (7.8%) | 512 (8.2%) |
| $35,000 to $39,999 | 368 (6.2%) | 345 (5.5%) |
| $40,000 to $44,999 | 381 (6.4%) | 500 (8.0%) |
| $45,000 to $49,999 | 167 (2.8%) | 286 (4.6%) |
| $50,000 to $54,999 | 480 (8.1%) | 367 (5.9%) |
| $55,000 to $64,999 | 551 (9.2%) | 262 (4.2%) |
| $65,000 to $74,999 | 316 (5.3%) | 147 (2.4%) |
| $75,000 to $99,999 | 496 (8.3%) | 214 (3.4%) |
| $100,000+ | 593 (9.9%) | 145 (2.3%) |
| Total | 5,963 (100.0%) | 6,235 (100.0%) |
Earnings by Sex by Educational Attainment in Audrain County
Average earnings in Audrain County are $44,754 for men and $29,990 for women, a difference of 33.0%. Men with an educational attainment of bachelor's degree enjoy the highest average annual earnings of $68,182, while those with less than high school education earn the least with $30,990. Women with an educational attainment of graduate degree earn the most with the average annual earnings of $46,900, while those with less than high school education have the smallest earnings of $17,688.
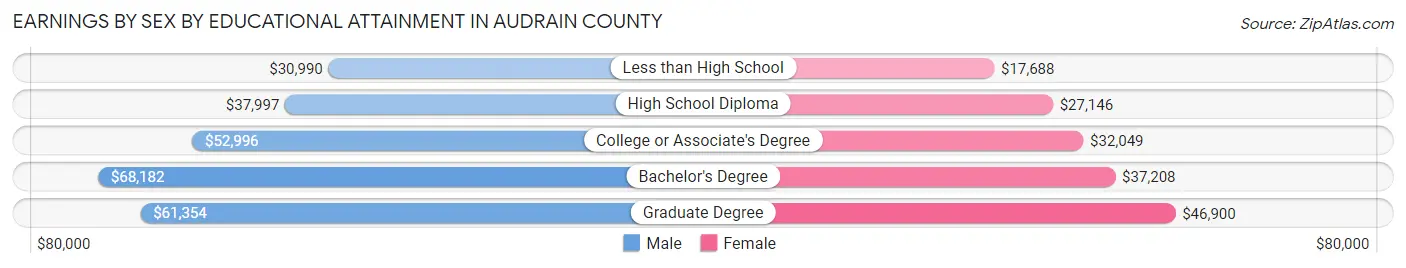
| Educational Attainment | Male Income | Female Income |
| Less than High School | $30,990 | $17,688 |
| High School Diploma | $37,997 | $27,146 |
| College or Associate's Degree | $52,996 | $32,049 |
| Bachelor's Degree | $68,182 | $37,208 |
| Graduate Degree | $61,354 | $46,900 |
| Total | $44,754 | $29,990 |
Family Income in Audrain County
Family Income Brackets in Audrain County
According to the Audrain County family income data, there are 1,120 families falling into the $50,000 to $74,999 income range, which is the most common income bracket and makes up 19.3% of all families. Conversely, the $10,000 to $14,999 income bracket is the least frequent group with only 139 families (2.4%) belonging to this category.
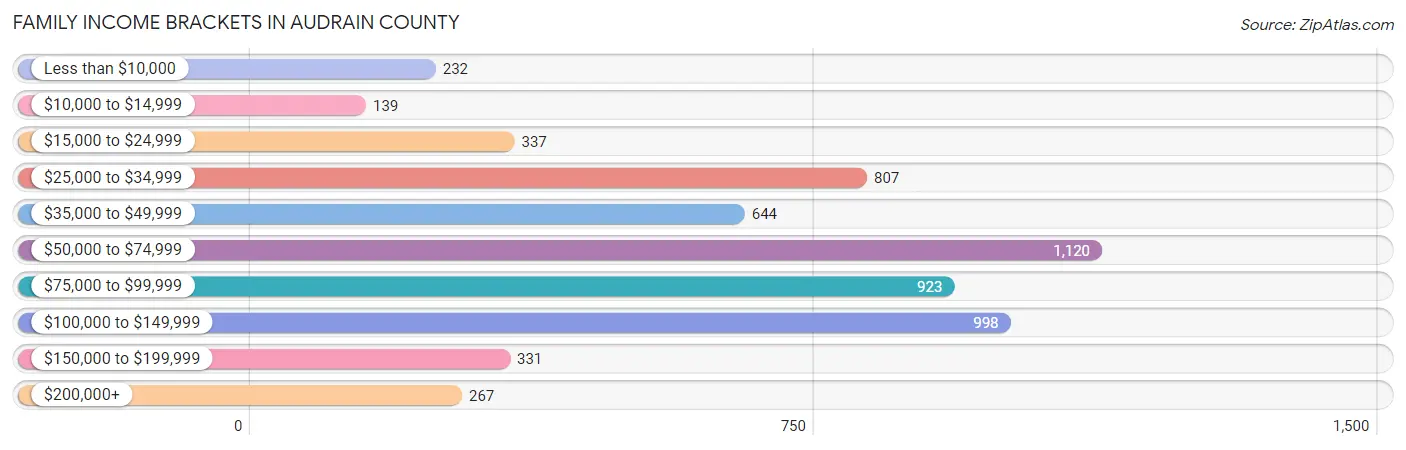
| Income Bracket | # Families | % Families |
| Less than $10,000 | 232 | 4.0% |
| $10,000 to $14,999 | 139 | 2.4% |
| $15,000 to $24,999 | 337 | 5.8% |
| $25,000 to $34,999 | 807 | 13.9% |
| $35,000 to $49,999 | 644 | 11.1% |
| $50,000 to $74,999 | 1,120 | 19.3% |
| $75,000 to $99,999 | 923 | 15.9% |
| $100,000 to $149,999 | 998 | 17.2% |
| $150,000 to $199,999 | 331 | 5.7% |
| $200,000+ | 267 | 4.6% |
Family Income by Famaliy Size in Audrain County
6-person families (223 | 3.8%) account for the highest median family income in Audrain County with $125,391 per family, while 2-person families (2,993 | 51.6%) have the highest median income of $29,888 per family member.
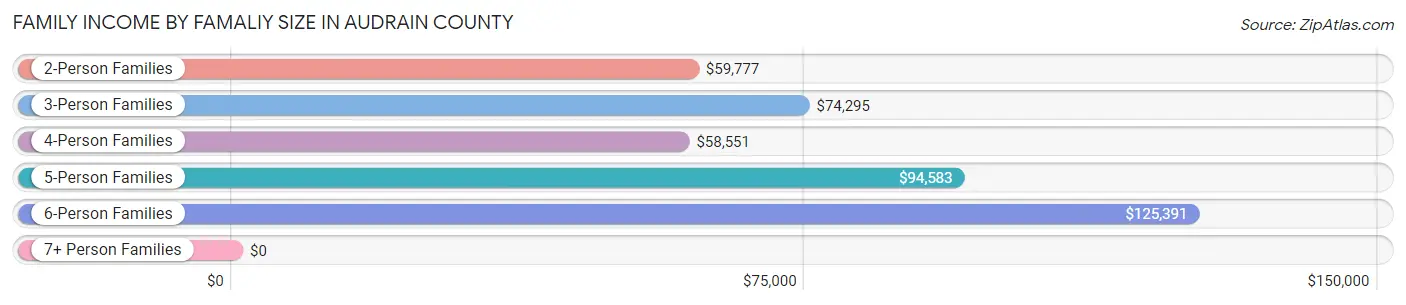
| Income Bracket | # Families | Median Income |
| 2-Person Families | 2,993 (51.6%) | $59,777 |
| 3-Person Families | 1,148 (19.8%) | $74,295 |
| 4-Person Families | 941 (16.2%) | $58,551 |
| 5-Person Families | 377 (6.5%) | $94,583 |
| 6-Person Families | 223 (3.8%) | $125,391 |
| 7+ Person Families | 122 (2.1%) | $0 |
| Total | 5,804 (100.0%) | $63,310 |
Family Income by Number of Earners in Audrain County
The median family income in Audrain County is $63,310, with families comprising 3+ earners (500) having the highest median family income of $135,000, while families with 1 earner (1,637) have the lowest median family income of $40,766, accounting for 8.6% and 28.2% of families, respectively.
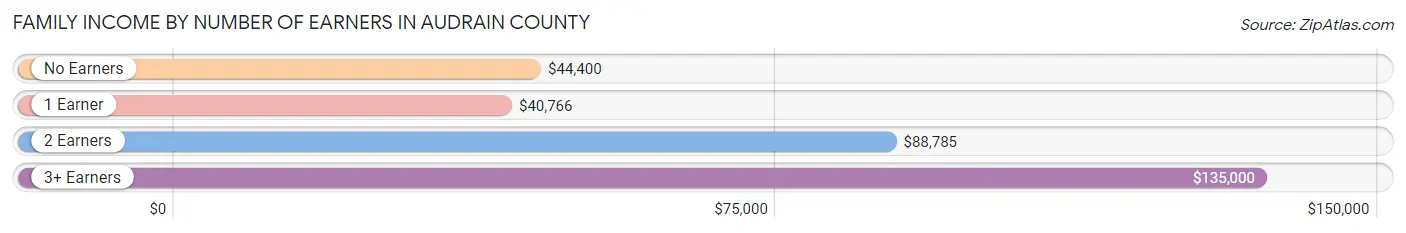
| Number of Earners | # Families | Median Income |
| No Earners | 1,066 (18.4%) | $44,400 |
| 1 Earner | 1,637 (28.2%) | $40,766 |
| 2 Earners | 2,601 (44.8%) | $88,785 |
| 3+ Earners | 500 (8.6%) | $135,000 |
| Total | 5,804 (100.0%) | $63,310 |
Household Income in Audrain County
Household Income Brackets in Audrain County
With 1,695 households falling in the category, the $50,000 to $74,999 income range is the most frequent in Audrain County, accounting for 18.9% of all households. In contrast, only 377 households (4.2%) fall into the $150,000 to $199,999 income bracket, making it the least populous group.
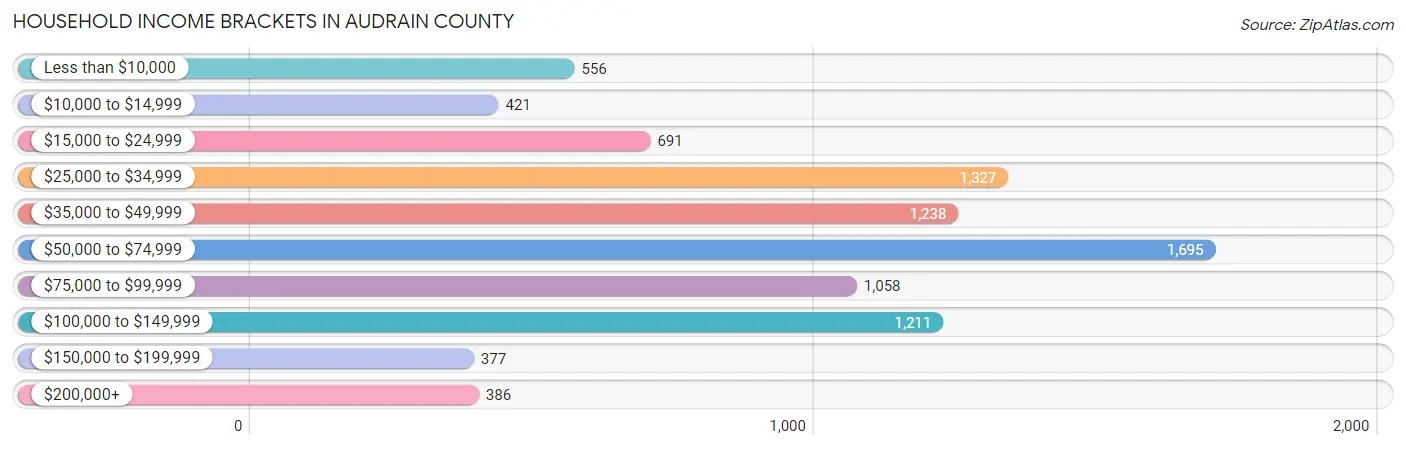
| Income Bracket | # Households | % Households |
| Less than $10,000 | 556 | 6.2% |
| $10,000 to $14,999 | 421 | 4.7% |
| $15,000 to $24,999 | 691 | 7.7% |
| $25,000 to $34,999 | 1,327 | 14.8% |
| $35,000 to $49,999 | 1,238 | 13.8% |
| $50,000 to $74,999 | 1,695 | 18.9% |
| $75,000 to $99,999 | 1,058 | 11.8% |
| $100,000 to $149,999 | 1,211 | 13.5% |
| $150,000 to $199,999 | 377 | 4.2% |
| $200,000+ | 386 | 4.3% |
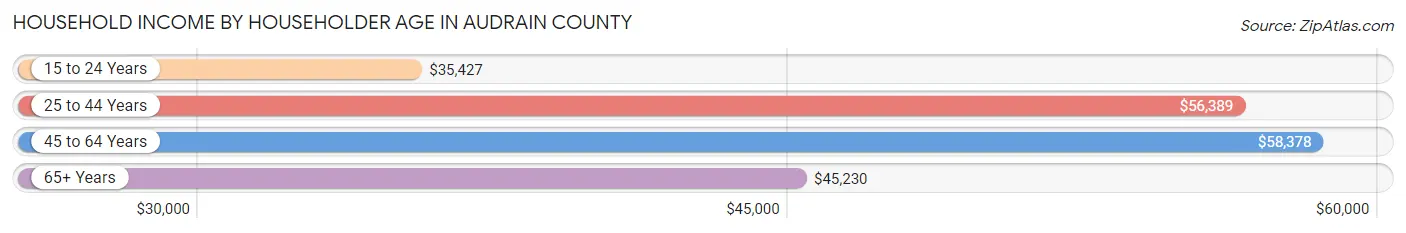
Household Income by Householder Age in Audrain County
The median household income in Audrain County is $51,745, with the highest median household income of $58,378 found in the 45 to 64 years age bracket for the primary householder. A total of 3,384 households (37.7%) fall into this category. Meanwhile, the 15 to 24 years age bracket for the primary householder has the lowest median household income of $35,427, with 328 households (3.7%) in this group.
| Income Bracket | # Households | Median Income |
| 15 to 24 Years | 328 (3.7%) | $35,427 |
| 25 to 44 Years | 2,690 (30.0%) | $56,389 |
| 45 to 64 Years | 3,384 (37.7%) | $58,378 |
| 65+ Years | 2,566 (28.6%) | $45,230 |
| Total | 8,968 (100.0%) | $51,745 |
Poverty in Audrain County
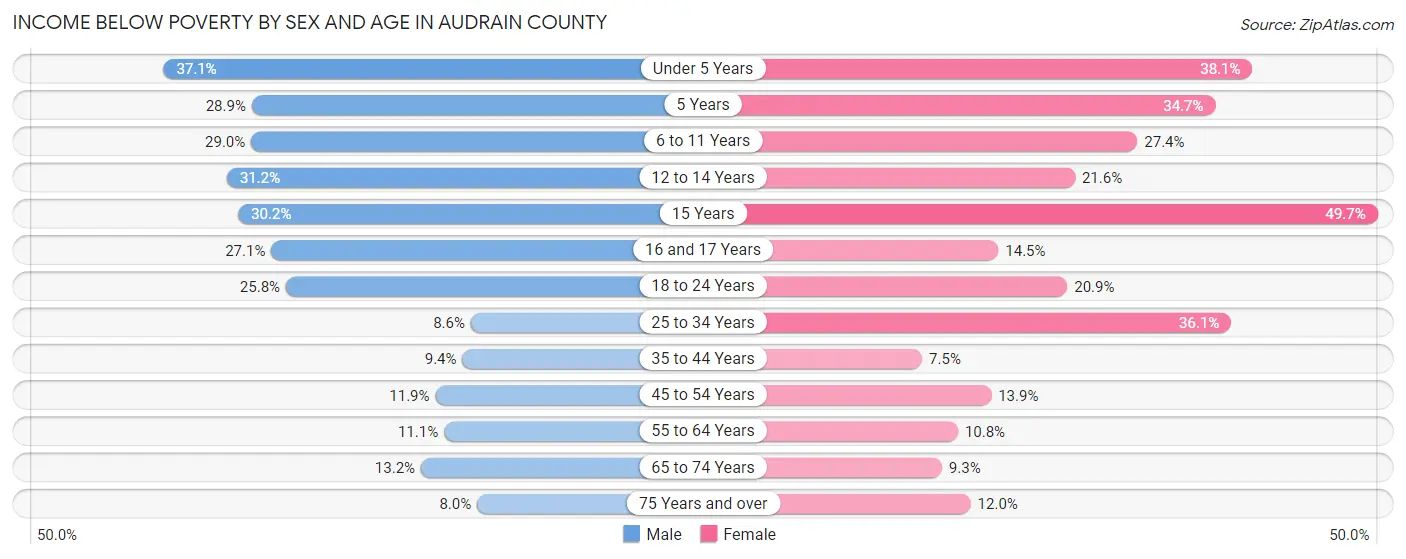
Income Below Poverty by Sex and Age in Audrain County
With 17.4% poverty level for males and 18.7% for females among the residents of Audrain County, under 5 year old males and 15 year old females are the most vulnerable to poverty, with 318 males (37.1%) and 90 females (49.7%) in their respective age groups living below the poverty level.
| Age Bracket | Male | Female |
| Under 5 Years | 318 (37.1%) | 248 (38.1%) |
| 5 Years | 24 (28.9%) | 61 (34.7%) |
| 6 to 11 Years | 317 (29.0%) | 223 (27.4%) |
| 12 to 14 Years | 114 (31.2%) | 74 (21.6%) |
| 15 Years | 83 (30.2%) | 90 (49.7%) |
| 16 and 17 Years | 103 (27.1%) | 43 (14.5%) |
| 18 to 24 Years | 224 (25.8%) | 198 (20.9%) |
| 25 to 34 Years | 101 (8.6%) | 595 (36.1%) |
| 35 to 44 Years | 123 (9.4%) | 114 (7.5%) |
| 45 to 54 Years | 157 (11.9%) | 203 (13.9%) |
| 55 to 64 Years | 184 (11.1%) | 191 (10.8%) |
| 65 to 74 Years | 158 (13.2%) | 127 (9.3%) |
| 75 Years and over | 52 (8.0%) | 130 (12.0%) |
| Total | 1,958 (17.4%) | 2,297 (18.7%) |
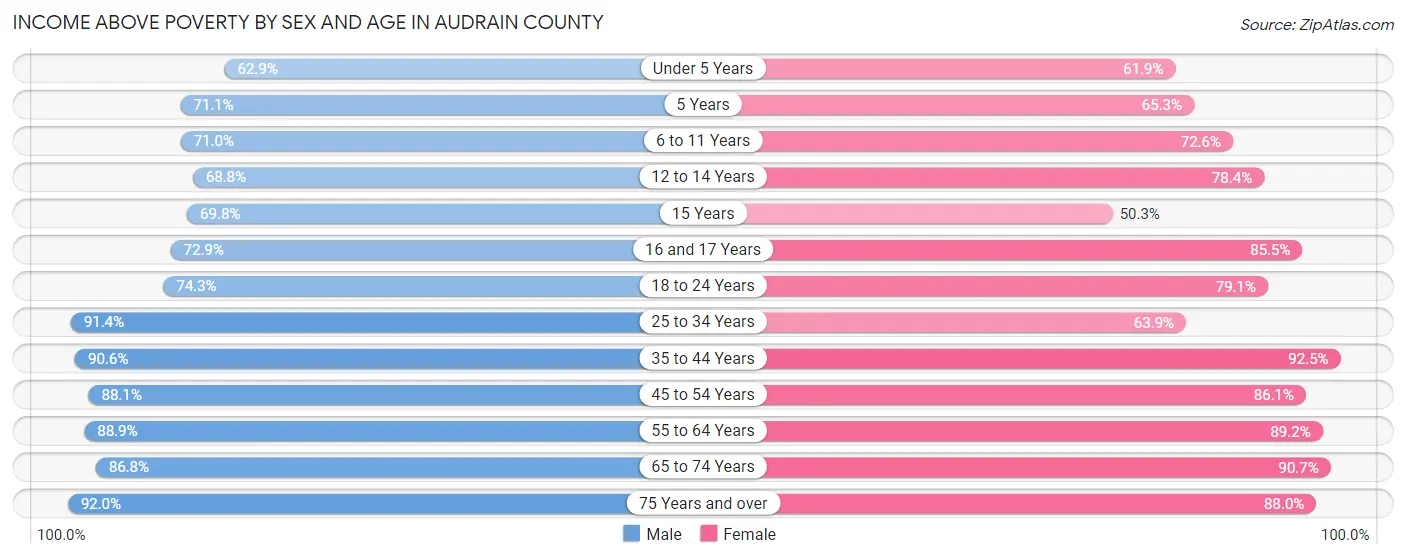
Income Above Poverty by Sex and Age in Audrain County
According to the poverty statistics in Audrain County, males aged 75 years and over and females aged 35 to 44 years are the age groups that are most secure financially, with 92.0% of males and 92.5% of females in these age groups living above the poverty line.
| Age Bracket | Male | Female |
| Under 5 Years | 539 (62.9%) | 403 (61.9%) |
| 5 Years | 59 (71.1%) | 115 (65.3%) |
| 6 to 11 Years | 777 (71.0%) | 590 (72.6%) |
| 12 to 14 Years | 251 (68.8%) | 268 (78.4%) |
| 15 Years | 192 (69.8%) | 91 (50.3%) |
| 16 and 17 Years | 277 (72.9%) | 253 (85.5%) |
| 18 to 24 Years | 646 (74.3%) | 748 (79.1%) |
| 25 to 34 Years | 1,075 (91.4%) | 1,052 (63.9%) |
| 35 to 44 Years | 1,190 (90.6%) | 1,415 (92.5%) |
| 45 to 54 Years | 1,164 (88.1%) | 1,261 (86.1%) |
| 55 to 64 Years | 1,477 (88.9%) | 1,581 (89.2%) |
| 65 to 74 Years | 1,037 (86.8%) | 1,240 (90.7%) |
| 75 Years and over | 597 (92.0%) | 957 (88.0%) |
| Total | 9,281 (82.6%) | 9,974 (81.3%) |
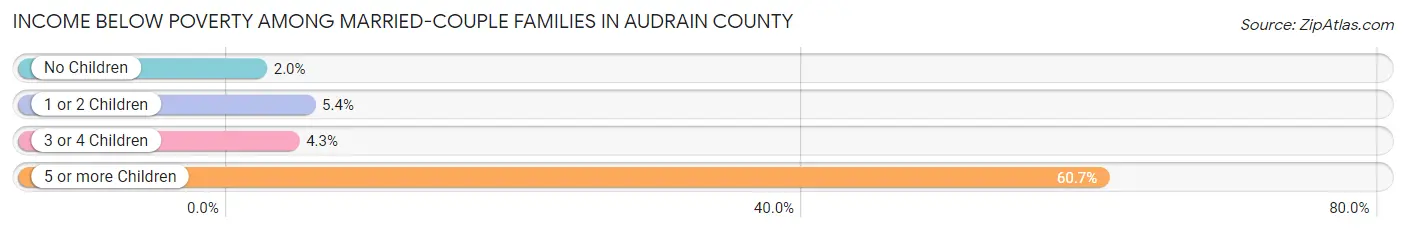
Income Below Poverty Among Married-Couple Families in Audrain County
The poverty statistics for married-couple families in Audrain County show that 4.8% or 207 of the total 4,276 families live below the poverty line. Families with 5 or more children have the highest poverty rate of 60.7%, comprising of 74 families. On the other hand, families with no children have the lowest poverty rate of 2.0%, which includes 51 families.
| Children | Above Poverty | Below Poverty |
| No Children | 2,503 (98.0%) | 51 (2.0%) |
| 1 or 2 Children | 1,181 (94.6%) | 67 (5.4%) |
| 3 or 4 Children | 337 (95.7%) | 15 (4.3%) |
| 5 or more Children | 48 (39.3%) | 74 (60.7%) |
| Total | 4,069 (95.2%) | 207 (4.8%) |
Income Below Poverty Among Single-Parent Households in Audrain County
According to the poverty data in Audrain County, 15.2% or 64 single-father households and 35.4% or 392 single-mother households are living below the poverty line. Among single-father households, those with 1 or 2 children have the highest poverty rate, with 50 households (33.1%) experiencing poverty. Likewise, among single-mother households, those with 5 or more children have the highest poverty rate, with 10 households (83.3%) falling below the poverty line.
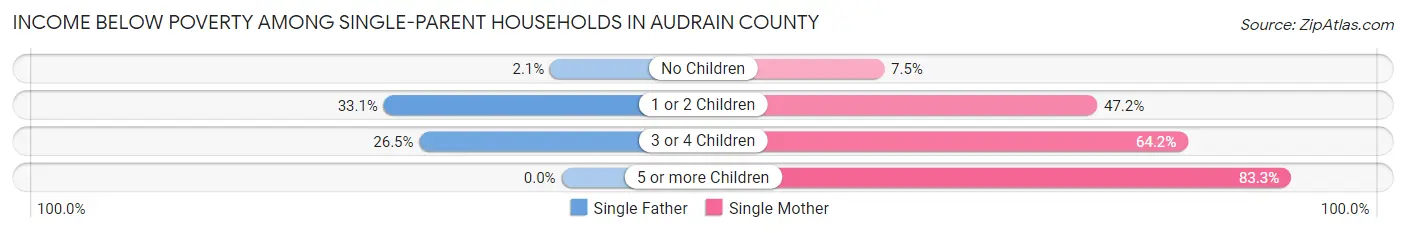
| Children | Single Father | Single Mother |
| No Children | 5 (2.1%) | 29 (7.5%) |
| 1 or 2 Children | 50 (33.1%) | 285 (47.2%) |
| 3 or 4 Children | 9 (26.5%) | 68 (64.1%) |
| 5 or more Children | 0 (0.0%) | 10 (83.3%) |
| Total | 64 (15.2%) | 392 (35.4%) |
Income Below Poverty Among Married-Couple vs Single-Parent Households in Audrain County
The poverty data for Audrain County shows that 207 of the married-couple family households (4.8%) and 456 of the single-parent households (29.8%) are living below the poverty level. Within the married-couple family households, those with 5 or more children have the highest poverty rate, with 74 households (60.7%) falling below the poverty line. Among the single-parent households, those with 5 or more children have the highest poverty rate, with 10 household (83.3%) living below poverty.
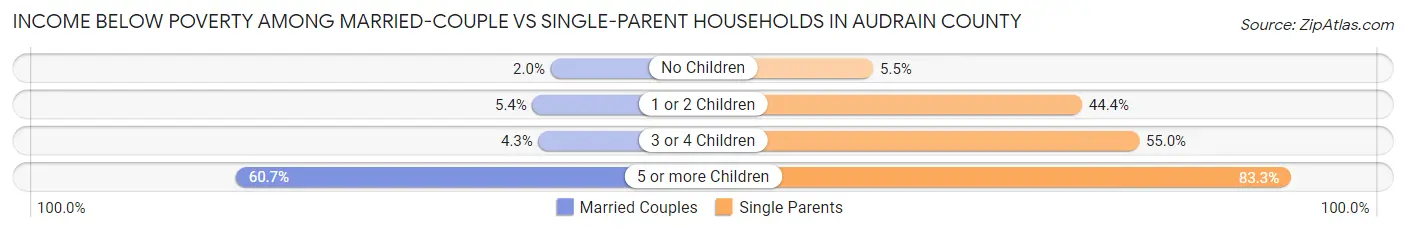
| Children | Married-Couple Families | Single-Parent Households |
| No Children | 51 (2.0%) | 34 (5.5%) |
| 1 or 2 Children | 67 (5.4%) | 335 (44.4%) |
| 3 or 4 Children | 15 (4.3%) | 77 (55.0%) |
| 5 or more Children | 74 (60.7%) | 10 (83.3%) |
| Total | 207 (4.8%) | 456 (29.8%) |
Race in Audrain County
The most populous races in Audrain County are White / Caucasian (22,180 | 89.2%), Black / African American (1,190 | 4.8%), and Two or more Races (1,082 | 4.3%).
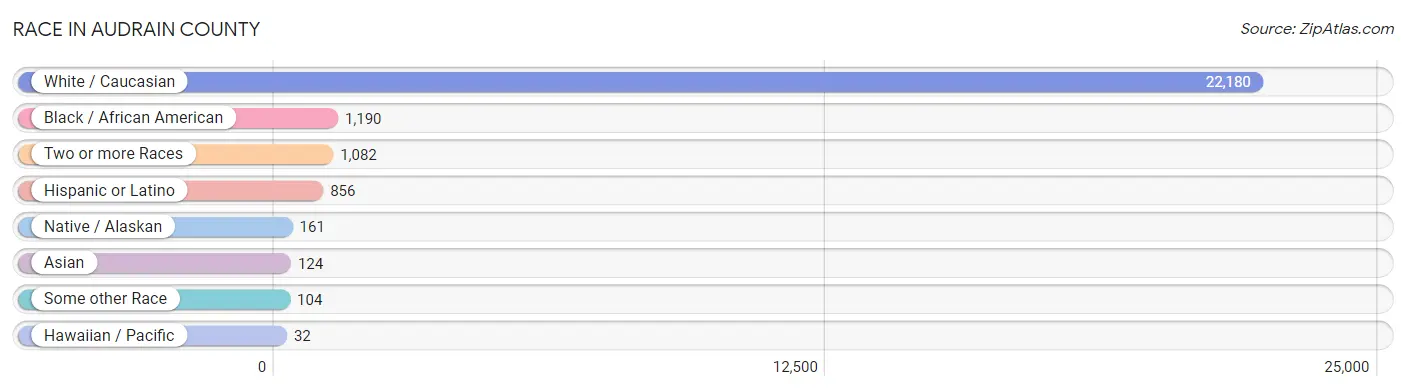
| Race | # Population | % Population |
| Asian | 124 | 0.5% |
| Black / African American | 1,190 | 4.8% |
| Hawaiian / Pacific | 32 | 0.1% |
| Hispanic or Latino | 856 | 3.4% |
| Native / Alaskan | 161 | 0.6% |
| White / Caucasian | 22,180 | 89.2% |
| Two or more Races | 1,082 | 4.3% |
| Some other Race | 104 | 0.4% |
| Total | 24,873 | 100.0% |
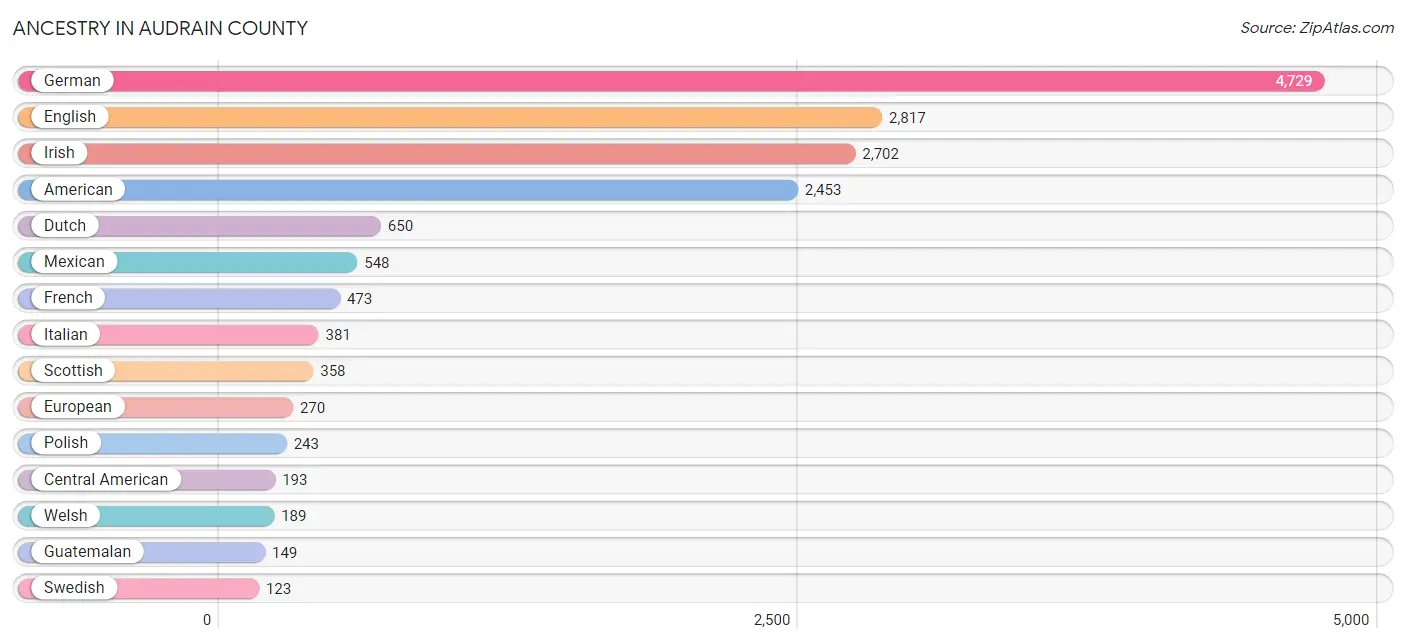
Ancestry in Audrain County
The most populous ancestries reported in Audrain County are German (4,729 | 19.0%), English (2,817 | 11.3%), Irish (2,702 | 10.9%), American (2,453 | 9.9%), and Dutch (650 | 2.6%), together accounting for 53.7% of all Audrain County residents.
| Ancestry | # Population | % Population |
| African | 35 | 0.1% |
| Alaskan Athabascan | 1 | 0.0% |
| American | 2,453 | 9.9% |
| Apache | 21 | 0.1% |
| Australian | 2 | 0.0% |
| Blackfeet | 30 | 0.1% |
| British | 109 | 0.4% |
| Canadian | 12 | 0.1% |
| Central American | 193 | 0.8% |
| Cherokee | 91 | 0.4% |
| Chickasaw | 6 | 0.0% |
| Choctaw | 16 | 0.1% |
| Croatian | 3 | 0.0% |
| Cuban | 44 | 0.2% |
| Czech | 79 | 0.3% |
| Czechoslovakian | 17 | 0.1% |
| Danish | 31 | 0.1% |
| Dutch | 650 | 2.6% |
| Eastern European | 36 | 0.1% |
| English | 2,817 | 11.3% |
| European | 270 | 1.1% |
| French | 473 | 1.9% |
| French Canadian | 19 | 0.1% |
| German | 4,729 | 19.0% |
| Greek | 20 | 0.1% |
| Guatemalan | 149 | 0.6% |
| Honduran | 7 | 0.0% |
| Hungarian | 20 | 0.1% |
| Icelander | 3 | 0.0% |
| Indian (Asian) | 53 | 0.2% |
| Iranian | 3 | 0.0% |
| Irish | 2,702 | 10.9% |
| Italian | 381 | 1.5% |
| Japanese | 14 | 0.1% |
| Korean | 108 | 0.4% |
| Mexican | 548 | 2.2% |
| Mexican American Indian | 95 | 0.4% |
| Native Hawaiian | 24 | 0.1% |
| Navajo | 32 | 0.1% |
| Nigerian | 8 | 0.0% |
| Northern European | 10 | 0.0% |
| Norwegian | 91 | 0.4% |
| Pennsylvania German | 12 | 0.1% |
| Polish | 243 | 1.0% |
| Portuguese | 49 | 0.2% |
| Salvadoran | 37 | 0.2% |
| Samoan | 2 | 0.0% |
| Scandinavian | 46 | 0.2% |
| Scotch-Irish | 118 | 0.5% |
| Scottish | 358 | 1.4% |
| Sioux | 66 | 0.3% |
| South American | 24 | 0.1% |
| Spaniard | 24 | 0.1% |
| Spanish | 7 | 0.0% |
| Sri Lankan | 49 | 0.2% |
| Subsaharan African | 43 | 0.2% |
| Swedish | 123 | 0.5% |
| Swiss | 18 | 0.1% |
| Venezuelan | 24 | 0.1% |
| Welsh | 189 | 0.8% | View All 60 Rows |
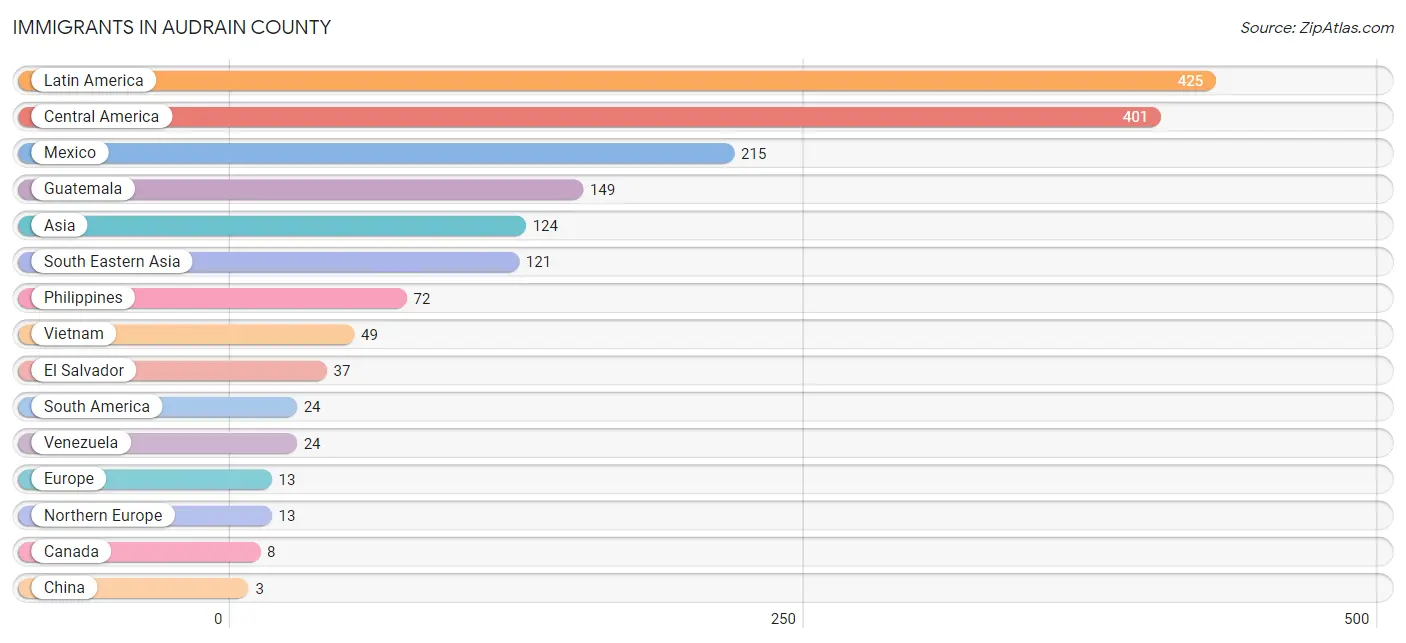
Immigrants in Audrain County
The most numerous immigrant groups reported in Audrain County came from Latin America (425 | 1.7%), Central America (401 | 1.6%), Mexico (215 | 0.9%), Guatemala (149 | 0.6%), and Asia (124 | 0.5%), together accounting for 5.3% of all Audrain County residents.
| Immigration Origin | # Population | % Population |
| Asia | 124 | 0.5% |
| Canada | 8 | 0.0% |
| Central America | 401 | 1.6% |
| China | 3 | 0.0% |
| Eastern Asia | 3 | 0.0% |
| El Salvador | 37 | 0.2% |
| Europe | 13 | 0.1% |
| Guatemala | 149 | 0.6% |
| Latin America | 425 | 1.7% |
| Mexico | 215 | 0.9% |
| Northern Europe | 13 | 0.1% |
| Philippines | 72 | 0.3% |
| South America | 24 | 0.1% |
| South Eastern Asia | 121 | 0.5% |
| Venezuela | 24 | 0.1% |
| Vietnam | 49 | 0.2% | View All 16 Rows |
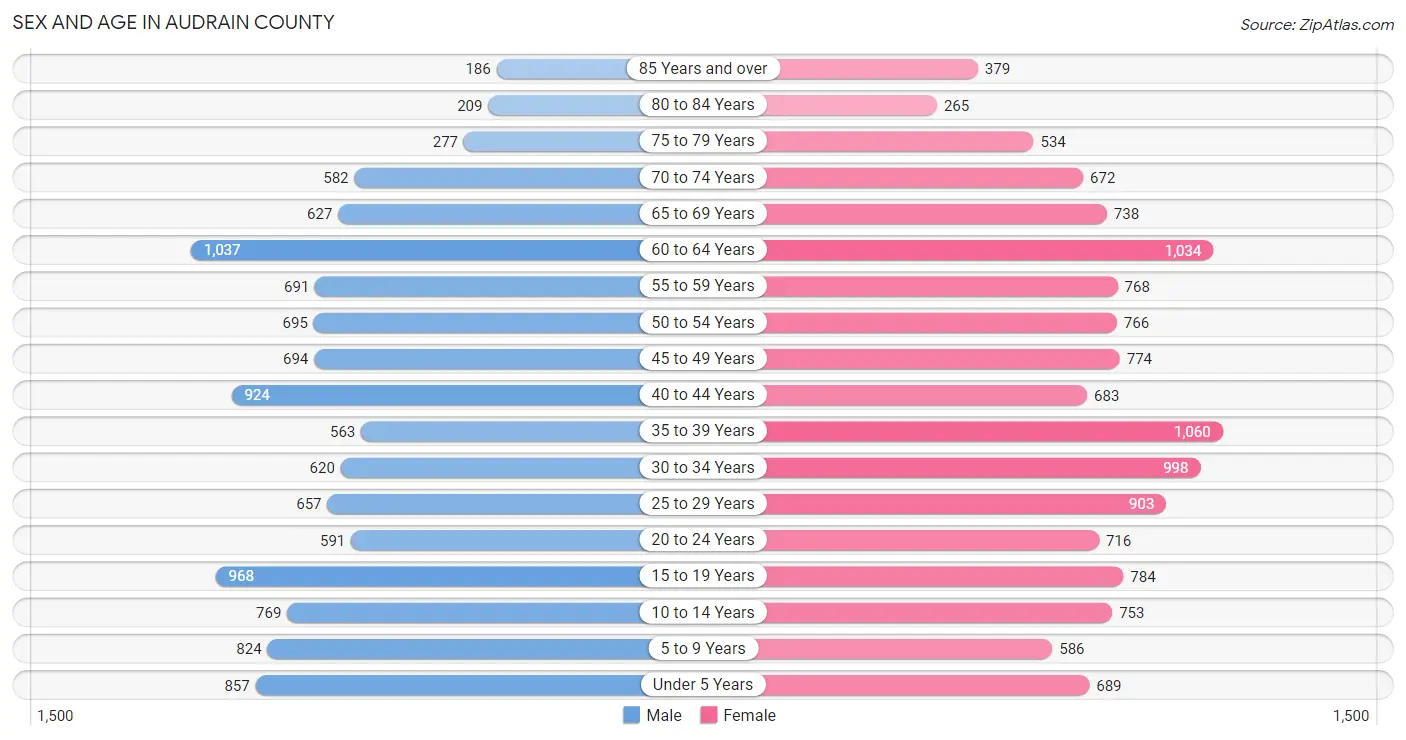
Sex and Age in Audrain County
Sex and Age in Audrain County
The most populous age groups in Audrain County are 60 to 64 Years (1,037 | 8.8%) for men and 35 to 39 Years (1,060 | 8.1%) for women.
| Age Bracket | Male | Female |
| Under 5 Years | 857 (7.3%) | 689 (5.3%) |
| 5 to 9 Years | 824 (7.0%) | 586 (4.5%) |
| 10 to 14 Years | 769 (6.5%) | 753 (5.8%) |
| 15 to 19 Years | 968 (8.2%) | 784 (6.0%) |
| 20 to 24 Years | 591 (5.0%) | 716 (5.5%) |
| 25 to 29 Years | 657 (5.6%) | 903 (6.9%) |
| 30 to 34 Years | 620 (5.3%) | 998 (7.6%) |
| 35 to 39 Years | 563 (4.8%) | 1,060 (8.1%) |
| 40 to 44 Years | 924 (7.9%) | 683 (5.2%) |
| 45 to 49 Years | 694 (5.9%) | 774 (5.9%) |
| 50 to 54 Years | 695 (5.9%) | 766 (5.9%) |
| 55 to 59 Years | 691 (5.9%) | 768 (5.9%) |
| 60 to 64 Years | 1,037 (8.8%) | 1,034 (7.9%) |
| 65 to 69 Years | 627 (5.3%) | 738 (5.6%) |
| 70 to 74 Years | 582 (4.9%) | 672 (5.1%) |
| 75 to 79 Years | 277 (2.4%) | 534 (4.1%) |
| 80 to 84 Years | 209 (1.8%) | 265 (2.0%) |
| 85 Years and over | 186 (1.6%) | 379 (2.9%) |
| Total | 11,771 (100.0%) | 13,102 (100.0%) |
Families and Households in Audrain County
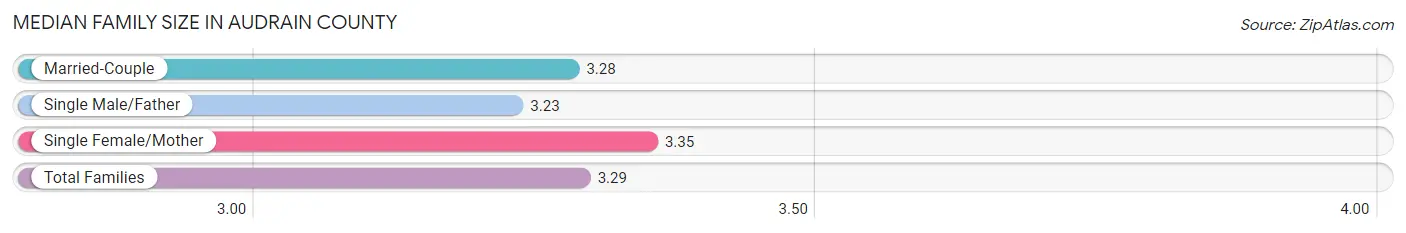
Median Family Size in Audrain County
The median family size in Audrain County is 3.29 persons per family, with single female/mother families (1,107 | 19.1%) accounting for the largest median family size of 3.35 persons per family. On the other hand, single male/father families (421 | 7.2%) represent the smallest median family size with 3.23 persons per family.
| Family Type | # Families | Family Size |
| Married-Couple | 4,276 (73.7%) | 3.28 |
| Single Male/Father | 421 (7.2%) | 3.23 |
| Single Female/Mother | 1,107 (19.1%) | 3.35 |
| Total Families | 5,804 (100.0%) | 3.29 |
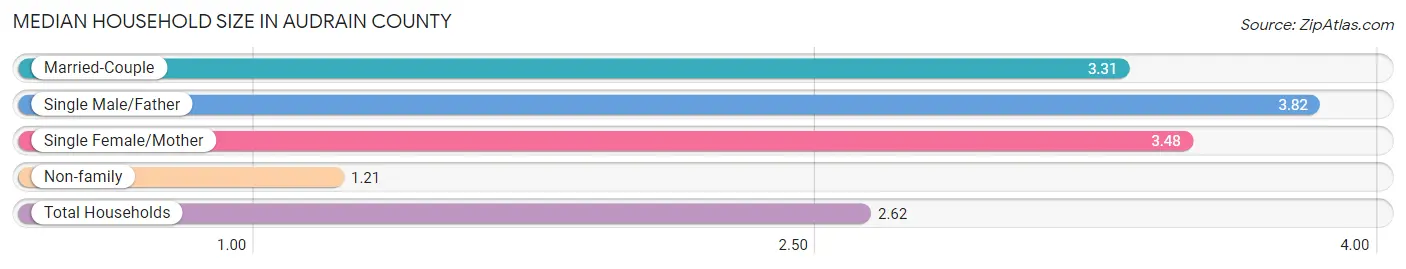
Median Household Size in Audrain County
The median household size in Audrain County is 2.62 persons per household, with single male/father households (421 | 4.7%) accounting for the largest median household size of 3.82 persons per household. non-family households (3,164 | 35.3%) represent the smallest median household size with 1.21 persons per household.
| Household Type | # Households | Household Size |
| Married-Couple | 4,276 (47.7%) | 3.31 |
| Single Male/Father | 421 (4.7%) | 3.82 |
| Single Female/Mother | 1,107 (12.3%) | 3.48 |
| Non-family | 3,164 (35.3%) | 1.21 |
| Total Households | 8,968 (100.0%) | 2.62 |
Household Size by Marriage Status in Audrain County
Out of a total of 8,968 households in Audrain County, 5,804 (64.7%) are family households, while 3,164 (35.3%) are nonfamily households. The most numerous type of family households are 2-person households, comprising 2,848, and the most common type of nonfamily households are 1-person households, comprising 2,763.
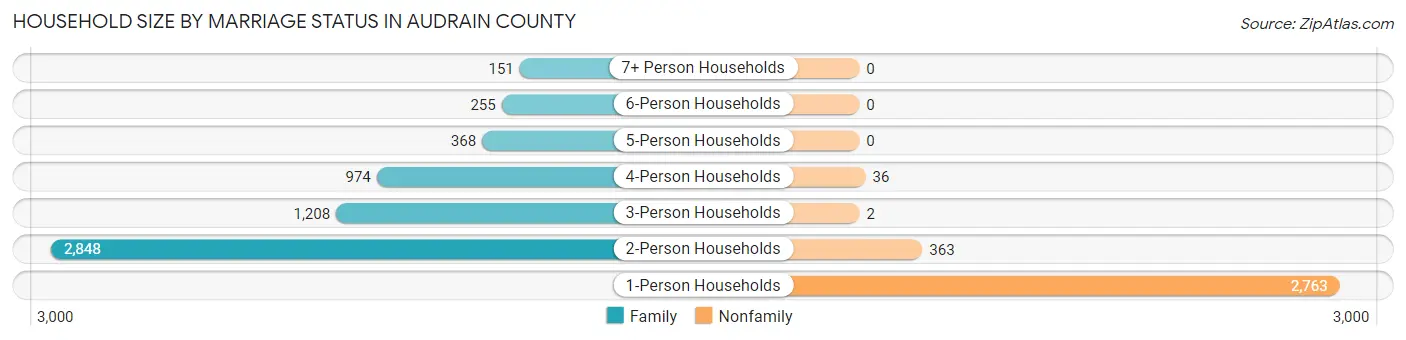
| Household Size | Family Households | Nonfamily Households |
| 1-Person Households | - | 2,763 (30.8%) |
| 2-Person Households | 2,848 (31.8%) | 363 (4.1%) |
| 3-Person Households | 1,208 (13.5%) | 2 (0.0%) |
| 4-Person Households | 974 (10.9%) | 36 (0.4%) |
| 5-Person Households | 368 (4.1%) | 0 (0.0%) |
| 6-Person Households | 255 (2.8%) | 0 (0.0%) |
| 7+ Person Households | 151 (1.7%) | 0 (0.0%) |
| Total | 5,804 (64.7%) | 3,164 (35.3%) |
Female Fertility in Audrain County
Fertility by Age in Audrain County
Average fertility rate in Audrain County is 100.0 births per 1,000 women. Women in the age bracket of 20 to 34 years have the highest fertility rate with 175.0 births per 1,000 women. Women in the age bracket of 20 to 34 years acount for 75.8% of all women with births.
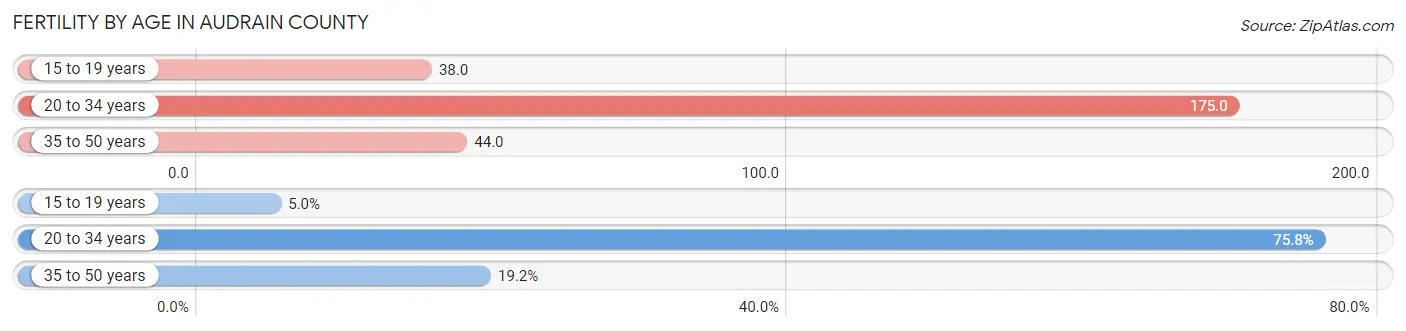
| Age Bracket | Women with Births | Births / 1,000 Women |
| 15 to 19 years | 30 (5.0%) | 38.0 |
| 20 to 34 years | 458 (75.8%) | 175.0 |
| 35 to 50 years | 116 (19.2%) | 44.0 |
| Total | 604 (100.0%) | 100.0 |
Fertility by Age by Marriage Status in Audrain County
74.2% of women with births (604) in Audrain County are married. The highest percentage of unmarried women with births falls into 15 to 19 years age bracket with 100.0% of them unmarried at the time of birth, while the lowest percentage of unmarried women with births belong to 35 to 50 years age bracket with 1.7% of them unmarried.
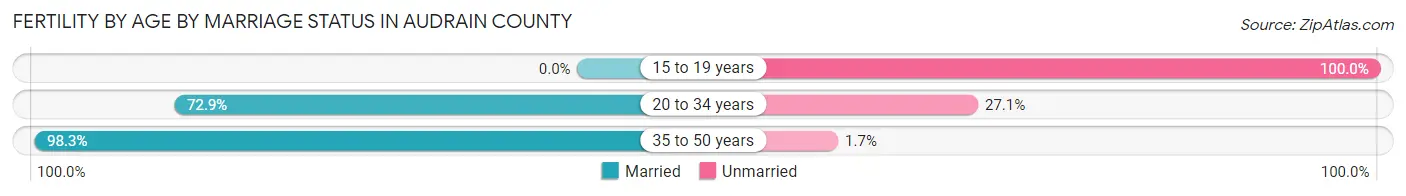
| Age Bracket | Married | Unmarried |
| 15 to 19 years | 0 (0.0%) | 30 (100.0%) |
| 20 to 34 years | 334 (72.9%) | 124 (27.1%) |
| 35 to 50 years | 114 (98.3%) | 2 (1.7%) |
| Total | 448 (74.2%) | 156 (25.8%) |
Fertility by Education in Audrain County
Average fertility rate in Audrain County is 100.0 births per 1,000 women. Women with the education attainment of bachelor's degree have the highest fertility rate of 209.0 births per 1,000 women, while women with the education attainment of college or associate's degree have the lowest fertility at 64.0 births per 1,000 women. Women with the education attainment of bachelor's degree represent 27.0% of all women with births.
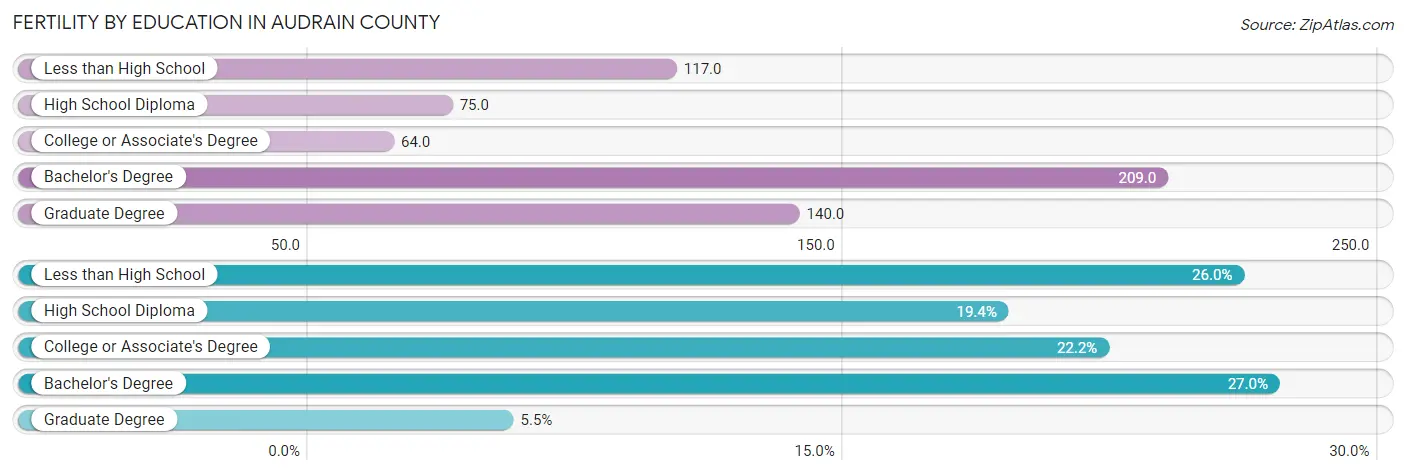
| Educational Attainment | Women with Births | Births / 1,000 Women |
| Less than High School | 157 (26.0%) | 117.0 |
| High School Diploma | 117 (19.4%) | 75.0 |
| College or Associate's Degree | 134 (22.2%) | 64.0 |
| Bachelor's Degree | 163 (27.0%) | 209.0 |
| Graduate Degree | 33 (5.5%) | 140.0 |
| Total | 604 (100.0%) | 100.0 |
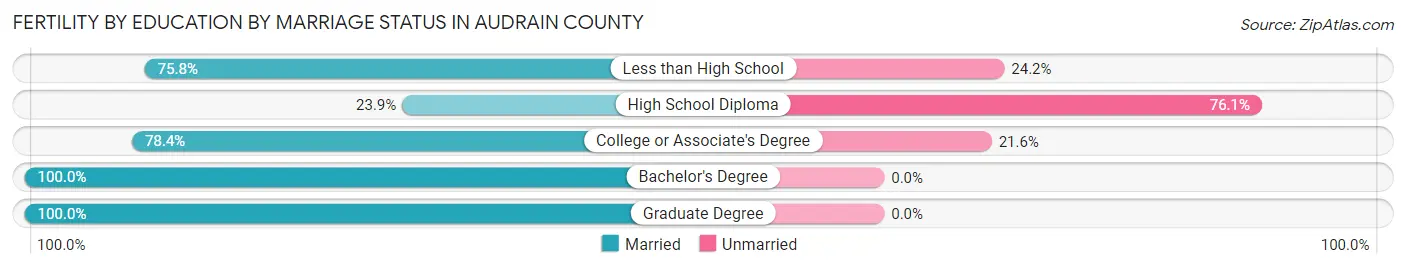
Fertility by Education by Marriage Status in Audrain County
25.8% of women with births in Audrain County are unmarried. Women with the educational attainment of bachelor's degree are most likely to be married with 100.0% of them married at childbirth, while women with the educational attainment of high school diploma are least likely to be married with 76.1% of them unmarried at childbirth.
| Educational Attainment | Married | Unmarried |
| Less than High School | 119 (75.8%) | 38 (24.2%) |
| High School Diploma | 28 (23.9%) | 89 (76.1%) |
| College or Associate's Degree | 105 (78.4%) | 29 (21.6%) |
| Bachelor's Degree | 163 (100.0%) | 0 (0.0%) |
| Graduate Degree | 33 (100.0%) | 0 (0.0%) |
| Total | 448 (74.2%) | 156 (25.8%) |
Employment Characteristics in Audrain County
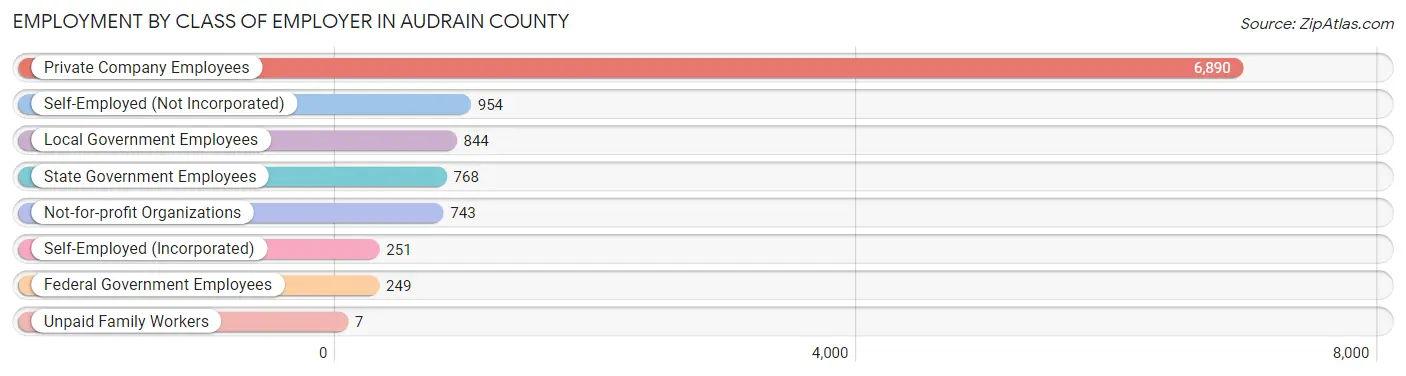
Employment by Class of Employer in Audrain County
Among the 10,706 employed individuals in Audrain County, private company employees (6,890 | 64.4%), self-employed (not incorporated) (954 | 8.9%), and local government employees (844 | 7.9%) make up the most common classes of employment.
| Employer Class | # Employees | % Employees |
| Private Company Employees | 6,890 | 64.4% |
| Self-Employed (Incorporated) | 251 | 2.3% |
| Self-Employed (Not Incorporated) | 954 | 8.9% |
| Not-for-profit Organizations | 743 | 6.9% |
| Local Government Employees | 844 | 7.9% |
| State Government Employees | 768 | 7.2% |
| Federal Government Employees | 249 | 2.3% |
| Unpaid Family Workers | 7 | 0.1% |
| Total | 10,706 | 100.0% |
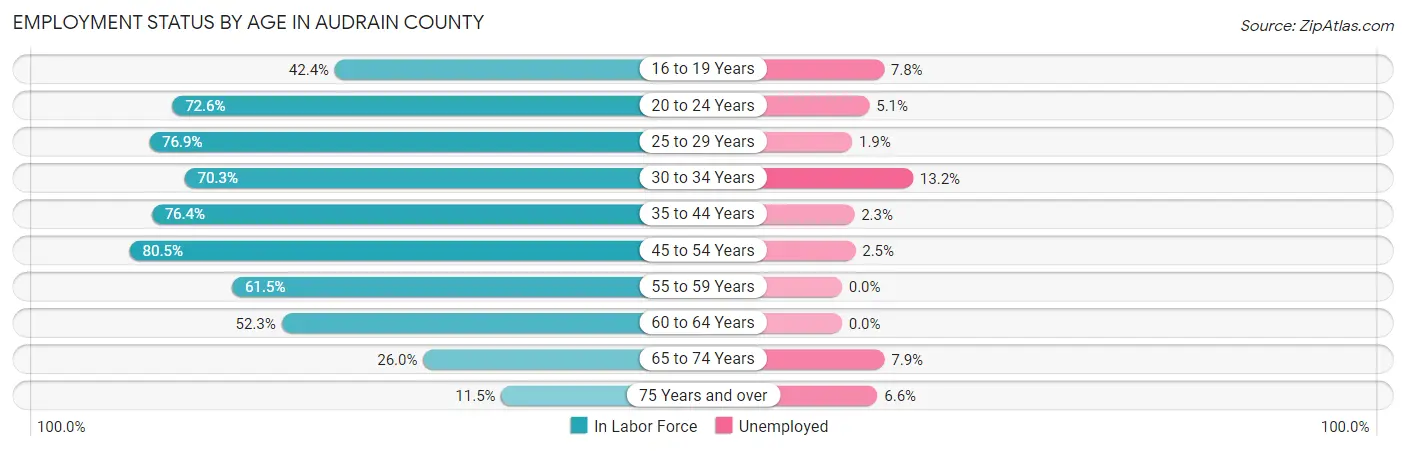
Employment Status by Age in Audrain County
According to the labor force statistics for Audrain County, out of the total population over 16 years of age (19,938), 57.9% or 11,544 individuals are in the labor force, with 3.9% or 450 of them unemployed. The age group with the highest labor force participation rate is 45 to 54 years, with 80.5% or 2,358 individuals in the labor force. Within the labor force, the 30 to 34 years age range has the highest percentage of unemployed individuals, with 13.2% or 150 of them being unemployed.
| Age Bracket | In Labor Force | Unemployed |
| 16 to 19 Years | 549 (42.4%) | 43 (7.8%) |
| 20 to 24 Years | 949 (72.6%) | 48 (5.1%) |
| 25 to 29 Years | 1,200 (76.9%) | 23 (1.9%) |
| 30 to 34 Years | 1,137 (70.3%) | 150 (13.2%) |
| 35 to 44 Years | 2,468 (76.4%) | 57 (2.3%) |
| 45 to 54 Years | 2,358 (80.5%) | 59 (2.5%) |
| 55 to 59 Years | 897 (61.5%) | 0 (0.0%) |
| 60 to 64 Years | 1,083 (52.3%) | 0 (0.0%) |
| 65 to 74 Years | 681 (26.0%) | 54 (7.9%) |
| 75 Years and over | 213 (11.5%) | 14 (6.6%) |
| Total | 11,544 (57.9%) | 450 (3.9%) |
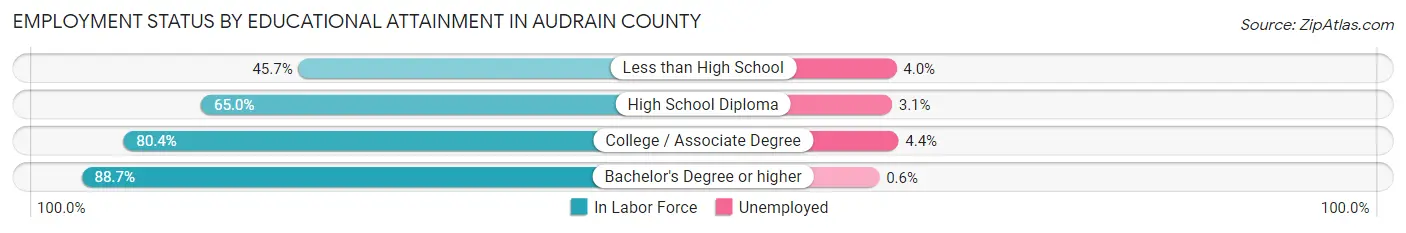
Employment Status by Educational Attainment in Audrain County
According to labor force statistics for Audrain County, 71.1% of individuals (9,148) out of the total population between 25 and 64 years of age (12,867) are in the labor force, with 3.2% or 293 of them being unemployed. The group with the highest labor force participation rate are those with the educational attainment of bachelor's degree or higher, with 88.7% or 1,873 individuals in the labor force. Within the labor force, individuals with college / associate degree education have the highest percentage of unemployment, with 4.4% or 144 of them being unemployed.
| Educational Attainment | In Labor Force | Unemployed |
| Less than High School | 822 (45.7%) | 72 (4.0%) |
| High School Diploma | 3,177 (65.0%) | 152 (3.1%) |
| College / Associate Degree | 3,271 (80.4%) | 179 (4.4%) |
| Bachelor's Degree or higher | 1,873 (88.7%) | 13 (0.6%) |
| Total | 9,148 (71.1%) | 412 (3.2%) |
Employment Occupations by Sex in Audrain County
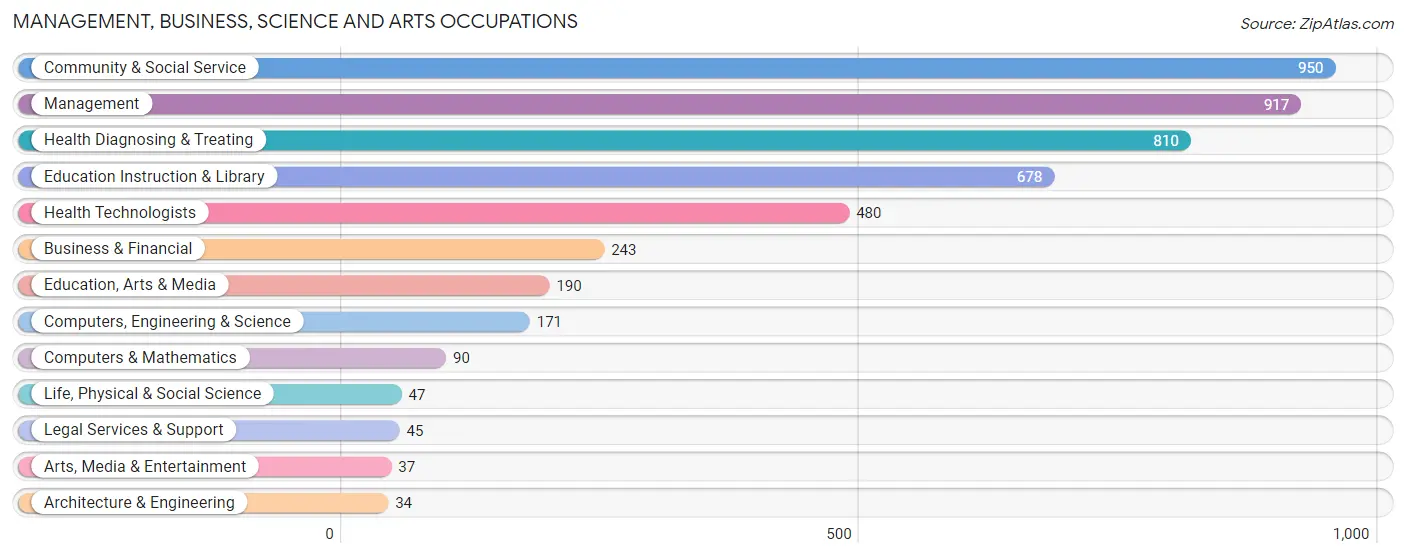
Management, Business, Science and Arts Occupations
The most common Management, Business, Science and Arts occupations in Audrain County are Community & Social Service (950 | 8.6%), Management (917 | 8.3%), Health Diagnosing & Treating (810 | 7.3%), Education Instruction & Library (678 | 6.1%), and Health Technologists (480 | 4.3%).
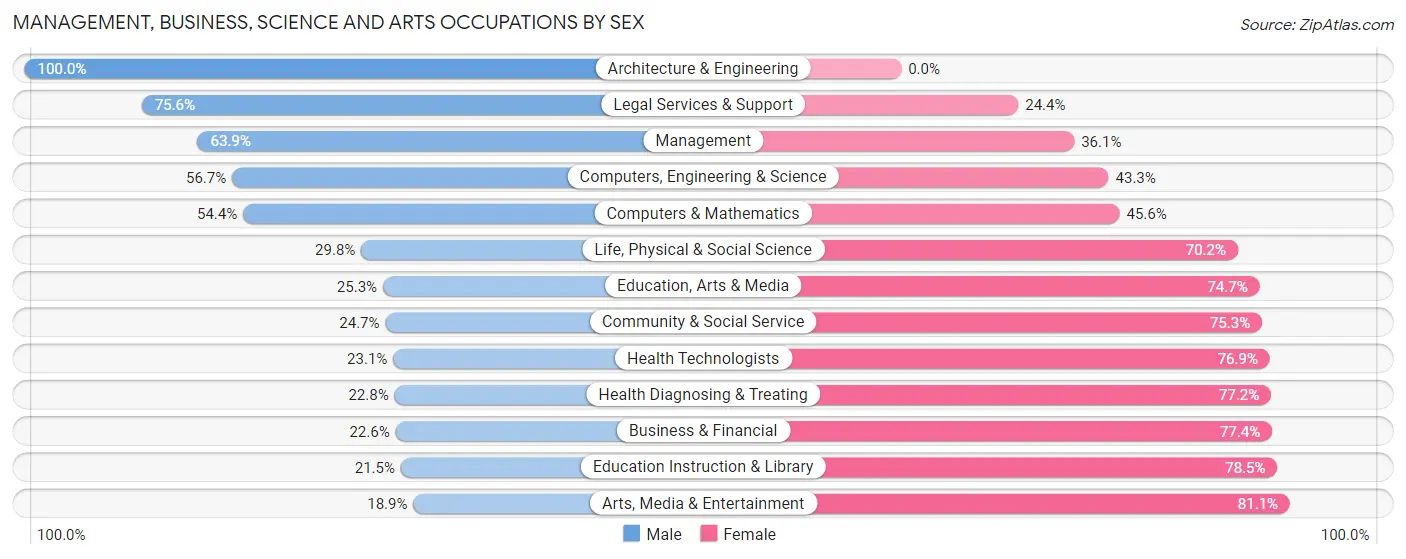
Management, Business, Science and Arts Occupations by Sex
Within the Management, Business, Science and Arts occupations in Audrain County, the most male-oriented occupations are Architecture & Engineering (100.0%), Legal Services & Support (75.6%), and Management (63.9%), while the most female-oriented occupations are Arts, Media & Entertainment (81.1%), Education Instruction & Library (78.5%), and Business & Financial (77.4%).
| Occupation | Male | Female |
| Management | 586 (63.9%) | 331 (36.1%) |
| Business & Financial | 55 (22.6%) | 188 (77.4%) |
| Computers, Engineering & Science | 97 (56.7%) | 74 (43.3%) |
| Computers & Mathematics | 49 (54.4%) | 41 (45.6%) |
| Architecture & Engineering | 34 (100.0%) | 0 (0.0%) |
| Life, Physical & Social Science | 14 (29.8%) | 33 (70.2%) |
| Community & Social Service | 235 (24.7%) | 715 (75.3%) |
| Education, Arts & Media | 48 (25.3%) | 142 (74.7%) |
| Legal Services & Support | 34 (75.6%) | 11 (24.4%) |
| Education Instruction & Library | 146 (21.5%) | 532 (78.5%) |
| Arts, Media & Entertainment | 7 (18.9%) | 30 (81.1%) |
| Health Diagnosing & Treating | 185 (22.8%) | 625 (77.2%) |
| Health Technologists | 111 (23.1%) | 369 (76.9%) |
| Total (Category) | 1,158 (37.5%) | 1,933 (62.5%) |
| Total (Overall) | 5,565 (50.2%) | 5,512 (49.8%) |
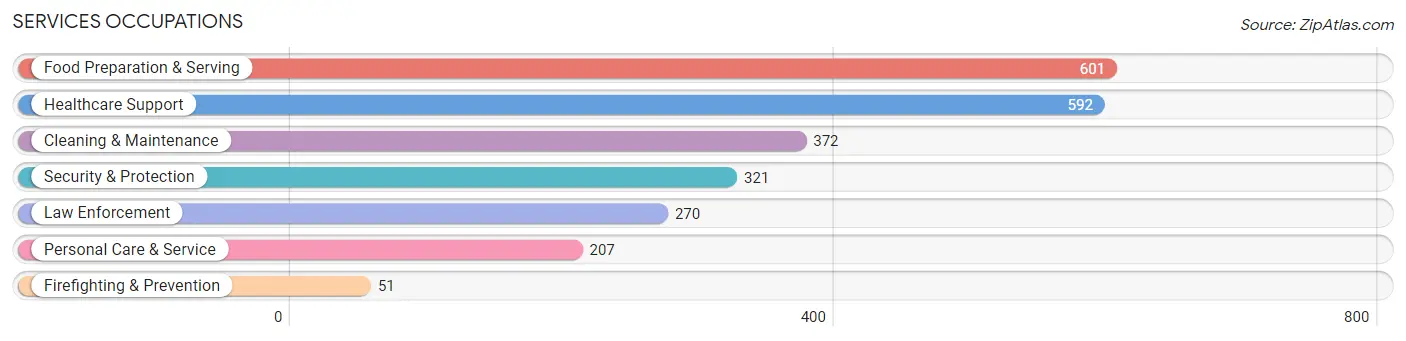
Services Occupations
The most common Services occupations in Audrain County are Food Preparation & Serving (601 | 5.4%), Healthcare Support (592 | 5.3%), Cleaning & Maintenance (372 | 3.4%), Security & Protection (321 | 2.9%), and Law Enforcement (270 | 2.4%).
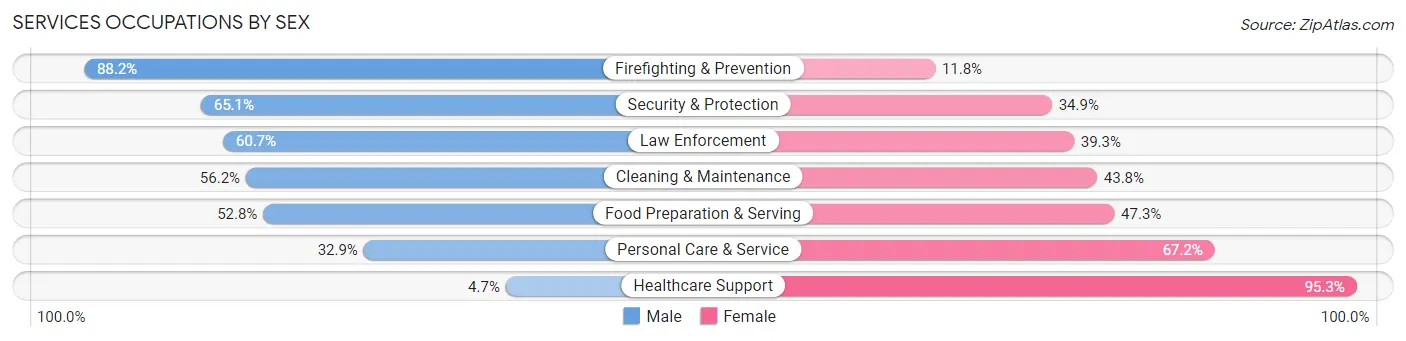
Services Occupations by Sex
Within the Services occupations in Audrain County, the most male-oriented occupations are Firefighting & Prevention (88.2%), Security & Protection (65.1%), and Law Enforcement (60.7%), while the most female-oriented occupations are Healthcare Support (95.3%), Personal Care & Service (67.1%), and Food Preparation & Serving (47.2%).
| Occupation | Male | Female |
| Healthcare Support | 28 (4.7%) | 564 (95.3%) |
| Security & Protection | 209 (65.1%) | 112 (34.9%) |
| Firefighting & Prevention | 45 (88.2%) | 6 (11.8%) |
| Law Enforcement | 164 (60.7%) | 106 (39.3%) |
| Food Preparation & Serving | 317 (52.7%) | 284 (47.2%) |
| Cleaning & Maintenance | 209 (56.2%) | 163 (43.8%) |
| Personal Care & Service | 68 (32.9%) | 139 (67.1%) |
| Total (Category) | 831 (39.7%) | 1,262 (60.3%) |
| Total (Overall) | 5,565 (50.2%) | 5,512 (49.8%) |
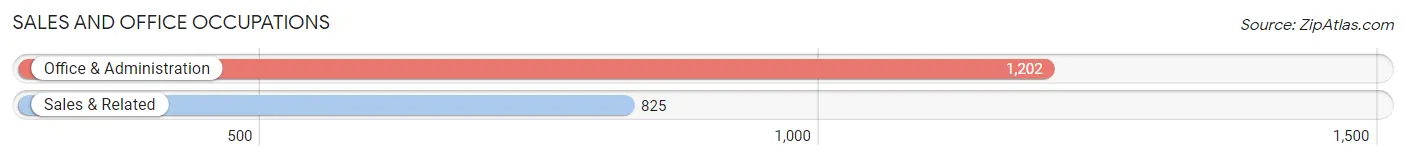
Sales and Office Occupations
The most common Sales and Office occupations in Audrain County are Office & Administration (1,202 | 10.8%), and Sales & Related (825 | 7.4%).
Sales and Office Occupations by Sex
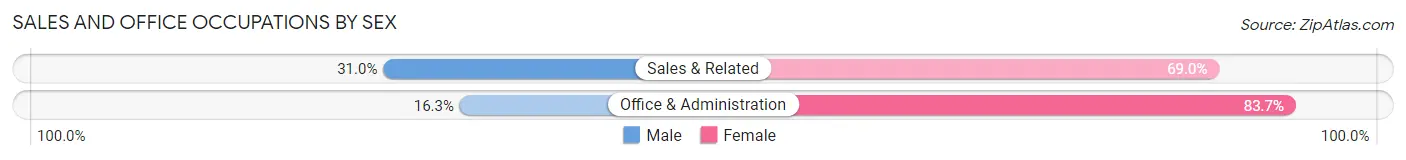
| Occupation | Male | Female |
| Sales & Related | 256 (31.0%) | 569 (69.0%) |
| Office & Administration | 196 (16.3%) | 1,006 (83.7%) |
| Total (Category) | 452 (22.3%) | 1,575 (77.7%) |
| Total (Overall) | 5,565 (50.2%) | 5,512 (49.8%) |
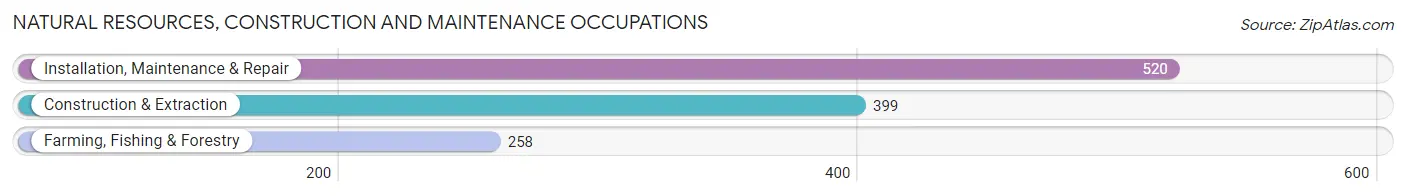
Natural Resources, Construction and Maintenance Occupations
The most common Natural Resources, Construction and Maintenance occupations in Audrain County are Installation, Maintenance & Repair (520 | 4.7%), Construction & Extraction (399 | 3.6%), and Farming, Fishing & Forestry (258 | 2.3%).
Natural Resources, Construction and Maintenance Occupations by Sex
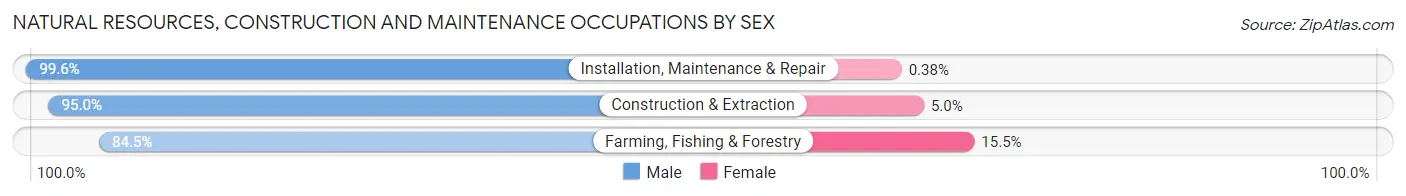
| Occupation | Male | Female |
| Farming, Fishing & Forestry | 218 (84.5%) | 40 (15.5%) |
| Construction & Extraction | 379 (95.0%) | 20 (5.0%) |
| Installation, Maintenance & Repair | 518 (99.6%) | 2 (0.4%) |
| Total (Category) | 1,115 (94.7%) | 62 (5.3%) |
| Total (Overall) | 5,565 (50.2%) | 5,512 (49.8%) |
Production, Transportation and Moving Occupations
The most common Production, Transportation and Moving occupations in Audrain County are Production (1,326 | 12.0%), Material Moving (825 | 7.4%), and Transportation (538 | 4.9%).
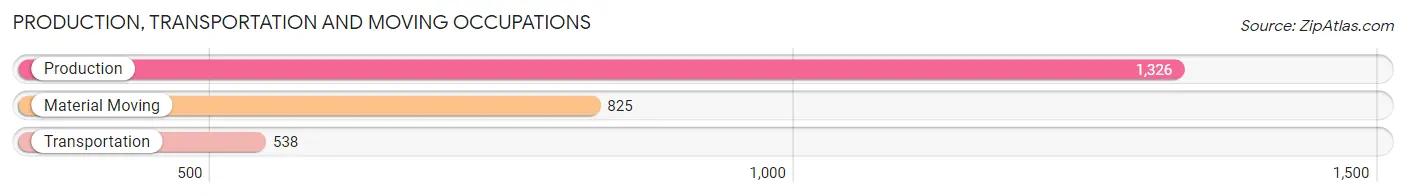
Production, Transportation and Moving Occupations by Sex
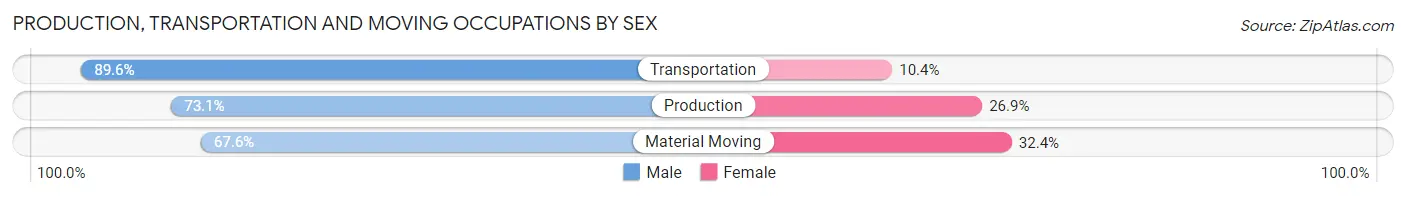
| Occupation | Male | Female |
| Production | 969 (73.1%) | 357 (26.9%) |
| Transportation | 482 (89.6%) | 56 (10.4%) |
| Material Moving | 558 (67.6%) | 267 (32.4%) |
| Total (Category) | 2,009 (74.7%) | 680 (25.3%) |
| Total (Overall) | 5,565 (50.2%) | 5,512 (49.8%) |
Employment Industries by Sex in Audrain County
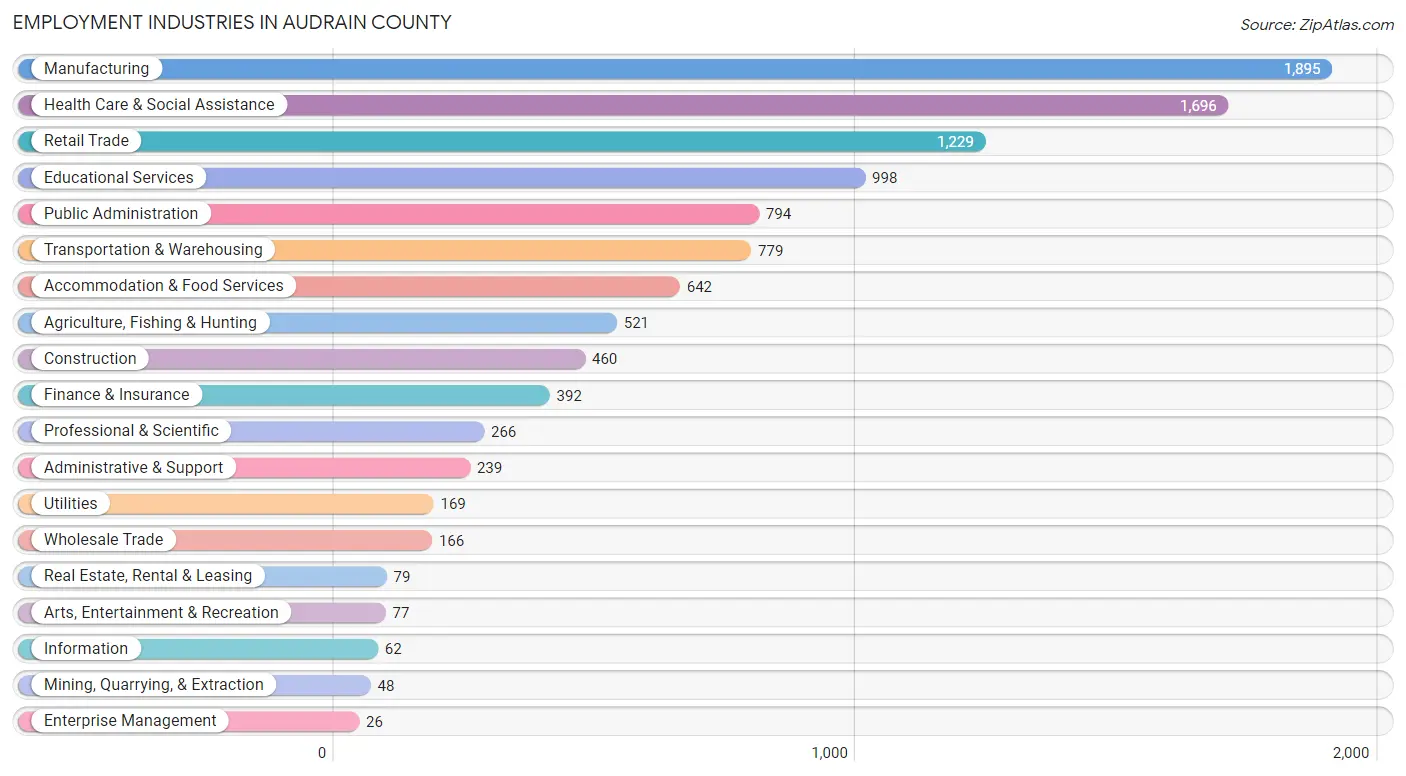
Employment Industries in Audrain County
The major employment industries in Audrain County include Manufacturing (1,895 | 17.1%), Health Care & Social Assistance (1,696 | 15.3%), Retail Trade (1,229 | 11.1%), Educational Services (998 | 9.0%), and Public Administration (794 | 7.2%).
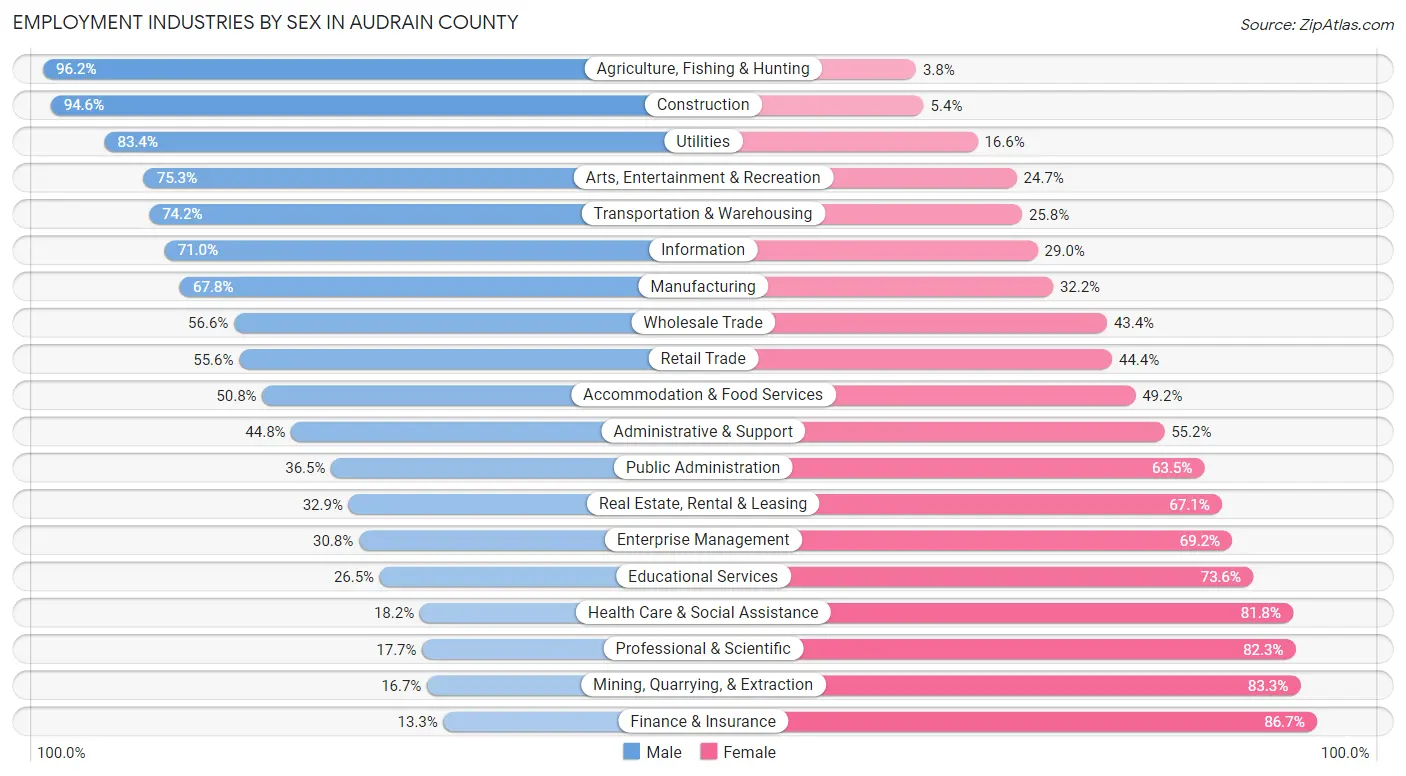
Employment Industries by Sex in Audrain County
The Audrain County industries that see more men than women are Agriculture, Fishing & Hunting (96.2%), Construction (94.6%), and Utilities (83.4%), whereas the industries that tend to have a higher number of women are Finance & Insurance (86.7%), Mining, Quarrying, & Extraction (83.3%), and Professional & Scientific (82.3%).
| Industry | Male | Female |
| Agriculture, Fishing & Hunting | 501 (96.2%) | 20 (3.8%) |
| Mining, Quarrying, & Extraction | 8 (16.7%) | 40 (83.3%) |
| Construction | 435 (94.6%) | 25 (5.4%) |
| Manufacturing | 1,285 (67.8%) | 610 (32.2%) |
| Wholesale Trade | 94 (56.6%) | 72 (43.4%) |
| Retail Trade | 683 (55.6%) | 546 (44.4%) |
| Transportation & Warehousing | 578 (74.2%) | 201 (25.8%) |
| Utilities | 141 (83.4%) | 28 (16.6%) |
| Information | 44 (71.0%) | 18 (29.0%) |
| Finance & Insurance | 52 (13.3%) | 340 (86.7%) |
| Real Estate, Rental & Leasing | 26 (32.9%) | 53 (67.1%) |
| Professional & Scientific | 47 (17.7%) | 219 (82.3%) |
| Enterprise Management | 8 (30.8%) | 18 (69.2%) |
| Administrative & Support | 107 (44.8%) | 132 (55.2%) |
| Educational Services | 264 (26.5%) | 734 (73.6%) |
| Health Care & Social Assistance | 308 (18.2%) | 1,388 (81.8%) |
| Arts, Entertainment & Recreation | 58 (75.3%) | 19 (24.7%) |
| Accommodation & Food Services | 326 (50.8%) | 316 (49.2%) |
| Public Administration | 290 (36.5%) | 504 (63.5%) |
| Total | 5,565 (50.2%) | 5,512 (49.8%) |
Education in Audrain County
School Enrollment in Audrain County
The most common levels of schooling among the 5,212 students in Audrain County are elementary school (1,420 | 27.2%), high school (1,356 | 26.0%), and middle school (1,158 | 22.2%).
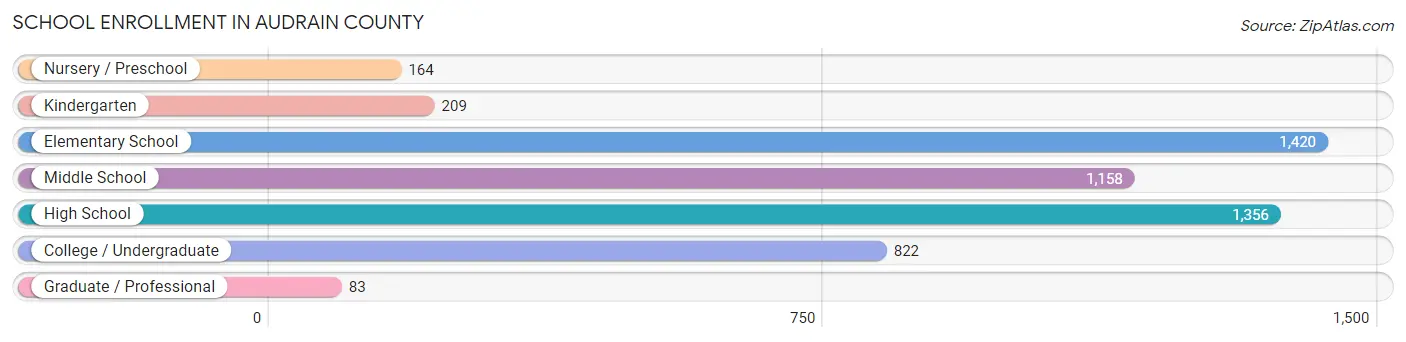
| School Level | # Students | % Students |
| Nursery / Preschool | 164 | 3.2% |
| Kindergarten | 209 | 4.0% |
| Elementary School | 1,420 | 27.2% |
| Middle School | 1,158 | 22.2% |
| High School | 1,356 | 26.0% |
| College / Undergraduate | 822 | 15.8% |
| Graduate / Professional | 83 | 1.6% |
| Total | 5,212 | 100.0% |
School Enrollment by Age by Funding Source in Audrain County
Out of a total of 5,212 students who are enrolled in schools in Audrain County, 620 (11.9%) attend a private institution, while the remaining 4,592 (88.1%) are enrolled in public schools. The age group of 35 years and over has the highest likelihood of being enrolled in private schools, with 52 (24.6% in the age bracket) enrolled. Conversely, the age group of 15 to 17 year olds has the lowest likelihood of being enrolled in a private school, with 1,016 (98.5% in the age bracket) attending a public institution.
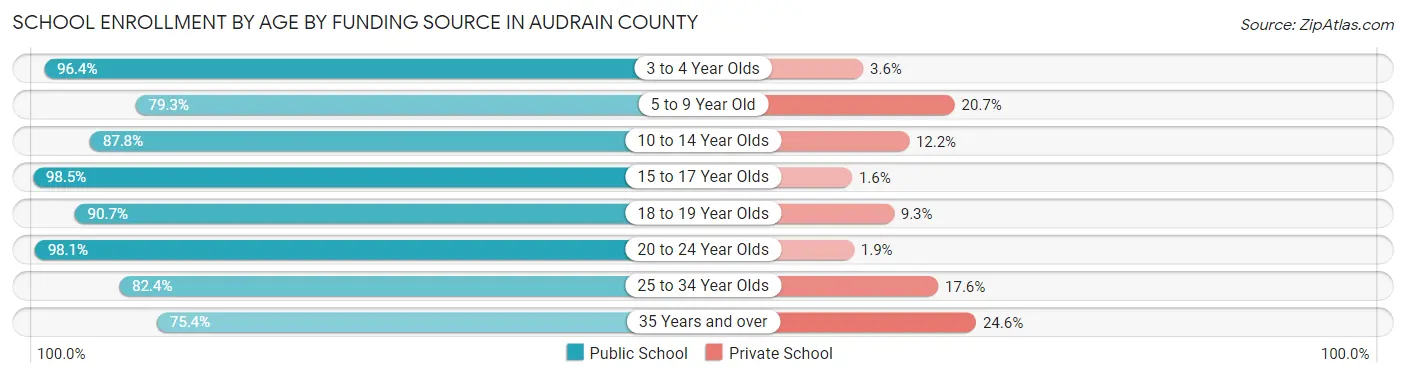
| Age Bracket | Public School | Private School |
| 3 to 4 Year Olds | 133 (96.4%) | 5 (3.6%) |
| 5 to 9 Year Old | 1,036 (79.3%) | 270 (20.7%) |
| 10 to 14 Year Olds | 1,337 (87.8%) | 185 (12.2%) |
| 15 to 17 Year Olds | 1,016 (98.5%) | 16 (1.5%) |
| 18 to 19 Year Olds | 311 (90.7%) | 32 (9.3%) |
| 20 to 24 Year Olds | 363 (98.1%) | 7 (1.9%) |
| 25 to 34 Year Olds | 239 (82.4%) | 51 (17.6%) |
| 35 Years and over | 159 (75.4%) | 52 (24.6%) |
| Total | 4,592 (88.1%) | 620 (11.9%) |
Educational Attainment by Field of Study in Audrain County
Education (774 | 27.9%), business (505 | 18.2%), science & technology (265 | 9.6%), arts & humanities (253 | 9.1%), and bio, nature & agricultural (238 | 8.6%) are the most common fields of study among 2,772 individuals in Audrain County who have obtained a bachelor's degree or higher.
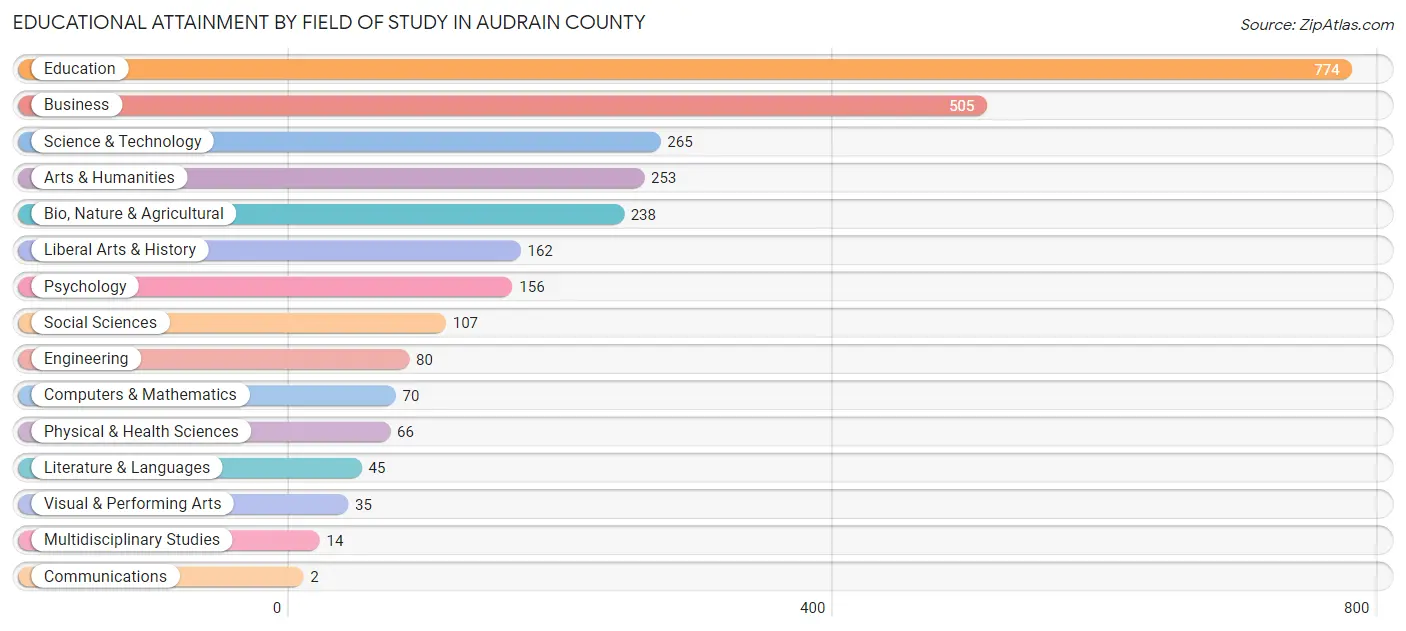
| Field of Study | # Graduates | % Graduates |
| Computers & Mathematics | 70 | 2.5% |
| Bio, Nature & Agricultural | 238 | 8.6% |
| Physical & Health Sciences | 66 | 2.4% |
| Psychology | 156 | 5.6% |
| Social Sciences | 107 | 3.9% |
| Engineering | 80 | 2.9% |
| Multidisciplinary Studies | 14 | 0.5% |
| Science & Technology | 265 | 9.6% |
| Business | 505 | 18.2% |
| Education | 774 | 27.9% |
| Literature & Languages | 45 | 1.6% |
| Liberal Arts & History | 162 | 5.8% |
| Visual & Performing Arts | 35 | 1.3% |
| Communications | 2 | 0.1% |
| Arts & Humanities | 253 | 9.1% |
| Total | 2,772 | 100.0% |
Transportation & Commute in Audrain County
Vehicle Availability by Sex in Audrain County
The most prevalent vehicle ownership categories in Audrain County are males with 2 vehicles (1,932, accounting for 36.4%) and females with 2 vehicles (1,968, making up 35.9%).
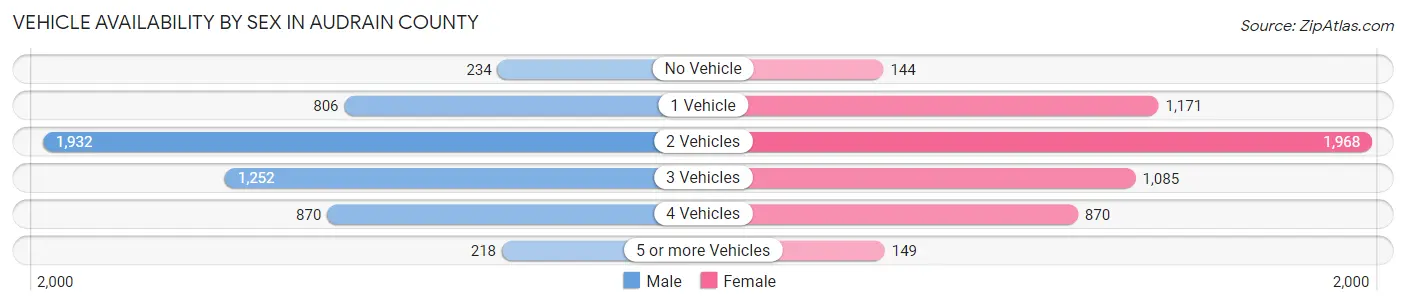
| Vehicles Available | Male | Female |
| No Vehicle | 234 (4.4%) | 144 (2.7%) |
| 1 Vehicle | 806 (15.2%) | 1,171 (21.7%) |
| 2 Vehicles | 1,932 (36.4%) | 1,968 (36.5%) |
| 3 Vehicles | 1,252 (23.6%) | 1,085 (20.1%) |
| 4 Vehicles | 870 (16.4%) | 870 (16.2%) |
| 5 or more Vehicles | 218 (4.1%) | 149 (2.8%) |
| Total | 5,312 (100.0%) | 5,387 (100.0%) |
Commute Time in Audrain County
The most frequently occuring commute durations in Audrain County are 5 to 9 minutes (2,663 commuters, 26.0%), 10 to 14 minutes (1,225 commuters, 11.9%), and 30 to 34 minutes (1,161 commuters, 11.3%).
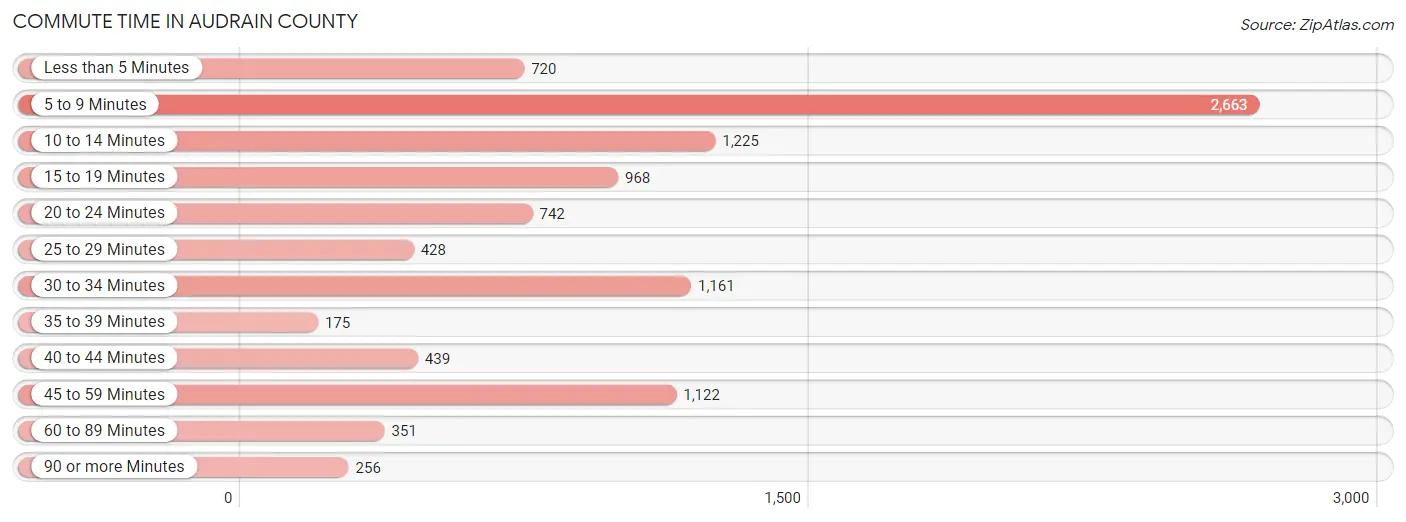
| Commute Time | # Commuters | % Commuters |
| Less than 5 Minutes | 720 | 7.0% |
| 5 to 9 Minutes | 2,663 | 26.0% |
| 10 to 14 Minutes | 1,225 | 11.9% |
| 15 to 19 Minutes | 968 | 9.4% |
| 20 to 24 Minutes | 742 | 7.2% |
| 25 to 29 Minutes | 428 | 4.2% |
| 30 to 34 Minutes | 1,161 | 11.3% |
| 35 to 39 Minutes | 175 | 1.7% |
| 40 to 44 Minutes | 439 | 4.3% |
| 45 to 59 Minutes | 1,122 | 11.0% |
| 60 to 89 Minutes | 351 | 3.4% |
| 90 or more Minutes | 256 | 2.5% |
Commute Time by Sex in Audrain County
The most common commute times in Audrain County are 5 to 9 minutes (1,144 commuters, 22.6%) for males and 5 to 9 minutes (1,519 commuters, 29.3%) for females.
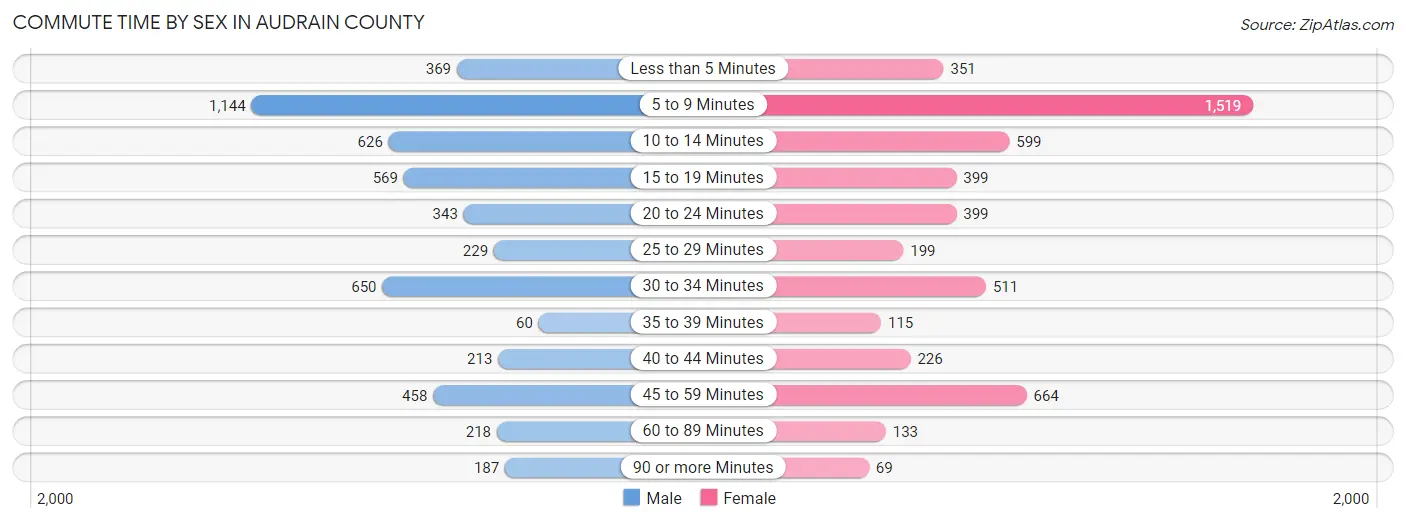
| Commute Time | Male | Female |
| Less than 5 Minutes | 369 (7.3%) | 351 (6.8%) |
| 5 to 9 Minutes | 1,144 (22.6%) | 1,519 (29.3%) |
| 10 to 14 Minutes | 626 (12.4%) | 599 (11.6%) |
| 15 to 19 Minutes | 569 (11.2%) | 399 (7.7%) |
| 20 to 24 Minutes | 343 (6.8%) | 399 (7.7%) |
| 25 to 29 Minutes | 229 (4.5%) | 199 (3.8%) |
| 30 to 34 Minutes | 650 (12.8%) | 511 (9.9%) |
| 35 to 39 Minutes | 60 (1.2%) | 115 (2.2%) |
| 40 to 44 Minutes | 213 (4.2%) | 226 (4.4%) |
| 45 to 59 Minutes | 458 (9.0%) | 664 (12.8%) |
| 60 to 89 Minutes | 218 (4.3%) | 133 (2.6%) |
| 90 or more Minutes | 187 (3.7%) | 69 (1.3%) |
Time of Departure to Work by Sex in Audrain County
The most frequent times of departure to work in Audrain County are 6:00 AM to 6:29 AM (651, 12.9%) for males and 7:00 AM to 7:29 AM (1,068, 20.6%) for females.
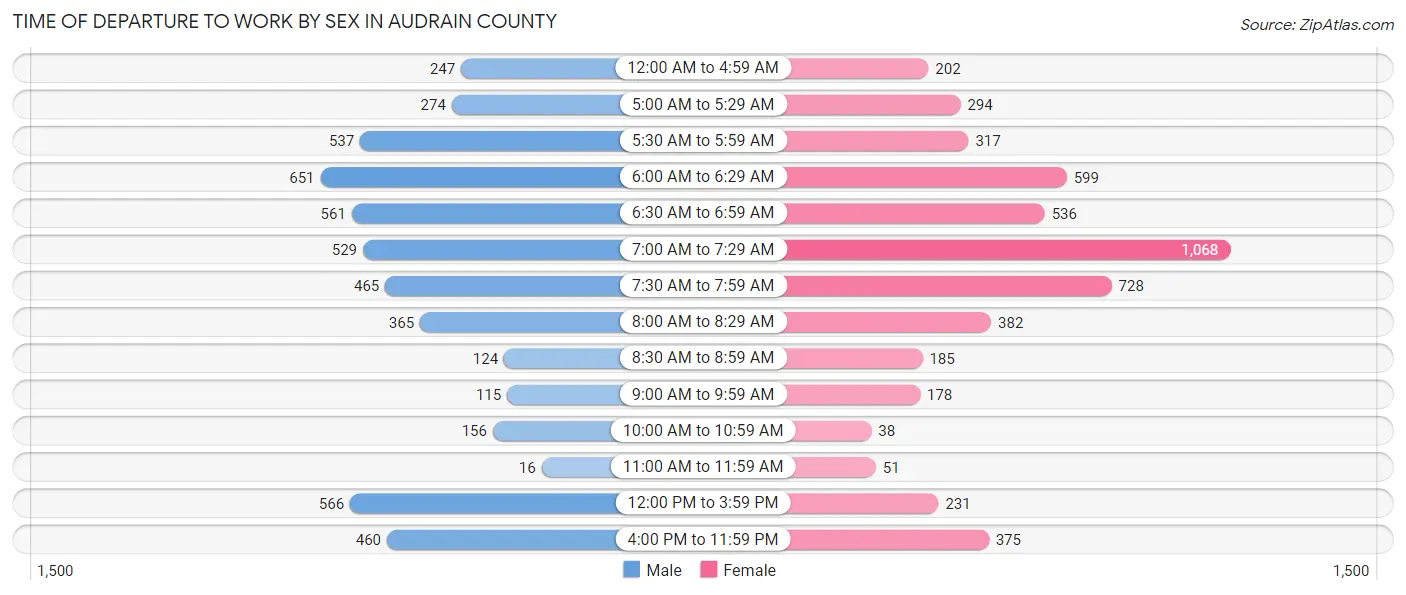
| Time of Departure | Male | Female |
| 12:00 AM to 4:59 AM | 247 (4.9%) | 202 (3.9%) |
| 5:00 AM to 5:29 AM | 274 (5.4%) | 294 (5.7%) |
| 5:30 AM to 5:59 AM | 537 (10.6%) | 317 (6.1%) |
| 6:00 AM to 6:29 AM | 651 (12.9%) | 599 (11.6%) |
| 6:30 AM to 6:59 AM | 561 (11.1%) | 536 (10.3%) |
| 7:00 AM to 7:29 AM | 529 (10.4%) | 1,068 (20.6%) |
| 7:30 AM to 7:59 AM | 465 (9.2%) | 728 (14.0%) |
| 8:00 AM to 8:29 AM | 365 (7.2%) | 382 (7.4%) |
| 8:30 AM to 8:59 AM | 124 (2.5%) | 185 (3.6%) |
| 9:00 AM to 9:59 AM | 115 (2.3%) | 178 (3.4%) |
| 10:00 AM to 10:59 AM | 156 (3.1%) | 38 (0.7%) |
| 11:00 AM to 11:59 AM | 16 (0.3%) | 51 (1.0%) |
| 12:00 PM to 3:59 PM | 566 (11.2%) | 231 (4.5%) |
| 4:00 PM to 11:59 PM | 460 (9.1%) | 375 (7.2%) |
| Total | 5,066 (100.0%) | 5,184 (100.0%) |
Housing Occupancy in Audrain County
Occupancy by Ownership in Audrain County
Of the total 8,968 dwellings in Audrain County, owner-occupied units account for 6,459 (72.0%), while renter-occupied units make up 2,509 (28.0%).
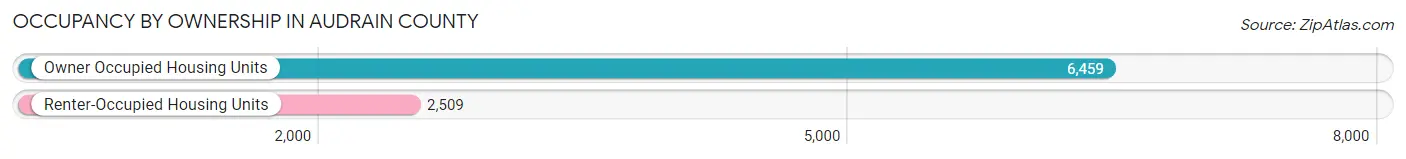
| Occupancy | # Housing Units | % Housing Units |
| Owner Occupied Housing Units | 6,459 | 72.0% |
| Renter-Occupied Housing Units | 2,509 | 28.0% |
| Total Occupied Housing Units | 8,968 | 100.0% |
Occupancy by Household Size in Audrain County
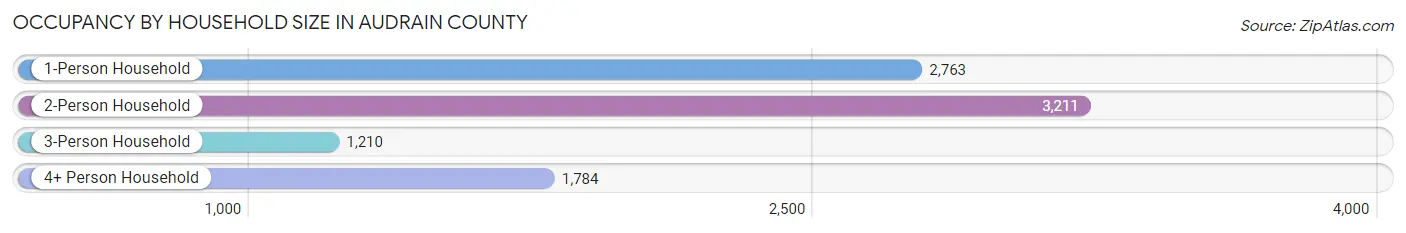
| Household Size | # Housing Units | % Housing Units |
| 1-Person Household | 2,763 | 30.8% |
| 2-Person Household | 3,211 | 35.8% |
| 3-Person Household | 1,210 | 13.5% |
| 4+ Person Household | 1,784 | 19.9% |
| Total Housing Units | 8,968 | 100.0% |
Occupancy by Ownership by Household Size in Audrain County
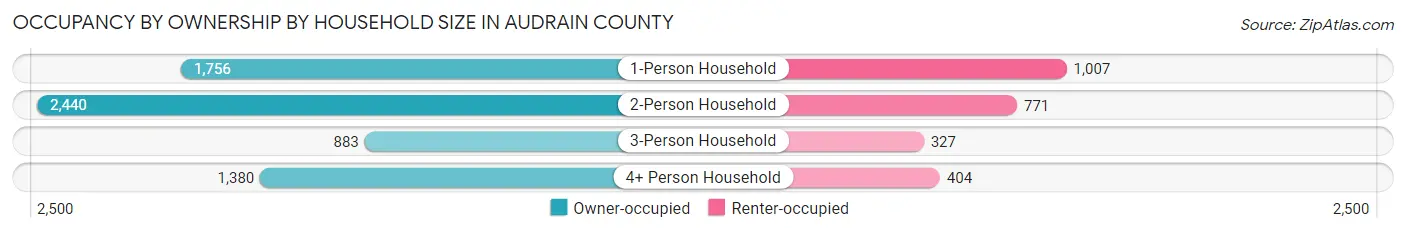
| Household Size | Owner-occupied | Renter-occupied |
| 1-Person Household | 1,756 (63.5%) | 1,007 (36.4%) |
| 2-Person Household | 2,440 (76.0%) | 771 (24.0%) |
| 3-Person Household | 883 (73.0%) | 327 (27.0%) |
| 4+ Person Household | 1,380 (77.3%) | 404 (22.7%) |
| Total Housing Units | 6,459 (72.0%) | 2,509 (28.0%) |
Occupancy by Educational Attainment in Audrain County
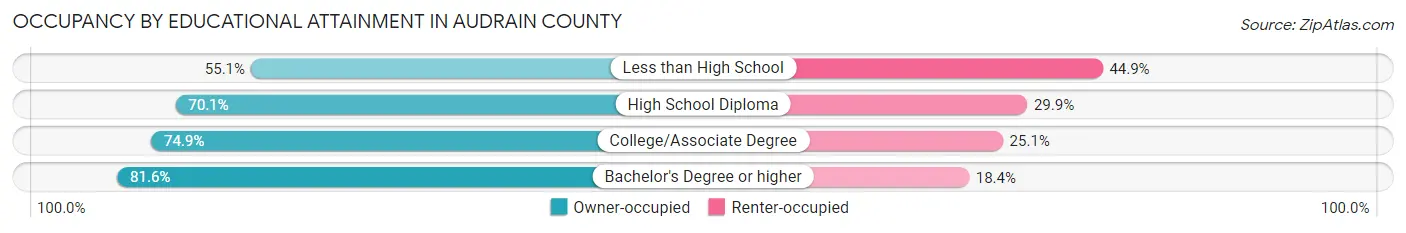
| Household Size | Owner-occupied | Renter-occupied |
| Less than High School | 547 (55.1%) | 445 (44.9%) |
| High School Diploma | 2,481 (70.1%) | 1,058 (29.9%) |
| College/Associate Degree | 2,133 (74.9%) | 714 (25.1%) |
| Bachelor's Degree or higher | 1,298 (81.6%) | 292 (18.4%) |
Occupancy by Age of Householder in Audrain County
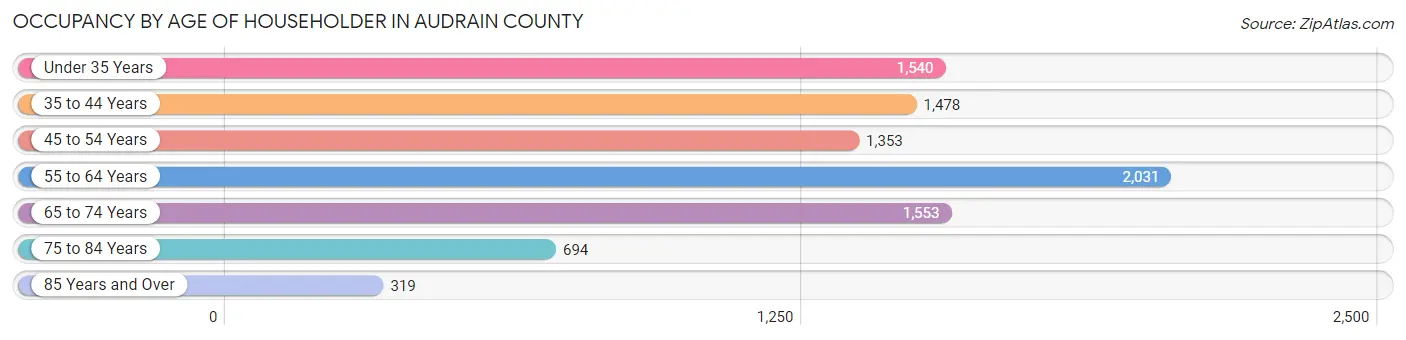
| Age Bracket | # Households | % Households |
| Under 35 Years | 1,540 | 17.2% |
| 35 to 44 Years | 1,478 | 16.5% |
| 45 to 54 Years | 1,353 | 15.1% |
| 55 to 64 Years | 2,031 | 22.7% |
| 65 to 74 Years | 1,553 | 17.3% |
| 75 to 84 Years | 694 | 7.7% |
| 85 Years and Over | 319 | 3.6% |
| Total | 8,968 | 100.0% |
Housing Finances in Audrain County
Median Income by Occupancy in Audrain County
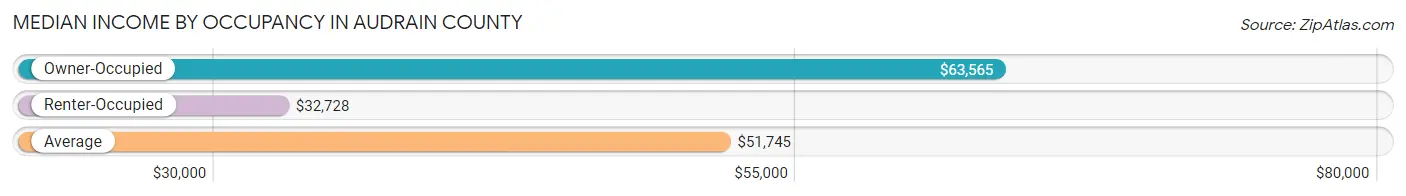
| Occupancy Type | # Households | Median Income |
| Owner-Occupied | 6,459 (72.0%) | $63,565 |
| Renter-Occupied | 2,509 (28.0%) | $32,728 |
| Average | 8,968 (100.0%) | $51,745 |
Occupancy by Householder Income Bracket in Audrain County
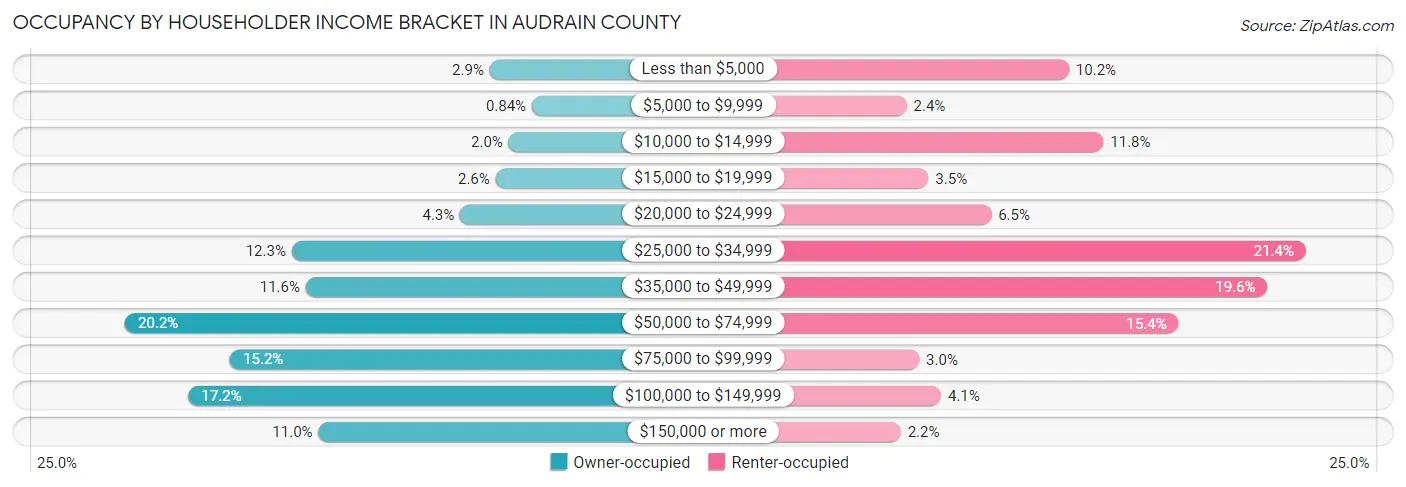
| Income Bracket | Owner-occupied | Renter-occupied |
| Less than $5,000 | 184 (2.9%) | 255 (10.2%) |
| $5,000 to $9,999 | 54 (0.8%) | 61 (2.4%) |
| $10,000 to $14,999 | 126 (1.9%) | 296 (11.8%) |
| $15,000 to $19,999 | 166 (2.6%) | 87 (3.5%) |
| $20,000 to $24,999 | 275 (4.3%) | 162 (6.5%) |
| $25,000 to $34,999 | 793 (12.3%) | 538 (21.4%) |
| $35,000 to $49,999 | 750 (11.6%) | 492 (19.6%) |
| $50,000 to $74,999 | 1,306 (20.2%) | 386 (15.4%) |
| $75,000 to $99,999 | 983 (15.2%) | 76 (3.0%) |
| $100,000 to $149,999 | 1,111 (17.2%) | 102 (4.1%) |
| $150,000 or more | 711 (11.0%) | 54 (2.1%) |
| Total | 6,459 (100.0%) | 2,509 (100.0%) |
Monthly Housing Cost Tiers in Audrain County
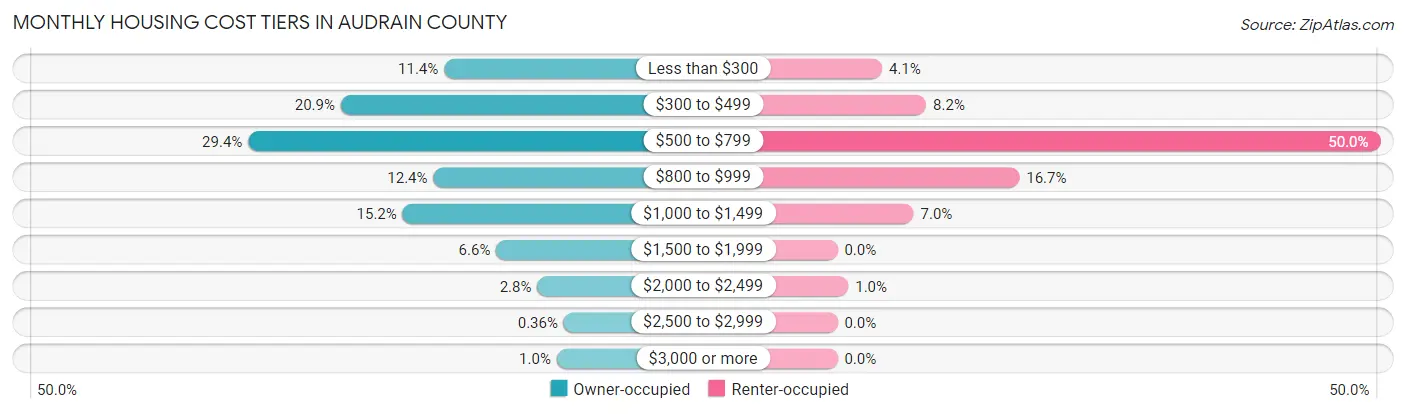
| Monthly Cost | Owner-occupied | Renter-occupied |
| Less than $300 | 735 (11.4%) | 103 (4.1%) |
| $300 to $499 | 1,349 (20.9%) | 205 (8.2%) |
| $500 to $799 | 1,900 (29.4%) | 1,254 (50.0%) |
| $800 to $999 | 799 (12.4%) | 420 (16.7%) |
| $1,000 to $1,499 | 982 (15.2%) | 176 (7.0%) |
| $1,500 to $1,999 | 425 (6.6%) | 0 (0.0%) |
| $2,000 to $2,499 | 181 (2.8%) | 25 (1.0%) |
| $2,500 to $2,999 | 23 (0.4%) | 0 (0.0%) |
| $3,000 or more | 65 (1.0%) | 0 (0.0%) |
| Total | 6,459 (100.0%) | 2,509 (100.0%) |
Physical Housing Characteristics in Audrain County
Housing Structures in Audrain County
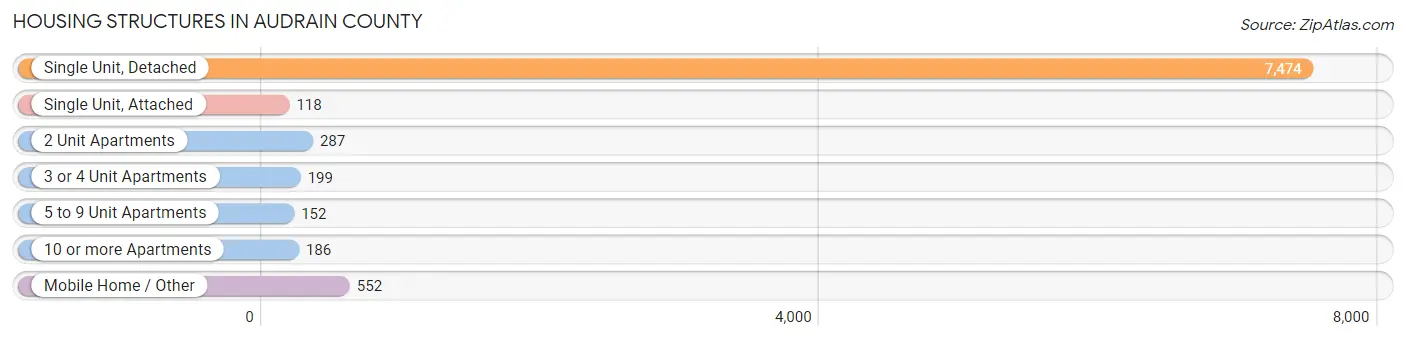
| Structure Type | # Housing Units | % Housing Units |
| Single Unit, Detached | 7,474 | 83.3% |
| Single Unit, Attached | 118 | 1.3% |
| 2 Unit Apartments | 287 | 3.2% |
| 3 or 4 Unit Apartments | 199 | 2.2% |
| 5 to 9 Unit Apartments | 152 | 1.7% |
| 10 or more Apartments | 186 | 2.1% |
| Mobile Home / Other | 552 | 6.2% |
| Total | 8,968 | 100.0% |
Housing Structures by Occupancy in Audrain County
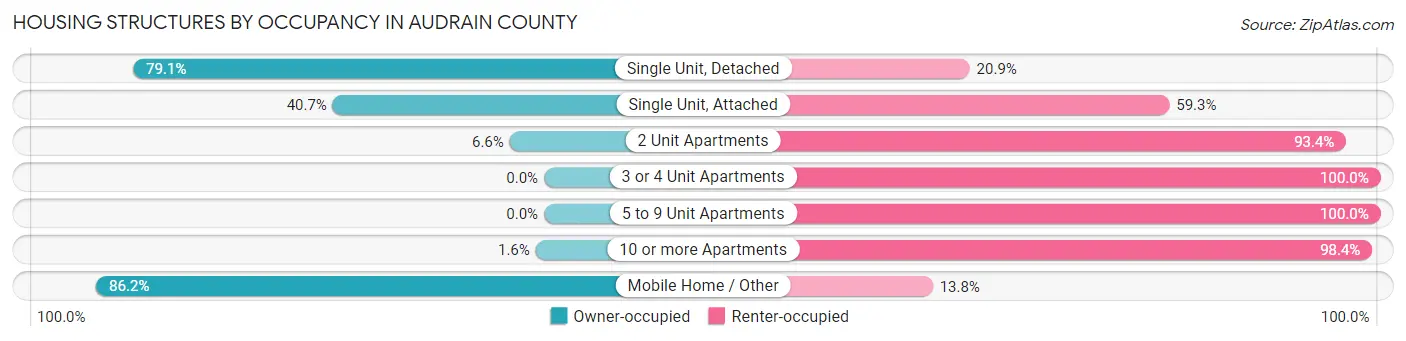
| Structure Type | Owner-occupied | Renter-occupied |
| Single Unit, Detached | 5,913 (79.1%) | 1,561 (20.9%) |
| Single Unit, Attached | 48 (40.7%) | 70 (59.3%) |
| 2 Unit Apartments | 19 (6.6%) | 268 (93.4%) |
| 3 or 4 Unit Apartments | 0 (0.0%) | 199 (100.0%) |
| 5 to 9 Unit Apartments | 0 (0.0%) | 152 (100.0%) |
| 10 or more Apartments | 3 (1.6%) | 183 (98.4%) |
| Mobile Home / Other | 476 (86.2%) | 76 (13.8%) |
| Total | 6,459 (72.0%) | 2,509 (28.0%) |
Housing Structures by Number of Rooms in Audrain County
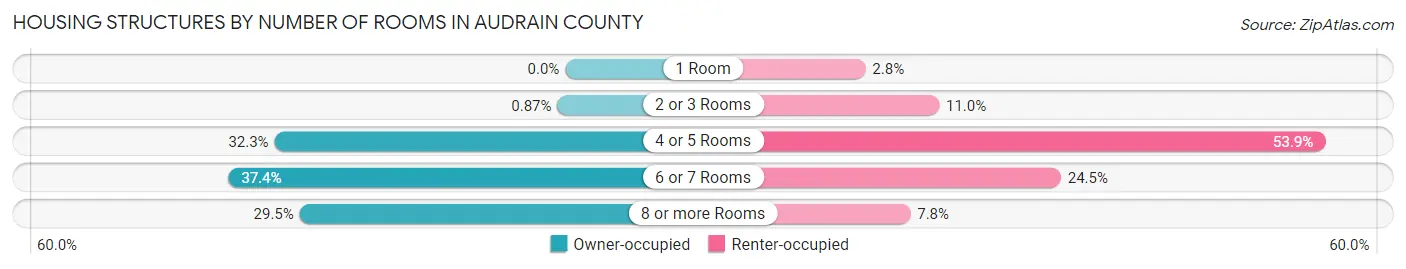
| Number of Rooms | Owner-occupied | Renter-occupied |
| 1 Room | 0 (0.0%) | 71 (2.8%) |
| 2 or 3 Rooms | 56 (0.9%) | 276 (11.0%) |
| 4 or 5 Rooms | 2,084 (32.3%) | 1,351 (53.8%) |
| 6 or 7 Rooms | 2,415 (37.4%) | 615 (24.5%) |
| 8 or more Rooms | 1,904 (29.5%) | 196 (7.8%) |
| Total | 6,459 (100.0%) | 2,509 (100.0%) |
Housing Structure by Heating Type in Audrain County
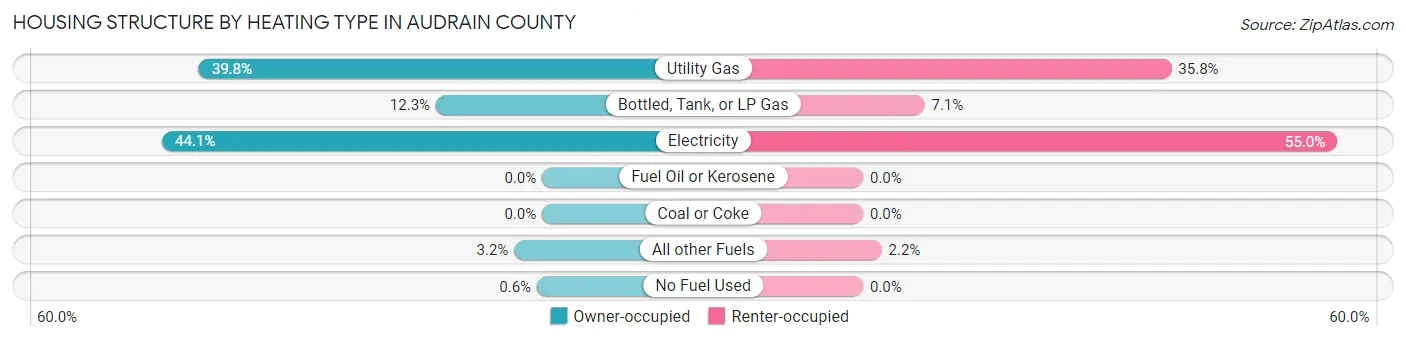
| Heating Type | Owner-occupied | Renter-occupied |
| Utility Gas | 2,571 (39.8%) | 897 (35.7%) |
| Bottled, Tank, or LP Gas | 795 (12.3%) | 179 (7.1%) |
| Electricity | 2,845 (44.1%) | 1,379 (55.0%) |
| Fuel Oil or Kerosene | 0 (0.0%) | 0 (0.0%) |
| Coal or Coke | 0 (0.0%) | 0 (0.0%) |
| All other Fuels | 209 (3.2%) | 54 (2.1%) |
| No Fuel Used | 39 (0.6%) | 0 (0.0%) |
| Total | 6,459 (100.0%) | 2,509 (100.0%) |
Household Vehicle Usage in Audrain County
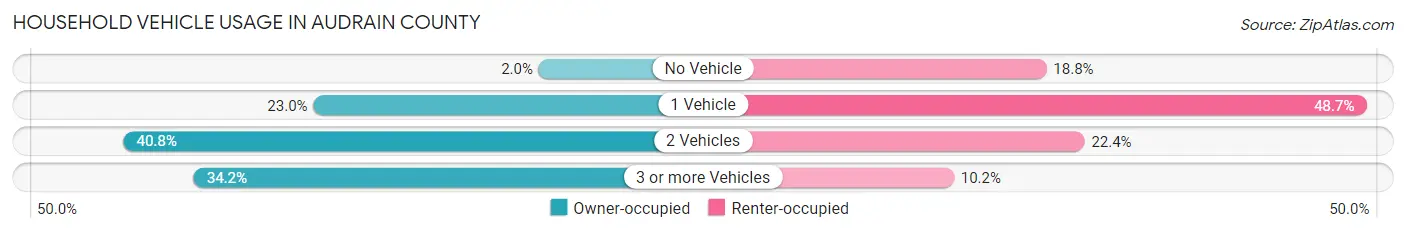
| Vehicles per Household | Owner-occupied | Renter-occupied |
| No Vehicle | 129 (2.0%) | 472 (18.8%) |
| 1 Vehicle | 1,488 (23.0%) | 1,221 (48.7%) |
| 2 Vehicles | 2,633 (40.8%) | 561 (22.4%) |
| 3 or more Vehicles | 2,209 (34.2%) | 255 (10.2%) |
| Total | 6,459 (100.0%) | 2,509 (100.0%) |
Real Estate & Mortgages in Audrain County
Real Estate and Mortgage Overview in Audrain County
| Characteristic | Without Mortgage | With Mortgage |
| Housing Units | 3,052 | 3,407 |
| Median Property Value | $115,300 | $110,300 |
| Median Household Income | $53,094 | $519 |
| Monthly Housing Costs | $408 | $63 |
| Real Estate Taxes | $1,045 | $57 |
Property Value by Mortgage Status in Audrain County
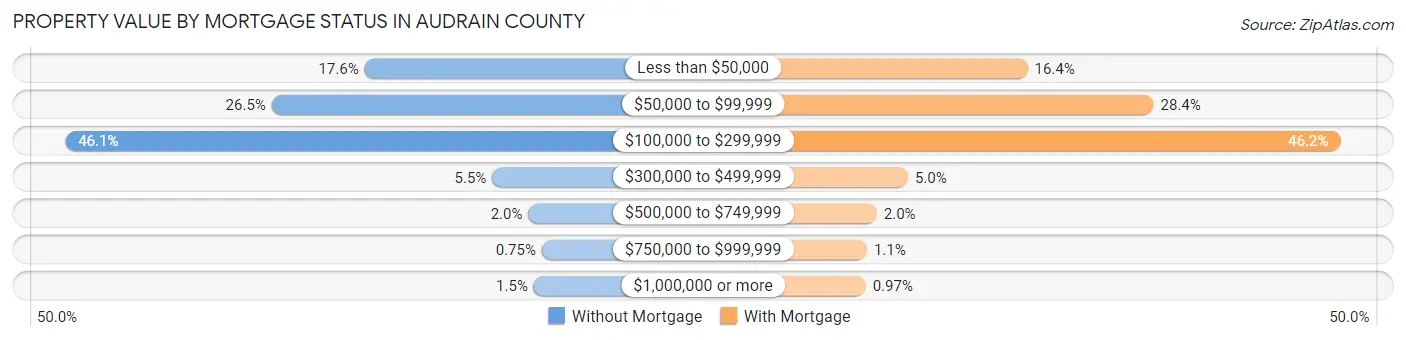
| Property Value | Without Mortgage | With Mortgage |
| Less than $50,000 | 538 (17.6%) | 558 (16.4%) |
| $50,000 to $99,999 | 808 (26.5%) | 967 (28.4%) |
| $100,000 to $299,999 | 1,408 (46.1%) | 1,573 (46.2%) |
| $300,000 to $499,999 | 167 (5.5%) | 170 (5.0%) |
| $500,000 to $749,999 | 62 (2.0%) | 69 (2.0%) |
| $750,000 to $999,999 | 23 (0.7%) | 37 (1.1%) |
| $1,000,000 or more | 46 (1.5%) | 33 (1.0%) |
| Total | 3,052 (100.0%) | 3,407 (100.0%) |
Household Income by Mortgage Status in Audrain County
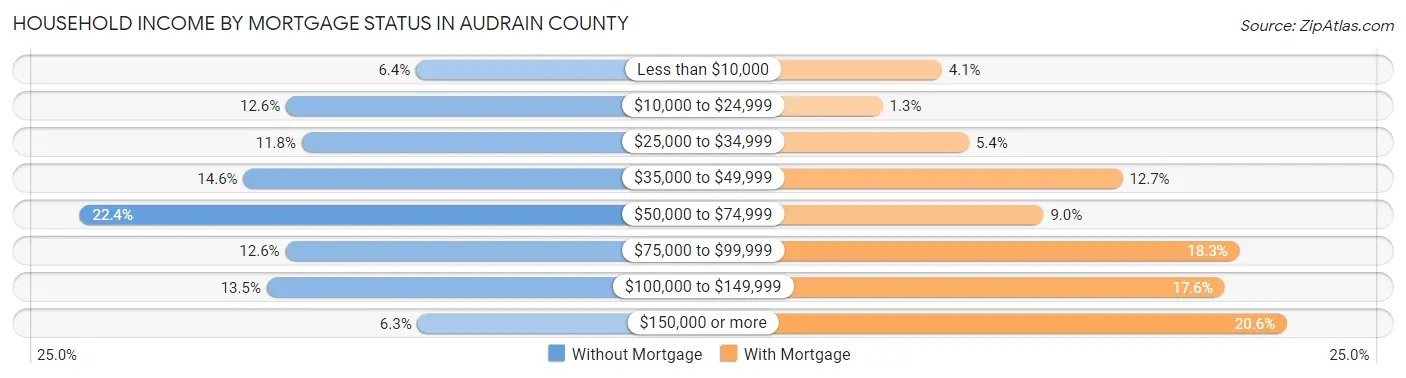
| Household Income | Without Mortgage | With Mortgage |
| Less than $10,000 | 194 (6.4%) | 140 (4.1%) |
| $10,000 to $24,999 | 383 (12.6%) | 44 (1.3%) |
| $25,000 to $34,999 | 360 (11.8%) | 184 (5.4%) |
| $35,000 to $49,999 | 445 (14.6%) | 433 (12.7%) |
| $50,000 to $74,999 | 683 (22.4%) | 305 (8.9%) |
| $75,000 to $99,999 | 384 (12.6%) | 623 (18.3%) |
| $100,000 to $149,999 | 411 (13.5%) | 599 (17.6%) |
| $150,000 or more | 192 (6.3%) | 700 (20.5%) |
| Total | 3,052 (100.0%) | 3,407 (100.0%) |
Property Value to Household Income Ratio in Audrain County
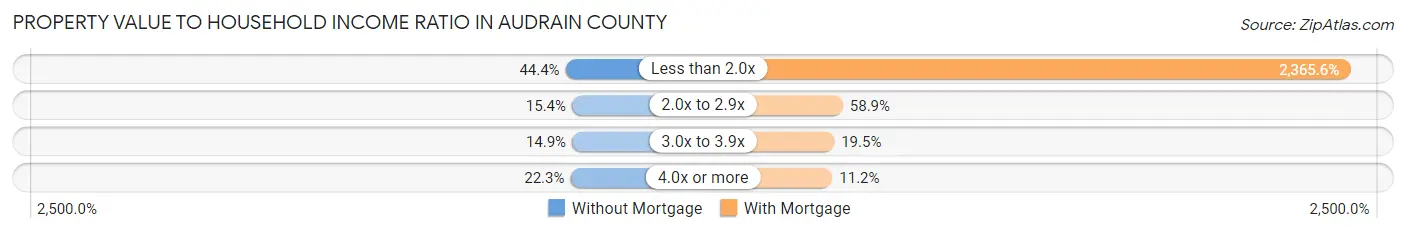
| Value-to-Income Ratio | Without Mortgage | With Mortgage |
| Less than 2.0x | 1,356 (44.4%) | 80,597 (2,365.6%) |
| 2.0x to 2.9x | 470 (15.4%) | 2,006 (58.9%) |
| 3.0x to 3.9x | 455 (14.9%) | 665 (19.5%) |
| 4.0x or more | 679 (22.3%) | 380 (11.2%) |
| Total | 3,052 (100.0%) | 3,407 (100.0%) |
Real Estate Taxes by Mortgage Status in Audrain County
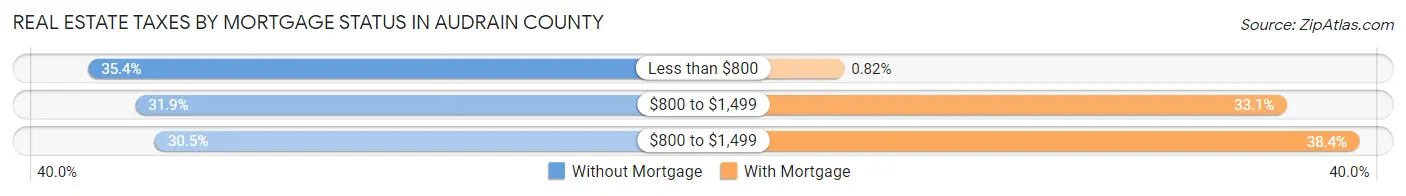
| Property Taxes | Without Mortgage | With Mortgage |
| Less than $800 | 1,079 (35.3%) | 28 (0.8%) |
| $800 to $1,499 | 974 (31.9%) | 1,128 (33.1%) |
| $800 to $1,499 | 930 (30.5%) | 1,309 (38.4%) |
| Total | 3,052 (100.0%) | 3,407 (100.0%) |
Health & Disability in Audrain County
Health Insurance Coverage by Age in Audrain County
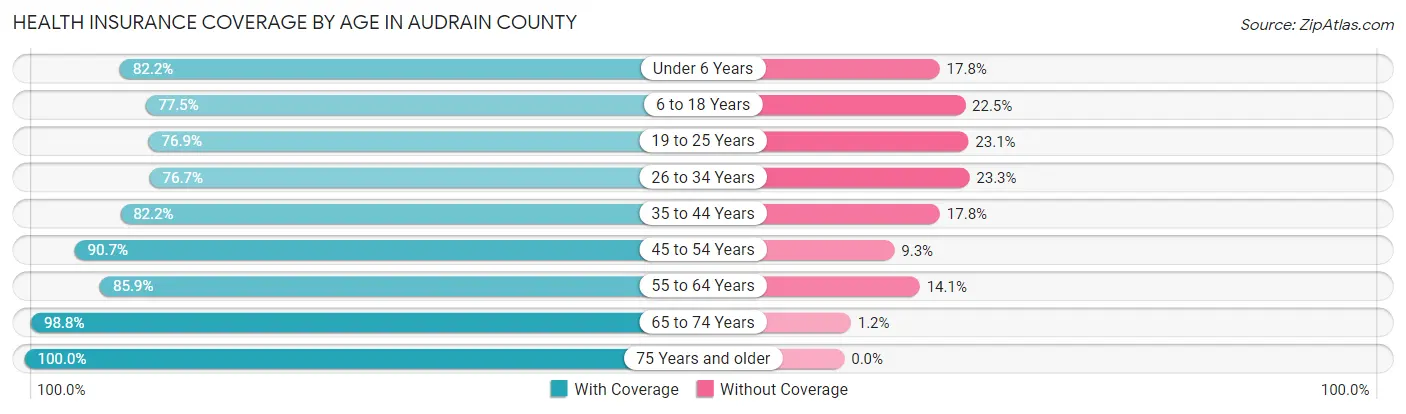
| Age Bracket | With Coverage | Without Coverage |
| Under 6 Years | 1,484 (82.2%) | 321 (17.8%) |
| 6 to 18 Years | 3,256 (77.5%) | 947 (22.5%) |
| 19 to 25 Years | 1,229 (76.9%) | 370 (23.1%) |
| 26 to 34 Years | 2,032 (76.7%) | 618 (23.3%) |
| 35 to 44 Years | 2,332 (82.2%) | 506 (17.8%) |
| 45 to 54 Years | 2,525 (90.7%) | 260 (9.3%) |
| 55 to 64 Years | 2,950 (85.9%) | 483 (14.1%) |
| 65 to 74 Years | 2,531 (98.8%) | 31 (1.2%) |
| 75 Years and older | 1,736 (100.0%) | 0 (0.0%) |
| Total | 20,075 (85.0%) | 3,536 (15.0%) |
Health Insurance Coverage by Citizenship Status in Audrain County
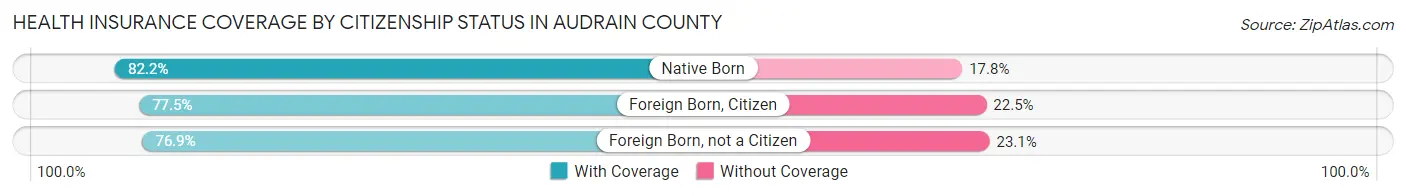
| Citizenship Status | With Coverage | Without Coverage |
| Native Born | 1,484 (82.2%) | 321 (17.8%) |
| Foreign Born, Citizen | 3,256 (77.5%) | 947 (22.5%) |
| Foreign Born, not a Citizen | 1,229 (76.9%) | 370 (23.1%) |
Health Insurance Coverage by Household Income in Audrain County
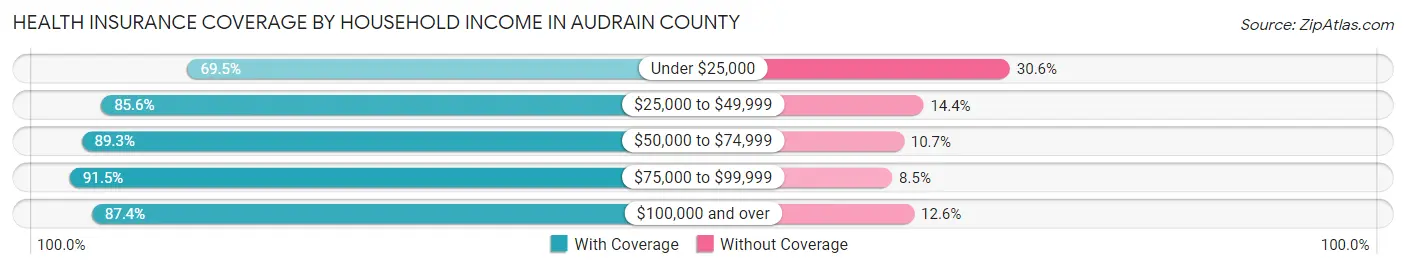
| Household Income | With Coverage | Without Coverage |
| Under $25,000 | 2,478 (69.5%) | 1,090 (30.5%) |
| $25,000 to $49,999 | 5,157 (85.6%) | 865 (14.4%) |
| $50,000 to $74,999 | 3,746 (89.3%) | 448 (10.7%) |
| $75,000 to $99,999 | 2,572 (91.5%) | 239 (8.5%) |
| $100,000 and over | 5,999 (87.4%) | 866 (12.6%) |
Public vs Private Health Insurance Coverage by Age in Audrain County
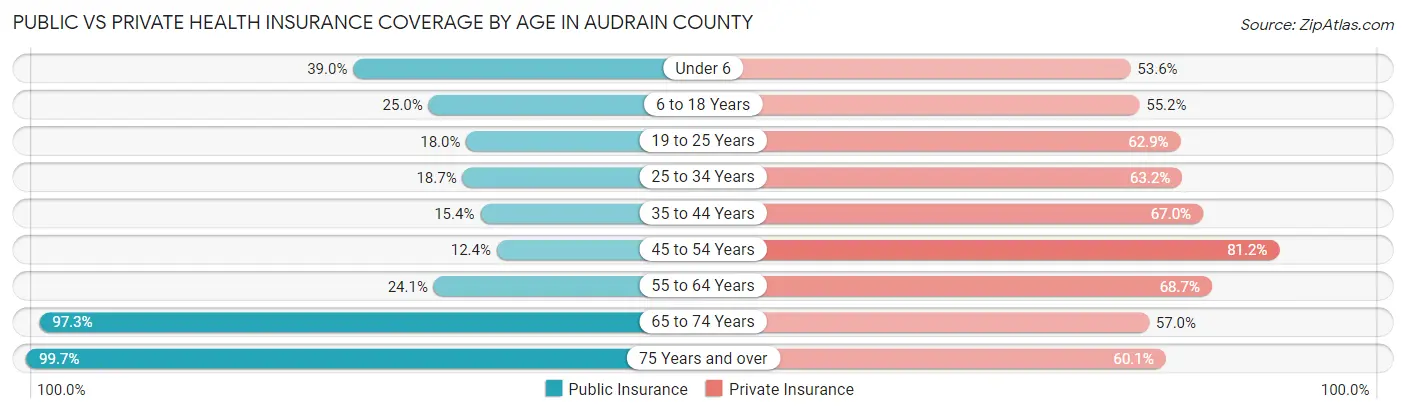
| Age Bracket | Public Insurance | Private Insurance |
| Under 6 | 704 (39.0%) | 967 (53.6%) |
| 6 to 18 Years | 1,051 (25.0%) | 2,321 (55.2%) |
| 19 to 25 Years | 288 (18.0%) | 1,005 (62.8%) |
| 25 to 34 Years | 496 (18.7%) | 1,674 (63.2%) |
| 35 to 44 Years | 438 (15.4%) | 1,902 (67.0%) |
| 45 to 54 Years | 344 (12.3%) | 2,261 (81.2%) |
| 55 to 64 Years | 826 (24.1%) | 2,357 (68.7%) |
| 65 to 74 Years | 2,492 (97.3%) | 1,460 (57.0%) |
| 75 Years and over | 1,731 (99.7%) | 1,043 (60.1%) |
| Total | 8,370 (35.4%) | 14,990 (63.5%) |
Disability Status by Sex by Age in Audrain County
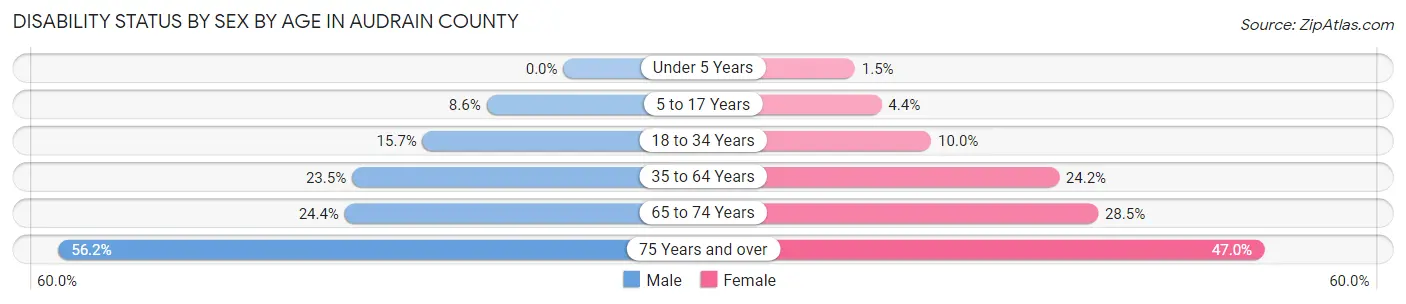
| Age Bracket | Male | Female |
| Under 5 Years | 0 (0.0%) | 10 (1.5%) |
| 5 to 17 Years | 192 (8.6%) | 80 (4.4%) |
| 18 to 34 Years | 321 (15.7%) | 259 (10.0%) |
| 35 to 64 Years | 1,010 (23.5%) | 1,152 (24.2%) |
| 65 to 74 Years | 291 (24.3%) | 390 (28.5%) |
| 75 Years and over | 365 (56.2%) | 511 (47.0%) |
Disability Class by Sex by Age in Audrain County
Disability Class: Hearing Difficulty

| Age Bracket | Male | Female |
| Under 5 Years | 0 (0.0%) | 0 (0.0%) |
| 5 to 17 Years | 2 (0.1%) | 0 (0.0%) |
| 18 to 34 Years | 0 (0.0%) | 0 (0.0%) |
| 35 to 64 Years | 120 (2.8%) | 135 (2.8%) |
| 65 to 74 Years | 140 (11.7%) | 153 (11.2%) |
| 75 Years and over | 253 (39.0%) | 126 (11.6%) |
Disability Class: Vision Difficulty
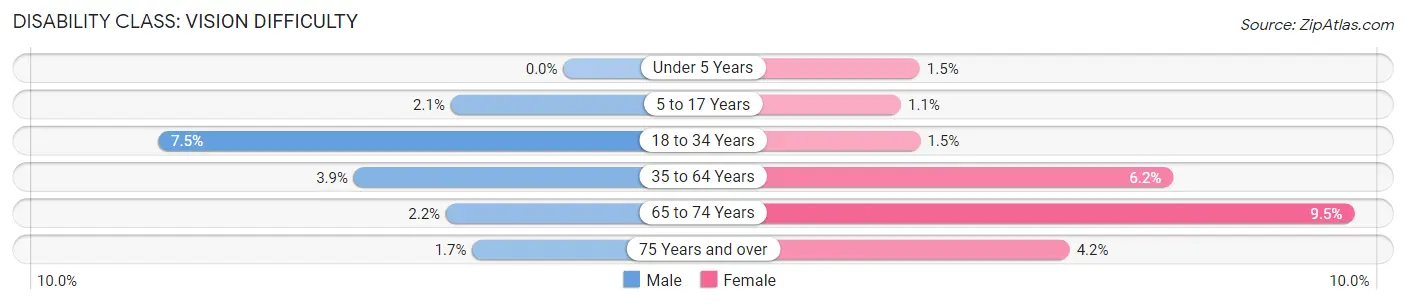
| Age Bracket | Male | Female |
| Under 5 Years | 0 (0.0%) | 10 (1.5%) |
| 5 to 17 Years | 47 (2.1%) | 20 (1.1%) |
| 18 to 34 Years | 154 (7.5%) | 38 (1.5%) |
| 35 to 64 Years | 167 (3.9%) | 293 (6.1%) |
| 65 to 74 Years | 26 (2.2%) | 130 (9.5%) |
| 75 Years and over | 11 (1.7%) | 46 (4.2%) |
Disability Class: Cognitive Difficulty
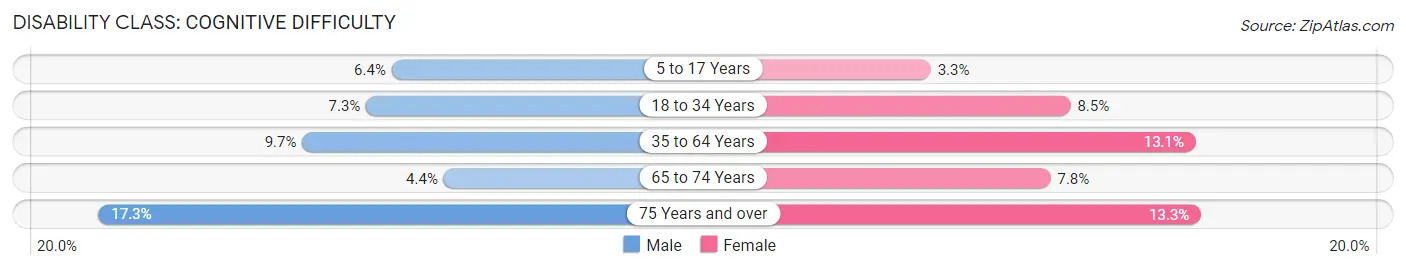
| Age Bracket | Male | Female |
| 5 to 17 Years | 143 (6.4%) | 60 (3.3%) |
| 18 to 34 Years | 150 (7.3%) | 221 (8.5%) |
| 35 to 64 Years | 416 (9.7%) | 626 (13.1%) |
| 65 to 74 Years | 53 (4.4%) | 106 (7.7%) |
| 75 Years and over | 112 (17.3%) | 145 (13.3%) |
Disability Class: Ambulatory Difficulty
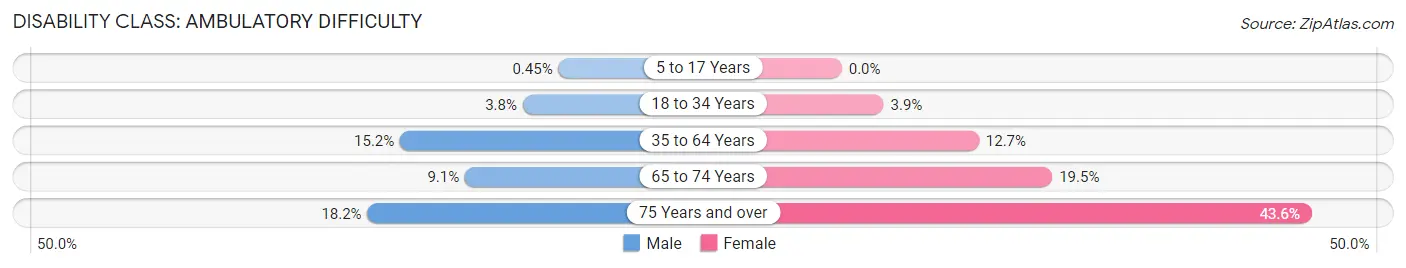
| Age Bracket | Male | Female |
| 5 to 17 Years | 10 (0.4%) | 0 (0.0%) |
| 18 to 34 Years | 77 (3.8%) | 101 (3.9%) |
| 35 to 64 Years | 650 (15.1%) | 606 (12.7%) |
| 65 to 74 Years | 109 (9.1%) | 267 (19.5%) |
| 75 Years and over | 118 (18.2%) | 474 (43.6%) |
Disability Class: Self-Care Difficulty
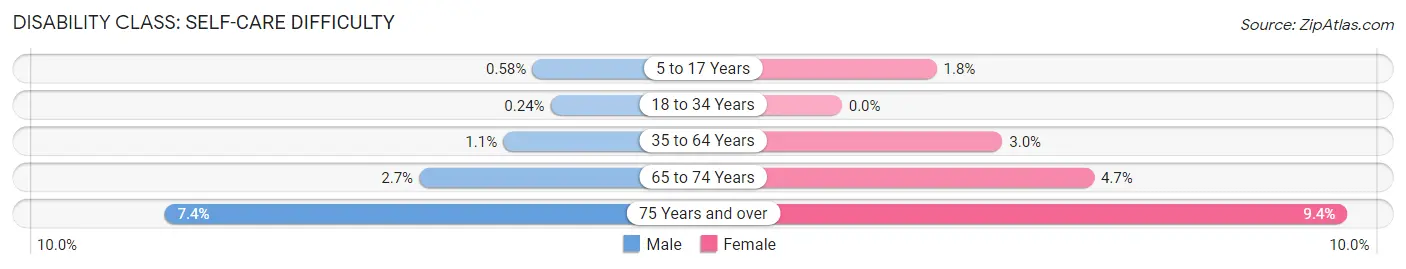
| Age Bracket | Male | Female |
| 5 to 17 Years | 13 (0.6%) | 32 (1.8%) |
| 18 to 34 Years | 5 (0.2%) | 0 (0.0%) |
| 35 to 64 Years | 48 (1.1%) | 142 (3.0%) |
| 65 to 74 Years | 32 (2.7%) | 64 (4.7%) |
| 75 Years and over | 48 (7.4%) | 102 (9.4%) |
Technology Access in Audrain County
Computing Device Access in Audrain County
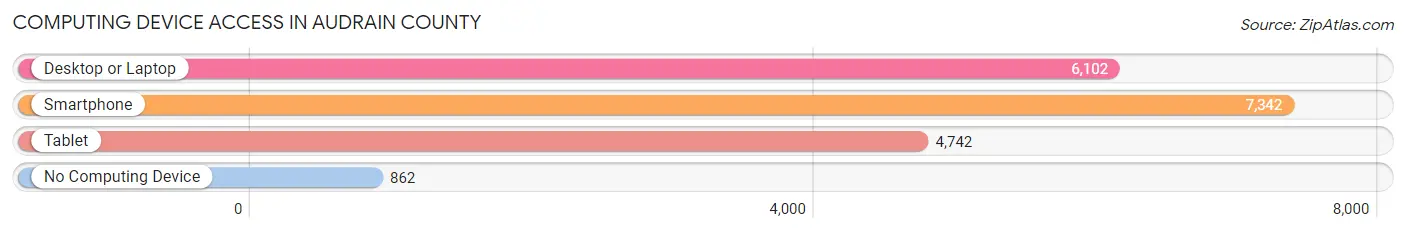
| Device Type | # Households | % Households |
| Desktop or Laptop | 6,102 | 68.0% |
| Smartphone | 7,342 | 81.9% |
| Tablet | 4,742 | 52.9% |
| No Computing Device | 862 | 9.6% |
| Total | 8,968 | 100.0% |
Internet Access in Audrain County
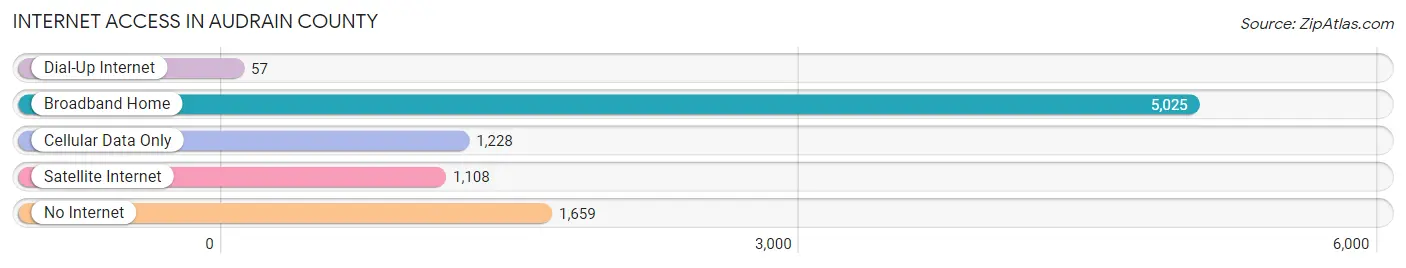
| Internet Type | # Households | % Households |
| Dial-Up Internet | 57 | 0.6% |
| Broadband Home | 5,025 | 56.0% |
| Cellular Data Only | 1,228 | 13.7% |
| Satellite Internet | 1,108 | 12.4% |
| No Internet | 1,659 | 18.5% |
| Total | 8,968 | 100.0% |
Audrain County Summary
Audrain County is located in the central part of Missouri, in the United States. It is bordered by Montgomery County to the north, Callaway County to the east, Boone County to the south, and Montgomery and Montgomery Counties to the west. The county seat is Mexico, and the largest city is Vandalia. The county was established in 1836 and named after Colonel James Hunter Audrain, a veteran of the War of 1812.
Geography
Audrain County covers an area of 576 square miles, of which 574 square miles is land and 2 square miles is water. The county is located in the Ozark Plateau region of Missouri, and is characterized by rolling hills and valleys. The highest point in the county is located in the northwest corner, at an elevation of 1,068 feet. The county is drained by the South Fork of the Salt River, which flows through the center of the county.
The climate of Audrain County is humid continental, with hot, humid summers and cold, dry winters. The average annual temperature is 54°F, and the average annual precipitation is 40 inches.
Demographics
As of the 2010 United States Census, there were 25,529 people, 10,093 households, and 6,945 families living in Audrain County. The population density was 44.3 people per square mile. The racial makeup of the county was 92.2% White, 4.3% Black or African American, 0.4% Native American, 0.3% Asian, 0.1% Pacific Islander, 0.7% from other races, and 1.9% from two or more races. Hispanic or Latino of any race were 2.2% of the population.
The median income for a household in the county was $37,945, and the median income for a family was $45,945. The per capita income for the county was $19,845. About 11.2% of families and 14.2% of the population were below the poverty line, including 19.2% of those under age 18 and 10.2% of those age 65 or over.
Economy
The economy of Audrain County is largely based on agriculture. The county is home to a variety of crops, including corn, soybeans, wheat, hay, and oats. Livestock production is also important, with cattle, hogs, and poultry being the main animals raised.
Manufacturing is also an important part of the economy, with companies such as Mexico Manufacturing, Inc., and Vandalia Manufacturing, Inc., producing a variety of products. The county is also home to several small businesses, including restaurants, retail stores, and service providers.
The county is served by two major highways, Interstate 70 and U.S. Route 54. The county is also served by the Mexico Municipal Airport, which provides general aviation services.
Conclusion
Audrain County is a rural county located in the central part of Missouri. It is characterized by rolling hills and valleys, and is home to a variety of crops and livestock. The economy of the county is largely based on agriculture, manufacturing, and small businesses. The county is served by two major highways and the Mexico Municipal Airport.
Common Questions
What is Per Capita Income in Audrain County?
Per Capita income in Audrain County is $27,133.
What is the Median Family Income in Audrain County?
Median Family Income in Audrain County is $63,310.
What is the Median Household income in Audrain County?
Median Household Income in Audrain County is $51,745.
What is Income or Wage Gap in Audrain County?
Income or Wage Gap in Audrain County is 30.4%.
Women in Audrain County earn 69.6 cents for every dollar earned by a man.
What is Family Income Deficit in Audrain County?
Family Income Deficit in Audrain County is $13,454.
Families that are below poverty line in Audrain County earn $13,454 less on average than the poverty threshold level.
What is Inequality or Gini Index in Audrain County?
Inequality or Gini Index in Audrain County is 0.44.
What is the Total Population of Audrain County?
Total Population of Audrain County is 24,873.
What is the Total Male Population of Audrain County?
Total Male Population of Audrain County is 11,771.
What is the Total Female Population of Audrain County?
Total Female Population of Audrain County is 13,102.
What is the Ratio of Males per 100 Females in Audrain County?
There are 89.84 Males per 100 Females in Audrain County.
What is the Ratio of Females per 100 Males in Audrain County?
There are 111.31 Females per 100 Males in Audrain County.
What is the Median Population Age in Audrain County?
Median Population Age in Audrain County is 40.4 Years.
What is the Average Family Size in Audrain County
Average Family Size in Audrain County is 3.3 People.
What is the Average Household Size in Audrain County
Average Household Size in Audrain County is 2.6 People.
How Large is the Labor Force in Audrain County?
There are 11,544 People in the Labor Forcein in Audrain County.
What is the Percentage of People in the Labor Force in Audrain County?
57.9% of People are in the Labor Force in Audrain County.
What is the Unemployment Rate in Audrain County?
Unemployment Rate in Audrain County is 3.9%.