Tohono O'odham vs Immigrants from Sudan Self-Care Disability
COMPARE
Tohono O'odham
Immigrants from Sudan
Self-Care Disability
Self-Care Disability Comparison
Tohono O'odham
Immigrants from Sudan
3.1%
SELF-CARE DISABILITY
0.0/ 100
METRIC RATING
343rd/ 347
METRIC RANK
2.3%
SELF-CARE DISABILITY
99.8/ 100
METRIC RATING
41st/ 347
METRIC RANK
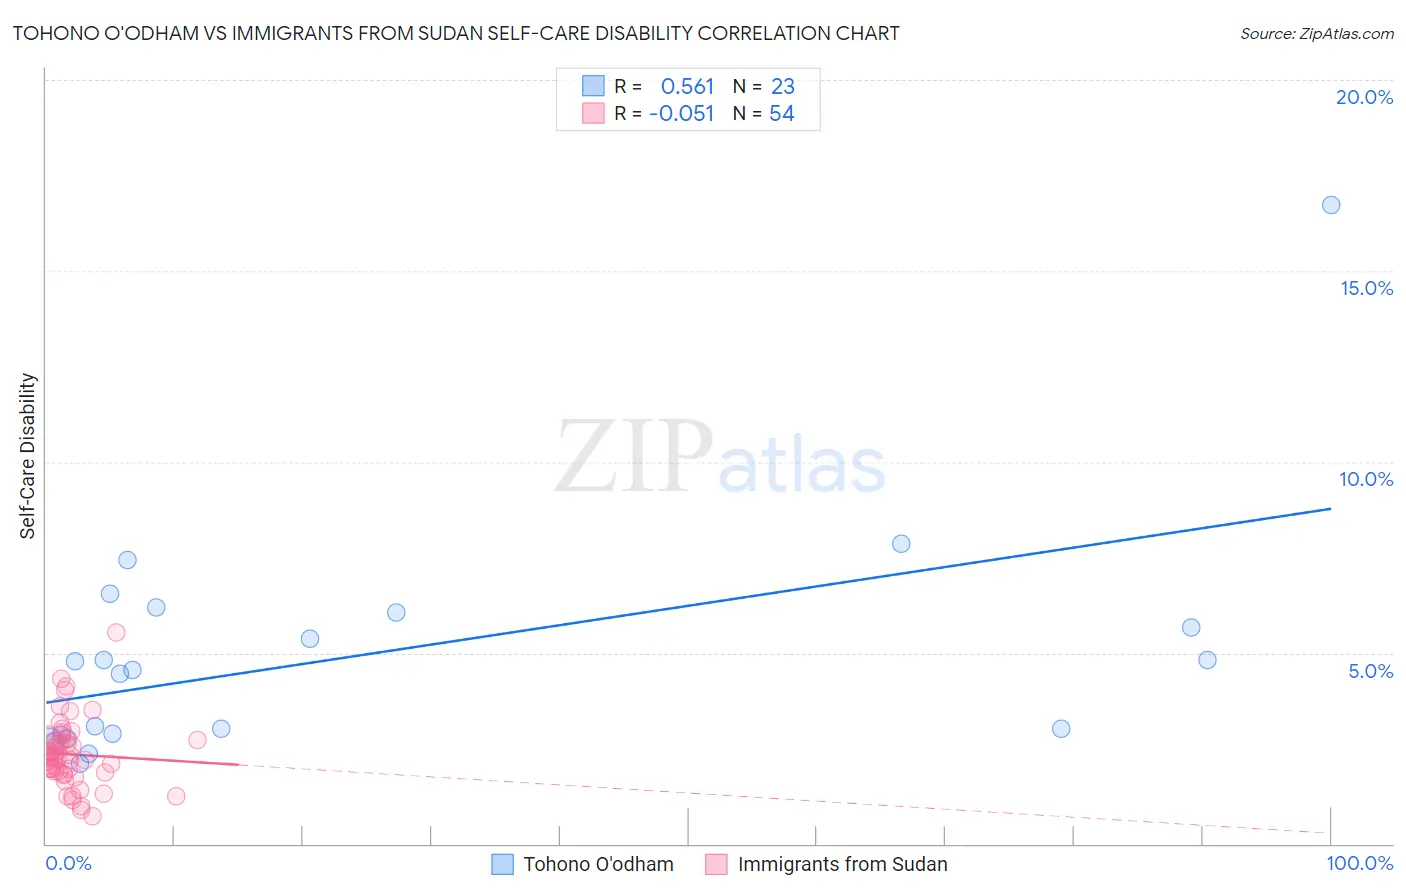
Tohono O'odham vs Immigrants from Sudan Self-Care Disability Correlation Chart
The statistical analysis conducted on geographies consisting of 58,708,856 people shows a substantial positive correlation between the proportion of Tohono O'odham and percentage of population with self-care disability in the United States with a correlation coefficient (R) of 0.561 and weighted average of 3.1%. Similarly, the statistical analysis conducted on geographies consisting of 118,937,078 people shows a slight negative correlation between the proportion of Immigrants from Sudan and percentage of population with self-care disability in the United States with a correlation coefficient (R) of -0.051 and weighted average of 2.3%, a difference of 36.7%.
Self-Care Disability Correlation Summary
| Measurement | Tohono O'odham | Immigrants from Sudan |
| Minimum | 2.1% | 0.73% |
| Maximum | 16.7% | 5.5% |
| Range | 14.6% | 4.8% |
| Mean | 4.9% | 2.3% |
| Median | 4.5% | 2.2% |
| Interquartile 25% (IQ1) | 2.9% | 1.9% |
| Interquartile 75% (IQ3) | 6.1% | 2.6% |
| Interquartile Range (IQR) | 3.2% | 0.77% |
| Standard Deviation (Sample) | 3.1% | 0.91% |
| Standard Deviation (Population) | 3.0% | 0.90% |
Similar Demographics by Self-Care Disability
Demographics Similar to Tohono O'odham by Self-Care Disability
In terms of self-care disability, the demographic groups most similar to Tohono O'odham are Colville (3.1%, a difference of 0.11%), Dominican (3.1%, a difference of 1.7%), Immigrants from Cabo Verde (3.1%, a difference of 2.0%), Immigrants from Dominican Republic (3.0%, a difference of 2.3%), and Cape Verdean (3.0%, a difference of 2.7%).
| Demographics | Rating | Rank | Self-Care Disability |
| Dutch West Indians | 0.0 /100 | #333 | Tragic 3.0% |
| Houma | 0.0 /100 | #334 | Tragic 3.0% |
| Immigrants | Azores | 0.0 /100 | #335 | Tragic 3.0% |
| Immigrants | Yemen | 0.0 /100 | #336 | Tragic 3.0% |
| Choctaw | 0.0 /100 | #337 | Tragic 3.0% |
| Cape Verdeans | 0.0 /100 | #338 | Tragic 3.0% |
| Immigrants | Dominican Republic | 0.0 /100 | #339 | Tragic 3.0% |
| Immigrants | Cabo Verde | 0.0 /100 | #340 | Tragic 3.1% |
| Dominicans | 0.0 /100 | #341 | Tragic 3.1% |
| Colville | 0.0 /100 | #342 | Tragic 3.1% |
| Tohono O'odham | 0.0 /100 | #343 | Tragic 3.1% |
| Pueblo | 0.0 /100 | #344 | Tragic 3.3% |
| Armenians | 0.0 /100 | #345 | Tragic 3.4% |
| Puerto Ricans | 0.0 /100 | #346 | Tragic 3.7% |
| Immigrants | Armenia | 0.0 /100 | #347 | Tragic 4.2% |
Demographics Similar to Immigrants from Sudan by Self-Care Disability
In terms of self-care disability, the demographic groups most similar to Immigrants from Sudan are Iranian (2.3%, a difference of 0.070%), Immigrants from Uganda (2.3%, a difference of 0.10%), Immigrants from Bulgaria (2.3%, a difference of 0.11%), Immigrants from Pakistan (2.3%, a difference of 0.14%), and Immigrants from South Africa (2.3%, a difference of 0.19%).
| Demographics | Rating | Rank | Self-Care Disability |
| Immigrants | Turkey | 99.9 /100 | #34 | Exceptional 2.3% |
| Immigrants | Australia | 99.9 /100 | #35 | Exceptional 2.3% |
| Immigrants | Lithuania | 99.9 /100 | #36 | Exceptional 2.3% |
| Immigrants | Sweden | 99.9 /100 | #37 | Exceptional 2.3% |
| Immigrants | Eastern Africa | 99.9 /100 | #38 | Exceptional 2.3% |
| Immigrants | Bulgaria | 99.8 /100 | #39 | Exceptional 2.3% |
| Iranians | 99.8 /100 | #40 | Exceptional 2.3% |
| Immigrants | Sudan | 99.8 /100 | #41 | Exceptional 2.3% |
| Immigrants | Uganda | 99.8 /100 | #42 | Exceptional 2.3% |
| Immigrants | Pakistan | 99.8 /100 | #43 | Exceptional 2.3% |
| Immigrants | South Africa | 99.8 /100 | #44 | Exceptional 2.3% |
| Norwegians | 99.8 /100 | #45 | Exceptional 2.3% |
| Czechs | 99.8 /100 | #46 | Exceptional 2.3% |
| Jordanians | 99.7 /100 | #47 | Exceptional 2.3% |
| Immigrants | Malaysia | 99.7 /100 | #48 | Exceptional 2.3% |