Immigrants from Nicaragua vs Tohono O'odham Self-Care Disability
COMPARE
Immigrants from Nicaragua
Tohono O'odham
Self-Care Disability
Self-Care Disability Comparison
Immigrants from Nicaragua
Tohono O'odham
2.7%
SELF-CARE DISABILITY
0.2/ 100
METRIC RATING
265th/ 347
METRIC RANK
3.1%
SELF-CARE DISABILITY
0.0/ 100
METRIC RATING
343rd/ 347
METRIC RANK
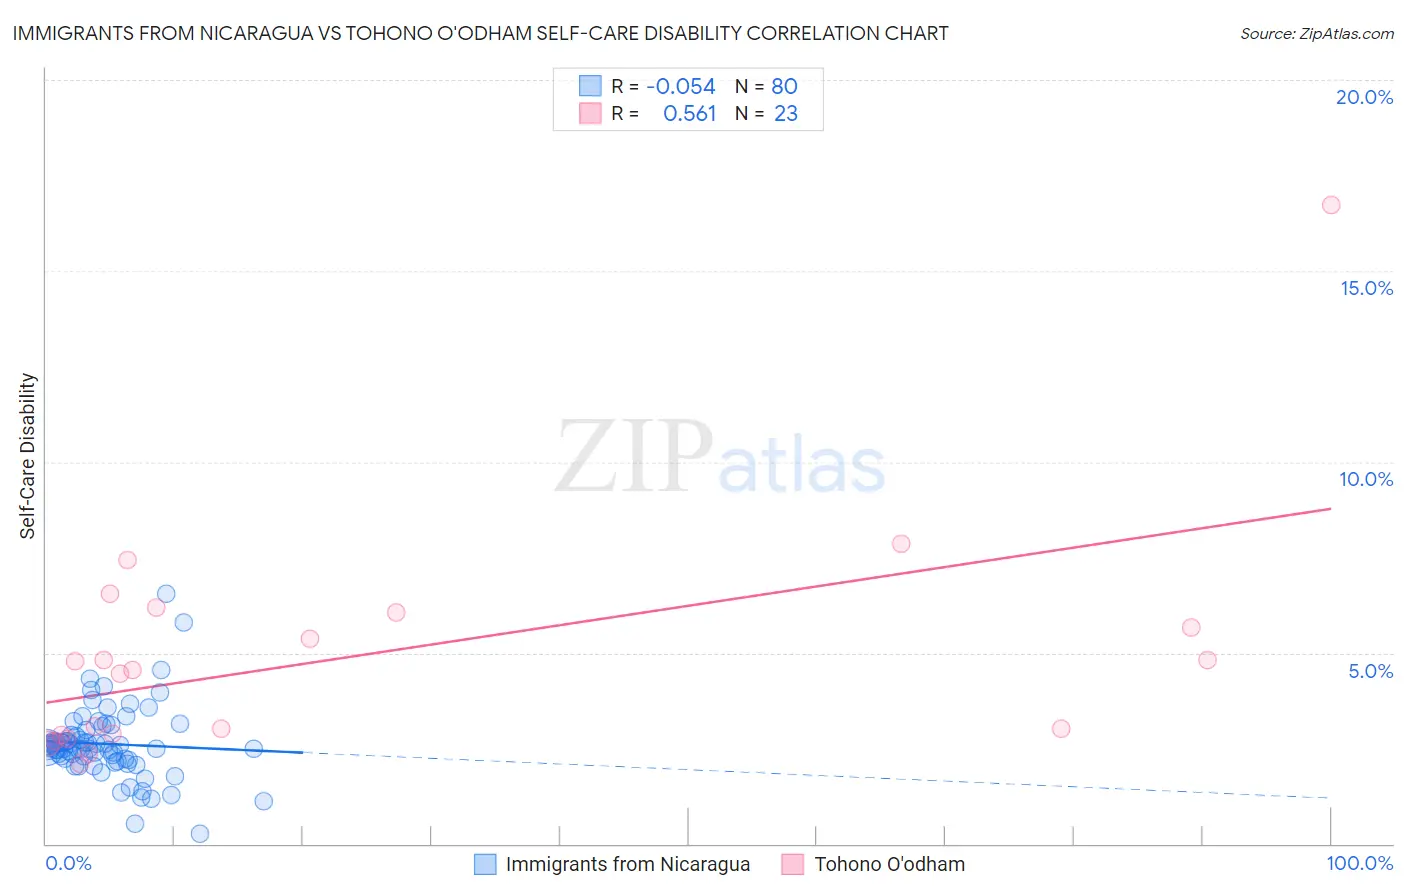
Immigrants from Nicaragua vs Tohono O'odham Self-Care Disability Correlation Chart
The statistical analysis conducted on geographies consisting of 236,309,405 people shows a slight negative correlation between the proportion of Immigrants from Nicaragua and percentage of population with self-care disability in the United States with a correlation coefficient (R) of -0.054 and weighted average of 2.7%. Similarly, the statistical analysis conducted on geographies consisting of 58,708,856 people shows a substantial positive correlation between the proportion of Tohono O'odham and percentage of population with self-care disability in the United States with a correlation coefficient (R) of 0.561 and weighted average of 3.1%, a difference of 17.3%.
Self-Care Disability Correlation Summary
| Measurement | Immigrants from Nicaragua | Tohono O'odham |
| Minimum | 0.27% | 2.1% |
| Maximum | 6.5% | 16.7% |
| Range | 6.3% | 14.6% |
| Mean | 2.6% | 4.9% |
| Median | 2.5% | 4.5% |
| Interquartile 25% (IQ1) | 2.2% | 2.9% |
| Interquartile 75% (IQ3) | 2.9% | 6.1% |
| Interquartile Range (IQR) | 0.71% | 3.2% |
| Standard Deviation (Sample) | 0.96% | 3.1% |
| Standard Deviation (Population) | 0.96% | 3.0% |
Similar Demographics by Self-Care Disability
Demographics Similar to Immigrants from Nicaragua by Self-Care Disability
In terms of self-care disability, the demographic groups most similar to Immigrants from Nicaragua are Immigrants from Cambodia (2.7%, a difference of 0.050%), Immigrants from Iran (2.7%, a difference of 0.16%), Immigrants from Latin America (2.7%, a difference of 0.22%), Yaqui (2.7%, a difference of 0.25%), and Shoshone (2.7%, a difference of 0.29%).
| Demographics | Rating | Rank | Self-Care Disability |
| Immigrants | Nonimmigrants | 0.3 /100 | #258 | Tragic 2.6% |
| Immigrants | Belarus | 0.2 /100 | #259 | Tragic 2.6% |
| Chippewa | 0.2 /100 | #260 | Tragic 2.6% |
| Arapaho | 0.2 /100 | #261 | Tragic 2.6% |
| Shoshone | 0.2 /100 | #262 | Tragic 2.7% |
| Immigrants | Latin America | 0.2 /100 | #263 | Tragic 2.7% |
| Immigrants | Iran | 0.2 /100 | #264 | Tragic 2.7% |
| Immigrants | Nicaragua | 0.2 /100 | #265 | Tragic 2.7% |
| Immigrants | Cambodia | 0.1 /100 | #266 | Tragic 2.7% |
| Yaqui | 0.1 /100 | #267 | Tragic 2.7% |
| Immigrants | Mexico | 0.1 /100 | #268 | Tragic 2.7% |
| U.S. Virgin Islanders | 0.1 /100 | #269 | Tragic 2.7% |
| Immigrants | Micronesia | 0.1 /100 | #270 | Tragic 2.7% |
| Trinidadians and Tobagonians | 0.1 /100 | #271 | Tragic 2.7% |
| Immigrants | Laos | 0.1 /100 | #272 | Tragic 2.7% |
Demographics Similar to Tohono O'odham by Self-Care Disability
In terms of self-care disability, the demographic groups most similar to Tohono O'odham are Colville (3.1%, a difference of 0.11%), Dominican (3.1%, a difference of 1.7%), Immigrants from Cabo Verde (3.1%, a difference of 2.0%), Immigrants from Dominican Republic (3.0%, a difference of 2.3%), and Cape Verdean (3.0%, a difference of 2.7%).
| Demographics | Rating | Rank | Self-Care Disability |
| Dutch West Indians | 0.0 /100 | #333 | Tragic 3.0% |
| Houma | 0.0 /100 | #334 | Tragic 3.0% |
| Immigrants | Azores | 0.0 /100 | #335 | Tragic 3.0% |
| Immigrants | Yemen | 0.0 /100 | #336 | Tragic 3.0% |
| Choctaw | 0.0 /100 | #337 | Tragic 3.0% |
| Cape Verdeans | 0.0 /100 | #338 | Tragic 3.0% |
| Immigrants | Dominican Republic | 0.0 /100 | #339 | Tragic 3.0% |
| Immigrants | Cabo Verde | 0.0 /100 | #340 | Tragic 3.1% |
| Dominicans | 0.0 /100 | #341 | Tragic 3.1% |
| Colville | 0.0 /100 | #342 | Tragic 3.1% |
| Tohono O'odham | 0.0 /100 | #343 | Tragic 3.1% |
| Pueblo | 0.0 /100 | #344 | Tragic 3.3% |
| Armenians | 0.0 /100 | #345 | Tragic 3.4% |
| Puerto Ricans | 0.0 /100 | #346 | Tragic 3.7% |
| Immigrants | Armenia | 0.0 /100 | #347 | Tragic 4.2% |