Immigrants from Canada vs Palestinian Self-Care Disability
COMPARE
Immigrants from Canada
Palestinian
Self-Care Disability
Self-Care Disability Comparison
Immigrants from Canada
Palestinians
2.4%
SELF-CARE DISABILITY
92.0/ 100
METRIC RATING
118th/ 347
METRIC RANK
2.3%
SELF-CARE DISABILITY
99.4/ 100
METRIC RATING
61st/ 347
METRIC RANK
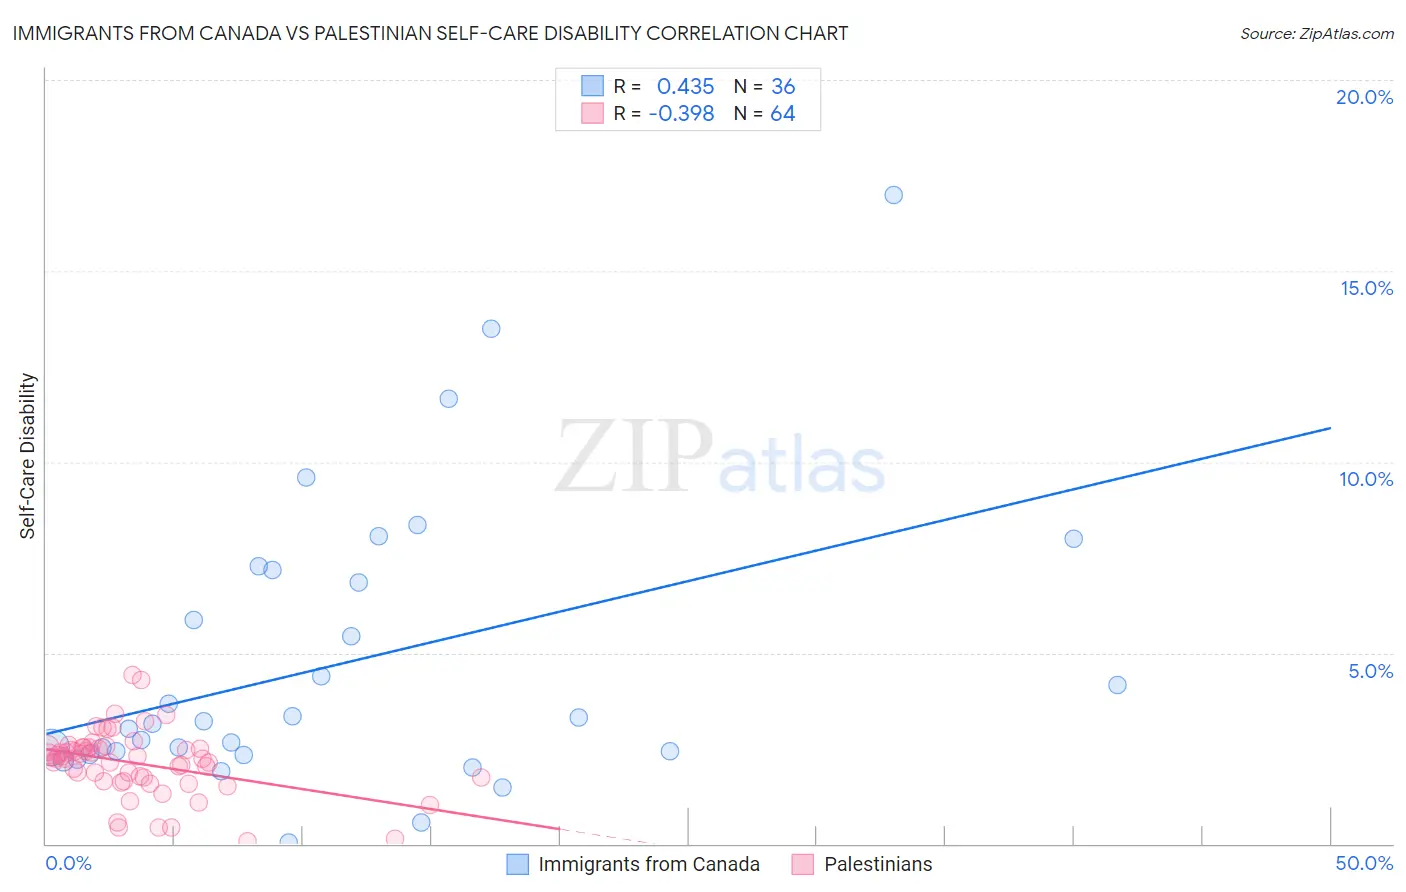
Immigrants from Canada vs Palestinian Self-Care Disability Correlation Chart
The statistical analysis conducted on geographies consisting of 458,661,407 people shows a moderate positive correlation between the proportion of Immigrants from Canada and percentage of population with self-care disability in the United States with a correlation coefficient (R) of 0.435 and weighted average of 2.4%. Similarly, the statistical analysis conducted on geographies consisting of 216,359,093 people shows a mild negative correlation between the proportion of Palestinians and percentage of population with self-care disability in the United States with a correlation coefficient (R) of -0.398 and weighted average of 2.3%, a difference of 3.5%.
Self-Care Disability Correlation Summary
| Measurement | Immigrants from Canada | Palestinian |
| Minimum | 0.045% | 0.076% |
| Maximum | 17.0% | 4.4% |
| Range | 17.0% | 4.3% |
| Mean | 4.7% | 2.1% |
| Median | 3.2% | 2.3% |
| Interquartile 25% (IQ1) | 2.4% | 1.7% |
| Interquartile 75% (IQ3) | 7.0% | 2.5% |
| Interquartile Range (IQR) | 4.6% | 0.83% |
| Standard Deviation (Sample) | 3.7% | 0.86% |
| Standard Deviation (Population) | 3.7% | 0.85% |
Similar Demographics by Self-Care Disability
Demographics Similar to Immigrants from Canada by Self-Care Disability
In terms of self-care disability, the demographic groups most similar to Immigrants from Canada are Immigrants from Sierra Leone (2.4%, a difference of 0.030%), Uruguayan (2.4%, a difference of 0.080%), Taiwanese (2.4%, a difference of 0.090%), Peruvian (2.4%, a difference of 0.11%), and Northern European (2.4%, a difference of 0.15%).
| Demographics | Rating | Rank | Self-Care Disability |
| Serbians | 93.6 /100 | #111 | Exceptional 2.4% |
| Scandinavians | 93.5 /100 | #112 | Exceptional 2.4% |
| South Americans | 93.2 /100 | #113 | Exceptional 2.4% |
| Immigrants | North Macedonia | 93.1 /100 | #114 | Exceptional 2.4% |
| Immigrants | Hong Kong | 93.1 /100 | #115 | Exceptional 2.4% |
| Northern Europeans | 92.9 /100 | #116 | Exceptional 2.4% |
| Taiwanese | 92.5 /100 | #117 | Exceptional 2.4% |
| Immigrants | Canada | 92.0 /100 | #118 | Exceptional 2.4% |
| Immigrants | Sierra Leone | 91.8 /100 | #119 | Exceptional 2.4% |
| Uruguayans | 91.5 /100 | #120 | Exceptional 2.4% |
| Peruvians | 91.3 /100 | #121 | Exceptional 2.4% |
| Belgians | 90.9 /100 | #122 | Exceptional 2.4% |
| Immigrants | Nigeria | 90.3 /100 | #123 | Exceptional 2.4% |
| Immigrants | North America | 90.2 /100 | #124 | Exceptional 2.4% |
| Immigrants | Morocco | 90.2 /100 | #124 | Exceptional 2.4% |
Demographics Similar to Palestinians by Self-Care Disability
In terms of self-care disability, the demographic groups most similar to Palestinians are Egyptian (2.3%, a difference of 0.090%), Immigrants from Japan (2.3%, a difference of 0.10%), Mongolian (2.3%, a difference of 0.18%), Swedish (2.3%, a difference of 0.18%), and New Zealander (2.3%, a difference of 0.24%).
| Demographics | Rating | Rank | Self-Care Disability |
| Argentineans | 99.6 /100 | #54 | Exceptional 2.3% |
| Immigrants | France | 99.6 /100 | #55 | Exceptional 2.3% |
| Immigrants | Eastern Asia | 99.6 /100 | #56 | Exceptional 2.3% |
| Immigrants | Belgium | 99.6 /100 | #57 | Exceptional 2.3% |
| Immigrants | Cameroon | 99.6 /100 | #58 | Exceptional 2.3% |
| New Zealanders | 99.5 /100 | #59 | Exceptional 2.3% |
| Immigrants | Japan | 99.5 /100 | #60 | Exceptional 2.3% |
| Palestinians | 99.4 /100 | #61 | Exceptional 2.3% |
| Egyptians | 99.4 /100 | #62 | Exceptional 2.3% |
| Mongolians | 99.3 /100 | #63 | Exceptional 2.3% |
| Swedes | 99.3 /100 | #64 | Exceptional 2.3% |
| Brazilians | 99.3 /100 | #65 | Exceptional 2.3% |
| Immigrants | Argentina | 99.3 /100 | #66 | Exceptional 2.3% |
| South Africans | 99.3 /100 | #67 | Exceptional 2.3% |
| Immigrants | Zaire | 99.2 /100 | #68 | Exceptional 2.3% |