Immigrants from Canada vs Chippewa Self-Care Disability
COMPARE
Immigrants from Canada
Chippewa
Self-Care Disability
Self-Care Disability Comparison
Immigrants from Canada
Chippewa
2.4%
SELF-CARE DISABILITY
92.0/ 100
METRIC RATING
118th/ 347
METRIC RANK
2.6%
SELF-CARE DISABILITY
0.2/ 100
METRIC RATING
260th/ 347
METRIC RANK
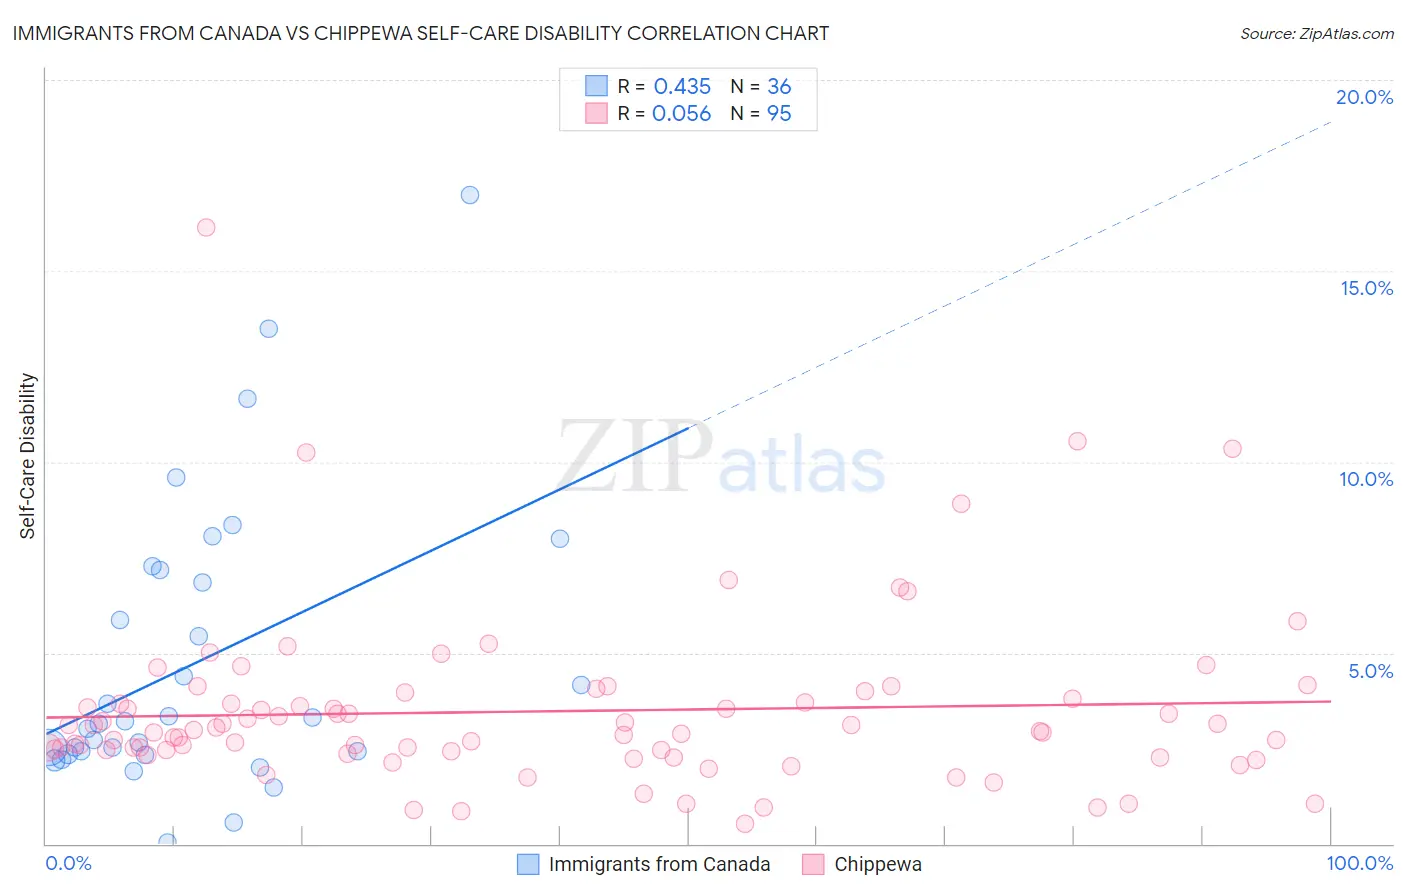
Immigrants from Canada vs Chippewa Self-Care Disability Correlation Chart
The statistical analysis conducted on geographies consisting of 458,661,407 people shows a moderate positive correlation between the proportion of Immigrants from Canada and percentage of population with self-care disability in the United States with a correlation coefficient (R) of 0.435 and weighted average of 2.4%. Similarly, the statistical analysis conducted on geographies consisting of 214,880,520 people shows a slight positive correlation between the proportion of Chippewa and percentage of population with self-care disability in the United States with a correlation coefficient (R) of 0.056 and weighted average of 2.6%, a difference of 10.4%.
Self-Care Disability Correlation Summary
| Measurement | Immigrants from Canada | Chippewa |
| Minimum | 0.045% | 0.52% |
| Maximum | 17.0% | 16.1% |
| Range | 17.0% | 15.6% |
| Mean | 4.7% | 3.5% |
| Median | 3.2% | 2.9% |
| Interquartile 25% (IQ1) | 2.4% | 2.4% |
| Interquartile 75% (IQ3) | 7.0% | 3.8% |
| Interquartile Range (IQR) | 4.6% | 1.4% |
| Standard Deviation (Sample) | 3.7% | 2.3% |
| Standard Deviation (Population) | 3.7% | 2.3% |
Similar Demographics by Self-Care Disability
Demographics Similar to Immigrants from Canada by Self-Care Disability
In terms of self-care disability, the demographic groups most similar to Immigrants from Canada are Immigrants from Sierra Leone (2.4%, a difference of 0.030%), Uruguayan (2.4%, a difference of 0.080%), Taiwanese (2.4%, a difference of 0.090%), Peruvian (2.4%, a difference of 0.11%), and Northern European (2.4%, a difference of 0.15%).
| Demographics | Rating | Rank | Self-Care Disability |
| Serbians | 93.6 /100 | #111 | Exceptional 2.4% |
| Scandinavians | 93.5 /100 | #112 | Exceptional 2.4% |
| South Americans | 93.2 /100 | #113 | Exceptional 2.4% |
| Immigrants | North Macedonia | 93.1 /100 | #114 | Exceptional 2.4% |
| Immigrants | Hong Kong | 93.1 /100 | #115 | Exceptional 2.4% |
| Northern Europeans | 92.9 /100 | #116 | Exceptional 2.4% |
| Taiwanese | 92.5 /100 | #117 | Exceptional 2.4% |
| Immigrants | Canada | 92.0 /100 | #118 | Exceptional 2.4% |
| Immigrants | Sierra Leone | 91.8 /100 | #119 | Exceptional 2.4% |
| Uruguayans | 91.5 /100 | #120 | Exceptional 2.4% |
| Peruvians | 91.3 /100 | #121 | Exceptional 2.4% |
| Belgians | 90.9 /100 | #122 | Exceptional 2.4% |
| Immigrants | Nigeria | 90.3 /100 | #123 | Exceptional 2.4% |
| Immigrants | North America | 90.2 /100 | #124 | Exceptional 2.4% |
| Immigrants | Morocco | 90.2 /100 | #124 | Exceptional 2.4% |
Demographics Similar to Chippewa by Self-Care Disability
In terms of self-care disability, the demographic groups most similar to Chippewa are Arapaho (2.6%, a difference of 0.020%), Immigrants from Belarus (2.6%, a difference of 0.040%), Nonimmigrants (2.6%, a difference of 0.11%), Shoshone (2.7%, a difference of 0.16%), and Potawatomi (2.6%, a difference of 0.18%).
| Demographics | Rating | Rank | Self-Care Disability |
| Immigrants | Haiti | 0.3 /100 | #253 | Tragic 2.6% |
| Haitians | 0.3 /100 | #254 | Tragic 2.6% |
| Tsimshian | 0.3 /100 | #255 | Tragic 2.6% |
| Immigrants | Central America | 0.3 /100 | #256 | Tragic 2.6% |
| Potawatomi | 0.3 /100 | #257 | Tragic 2.6% |
| Immigrants | Nonimmigrants | 0.3 /100 | #258 | Tragic 2.6% |
| Immigrants | Belarus | 0.2 /100 | #259 | Tragic 2.6% |
| Chippewa | 0.2 /100 | #260 | Tragic 2.6% |
| Arapaho | 0.2 /100 | #261 | Tragic 2.6% |
| Shoshone | 0.2 /100 | #262 | Tragic 2.7% |
| Immigrants | Latin America | 0.2 /100 | #263 | Tragic 2.7% |
| Immigrants | Iran | 0.2 /100 | #264 | Tragic 2.7% |
| Immigrants | Nicaragua | 0.2 /100 | #265 | Tragic 2.7% |
| Immigrants | Cambodia | 0.1 /100 | #266 | Tragic 2.7% |
| Yaqui | 0.1 /100 | #267 | Tragic 2.7% |