French vs Immigrants from Zaire Self-Care Disability
COMPARE
French
Immigrants from Zaire
Self-Care Disability
Self-Care Disability Comparison
French
Immigrants from Zaire
2.5%
SELF-CARE DISABILITY
9.9/ 100
METRIC RATING
207th/ 347
METRIC RANK
2.3%
SELF-CARE DISABILITY
99.2/ 100
METRIC RATING
68th/ 347
METRIC RANK
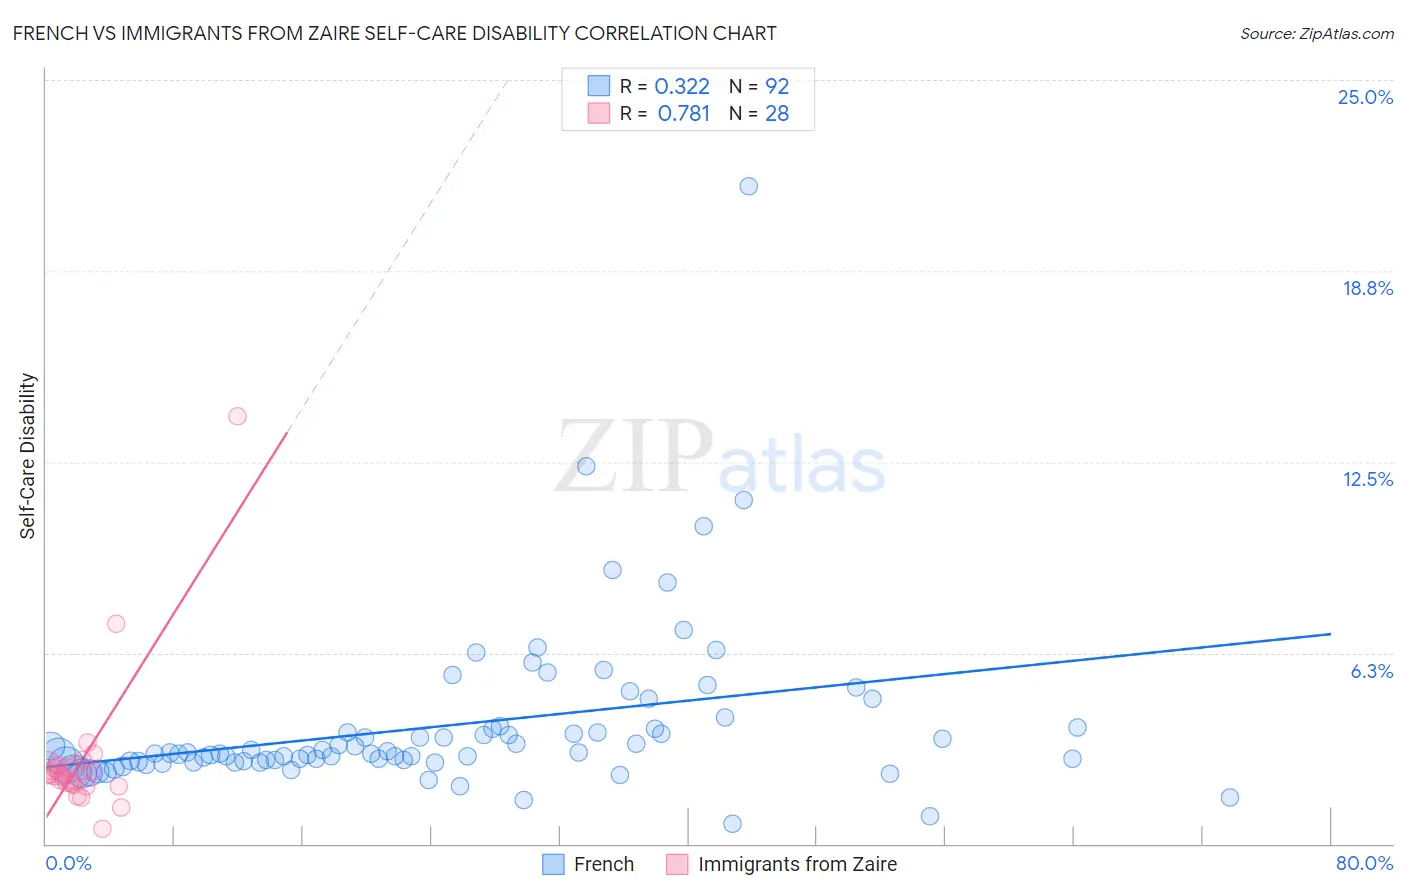
French vs Immigrants from Zaire Self-Care Disability Correlation Chart
The statistical analysis conducted on geographies consisting of 570,049,309 people shows a mild positive correlation between the proportion of French and percentage of population with self-care disability in the United States with a correlation coefficient (R) of 0.322 and weighted average of 2.5%. Similarly, the statistical analysis conducted on geographies consisting of 107,230,784 people shows a strong positive correlation between the proportion of Immigrants from Zaire and percentage of population with self-care disability in the United States with a correlation coefficient (R) of 0.781 and weighted average of 2.3%, a difference of 8.9%.
Self-Care Disability Correlation Summary
| Measurement | French | Immigrants from Zaire |
| Minimum | 0.65% | 0.51% |
| Maximum | 21.5% | 14.0% |
| Range | 20.9% | 13.5% |
| Mean | 3.8% | 2.8% |
| Median | 2.9% | 2.3% |
| Interquartile 25% (IQ1) | 2.7% | 1.9% |
| Interquartile 75% (IQ3) | 3.8% | 2.5% |
| Interquartile Range (IQR) | 1.1% | 0.59% |
| Standard Deviation (Sample) | 2.7% | 2.5% |
| Standard Deviation (Population) | 2.7% | 2.4% |
Similar Demographics by Self-Care Disability
Demographics Similar to French by Self-Care Disability
In terms of self-care disability, the demographic groups most similar to French are Alaskan Athabascan (2.5%, a difference of 0.060%), Immigrants from Russia (2.5%, a difference of 0.14%), Central American (2.5%, a difference of 0.16%), Immigrants from Bahamas (2.5%, a difference of 0.25%), and Immigrants from Lebanon (2.5%, a difference of 0.30%).
| Demographics | Rating | Rank | Self-Care Disability |
| Immigrants | Western Africa | 13.3 /100 | #200 | Poor 2.5% |
| Immigrants | South Eastern Asia | 12.9 /100 | #201 | Poor 2.5% |
| Slovaks | 12.6 /100 | #202 | Poor 2.5% |
| Immigrants | Lebanon | 12.4 /100 | #203 | Poor 2.5% |
| Immigrants | Bahamas | 11.9 /100 | #204 | Poor 2.5% |
| Immigrants | Russia | 11.0 /100 | #205 | Poor 2.5% |
| Alaskan Athabascans | 10.4 /100 | #206 | Poor 2.5% |
| French | 9.9 /100 | #207 | Tragic 2.5% |
| Central Americans | 8.7 /100 | #208 | Tragic 2.5% |
| Malaysians | 7.7 /100 | #209 | Tragic 2.5% |
| Panamanians | 6.4 /100 | #210 | Tragic 2.5% |
| Native Hawaiians | 5.1 /100 | #211 | Tragic 2.6% |
| Samoans | 5.1 /100 | #212 | Tragic 2.6% |
| Ecuadorians | 4.7 /100 | #213 | Tragic 2.6% |
| Immigrants | Honduras | 4.7 /100 | #214 | Tragic 2.6% |
Demographics Similar to Immigrants from Zaire by Self-Care Disability
In terms of self-care disability, the demographic groups most similar to Immigrants from Zaire are Immigrants from Norway (2.3%, a difference of 0.0%), Immigrants from Northern Europe (2.3%, a difference of 0.040%), Asian (2.3%, a difference of 0.070%), South African (2.3%, a difference of 0.090%), and Eastern European (2.3%, a difference of 0.10%).
| Demographics | Rating | Rank | Self-Care Disability |
| Palestinians | 99.4 /100 | #61 | Exceptional 2.3% |
| Egyptians | 99.4 /100 | #62 | Exceptional 2.3% |
| Mongolians | 99.3 /100 | #63 | Exceptional 2.3% |
| Swedes | 99.3 /100 | #64 | Exceptional 2.3% |
| Brazilians | 99.3 /100 | #65 | Exceptional 2.3% |
| Immigrants | Argentina | 99.3 /100 | #66 | Exceptional 2.3% |
| South Africans | 99.3 /100 | #67 | Exceptional 2.3% |
| Immigrants | Zaire | 99.2 /100 | #68 | Exceptional 2.3% |
| Immigrants | Norway | 99.2 /100 | #69 | Exceptional 2.3% |
| Immigrants | Northern Europe | 99.2 /100 | #70 | Exceptional 2.3% |
| Asians | 99.2 /100 | #71 | Exceptional 2.3% |
| Eastern Europeans | 99.2 /100 | #72 | Exceptional 2.3% |
| Immigrants | Egypt | 99.1 /100 | #73 | Exceptional 2.3% |
| Immigrants | Switzerland | 99.1 /100 | #74 | Exceptional 2.3% |
| Immigrants | Netherlands | 99.1 /100 | #75 | Exceptional 2.3% |