Moose Creek, AK Map & Demographics
Moose Creek Map
Moose Creek Overview
$41,271
PER CAPITA INCOME
$74,762
AVG FAMILY INCOME
$74,762
AVG HOUSEHOLD INCOME
0.46
INEQUALITY / GINI INDEX
584
TOTAL POPULATION
366
MALE POPULATION
218
FEMALE POPULATION
167.89
MALES / 100 FEMALES
59.56
FEMALES / 100 MALES
29.8
MEDIAN AGE
2.5
AVG FAMILY SIZE
2.4
AVG HOUSEHOLD SIZE
300
LABOR FORCE [ PEOPLE ]
54.2%
PERCENT IN LABOR FORCE
0.4%
UNEMPLOYMENT RATE
Income in Moose Creek
Income Overview in Moose Creek
Per Capita Income in Moose Creek is $41,271, while median incomes of families and households are $74,762 and $74,762 respectively.
| Characteristic | Number | Measure |
| Per Capita Income | 584 | $41,271 |
| Median Family Income | 154 | $74,762 |
| Mean Family Income | 154 | $109,706 |
| Median Household Income | 242 | $74,762 |
| Mean Household Income | 242 | $100,595 |
| Income Deficit | 154 | $0 |
| Wage / Income Gap (%) | 584 | 0.00% |
| Wage / Income Gap ($) | 584 | 100.00¢ per $1 |
| Gini / Inequality Index | 584 | 0.46 |
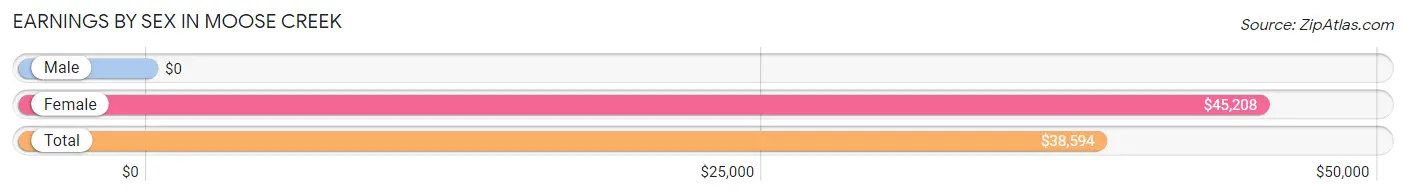
Earnings by Sex in Moose Creek
| Sex | Number | Average Earnings |
| Male | 238 (67.2%) | $0 |
| Female | 116 (32.8%) | $45,208 |
| Total | 354 (100.0%) | $38,594 |
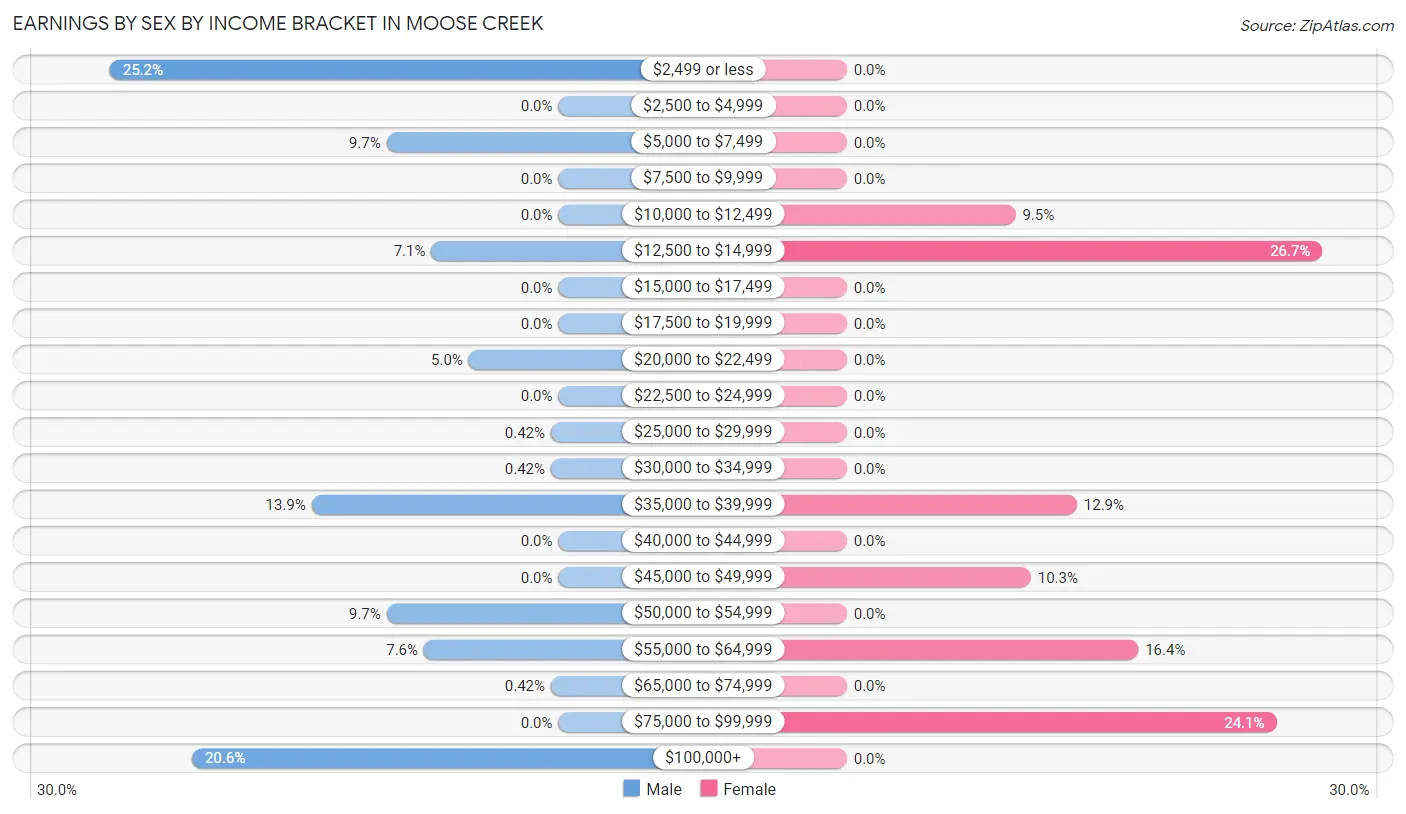
Earnings by Sex by Income Bracket in Moose Creek
The most common earnings brackets in Moose Creek are $2,499 or less for men (60 | 25.2%) and $12,500 to $14,999 for women (31 | 26.7%).
| Income | Male | Female |
| $2,499 or less | 60 (25.2%) | 0 (0.0%) |
| $2,500 to $4,999 | 0 (0.0%) | 0 (0.0%) |
| $5,000 to $7,499 | 23 (9.7%) | 0 (0.0%) |
| $7,500 to $9,999 | 0 (0.0%) | 0 (0.0%) |
| $10,000 to $12,499 | 0 (0.0%) | 11 (9.5%) |
| $12,500 to $14,999 | 17 (7.1%) | 31 (26.7%) |
| $15,000 to $17,499 | 0 (0.0%) | 0 (0.0%) |
| $17,500 to $19,999 | 0 (0.0%) | 0 (0.0%) |
| $20,000 to $22,499 | 12 (5.0%) | 0 (0.0%) |
| $22,500 to $24,999 | 0 (0.0%) | 0 (0.0%) |
| $25,000 to $29,999 | 1 (0.4%) | 0 (0.0%) |
| $30,000 to $34,999 | 1 (0.4%) | 0 (0.0%) |
| $35,000 to $39,999 | 33 (13.9%) | 15 (12.9%) |
| $40,000 to $44,999 | 0 (0.0%) | 0 (0.0%) |
| $45,000 to $49,999 | 0 (0.0%) | 12 (10.3%) |
| $50,000 to $54,999 | 23 (9.7%) | 0 (0.0%) |
| $55,000 to $64,999 | 18 (7.6%) | 19 (16.4%) |
| $65,000 to $74,999 | 1 (0.4%) | 0 (0.0%) |
| $75,000 to $99,999 | 0 (0.0%) | 28 (24.1%) |
| $100,000+ | 49 (20.6%) | 0 (0.0%) |
| Total | 238 (100.0%) | 116 (100.0%) |
Earnings by Sex by Educational Attainment in Moose Creek
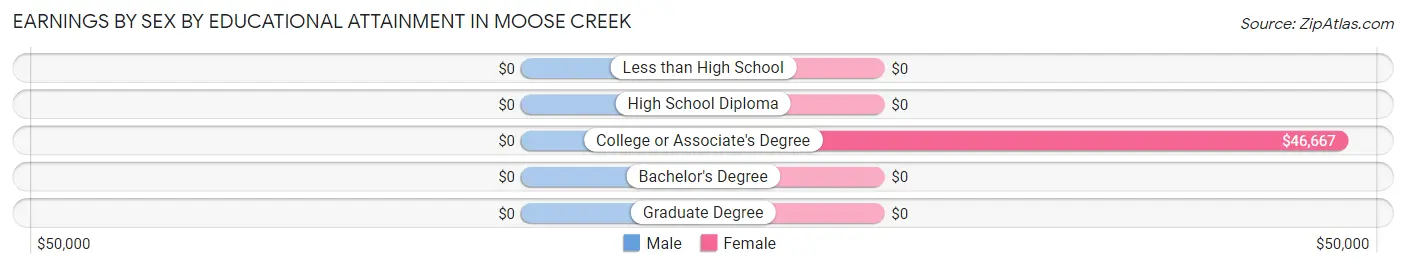
| Educational Attainment | Male Income | Female Income |
| Less than High School | - | - |
| High School Diploma | - | - |
| College or Associate's Degree | - | - |
| Bachelor's Degree | - | - |
| Graduate Degree | - | - |
| Total | - | - |
Family Income in Moose Creek
Family Income Brackets in Moose Creek
According to the Moose Creek family income data, there are 53 families falling into the $50,000 to $74,999 income range, which is the most common income bracket and makes up 34.4% of all families.
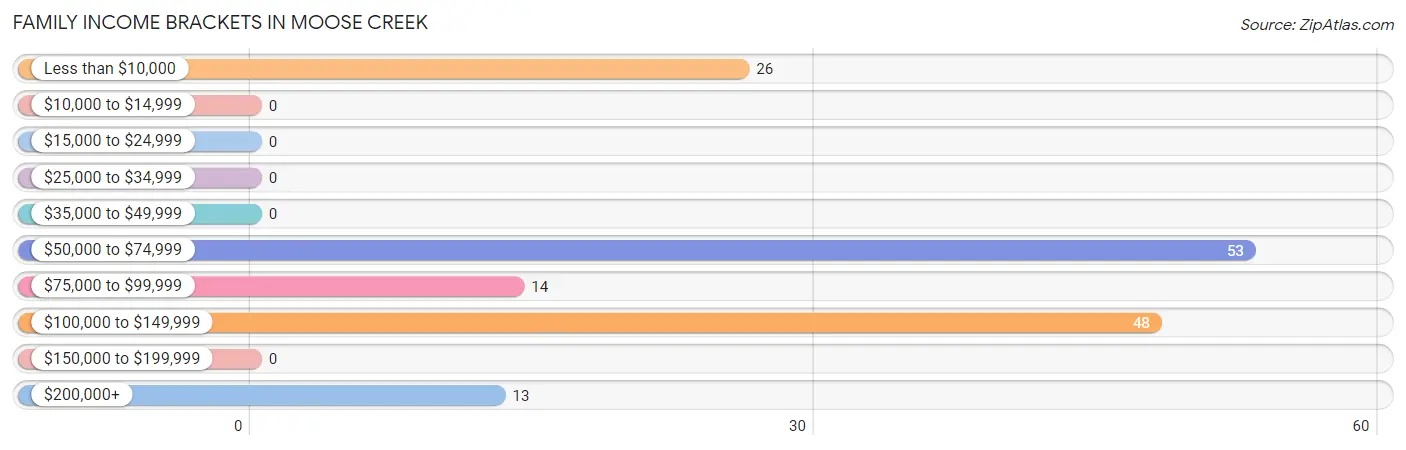
| Income Bracket | # Families | % Families |
| Less than $10,000 | 26 | 16.9% |
| $10,000 to $14,999 | 0 | 0.0% |
| $15,000 to $24,999 | 0 | 0.0% |
| $25,000 to $34,999 | 0 | 0.0% |
| $35,000 to $49,999 | 0 | 0.0% |
| $50,000 to $74,999 | 53 | 34.4% |
| $75,000 to $99,999 | 14 | 9.1% |
| $100,000 to $149,999 | 48 | 31.2% |
| $150,000 to $199,999 | 0 | 0.0% |
| $200,000+ | 13 | 8.4% |
Family Income by Famaliy Size in Moose Creek
2-person families (114 | 74.0%) account for the highest median family income in Moose Creek with $54,922 per family, while 2-person families (114 | 74.0%) have the highest median income of $27,461 per family member.
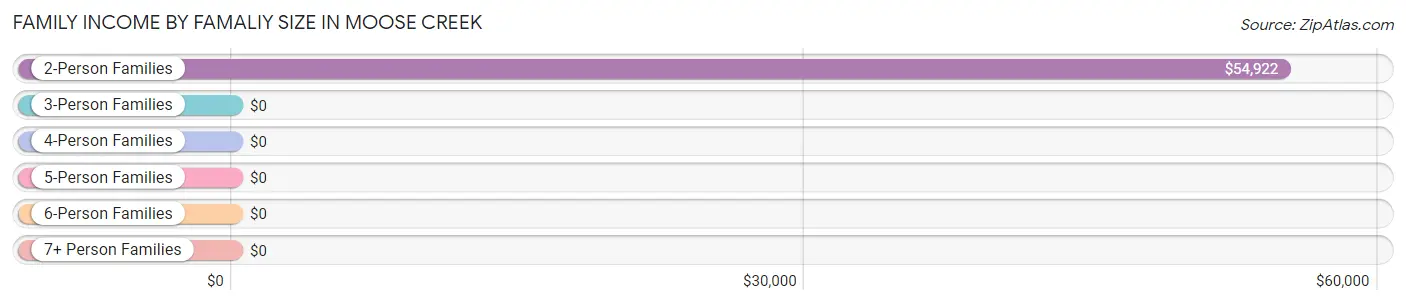
| Income Bracket | # Families | Median Income |
| 2-Person Families | 114 (74.0%) | $54,922 |
| 3-Person Families | 26 (16.9%) | $0 |
| 4-Person Families | 14 (9.1%) | $0 |
| 5-Person Families | 0 (0.0%) | $0 |
| 6-Person Families | 0 (0.0%) | $0 |
| 7+ Person Families | 0 (0.0%) | $0 |
| Total | 154 (100.0%) | $74,762 |
Family Income by Number of Earners in Moose Creek
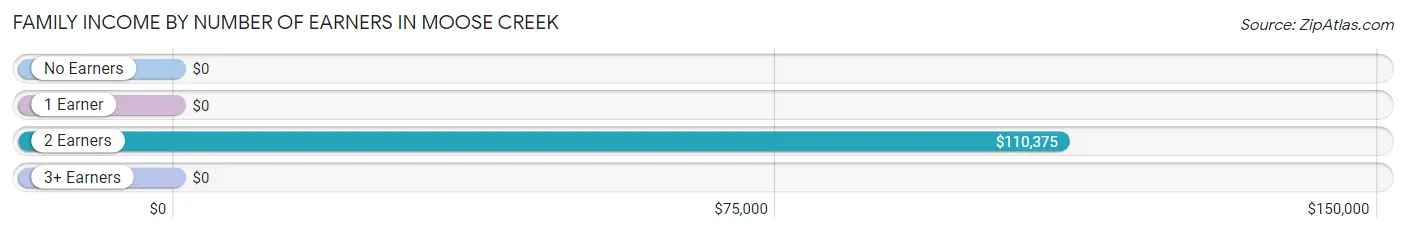
| Number of Earners | # Families | Median Income |
| No Earners | 47 (30.5%) | $0 |
| 1 Earner | 12 (7.8%) | $0 |
| 2 Earners | 95 (61.7%) | $110,375 |
| 3+ Earners | 0 (0.0%) | $0 |
| Total | 154 (100.0%) | $74,762 |
Household Income in Moose Creek
Household Income Brackets in Moose Creek
With 67 households falling in the category, the $100,000 to $149,999 income range is the most frequent in Moose Creek, accounting for 27.7% of all households.
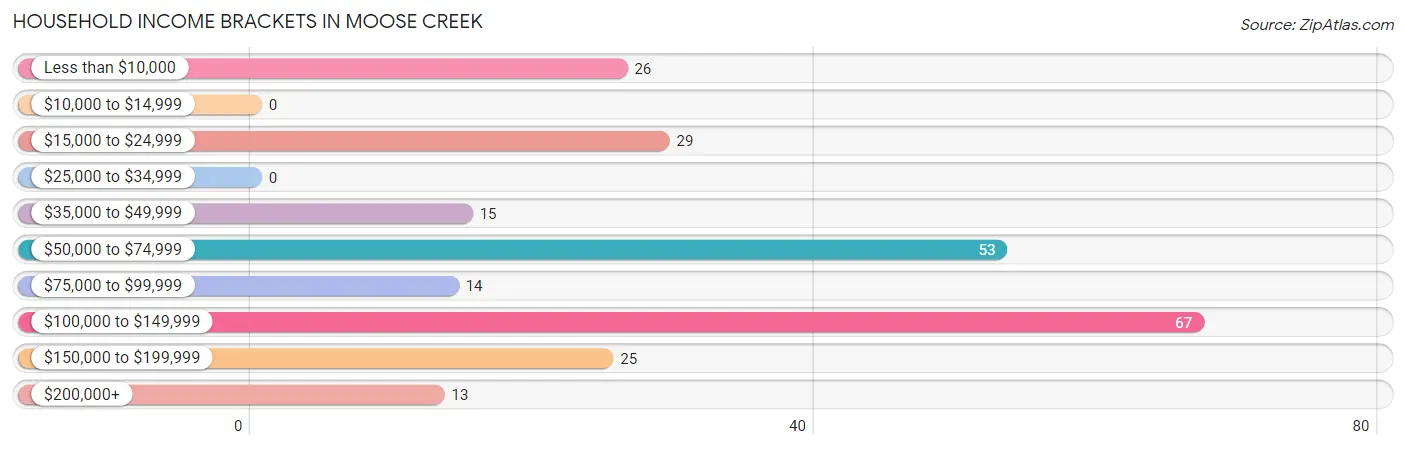
| Income Bracket | # Households | % Households |
| Less than $10,000 | 26 | 10.7% |
| $10,000 to $14,999 | 0 | 0.0% |
| $15,000 to $24,999 | 29 | 12.0% |
| $25,000 to $34,999 | 0 | 0.0% |
| $35,000 to $49,999 | 15 | 6.2% |
| $50,000 to $74,999 | 53 | 21.9% |
| $75,000 to $99,999 | 14 | 5.8% |
| $100,000 to $149,999 | 67 | 27.7% |
| $150,000 to $199,999 | 25 | 10.3% |
| $200,000+ | 13 | 5.4% |
Household Income by Householder Age in Moose Creek
The median household income in Moose Creek is $74,762, with the highest median household income of $115,526 found in the 45 to 64 years age bracket for the primary householder. A total of 132 households (54.5%) fall into this category. Meanwhile, the 15 to 24 years age bracket for the primary householder has the lowest median household income of $0, with 74 households (30.6%) in this group.
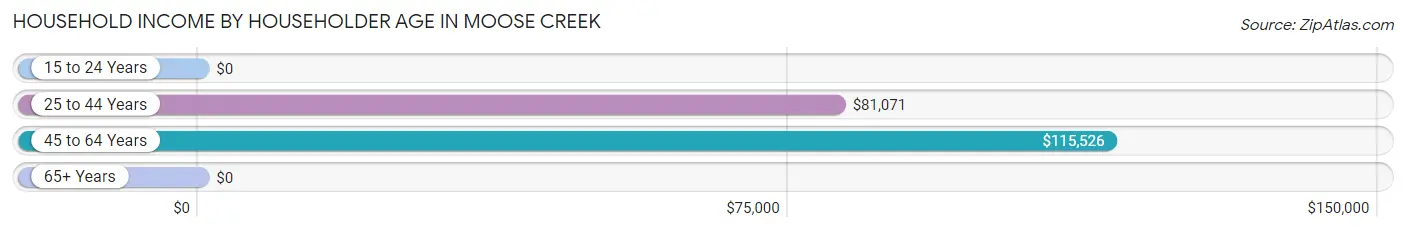
| Income Bracket | # Households | Median Income |
| 15 to 24 Years | 74 (30.6%) | $0 |
| 25 to 44 Years | 36 (14.9%) | $81,071 |
| 45 to 64 Years | 132 (54.5%) | $115,526 |
| 65+ Years | 0 (0.0%) | $0 |
| Total | 242 (100.0%) | $74,762 |
Poverty in Moose Creek
Income Below Poverty by Sex and Age in Moose Creek
With 19.7% poverty level for males and 20.2% for females among the residents of Moose Creek, 45 to 54 year old males and 25 to 34 year old females are the most vulnerable to poverty, with 26 males (37.1%) and 44 females (100.0%) in their respective age groups living below the poverty level.
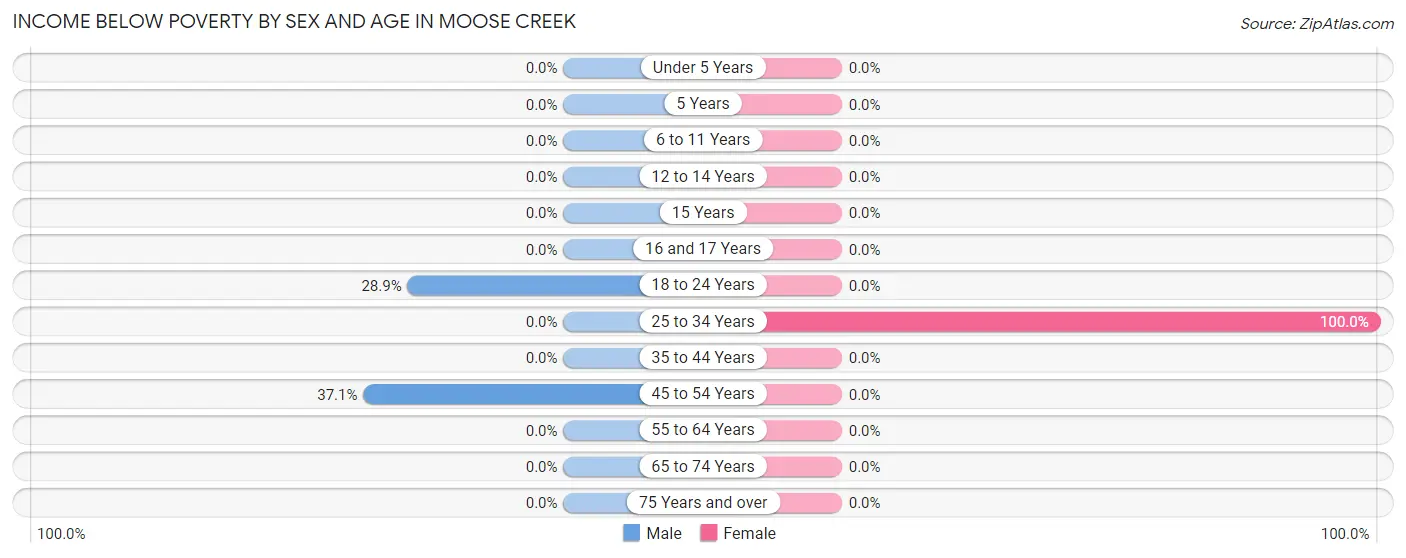
| Age Bracket | Male | Female |
| Under 5 Years | 0 (0.0%) | 0 (0.0%) |
| 5 Years | 0 (0.0%) | 0 (0.0%) |
| 6 to 11 Years | 0 (0.0%) | 0 (0.0%) |
| 12 to 14 Years | 0 (0.0%) | 0 (0.0%) |
| 15 Years | 0 (0.0%) | 0 (0.0%) |
| 16 and 17 Years | 0 (0.0%) | 0 (0.0%) |
| 18 to 24 Years | 46 (28.9%) | 0 (0.0%) |
| 25 to 34 Years | 0 (0.0%) | 44 (100.0%) |
| 35 to 44 Years | 0 (0.0%) | 0 (0.0%) |
| 45 to 54 Years | 26 (37.1%) | 0 (0.0%) |
| 55 to 64 Years | 0 (0.0%) | 0 (0.0%) |
| 65 to 74 Years | 0 (0.0%) | 0 (0.0%) |
| 75 Years and over | 0 (0.0%) | 0 (0.0%) |
| Total | 72 (19.7%) | 44 (20.2%) |
Income Above Poverty by Sex and Age in Moose Creek
According to the poverty statistics in Moose Creek, males aged under 5 years and females aged 6 to 11 years are the age groups that are most secure financially, with 100.0% of males and 100.0% of females in these age groups living above the poverty line.
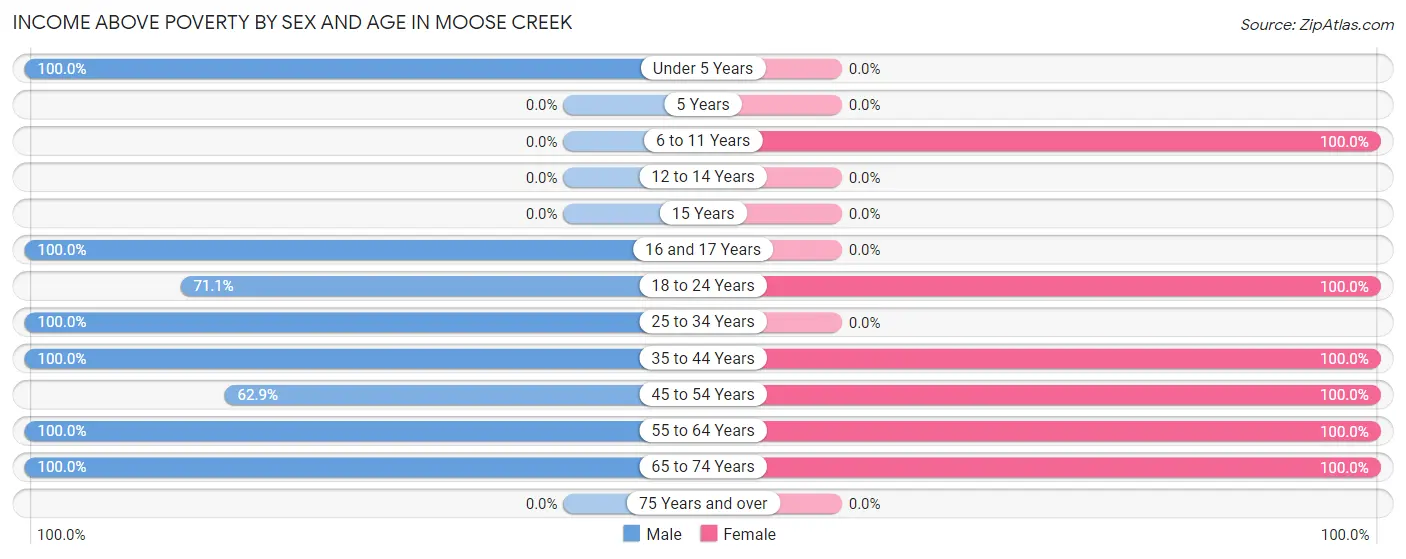
| Age Bracket | Male | Female |
| Under 5 Years | 17 (100.0%) | 0 (0.0%) |
| 5 Years | 0 (0.0%) | 0 (0.0%) |
| 6 to 11 Years | 0 (0.0%) | 14 (100.0%) |
| 12 to 14 Years | 0 (0.0%) | 0 (0.0%) |
| 15 Years | 0 (0.0%) | 0 (0.0%) |
| 16 and 17 Years | 23 (100.0%) | 0 (0.0%) |
| 18 to 24 Years | 113 (71.1%) | 31 (100.0%) |
| 25 to 34 Years | 15 (100.0%) | 0 (0.0%) |
| 35 to 44 Years | 24 (100.0%) | 27 (100.0%) |
| 45 to 54 Years | 44 (62.9%) | 27 (100.0%) |
| 55 to 64 Years | 28 (100.0%) | 52 (100.0%) |
| 65 to 74 Years | 30 (100.0%) | 23 (100.0%) |
| 75 Years and over | 0 (0.0%) | 0 (0.0%) |
| Total | 294 (80.3%) | 174 (79.8%) |
Income Below Poverty Among Married-Couple Families in Moose Creek
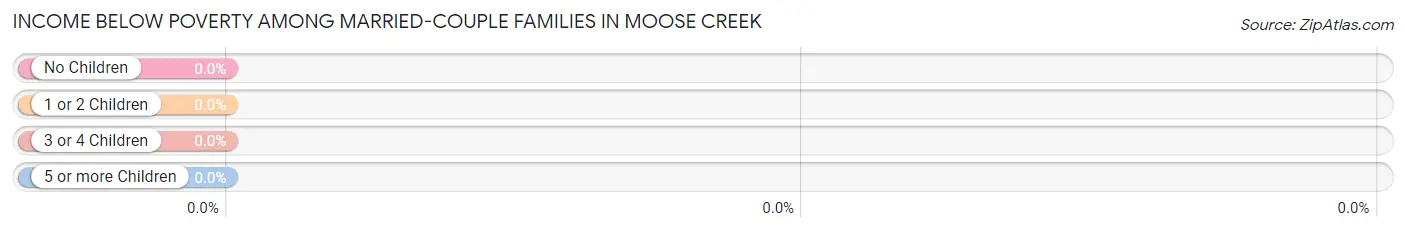
| Children | Above Poverty | Below Poverty |
| No Children | 88 (100.0%) | 0 (0.0%) |
| 1 or 2 Children | 40 (100.0%) | 0 (0.0%) |
| 3 or 4 Children | 0 (0.0%) | 0 (0.0%) |
| 5 or more Children | 0 (0.0%) | 0 (0.0%) |
| Total | 128 (100.0%) | 0 (0.0%) |
Income Below Poverty Among Single-Parent Households in Moose Creek
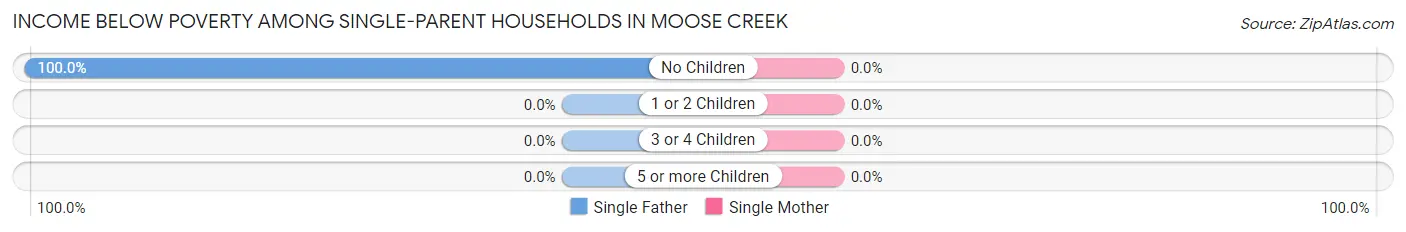
| Children | Single Father | Single Mother |
| No Children | 26 (100.0%) | 0 (0.0%) |
| 1 or 2 Children | 0 (0.0%) | 0 (0.0%) |
| 3 or 4 Children | 0 (0.0%) | 0 (0.0%) |
| 5 or more Children | 0 (0.0%) | 0 (0.0%) |
| Total | 26 (100.0%) | 0 (0.0%) |
Income Below Poverty Among Married-Couple vs Single-Parent Households in Moose Creek
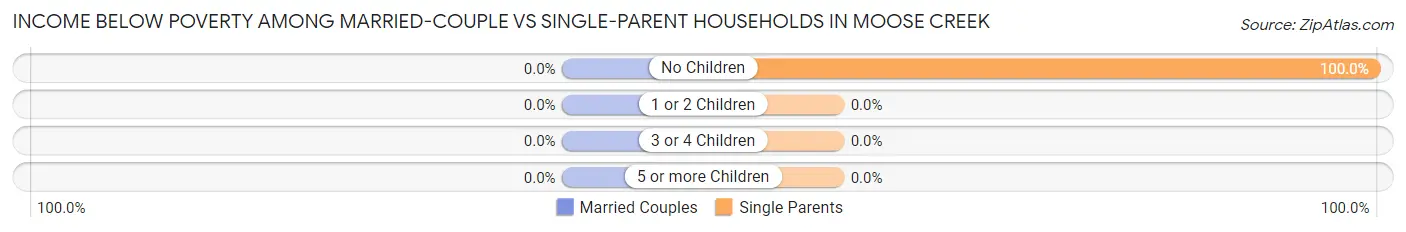
| Children | Married-Couple Families | Single-Parent Households |
| No Children | 0 (0.0%) | 26 (100.0%) |
| 1 or 2 Children | 0 (0.0%) | 0 (0.0%) |
| 3 or 4 Children | 0 (0.0%) | 0 (0.0%) |
| 5 or more Children | 0 (0.0%) | 0 (0.0%) |
| Total | 0 (0.0%) | 26 (100.0%) |
Race in Moose Creek
The most populous races in Moose Creek are White / Caucasian (404 | 69.2%), Two or more Races (115 | 19.7%), and Hispanic or Latino (54 | 9.2%).
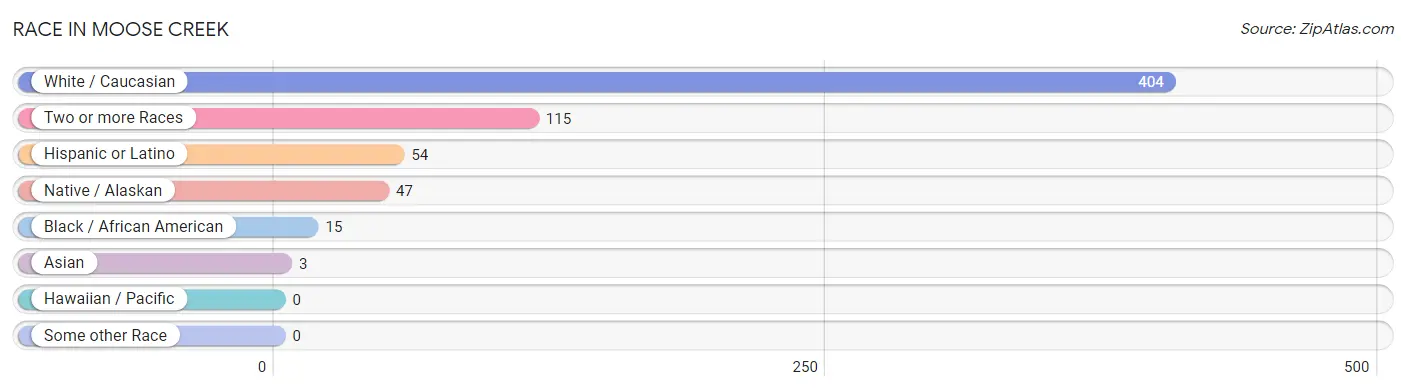
| Race | # Population | % Population |
| Asian | 3 | 0.5% |
| Black / African American | 15 | 2.6% |
| Hawaiian / Pacific | 0 | 0.0% |
| Hispanic or Latino | 54 | 9.2% |
| Native / Alaskan | 47 | 8.1% |
| White / Caucasian | 404 | 69.2% |
| Two or more Races | 115 | 19.7% |
| Some other Race | 0 | 0.0% |
| Total | 584 | 100.0% |
Ancestry in Moose Creek
The most populous ancestries reported in Moose Creek are English (144 | 24.7%), Irish (81 | 13.9%), German (53 | 9.1%), Inupiat (47 | 8.1%), and Polish (46 | 7.9%), together accounting for 63.5% of all Moose Creek residents.
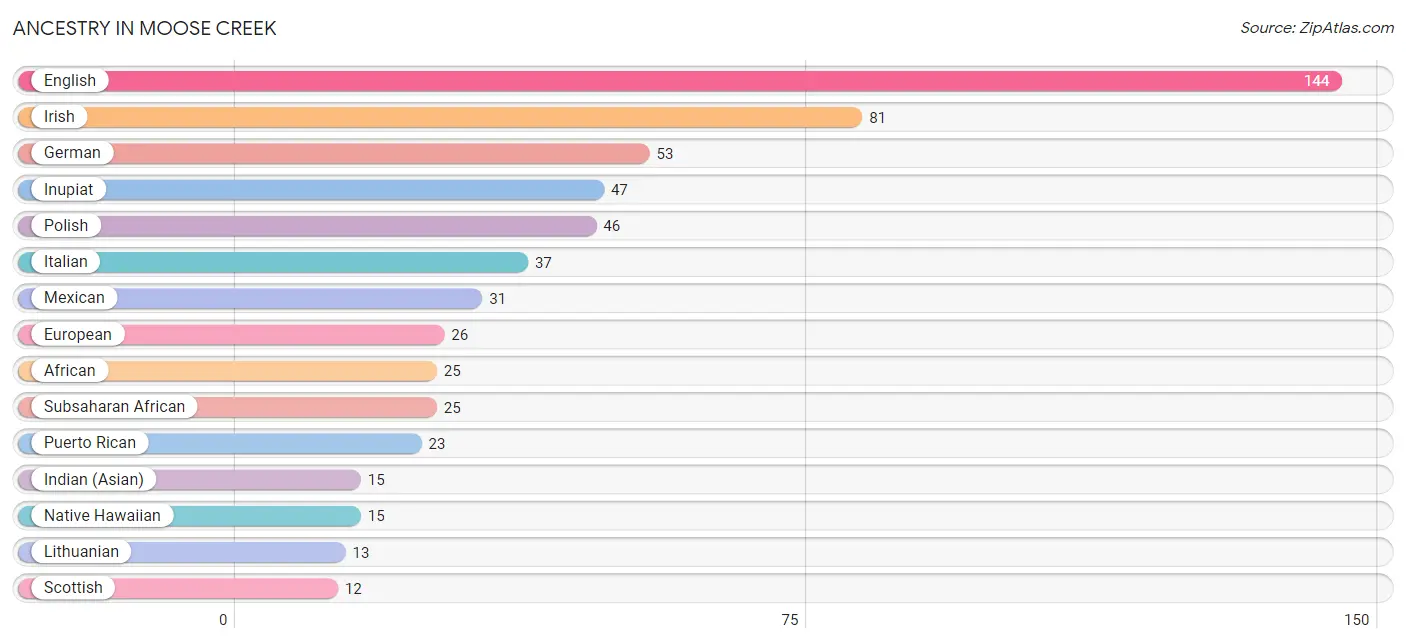
| Ancestry | # Population | % Population |
| African | 25 | 4.3% |
| English | 144 | 24.7% |
| European | 26 | 4.4% |
| German | 53 | 9.1% |
| Indian (Asian) | 15 | 2.6% |
| Inupiat | 47 | 8.1% |
| Irish | 81 | 13.9% |
| Italian | 37 | 6.3% |
| Korean | 3 | 0.5% |
| Lithuanian | 13 | 2.2% |
| Mexican | 31 | 5.3% |
| Native Hawaiian | 15 | 2.6% |
| Polish | 46 | 7.9% |
| Puerto Rican | 23 | 3.9% |
| Scottish | 12 | 2.1% |
| Subsaharan African | 25 | 4.3% | View All 16 Rows |
Immigrants in Moose Creek
The most numerous immigrant groups reported in Moose Creek came from Asia (3 | 0.5%), Philippines (3 | 0.5%), and South Eastern Asia (3 | 0.5%), together accounting for 1.5% of all Moose Creek residents.
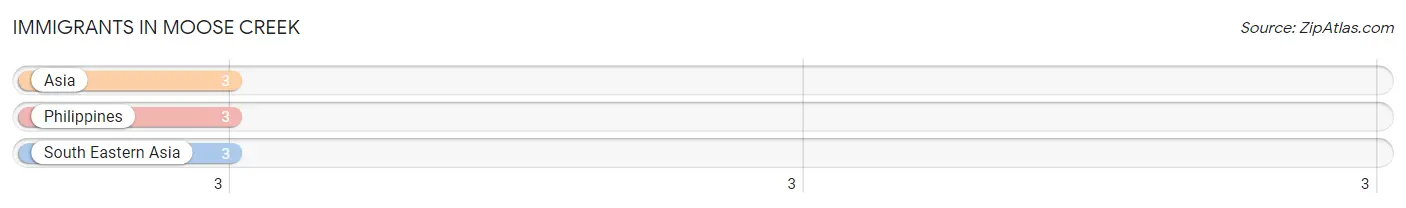
| Immigration Origin | # Population | % Population |
| Asia | 3 | 0.5% |
| Philippines | 3 | 0.5% |
| South Eastern Asia | 3 | 0.5% | View All 3 Rows |
Sex and Age in Moose Creek
Sex and Age in Moose Creek
The most populous age groups in Moose Creek are 20 to 24 Years (144 | 39.3%) for men and 25 to 29 Years (44 | 20.2%) for women.
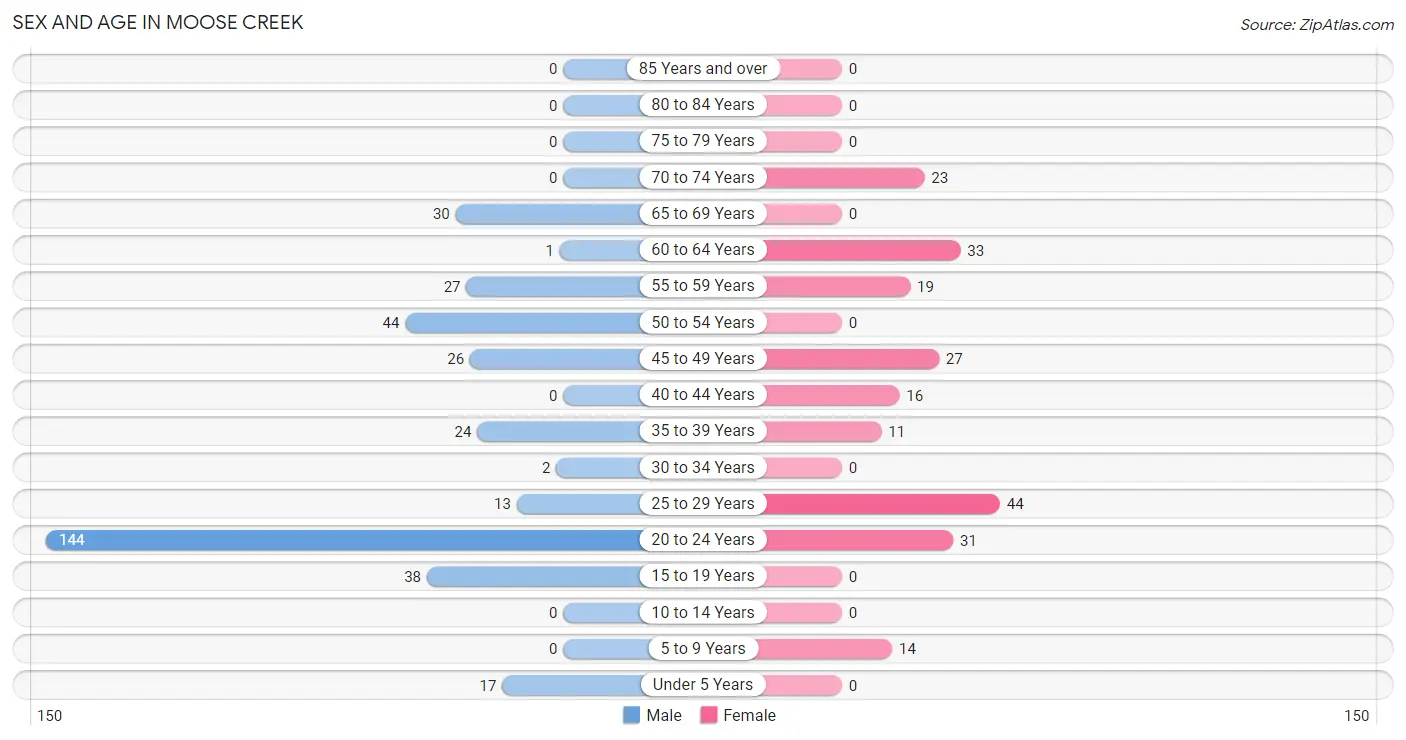
| Age Bracket | Male | Female |
| Under 5 Years | 17 (4.6%) | 0 (0.0%) |
| 5 to 9 Years | 0 (0.0%) | 14 (6.4%) |
| 10 to 14 Years | 0 (0.0%) | 0 (0.0%) |
| 15 to 19 Years | 38 (10.4%) | 0 (0.0%) |
| 20 to 24 Years | 144 (39.3%) | 31 (14.2%) |
| 25 to 29 Years | 13 (3.5%) | 44 (20.2%) |
| 30 to 34 Years | 2 (0.5%) | 0 (0.0%) |
| 35 to 39 Years | 24 (6.6%) | 11 (5.1%) |
| 40 to 44 Years | 0 (0.0%) | 16 (7.3%) |
| 45 to 49 Years | 26 (7.1%) | 27 (12.4%) |
| 50 to 54 Years | 44 (12.0%) | 0 (0.0%) |
| 55 to 59 Years | 27 (7.4%) | 19 (8.7%) |
| 60 to 64 Years | 1 (0.3%) | 33 (15.1%) |
| 65 to 69 Years | 30 (8.2%) | 0 (0.0%) |
| 70 to 74 Years | 0 (0.0%) | 23 (10.5%) |
| 75 to 79 Years | 0 (0.0%) | 0 (0.0%) |
| 80 to 84 Years | 0 (0.0%) | 0 (0.0%) |
| 85 Years and over | 0 (0.0%) | 0 (0.0%) |
| Total | 366 (100.0%) | 218 (100.0%) |
Families and Households in Moose Creek
Median Family Size in Moose Creek
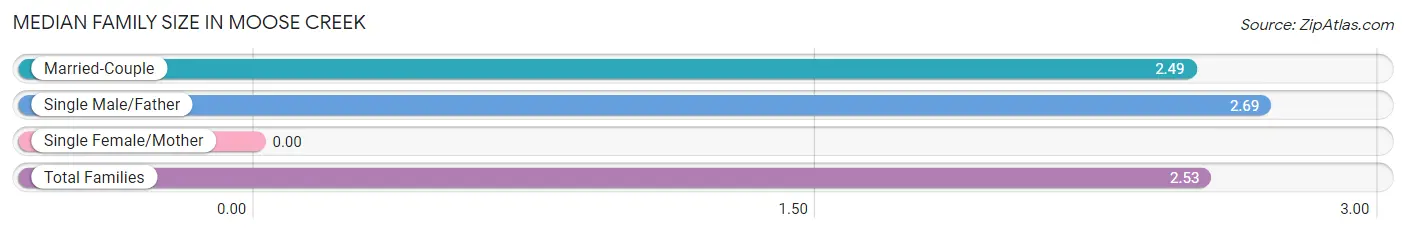
| Family Type | # Families | Family Size |
| Married-Couple | 128 (83.1%) | 2.49 |
| Single Male/Father | 26 (16.9%) | 2.69 |
| Single Female/Mother | 0 (0.0%) | - |
| Total Families | 154 (100.0%) | 2.53 |
Median Household Size in Moose Creek
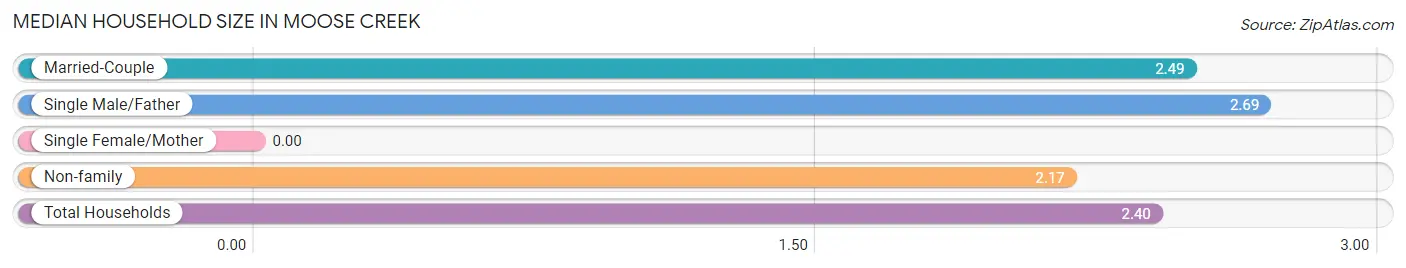
| Household Type | # Households | Household Size |
| Married-Couple | 128 (52.9%) | 2.49 |
| Single Male/Father | 26 (10.7%) | 2.69 |
| Single Female/Mother | 0 (0.0%) | - |
| Non-family | 88 (36.4%) | 2.17 |
| Total Households | 242 (100.0%) | 2.40 |
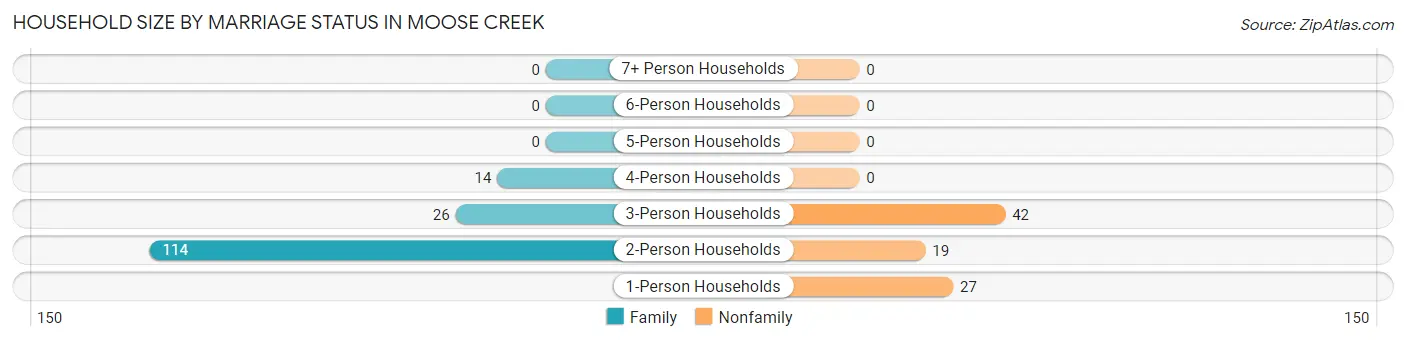
Household Size by Marriage Status in Moose Creek
Out of a total of 242 households in Moose Creek, 154 (63.6%) are family households, while 88 (36.4%) are nonfamily households. The most numerous type of family households are 2-person households, comprising 114, and the most common type of nonfamily households are 3-person households, comprising 42.
| Household Size | Family Households | Nonfamily Households |
| 1-Person Households | - | 27 (11.2%) |
| 2-Person Households | 114 (47.1%) | 19 (7.9%) |
| 3-Person Households | 26 (10.7%) | 42 (17.4%) |
| 4-Person Households | 14 (5.8%) | 0 (0.0%) |
| 5-Person Households | 0 (0.0%) | 0 (0.0%) |
| 6-Person Households | 0 (0.0%) | 0 (0.0%) |
| 7+ Person Households | 0 (0.0%) | 0 (0.0%) |
| Total | 154 (63.6%) | 88 (36.4%) |
Female Fertility in Moose Creek
Fertility by Age in Moose Creek
| Age Bracket | Women with Births | Births / 1,000 Women |
| 15 to 19 years | 0 (0.0%) | 0.0 |
| 20 to 34 years | 0 (0.0%) | 0.0 |
| 35 to 50 years | 0 (0.0%) | 0.0 |
| Total | 0 (0.0%) | 0.0 |
Fertility by Age by Marriage Status in Moose Creek
| Age Bracket | Married | Unmarried |
| 15 to 19 years | 0 (0.0%) | 0 (0.0%) |
| 20 to 34 years | 0 (0.0%) | 0 (0.0%) |
| 35 to 50 years | 0 (0.0%) | 0 (0.0%) |
| Total | 0 (0.0%) | 0 (0.0%) |
Fertility by Education in Moose Creek
| Educational Attainment | Women with Births | Births / 1,000 Women |
| Less than High School | 0 (0.0%) | 0.0 |
| High School Diploma | 0 (0.0%) | 0.0 |
| College or Associate's Degree | 0 (0.0%) | 0.0 |
| Bachelor's Degree | 0 (0.0%) | 0.0 |
| Graduate Degree | 0 (0.0%) | 0.0 |
| Total | 0 (0.0%) | 0.0 |
Fertility by Education by Marriage Status in Moose Creek
| Educational Attainment | Married | Unmarried |
| Less than High School | 0 (0.0%) | 0 (0.0%) |
| High School Diploma | 0 (0.0%) | 0 (0.0%) |
| College or Associate's Degree | 0 (0.0%) | 0 (0.0%) |
| Bachelor's Degree | 0 (0.0%) | 0 (0.0%) |
| Graduate Degree | 0 (0.0%) | 0 (0.0%) |
| Total | 0 (0.0%) | 0 (0.0%) |
Employment Characteristics in Moose Creek
Employment by Class of Employer in Moose Creek
Among the 299 employed individuals in Moose Creek, private company employees (117 | 39.1%), federal government employees (71 | 23.7%), and local government employees (59 | 19.7%) make up the most common classes of employment.
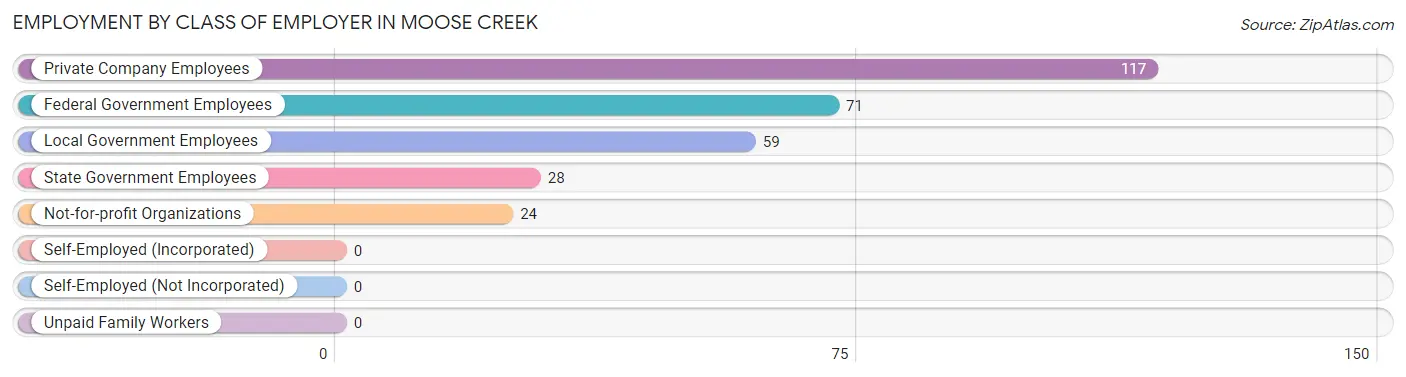
| Employer Class | # Employees | % Employees |
| Private Company Employees | 117 | 39.1% |
| Self-Employed (Incorporated) | 0 | 0.0% |
| Self-Employed (Not Incorporated) | 0 | 0.0% |
| Not-for-profit Organizations | 24 | 8.0% |
| Local Government Employees | 59 | 19.7% |
| State Government Employees | 28 | 9.4% |
| Federal Government Employees | 71 | 23.7% |
| Unpaid Family Workers | 0 | 0.0% |
| Total | 299 | 100.0% |
Employment Status by Age in Moose Creek
According to the labor force statistics for Moose Creek, out of the total population over 16 years of age (553), 54.2% or 300 individuals are in the labor force, with 0.4% or 1 of them unemployed. The age group with the highest labor force participation rate is 30 to 34 years, with 100.0% or 2 individuals in the labor force. Within the labor force, the 25 to 29 years age range has the highest percentage of unemployed individuals, with 7.7% or 1 of them being unemployed.
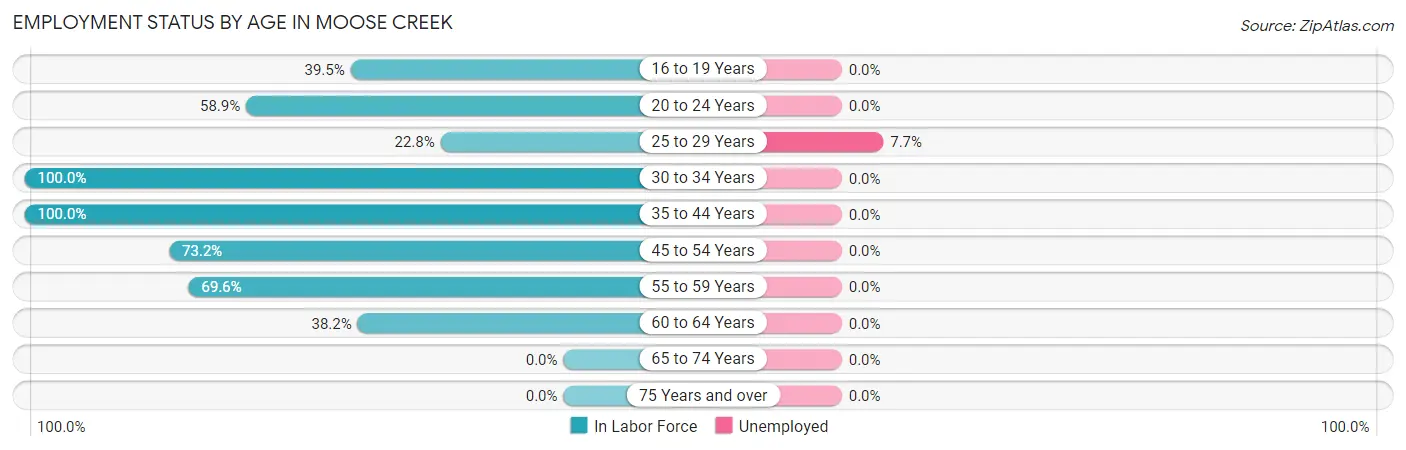
| Age Bracket | In Labor Force | Unemployed |
| 16 to 19 Years | 15 (39.5%) | 0 (0.0%) |
| 20 to 24 Years | 103 (58.9%) | 0 (0.0%) |
| 25 to 29 Years | 13 (22.8%) | 1 (7.7%) |
| 30 to 34 Years | 2 (100.0%) | 0 (0.0%) |
| 35 to 44 Years | 51 (100.0%) | 0 (0.0%) |
| 45 to 54 Years | 71 (73.2%) | 0 (0.0%) |
| 55 to 59 Years | 32 (69.6%) | 0 (0.0%) |
| 60 to 64 Years | 13 (38.2%) | 0 (0.0%) |
| 65 to 74 Years | 0 (0.0%) | 0 (0.0%) |
| 75 Years and over | 0 (0.0%) | 0 (0.0%) |
| Total | 300 (54.2%) | 1 (0.4%) |
Employment Status by Educational Attainment in Moose Creek
According to labor force statistics for Moose Creek, 63.4% of individuals (182) out of the total population between 25 and 64 years of age (287) are in the labor force, with 0.5% or 1 of them being unemployed. The group with the highest labor force participation rate are those with the educational attainment of bachelor's degree or higher, with 100.0% or 87 individuals in the labor force. Within the labor force, individuals with college / associate degree education have the highest percentage of unemployment, with 1.3% or 1 of them being unemployed.
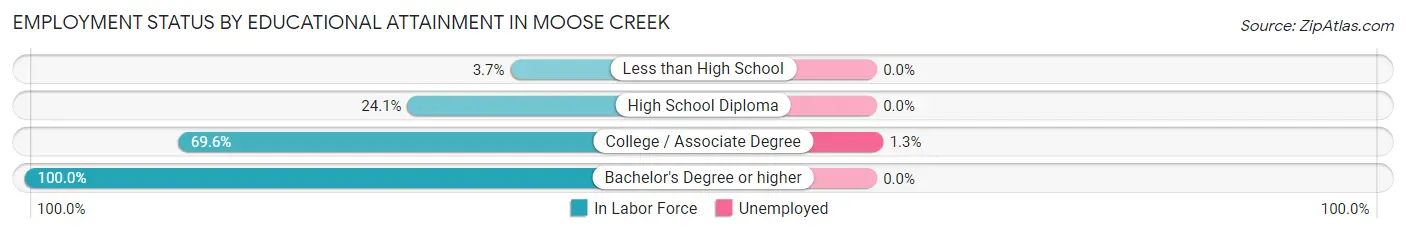
| Educational Attainment | In Labor Force | Unemployed |
| Less than High School | 1 (3.7%) | 0 (0.0%) |
| High School Diploma | 14 (24.1%) | 0 (0.0%) |
| College / Associate Degree | 80 (69.6%) | 1 (1.3%) |
| Bachelor's Degree or higher | 87 (100.0%) | 0 (0.0%) |
| Total | 182 (63.4%) | 1 (0.5%) |
Employment Occupations by Sex in Moose Creek
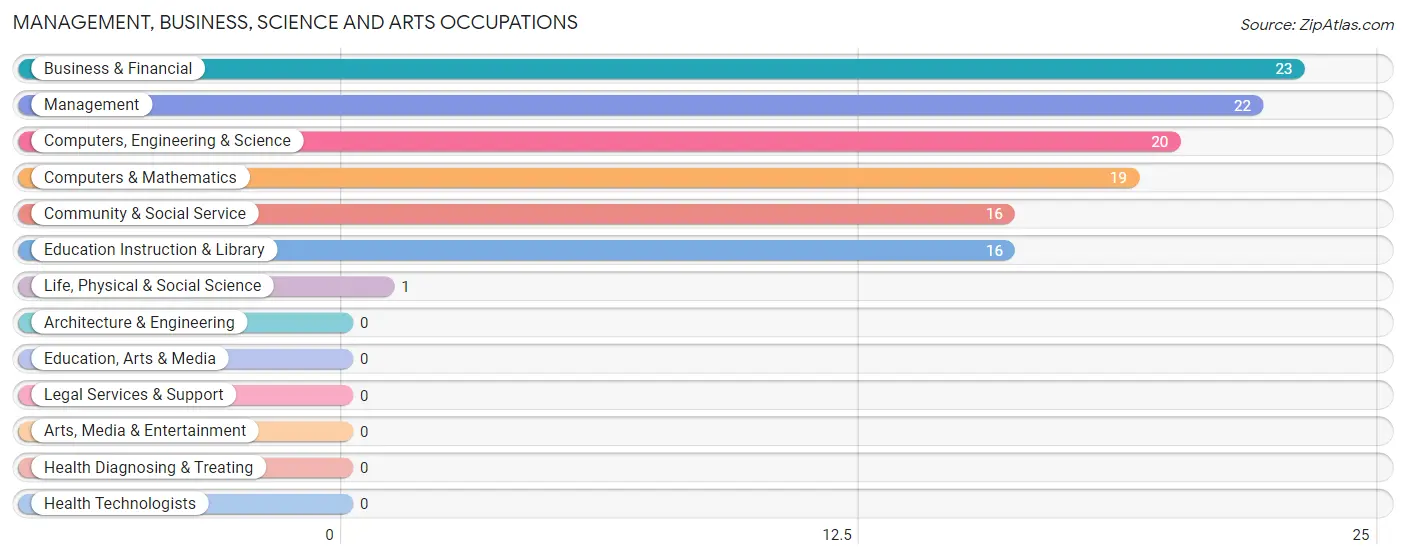
Management, Business, Science and Arts Occupations
The most common Management, Business, Science and Arts occupations in Moose Creek are Business & Financial (23 | 9.4%), Management (22 | 9.0%), Computers, Engineering & Science (20 | 8.2%), Computers & Mathematics (19 | 7.8%), and Community & Social Service (16 | 6.6%).
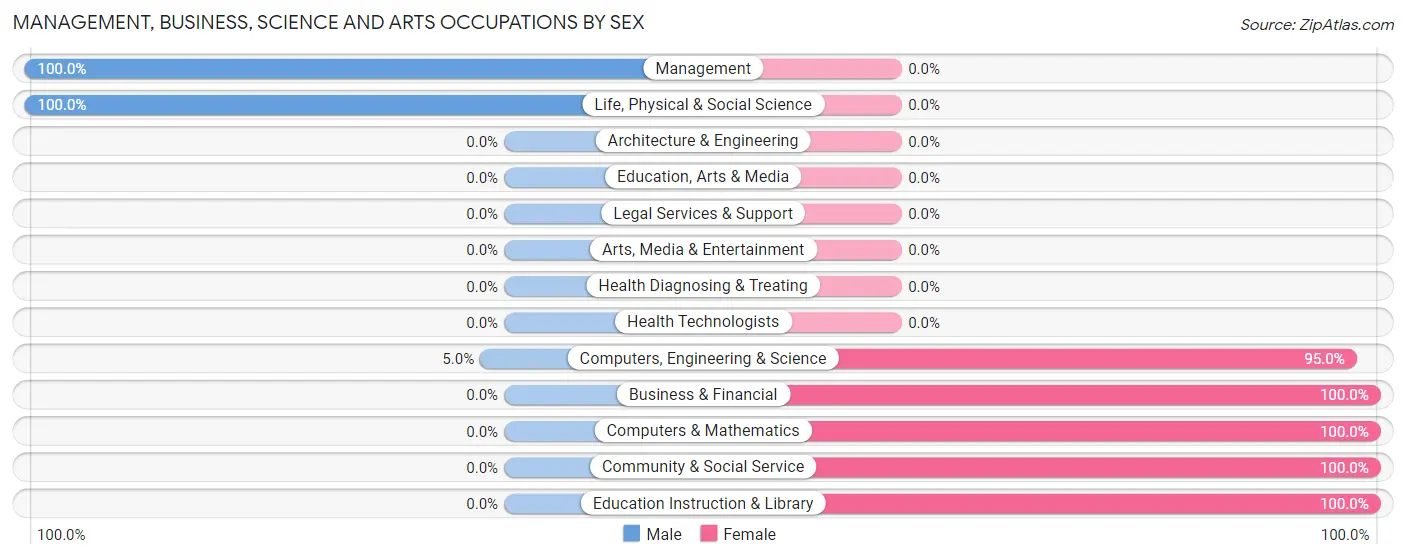
Management, Business, Science and Arts Occupations by Sex
Within the Management, Business, Science and Arts occupations in Moose Creek, the most male-oriented occupations are Management (100.0%), Life, Physical & Social Science (100.0%), and Computers, Engineering & Science (5.0%), while the most female-oriented occupations are Business & Financial (100.0%), Computers & Mathematics (100.0%), and Community & Social Service (100.0%).
| Occupation | Male | Female |
| Management | 22 (100.0%) | 0 (0.0%) |
| Business & Financial | 0 (0.0%) | 23 (100.0%) |
| Computers, Engineering & Science | 1 (5.0%) | 19 (95.0%) |
| Computers & Mathematics | 0 (0.0%) | 19 (100.0%) |
| Architecture & Engineering | 0 (0.0%) | 0 (0.0%) |
| Life, Physical & Social Science | 1 (100.0%) | 0 (0.0%) |
| Community & Social Service | 0 (0.0%) | 16 (100.0%) |
| Education, Arts & Media | 0 (0.0%) | 0 (0.0%) |
| Legal Services & Support | 0 (0.0%) | 0 (0.0%) |
| Education Instruction & Library | 0 (0.0%) | 16 (100.0%) |
| Arts, Media & Entertainment | 0 (0.0%) | 0 (0.0%) |
| Health Diagnosing & Treating | 0 (0.0%) | 0 (0.0%) |
| Health Technologists | 0 (0.0%) | 0 (0.0%) |
| Total (Category) | 23 (28.4%) | 58 (71.6%) |
| Total (Overall) | 128 (52.5%) | 116 (47.5%) |
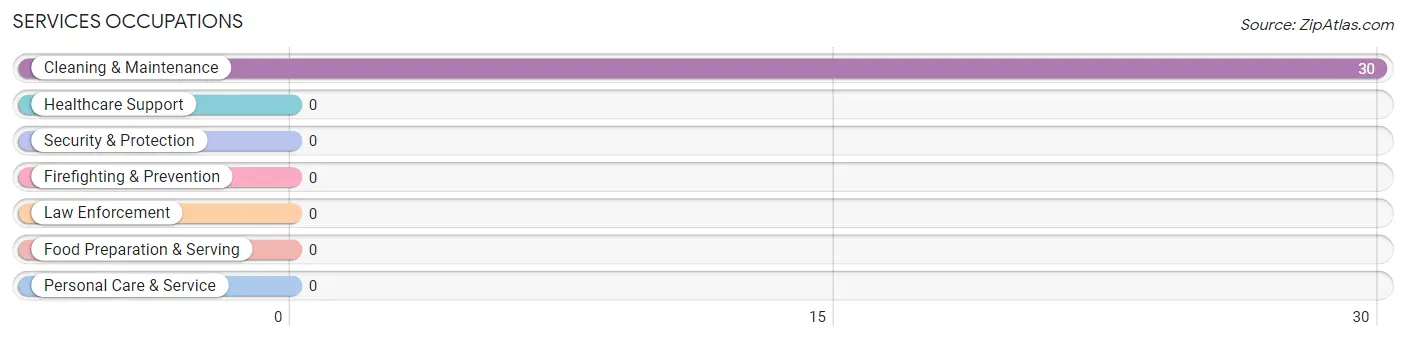
Services Occupations
The most common Services occupations in Moose Creek are , and Cleaning & Maintenance (30 | 12.3%).
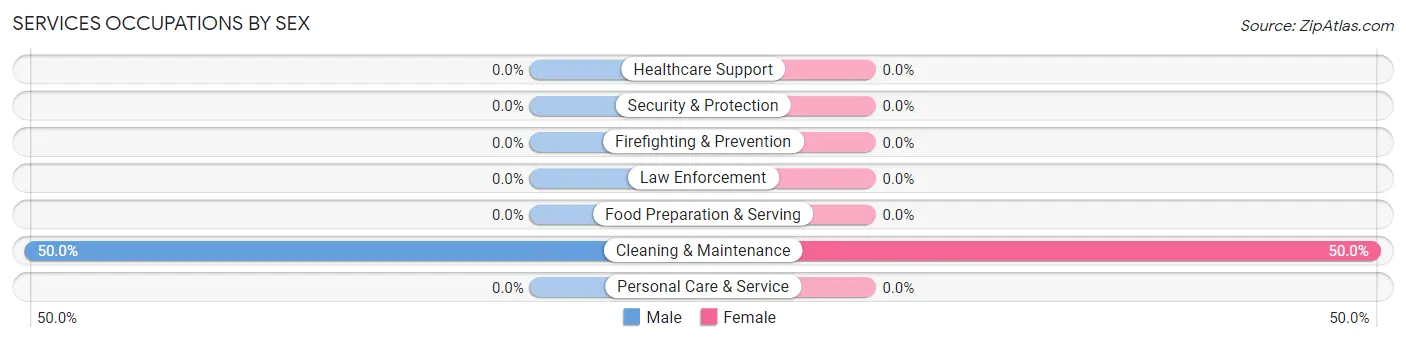
Services Occupations by Sex
| Occupation | Male | Female |
| Healthcare Support | 0 (0.0%) | 0 (0.0%) |
| Security & Protection | 0 (0.0%) | 0 (0.0%) |
| Firefighting & Prevention | 0 (0.0%) | 0 (0.0%) |
| Law Enforcement | 0 (0.0%) | 0 (0.0%) |
| Food Preparation & Serving | 0 (0.0%) | 0 (0.0%) |
| Cleaning & Maintenance | 15 (50.0%) | 15 (50.0%) |
| Personal Care & Service | 0 (0.0%) | 0 (0.0%) |
| Total (Category) | 15 (50.0%) | 15 (50.0%) |
| Total (Overall) | 128 (52.5%) | 116 (47.5%) |
Sales and Office Occupations
The most common Sales and Office occupations in Moose Creek are , and Office & Administration (44 | 18.0%).
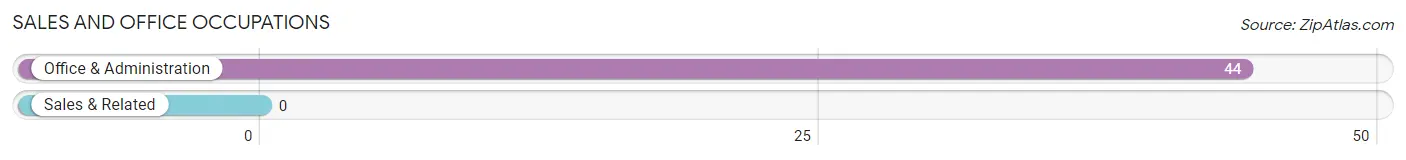
Sales and Office Occupations by Sex
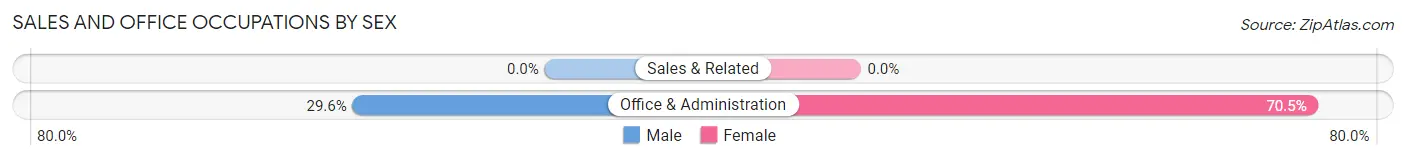
| Occupation | Male | Female |
| Sales & Related | 0 (0.0%) | 0 (0.0%) |
| Office & Administration | 13 (29.5%) | 31 (70.5%) |
| Total (Category) | 13 (29.5%) | 31 (70.5%) |
| Total (Overall) | 128 (52.5%) | 116 (47.5%) |
Natural Resources, Construction and Maintenance Occupations
The most common Natural Resources, Construction and Maintenance occupations in Moose Creek are , and Installation, Maintenance & Repair (32 | 13.1%).
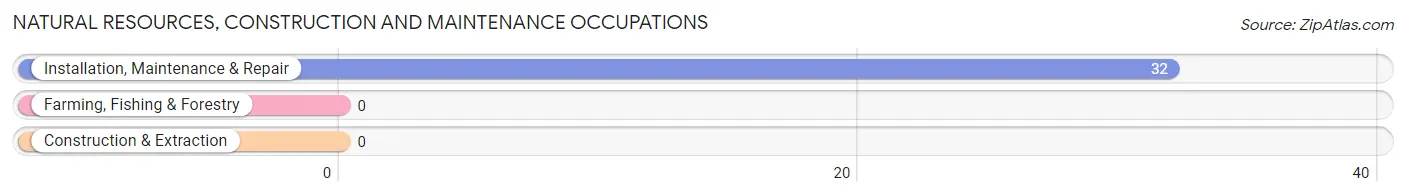
Natural Resources, Construction and Maintenance Occupations by Sex
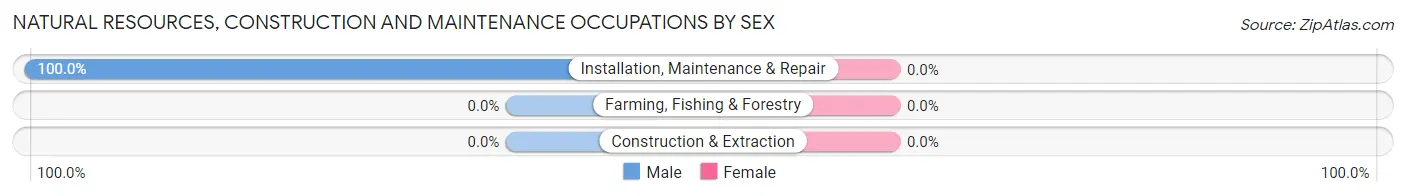
| Occupation | Male | Female |
| Farming, Fishing & Forestry | 0 (0.0%) | 0 (0.0%) |
| Construction & Extraction | 0 (0.0%) | 0 (0.0%) |
| Installation, Maintenance & Repair | 32 (100.0%) | 0 (0.0%) |
| Total (Category) | 32 (100.0%) | 0 (0.0%) |
| Total (Overall) | 128 (52.5%) | 116 (47.5%) |
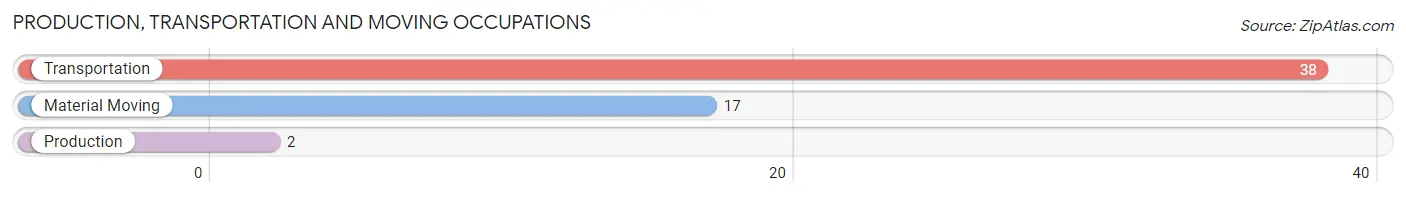
Production, Transportation and Moving Occupations
The most common Production, Transportation and Moving occupations in Moose Creek are Transportation (38 | 15.6%), Material Moving (17 | 7.0%), and Production (2 | 0.8%).
Production, Transportation and Moving Occupations by Sex
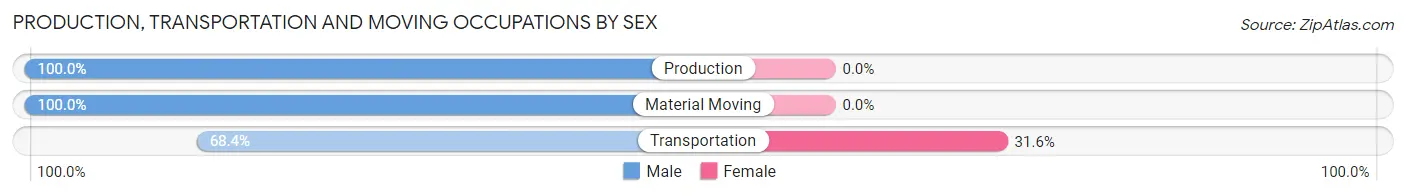
| Occupation | Male | Female |
| Production | 2 (100.0%) | 0 (0.0%) |
| Transportation | 26 (68.4%) | 12 (31.6%) |
| Material Moving | 17 (100.0%) | 0 (0.0%) |
| Total (Category) | 45 (78.9%) | 12 (21.0%) |
| Total (Overall) | 128 (52.5%) | 116 (47.5%) |
Employment Industries by Sex in Moose Creek
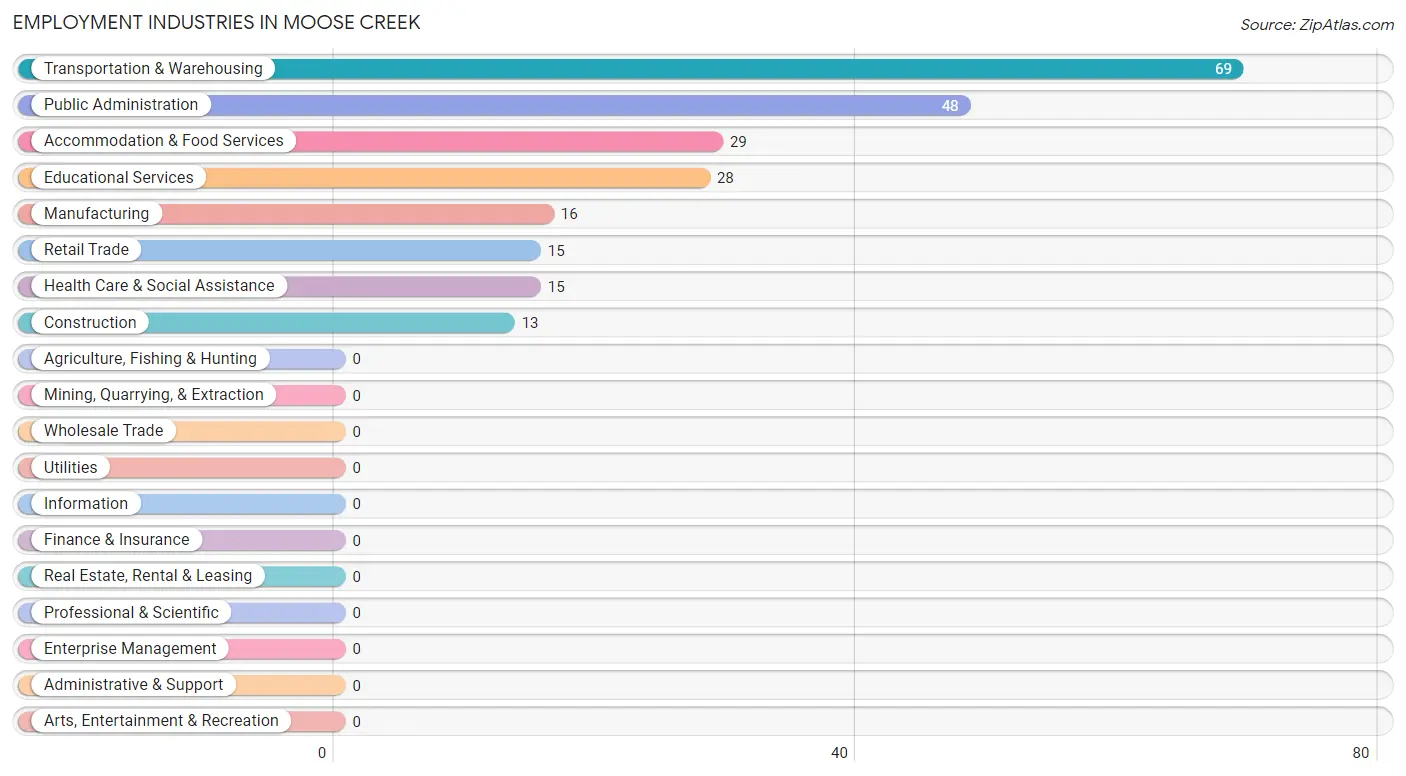
Employment Industries in Moose Creek
The major employment industries in Moose Creek include Transportation & Warehousing (69 | 28.3%), Public Administration (48 | 19.7%), Accommodation & Food Services (29 | 11.9%), Educational Services (28 | 11.5%), and Manufacturing (16 | 6.6%).
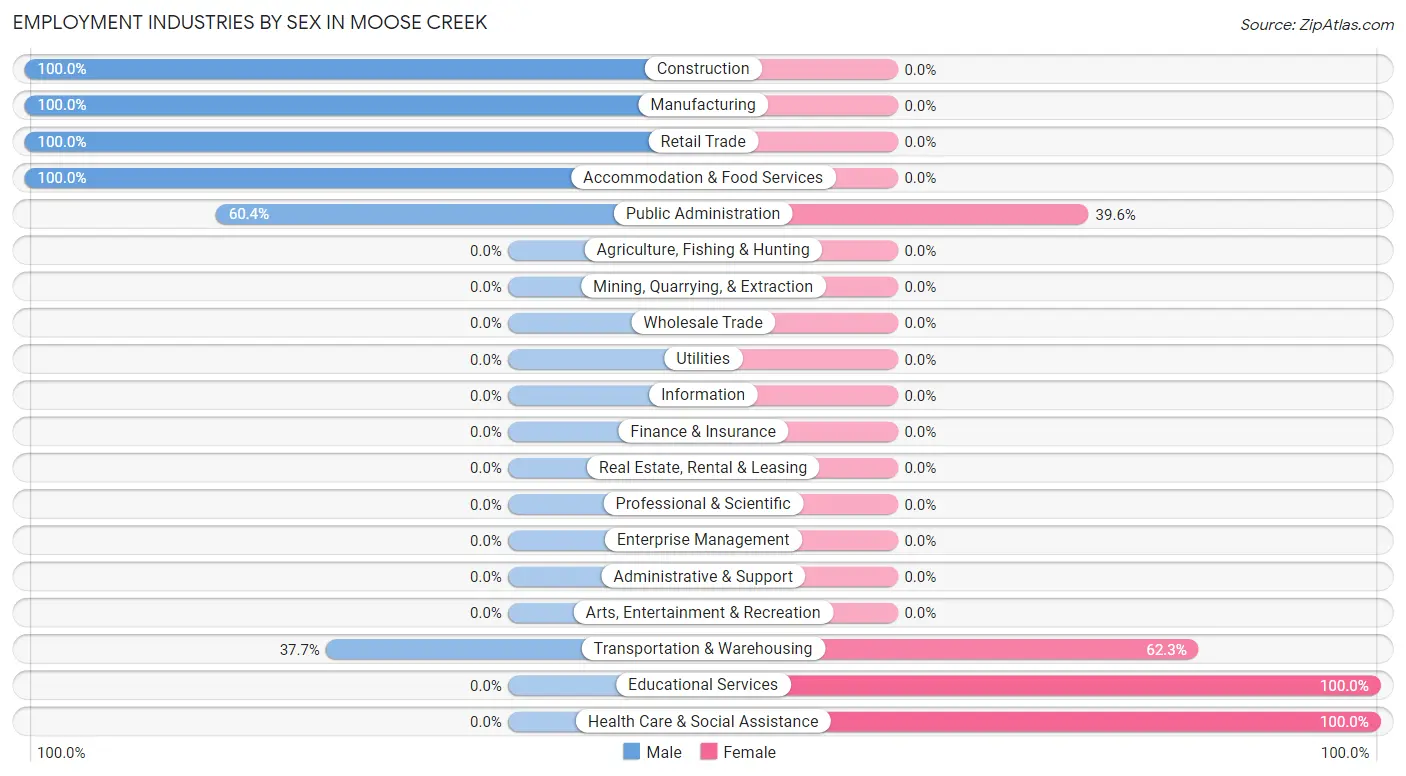
Employment Industries by Sex in Moose Creek
The Moose Creek industries that see more men than women are Construction (100.0%), Manufacturing (100.0%), and Retail Trade (100.0%), whereas the industries that tend to have a higher number of women are Educational Services (100.0%), Health Care & Social Assistance (100.0%), and Transportation & Warehousing (62.3%).
| Industry | Male | Female |
| Agriculture, Fishing & Hunting | 0 (0.0%) | 0 (0.0%) |
| Mining, Quarrying, & Extraction | 0 (0.0%) | 0 (0.0%) |
| Construction | 13 (100.0%) | 0 (0.0%) |
| Manufacturing | 16 (100.0%) | 0 (0.0%) |
| Wholesale Trade | 0 (0.0%) | 0 (0.0%) |
| Retail Trade | 15 (100.0%) | 0 (0.0%) |
| Transportation & Warehousing | 26 (37.7%) | 43 (62.3%) |
| Utilities | 0 (0.0%) | 0 (0.0%) |
| Information | 0 (0.0%) | 0 (0.0%) |
| Finance & Insurance | 0 (0.0%) | 0 (0.0%) |
| Real Estate, Rental & Leasing | 0 (0.0%) | 0 (0.0%) |
| Professional & Scientific | 0 (0.0%) | 0 (0.0%) |
| Enterprise Management | 0 (0.0%) | 0 (0.0%) |
| Administrative & Support | 0 (0.0%) | 0 (0.0%) |
| Educational Services | 0 (0.0%) | 28 (100.0%) |
| Health Care & Social Assistance | 0 (0.0%) | 15 (100.0%) |
| Arts, Entertainment & Recreation | 0 (0.0%) | 0 (0.0%) |
| Accommodation & Food Services | 29 (100.0%) | 0 (0.0%) |
| Public Administration | 29 (60.4%) | 19 (39.6%) |
| Total | 128 (52.5%) | 116 (47.5%) |
Education in Moose Creek
School Enrollment in Moose Creek
The most common levels of schooling among the 103 students in Moose Creek are college / undergraduate (49 | 47.6%), high school (23 | 22.3%), and nursery / preschool (17 | 16.5%).
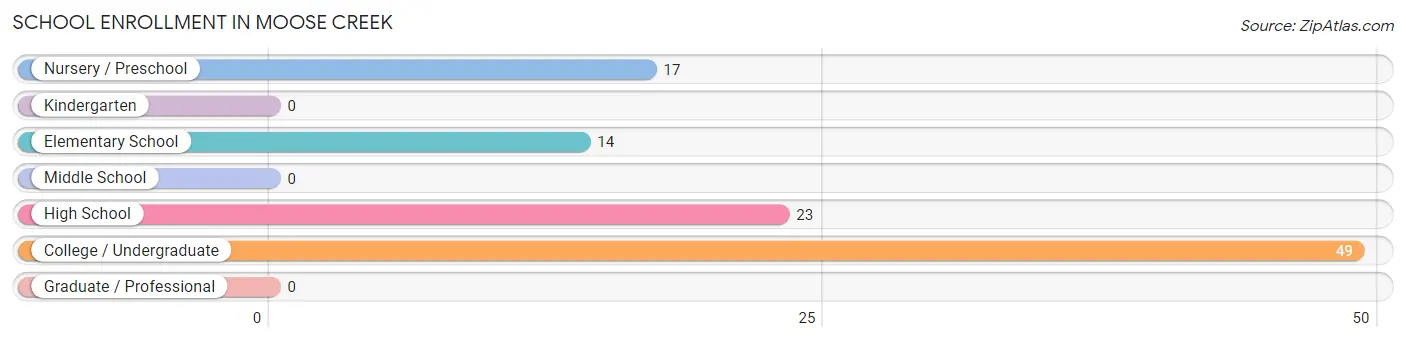
| School Level | # Students | % Students |
| Nursery / Preschool | 17 | 16.5% |
| Kindergarten | 0 | 0.0% |
| Elementary School | 14 | 13.6% |
| Middle School | 0 | 0.0% |
| High School | 23 | 22.3% |
| College / Undergraduate | 49 | 47.6% |
| Graduate / Professional | 0 | 0.0% |
| Total | 103 | 100.0% |
School Enrollment by Age by Funding Source in Moose Creek
Out of a total of 103 students who are enrolled in schools in Moose Creek, 31 (30.1%) attend a private institution, while the remaining 72 (69.9%) are enrolled in public schools. The age group of 3 to 4 year olds has the highest likelihood of being enrolled in private schools, with 17 (100.0% in the age bracket) enrolled. Conversely, the age group of 15 to 17 year olds has the lowest likelihood of being enrolled in a private school, with 23 (100.0% in the age bracket) attending a public institution.
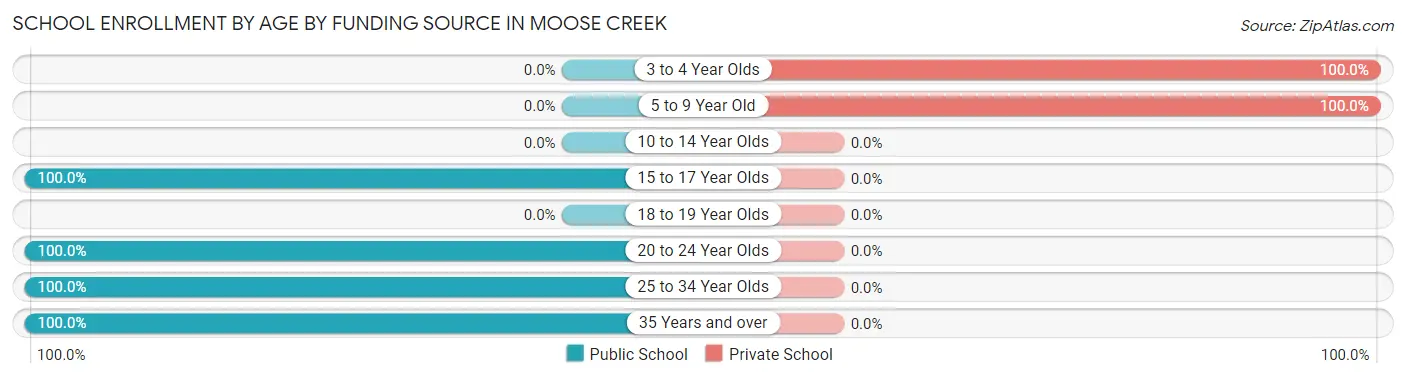
| Age Bracket | Public School | Private School |
| 3 to 4 Year Olds | 0 (0.0%) | 17 (100.0%) |
| 5 to 9 Year Old | 0 (0.0%) | 14 (100.0%) |
| 10 to 14 Year Olds | 0 (0.0%) | 0 (0.0%) |
| 15 to 17 Year Olds | 23 (100.0%) | 0 (0.0%) |
| 18 to 19 Year Olds | 0 (0.0%) | 0 (0.0%) |
| 20 to 24 Year Olds | 23 (100.0%) | 0 (0.0%) |
| 25 to 34 Year Olds | 12 (100.0%) | 0 (0.0%) |
| 35 Years and over | 14 (100.0%) | 0 (0.0%) |
| Total | 72 (69.9%) | 31 (30.1%) |
Educational Attainment by Field of Study in Moose Creek
Visual & performing arts (37 | 37.8%), education (27 | 27.6%), bio, nature & agricultural (22 | 22.5%), and business (12 | 12.2%) are the most common fields of study among 98 individuals in Moose Creek who have obtained a bachelor's degree or higher.
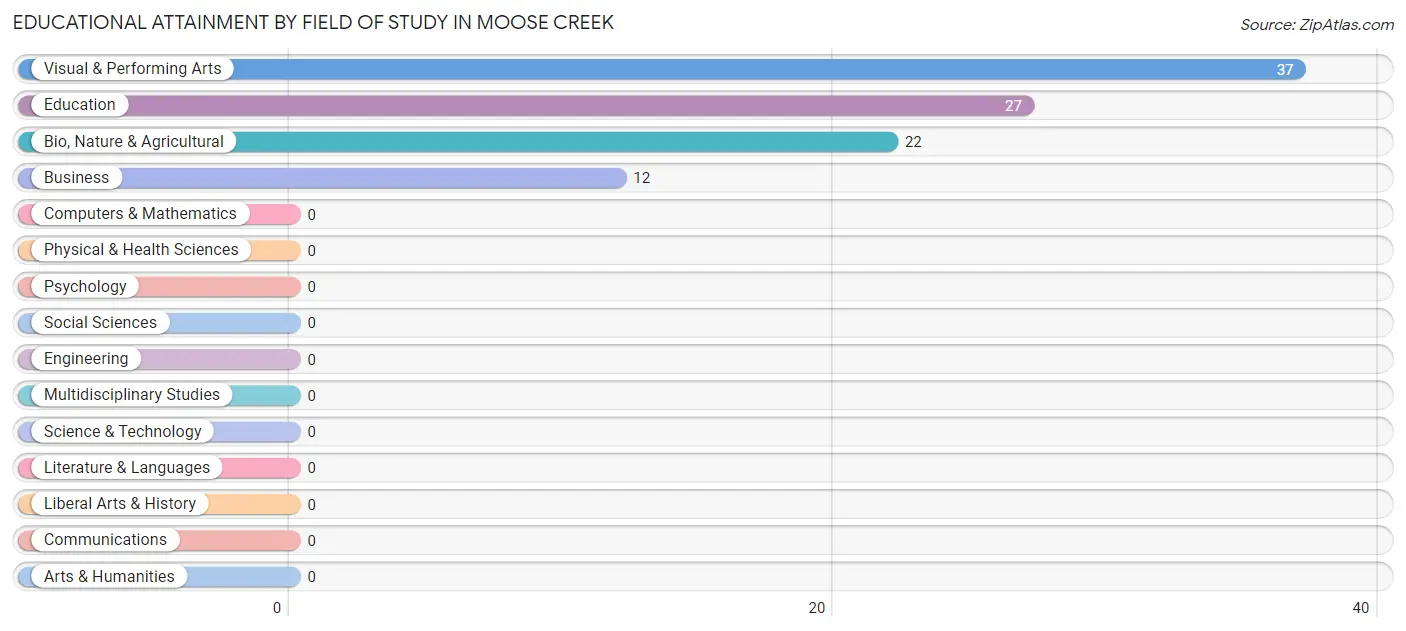
| Field of Study | # Graduates | % Graduates |
| Computers & Mathematics | 0 | 0.0% |
| Bio, Nature & Agricultural | 22 | 22.5% |
| Physical & Health Sciences | 0 | 0.0% |
| Psychology | 0 | 0.0% |
| Social Sciences | 0 | 0.0% |
| Engineering | 0 | 0.0% |
| Multidisciplinary Studies | 0 | 0.0% |
| Science & Technology | 0 | 0.0% |
| Business | 12 | 12.2% |
| Education | 27 | 27.6% |
| Literature & Languages | 0 | 0.0% |
| Liberal Arts & History | 0 | 0.0% |
| Visual & Performing Arts | 37 | 37.8% |
| Communications | 0 | 0.0% |
| Arts & Humanities | 0 | 0.0% |
| Total | 98 | 100.0% |
Transportation & Commute in Moose Creek
Vehicle Availability by Sex in Moose Creek
The most prevalent vehicle ownership categories in Moose Creek are males with 2 vehicles (81, accounting for 45.0%) and females with 2 vehicles (66, making up 69.8%).
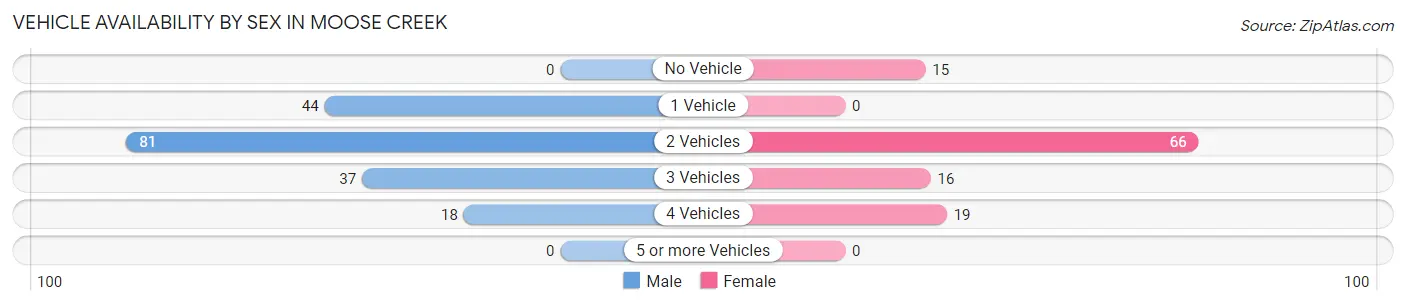
| Vehicles Available | Male | Female |
| No Vehicle | 0 (0.0%) | 15 (12.9%) |
| 1 Vehicle | 44 (24.4%) | 0 (0.0%) |
| 2 Vehicles | 81 (45.0%) | 66 (56.9%) |
| 3 Vehicles | 37 (20.6%) | 16 (13.8%) |
| 4 Vehicles | 18 (10.0%) | 19 (16.4%) |
| 5 or more Vehicles | 0 (0.0%) | 0 (0.0%) |
| Total | 180 (100.0%) | 116 (100.0%) |
Commute Time in Moose Creek
The most frequently occuring commute durations in Moose Creek are 30 to 34 minutes (93 commuters, 31.1%), 20 to 24 minutes (64 commuters, 21.4%), and 10 to 14 minutes (33 commuters, 11.0%).
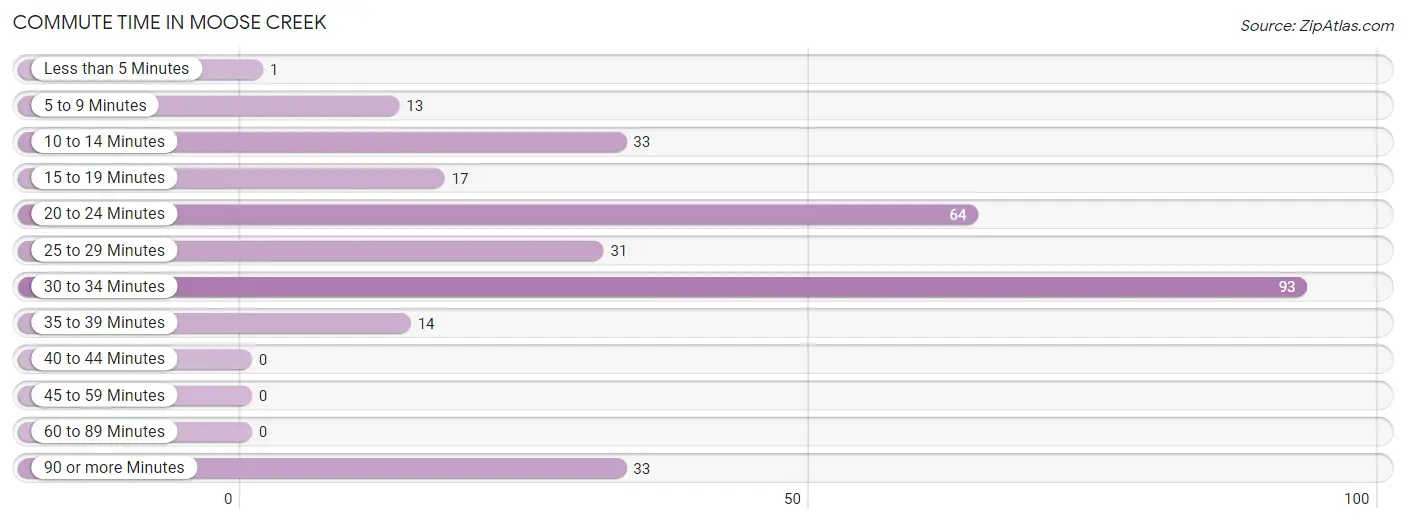
| Commute Time | # Commuters | % Commuters |
| Less than 5 Minutes | 1 | 0.3% |
| 5 to 9 Minutes | 13 | 4.3% |
| 10 to 14 Minutes | 33 | 11.0% |
| 15 to 19 Minutes | 17 | 5.7% |
| 20 to 24 Minutes | 64 | 21.4% |
| 25 to 29 Minutes | 31 | 10.4% |
| 30 to 34 Minutes | 93 | 31.1% |
| 35 to 39 Minutes | 14 | 4.7% |
| 40 to 44 Minutes | 0 | 0.0% |
| 45 to 59 Minutes | 0 | 0.0% |
| 60 to 89 Minutes | 0 | 0.0% |
| 90 or more Minutes | 33 | 11.0% |
Commute Time by Sex in Moose Creek
The most common commute times in Moose Creek are 20 to 24 minutes (49 commuters, 26.8%) for males and 30 to 34 minutes (58 commuters, 50.0%) for females.
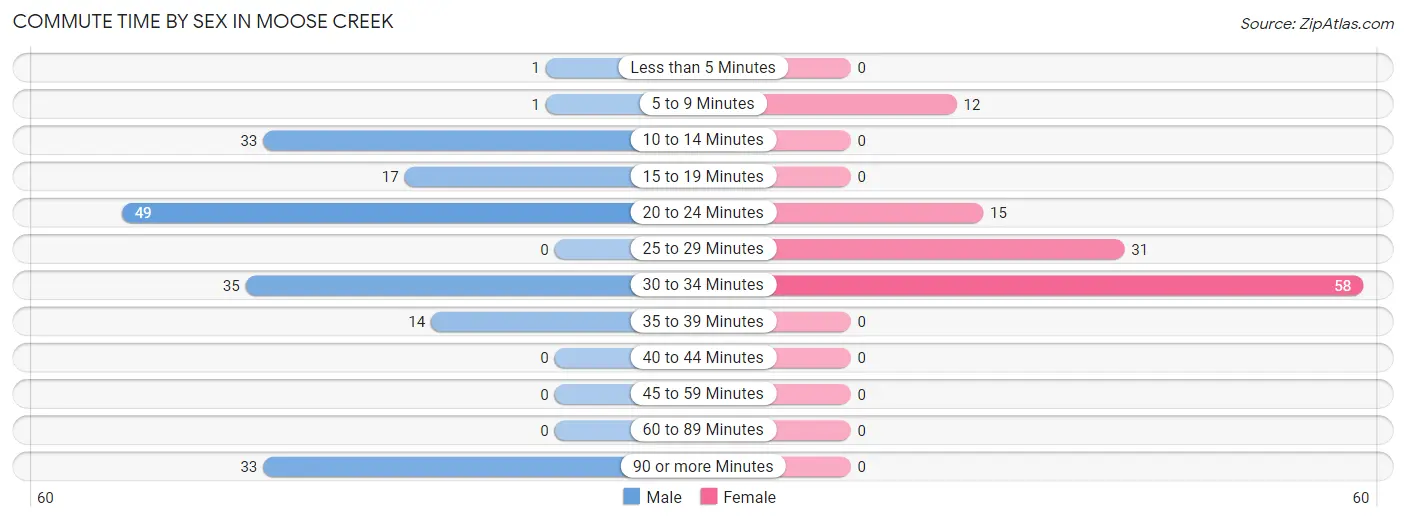
| Commute Time | Male | Female |
| Less than 5 Minutes | 1 (0.5%) | 0 (0.0%) |
| 5 to 9 Minutes | 1 (0.5%) | 12 (10.3%) |
| 10 to 14 Minutes | 33 (18.0%) | 0 (0.0%) |
| 15 to 19 Minutes | 17 (9.3%) | 0 (0.0%) |
| 20 to 24 Minutes | 49 (26.8%) | 15 (12.9%) |
| 25 to 29 Minutes | 0 (0.0%) | 31 (26.7%) |
| 30 to 34 Minutes | 35 (19.1%) | 58 (50.0%) |
| 35 to 39 Minutes | 14 (7.6%) | 0 (0.0%) |
| 40 to 44 Minutes | 0 (0.0%) | 0 (0.0%) |
| 45 to 59 Minutes | 0 (0.0%) | 0 (0.0%) |
| 60 to 89 Minutes | 0 (0.0%) | 0 (0.0%) |
| 90 or more Minutes | 33 (18.0%) | 0 (0.0%) |
Time of Departure to Work by Sex in Moose Creek
The most frequent times of departure to work in Moose Creek are 6:00 AM to 6:29 AM (41, 22.4%) for males and 7:00 AM to 7:29 AM (74, 63.8%) for females.
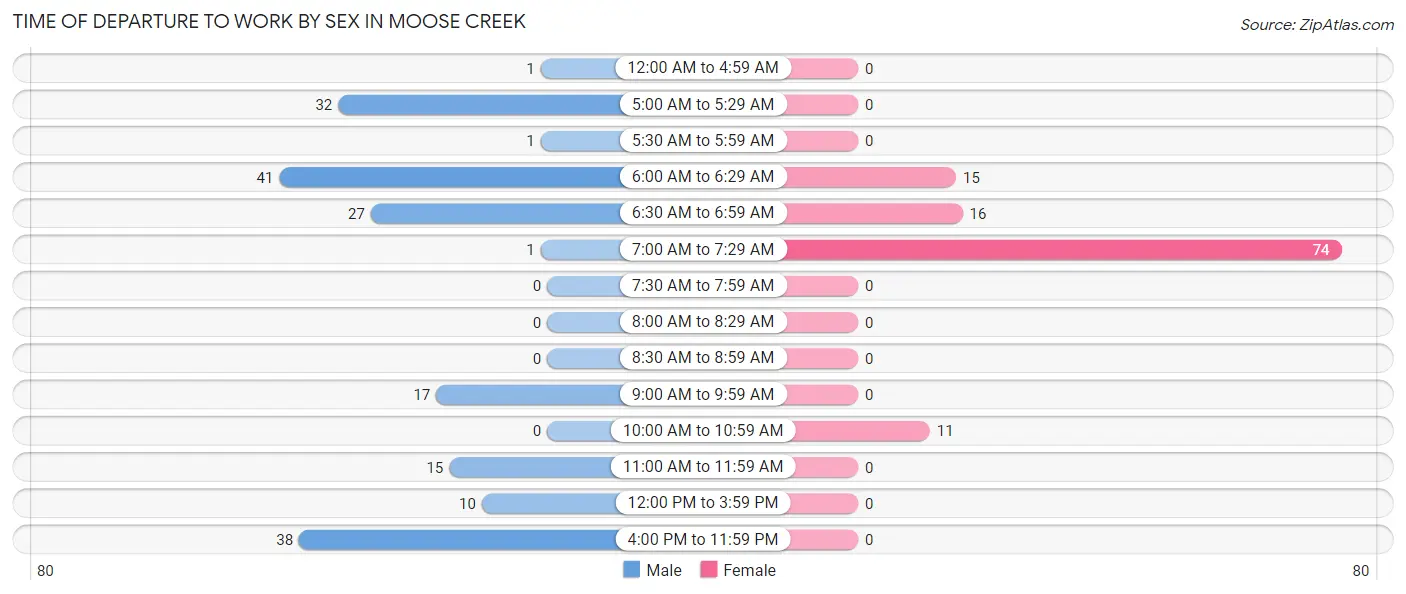
| Time of Departure | Male | Female |
| 12:00 AM to 4:59 AM | 1 (0.5%) | 0 (0.0%) |
| 5:00 AM to 5:29 AM | 32 (17.5%) | 0 (0.0%) |
| 5:30 AM to 5:59 AM | 1 (0.5%) | 0 (0.0%) |
| 6:00 AM to 6:29 AM | 41 (22.4%) | 15 (12.9%) |
| 6:30 AM to 6:59 AM | 27 (14.7%) | 16 (13.8%) |
| 7:00 AM to 7:29 AM | 1 (0.5%) | 74 (63.8%) |
| 7:30 AM to 7:59 AM | 0 (0.0%) | 0 (0.0%) |
| 8:00 AM to 8:29 AM | 0 (0.0%) | 0 (0.0%) |
| 8:30 AM to 8:59 AM | 0 (0.0%) | 0 (0.0%) |
| 9:00 AM to 9:59 AM | 17 (9.3%) | 0 (0.0%) |
| 10:00 AM to 10:59 AM | 0 (0.0%) | 11 (9.5%) |
| 11:00 AM to 11:59 AM | 15 (8.2%) | 0 (0.0%) |
| 12:00 PM to 3:59 PM | 10 (5.5%) | 0 (0.0%) |
| 4:00 PM to 11:59 PM | 38 (20.8%) | 0 (0.0%) |
| Total | 183 (100.0%) | 116 (100.0%) |
Housing Occupancy in Moose Creek
Occupancy by Ownership in Moose Creek
Of the total 242 dwellings in Moose Creek, owner-occupied units account for 115 (47.5%), while renter-occupied units make up 127 (52.5%).
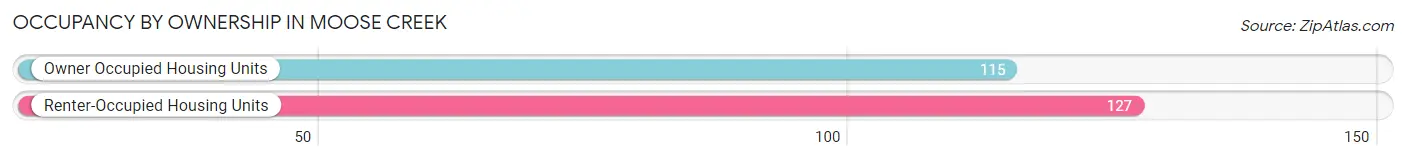
| Occupancy | # Housing Units | % Housing Units |
| Owner Occupied Housing Units | 115 | 47.5% |
| Renter-Occupied Housing Units | 127 | 52.5% |
| Total Occupied Housing Units | 242 | 100.0% |
Occupancy by Household Size in Moose Creek
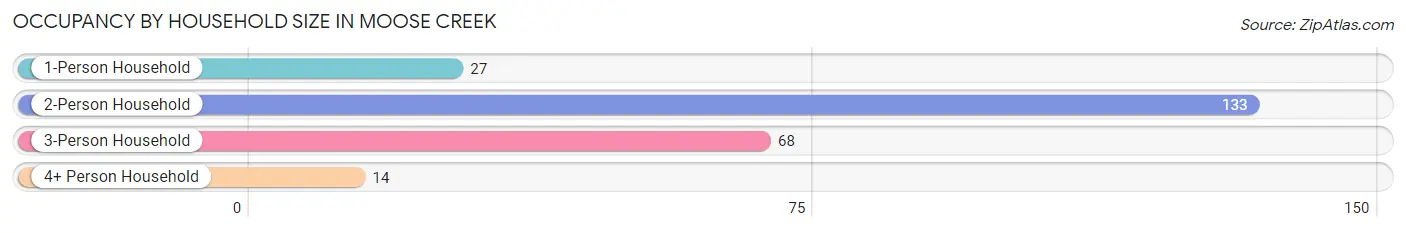
| Household Size | # Housing Units | % Housing Units |
| 1-Person Household | 27 | 11.2% |
| 2-Person Household | 133 | 55.0% |
| 3-Person Household | 68 | 28.1% |
| 4+ Person Household | 14 | 5.8% |
| Total Housing Units | 242 | 100.0% |
Occupancy by Ownership by Household Size in Moose Creek
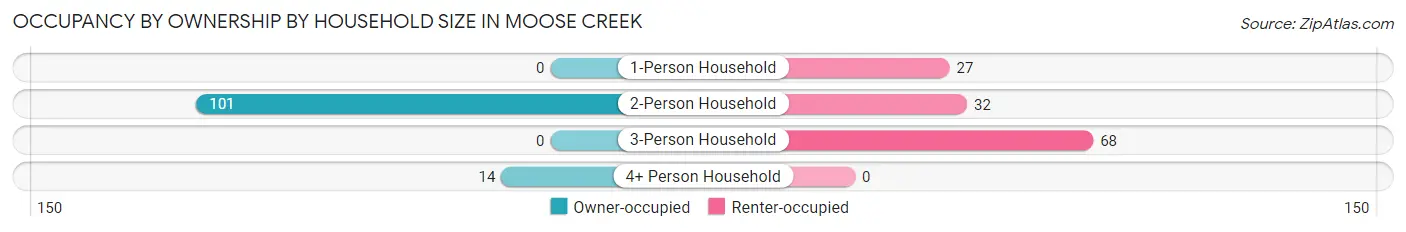
| Household Size | Owner-occupied | Renter-occupied |
| 1-Person Household | 0 (0.0%) | 27 (100.0%) |
| 2-Person Household | 101 (75.9%) | 32 (24.1%) |
| 3-Person Household | 0 (0.0%) | 68 (100.0%) |
| 4+ Person Household | 14 (100.0%) | 0 (0.0%) |
| Total Housing Units | 115 (47.5%) | 127 (52.5%) |
Occupancy by Educational Attainment in Moose Creek
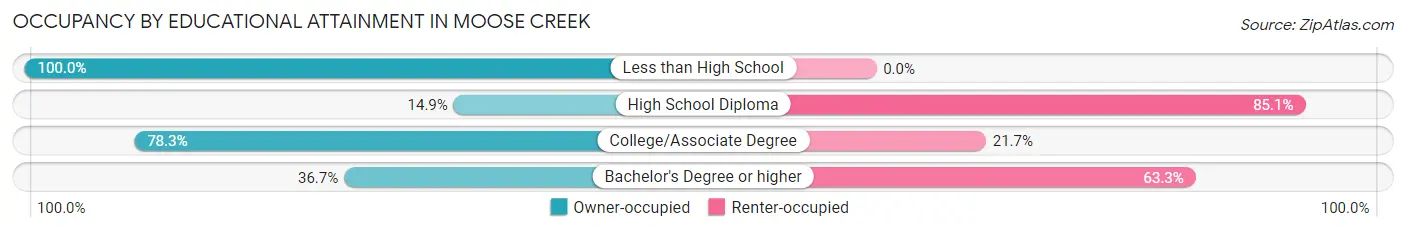
| Household Size | Owner-occupied | Renter-occupied |
| Less than High School | 26 (100.0%) | 0 (0.0%) |
| High School Diploma | 13 (14.9%) | 74 (85.1%) |
| College/Associate Degree | 54 (78.3%) | 15 (21.7%) |
| Bachelor's Degree or higher | 22 (36.7%) | 38 (63.3%) |
Occupancy by Age of Householder in Moose Creek
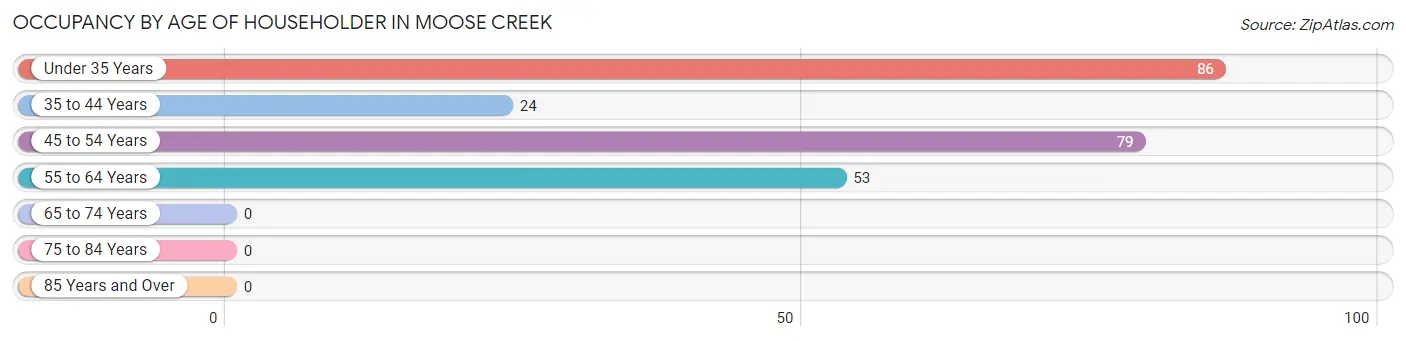
| Age Bracket | # Households | % Households |
| Under 35 Years | 86 | 35.5% |
| 35 to 44 Years | 24 | 9.9% |
| 45 to 54 Years | 79 | 32.6% |
| 55 to 64 Years | 53 | 21.9% |
| 65 to 74 Years | 0 | 0.0% |
| 75 to 84 Years | 0 | 0.0% |
| 85 Years and Over | 0 | 0.0% |
| Total | 242 | 100.0% |
Housing Finances in Moose Creek
Median Income by Occupancy in Moose Creek
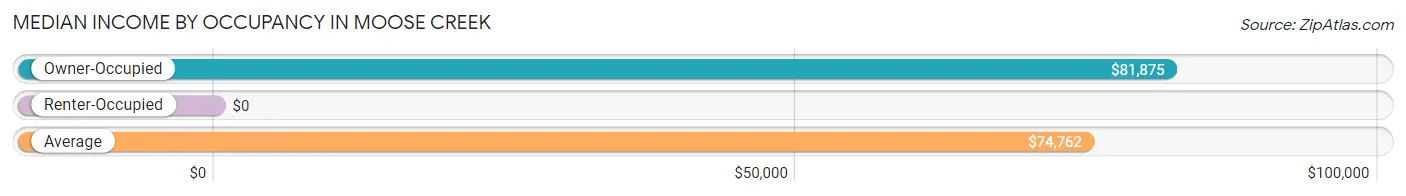
| Occupancy Type | # Households | Median Income |
| Owner-Occupied | 115 (47.5%) | $81,875 |
| Renter-Occupied | 127 (52.5%) | $0 |
| Average | 242 (100.0%) | $74,762 |
Occupancy by Householder Income Bracket in Moose Creek
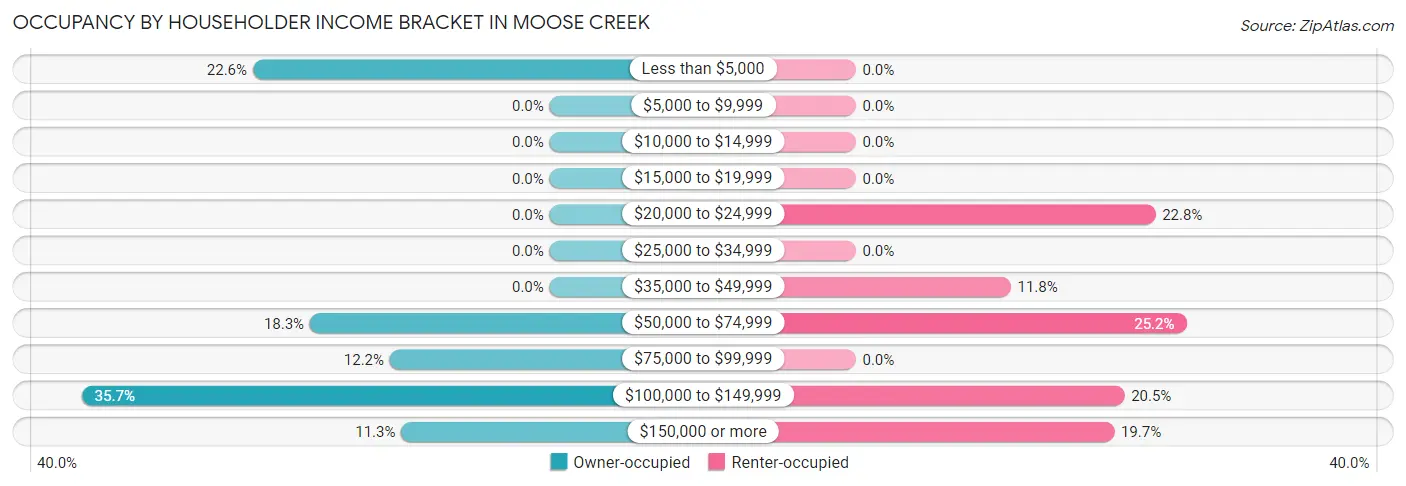
| Income Bracket | Owner-occupied | Renter-occupied |
| Less than $5,000 | 26 (22.6%) | 0 (0.0%) |
| $5,000 to $9,999 | 0 (0.0%) | 0 (0.0%) |
| $10,000 to $14,999 | 0 (0.0%) | 0 (0.0%) |
| $15,000 to $19,999 | 0 (0.0%) | 0 (0.0%) |
| $20,000 to $24,999 | 0 (0.0%) | 29 (22.8%) |
| $25,000 to $34,999 | 0 (0.0%) | 0 (0.0%) |
| $35,000 to $49,999 | 0 (0.0%) | 15 (11.8%) |
| $50,000 to $74,999 | 21 (18.3%) | 32 (25.2%) |
| $75,000 to $99,999 | 14 (12.2%) | 0 (0.0%) |
| $100,000 to $149,999 | 41 (35.6%) | 26 (20.5%) |
| $150,000 or more | 13 (11.3%) | 25 (19.7%) |
| Total | 115 (100.0%) | 127 (100.0%) |
Monthly Housing Cost Tiers in Moose Creek
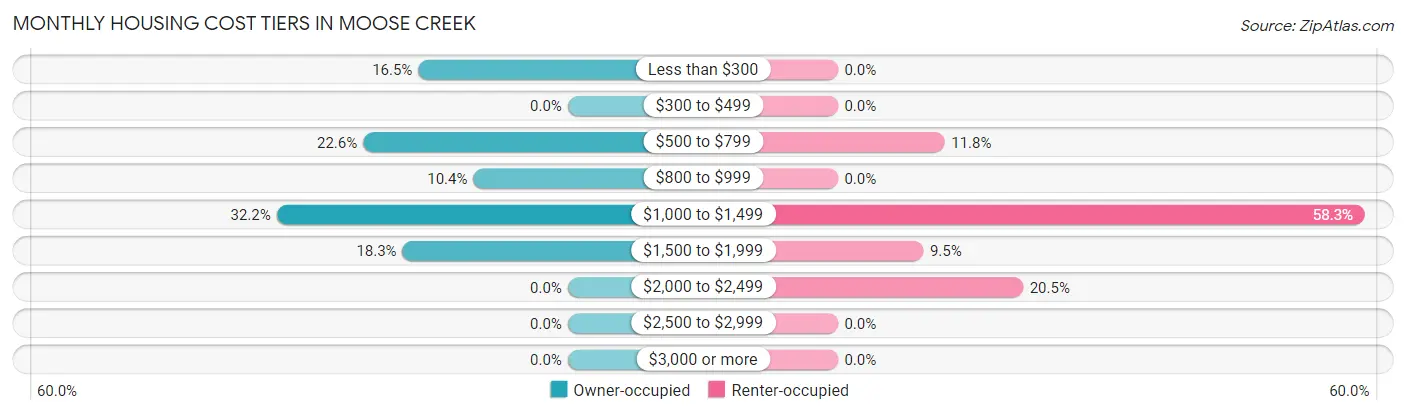
| Monthly Cost | Owner-occupied | Renter-occupied |
| Less than $300 | 19 (16.5%) | 0 (0.0%) |
| $300 to $499 | 0 (0.0%) | 0 (0.0%) |
| $500 to $799 | 26 (22.6%) | 15 (11.8%) |
| $800 to $999 | 12 (10.4%) | 0 (0.0%) |
| $1,000 to $1,499 | 37 (32.2%) | 74 (58.3%) |
| $1,500 to $1,999 | 21 (18.3%) | 12 (9.5%) |
| $2,000 to $2,499 | 0 (0.0%) | 26 (20.5%) |
| $2,500 to $2,999 | 0 (0.0%) | 0 (0.0%) |
| $3,000 or more | 0 (0.0%) | 0 (0.0%) |
| Total | 115 (100.0%) | 127 (100.0%) |
Physical Housing Characteristics in Moose Creek
Housing Structures in Moose Creek
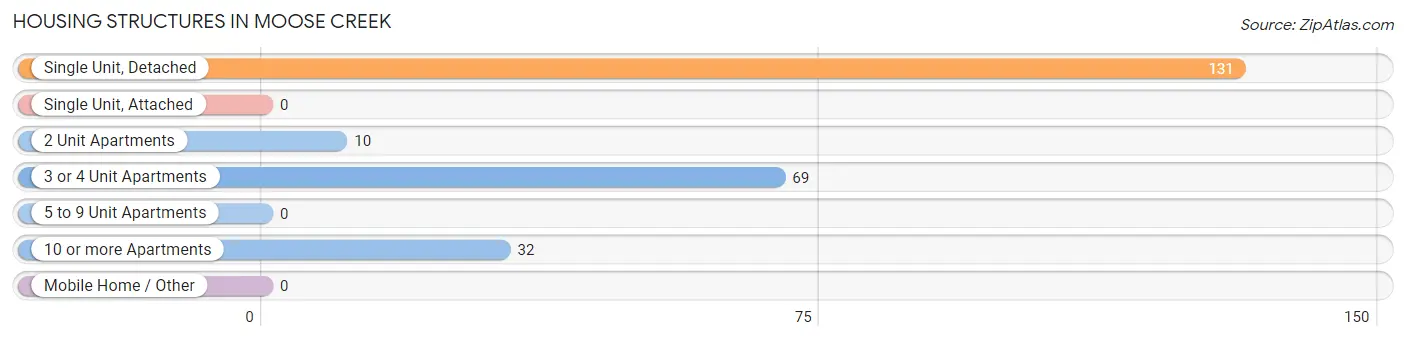
| Structure Type | # Housing Units | % Housing Units |
| Single Unit, Detached | 131 | 54.1% |
| Single Unit, Attached | 0 | 0.0% |
| 2 Unit Apartments | 10 | 4.1% |
| 3 or 4 Unit Apartments | 69 | 28.5% |
| 5 to 9 Unit Apartments | 0 | 0.0% |
| 10 or more Apartments | 32 | 13.2% |
| Mobile Home / Other | 0 | 0.0% |
| Total | 242 | 100.0% |
Housing Structures by Occupancy in Moose Creek
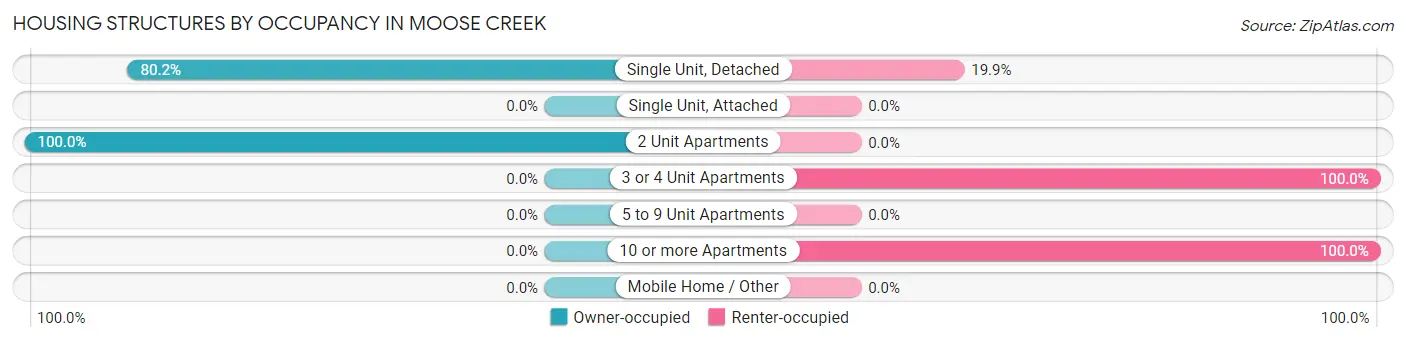
| Structure Type | Owner-occupied | Renter-occupied |
| Single Unit, Detached | 105 (80.1%) | 26 (19.9%) |
| Single Unit, Attached | 0 (0.0%) | 0 (0.0%) |
| 2 Unit Apartments | 10 (100.0%) | 0 (0.0%) |
| 3 or 4 Unit Apartments | 0 (0.0%) | 69 (100.0%) |
| 5 to 9 Unit Apartments | 0 (0.0%) | 0 (0.0%) |
| 10 or more Apartments | 0 (0.0%) | 32 (100.0%) |
| Mobile Home / Other | 0 (0.0%) | 0 (0.0%) |
| Total | 115 (47.5%) | 127 (52.5%) |
Housing Structures by Number of Rooms in Moose Creek
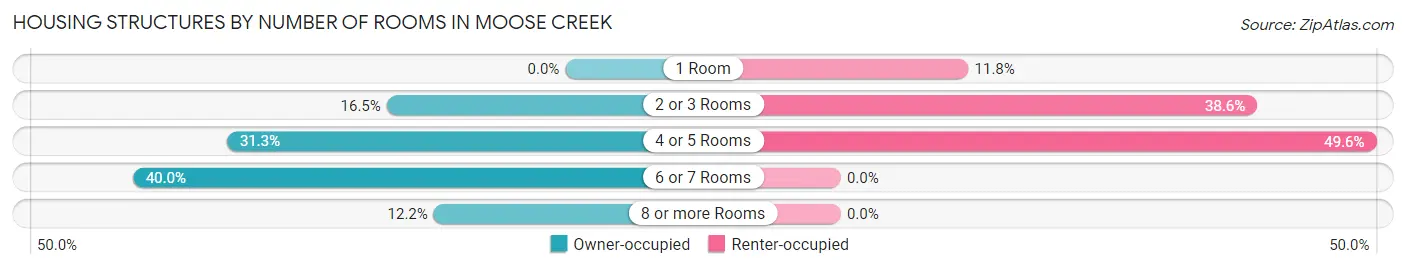
| Number of Rooms | Owner-occupied | Renter-occupied |
| 1 Room | 0 (0.0%) | 15 (11.8%) |
| 2 or 3 Rooms | 19 (16.5%) | 49 (38.6%) |
| 4 or 5 Rooms | 36 (31.3%) | 63 (49.6%) |
| 6 or 7 Rooms | 46 (40.0%) | 0 (0.0%) |
| 8 or more Rooms | 14 (12.2%) | 0 (0.0%) |
| Total | 115 (100.0%) | 127 (100.0%) |
Housing Structure by Heating Type in Moose Creek
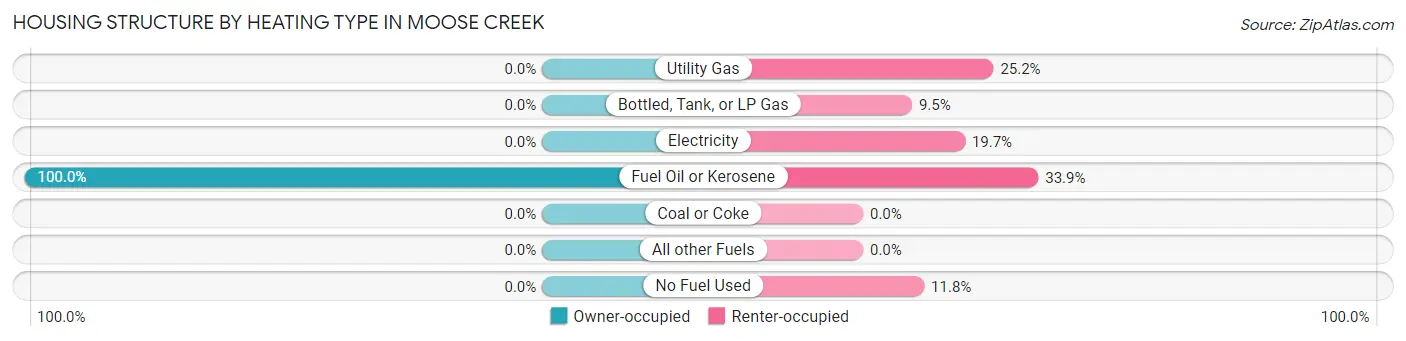
| Heating Type | Owner-occupied | Renter-occupied |
| Utility Gas | 0 (0.0%) | 32 (25.2%) |
| Bottled, Tank, or LP Gas | 0 (0.0%) | 12 (9.5%) |
| Electricity | 0 (0.0%) | 25 (19.7%) |
| Fuel Oil or Kerosene | 115 (100.0%) | 43 (33.9%) |
| Coal or Coke | 0 (0.0%) | 0 (0.0%) |
| All other Fuels | 0 (0.0%) | 0 (0.0%) |
| No Fuel Used | 0 (0.0%) | 15 (11.8%) |
| Total | 115 (100.0%) | 127 (100.0%) |
Household Vehicle Usage in Moose Creek
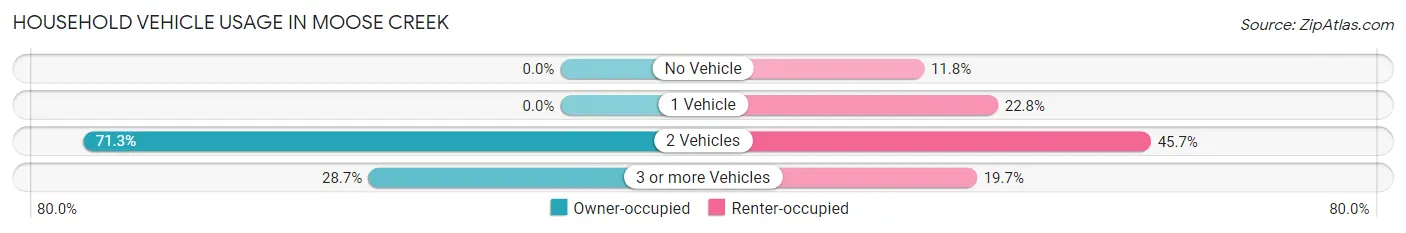
| Vehicles per Household | Owner-occupied | Renter-occupied |
| No Vehicle | 0 (0.0%) | 15 (11.8%) |
| 1 Vehicle | 0 (0.0%) | 29 (22.8%) |
| 2 Vehicles | 82 (71.3%) | 58 (45.7%) |
| 3 or more Vehicles | 33 (28.7%) | 25 (19.7%) |
| Total | 115 (100.0%) | 127 (100.0%) |
Real Estate & Mortgages in Moose Creek
Real Estate and Mortgage Overview in Moose Creek
| Characteristic | Without Mortgage | With Mortgage |
| Housing Units | 81 | 34 |
| Median Property Value | - | - |
| Median Household Income | - | - |
| Monthly Housing Costs | - | - |
| Real Estate Taxes | - | - |
Property Value by Mortgage Status in Moose Creek
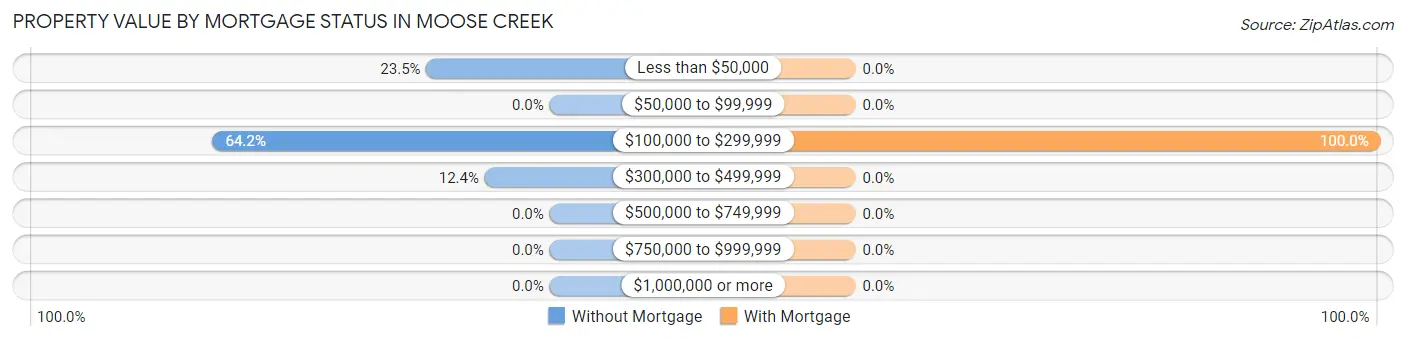
| Property Value | Without Mortgage | With Mortgage |
| Less than $50,000 | 19 (23.5%) | 0 (0.0%) |
| $50,000 to $99,999 | 0 (0.0%) | 0 (0.0%) |
| $100,000 to $299,999 | 52 (64.2%) | 34 (100.0%) |
| $300,000 to $499,999 | 10 (12.3%) | 0 (0.0%) |
| $500,000 to $749,999 | 0 (0.0%) | 0 (0.0%) |
| $750,000 to $999,999 | 0 (0.0%) | 0 (0.0%) |
| $1,000,000 or more | 0 (0.0%) | 0 (0.0%) |
| Total | 81 (100.0%) | 34 (100.0%) |
Household Income by Mortgage Status in Moose Creek
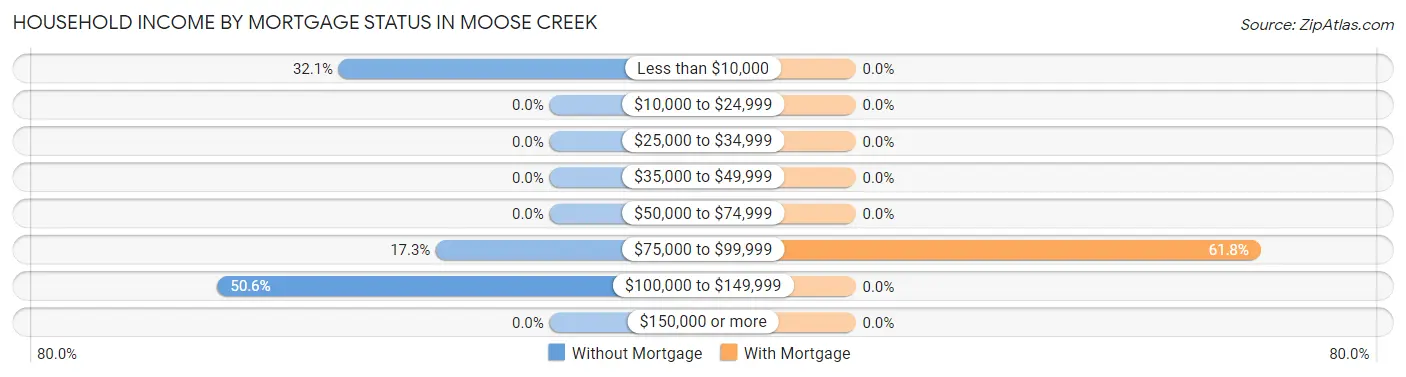
| Household Income | Without Mortgage | With Mortgage |
| Less than $10,000 | 26 (32.1%) | 0 (0.0%) |
| $10,000 to $24,999 | 0 (0.0%) | 0 (0.0%) |
| $25,000 to $34,999 | 0 (0.0%) | 0 (0.0%) |
| $35,000 to $49,999 | 0 (0.0%) | 0 (0.0%) |
| $50,000 to $74,999 | 0 (0.0%) | 0 (0.0%) |
| $75,000 to $99,999 | 14 (17.3%) | 21 (61.8%) |
| $100,000 to $149,999 | 41 (50.6%) | 0 (0.0%) |
| $150,000 or more | 0 (0.0%) | 0 (0.0%) |
| Total | 81 (100.0%) | 34 (100.0%) |
Property Value to Household Income Ratio in Moose Creek
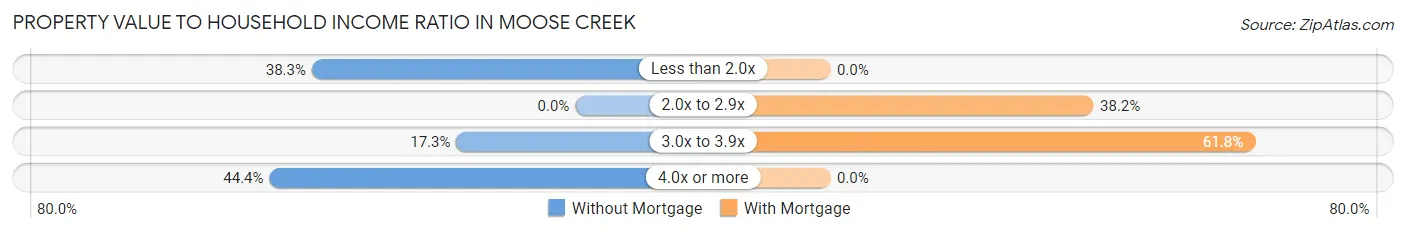
| Value-to-Income Ratio | Without Mortgage | With Mortgage |
| Less than 2.0x | 31 (38.3%) | 0 (0.0%) |
| 2.0x to 2.9x | 0 (0.0%) | 13 (38.2%) |
| 3.0x to 3.9x | 14 (17.3%) | 21 (61.8%) |
| 4.0x or more | 36 (44.4%) | 0 (0.0%) |
| Total | 81 (100.0%) | 34 (100.0%) |
Real Estate Taxes by Mortgage Status in Moose Creek
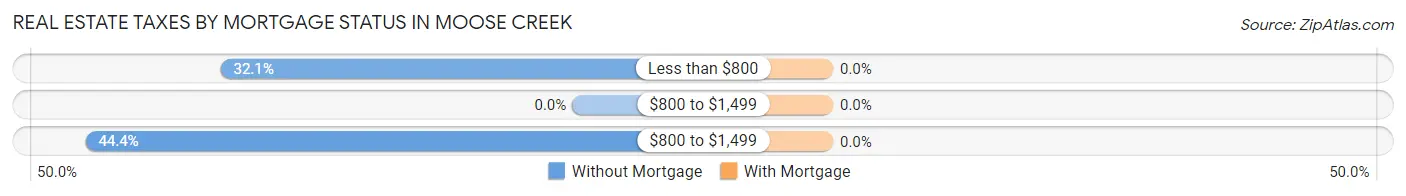
| Property Taxes | Without Mortgage | With Mortgage |
| Less than $800 | 26 (32.1%) | 0 (0.0%) |
| $800 to $1,499 | 0 (0.0%) | 0 (0.0%) |
| $800 to $1,499 | 36 (44.4%) | 0 (0.0%) |
| Total | 81 (100.0%) | 34 (100.0%) |
Health & Disability in Moose Creek
Health Insurance Coverage by Age in Moose Creek
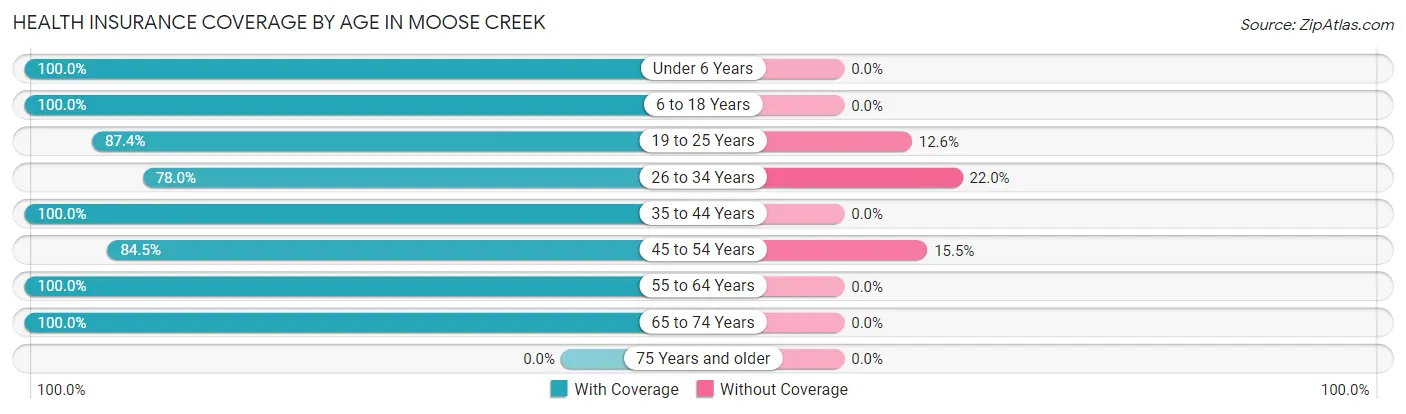
| Age Bracket | With Coverage | Without Coverage |
| Under 6 Years | 17 (100.0%) | 0 (0.0%) |
| 6 to 18 Years | 37 (100.0%) | 0 (0.0%) |
| 19 to 25 Years | 118 (87.4%) | 17 (12.6%) |
| 26 to 34 Years | 46 (78.0%) | 13 (22.0%) |
| 35 to 44 Years | 51 (100.0%) | 0 (0.0%) |
| 45 to 54 Years | 82 (84.5%) | 15 (15.5%) |
| 55 to 64 Years | 80 (100.0%) | 0 (0.0%) |
| 65 to 74 Years | 53 (100.0%) | 0 (0.0%) |
| 75 Years and older | 0 (0.0%) | 0 (0.0%) |
| Total | 484 (91.5%) | 45 (8.5%) |
Health Insurance Coverage by Citizenship Status in Moose Creek
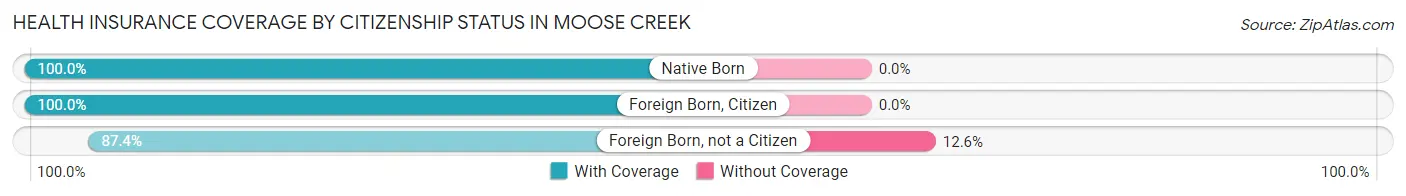
| Citizenship Status | With Coverage | Without Coverage |
| Native Born | 17 (100.0%) | 0 (0.0%) |
| Foreign Born, Citizen | 37 (100.0%) | 0 (0.0%) |
| Foreign Born, not a Citizen | 118 (87.4%) | 17 (12.6%) |
Health Insurance Coverage by Household Income in Moose Creek
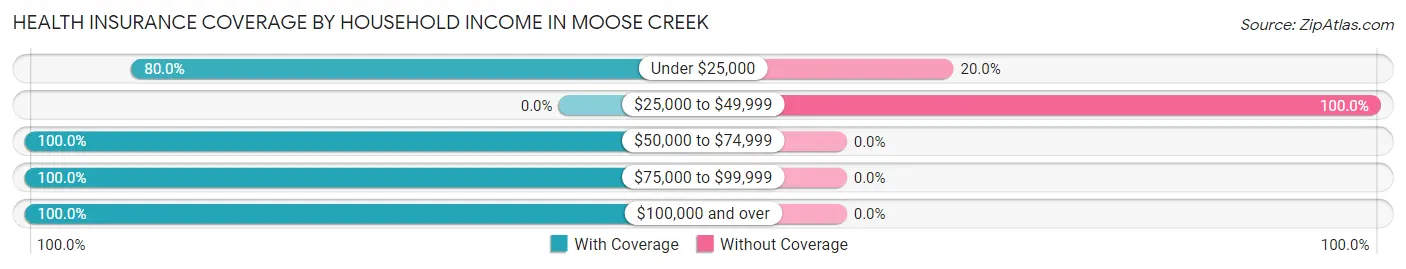
| Household Income | With Coverage | Without Coverage |
| Under $25,000 | 116 (80.0%) | 29 (20.0%) |
| $25,000 to $49,999 | 0 (0.0%) | 15 (100.0%) |
| $50,000 to $74,999 | 82 (100.0%) | 0 (0.0%) |
| $75,000 to $99,999 | 61 (100.0%) | 0 (0.0%) |
| $100,000 and over | 222 (100.0%) | 0 (0.0%) |
Public vs Private Health Insurance Coverage by Age in Moose Creek
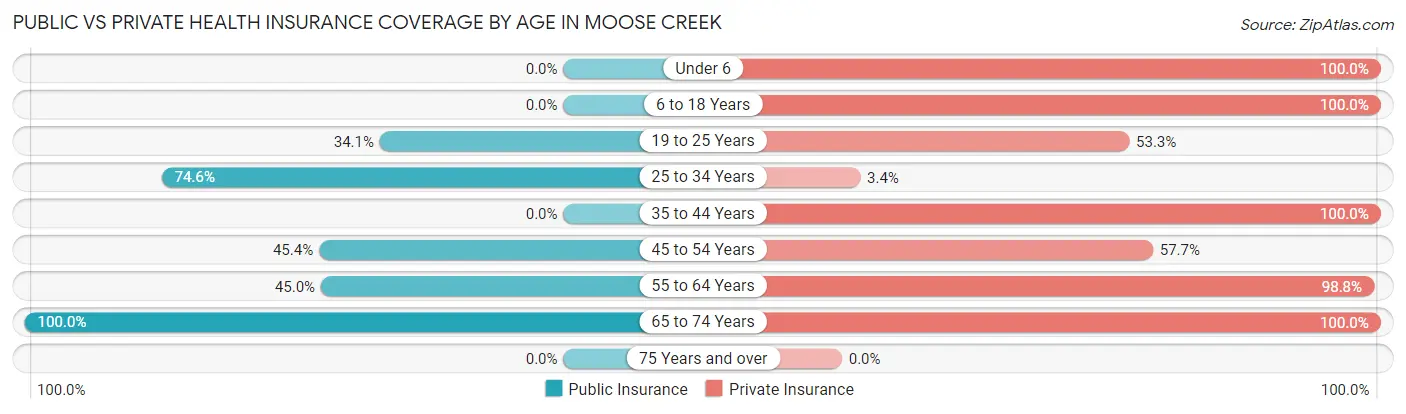
| Age Bracket | Public Insurance | Private Insurance |
| Under 6 | 0 (0.0%) | 17 (100.0%) |
| 6 to 18 Years | 0 (0.0%) | 37 (100.0%) |
| 19 to 25 Years | 46 (34.1%) | 72 (53.3%) |
| 25 to 34 Years | 44 (74.6%) | 2 (3.4%) |
| 35 to 44 Years | 0 (0.0%) | 51 (100.0%) |
| 45 to 54 Years | 44 (45.4%) | 56 (57.7%) |
| 55 to 64 Years | 36 (45.0%) | 79 (98.8%) |
| 65 to 74 Years | 53 (100.0%) | 53 (100.0%) |
| 75 Years and over | 0 (0.0%) | 0 (0.0%) |
| Total | 223 (42.2%) | 367 (69.4%) |
Disability Status by Sex by Age in Moose Creek
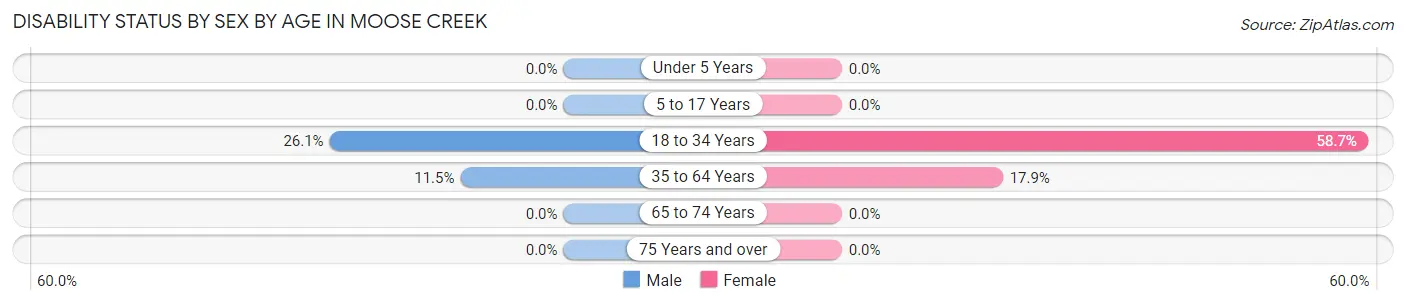
| Age Bracket | Male | Female |
| Under 5 Years | 0 (0.0%) | 0 (0.0%) |
| 5 to 17 Years | 0 (0.0%) | 0 (0.0%) |
| 18 to 34 Years | 31 (26.1%) | 44 (58.7%) |
| 35 to 64 Years | 14 (11.5%) | 19 (17.9%) |
| 65 to 74 Years | 0 (0.0%) | 0 (0.0%) |
| 75 Years and over | 0 (0.0%) | 0 (0.0%) |
Disability Class by Sex by Age in Moose Creek
Disability Class: Hearing Difficulty
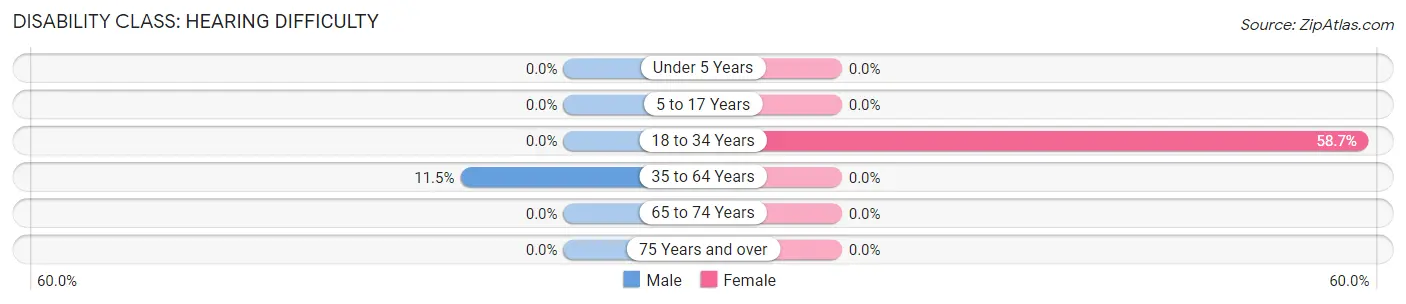
| Age Bracket | Male | Female |
| Under 5 Years | 0 (0.0%) | 0 (0.0%) |
| 5 to 17 Years | 0 (0.0%) | 0 (0.0%) |
| 18 to 34 Years | 0 (0.0%) | 44 (58.7%) |
| 35 to 64 Years | 14 (11.5%) | 0 (0.0%) |
| 65 to 74 Years | 0 (0.0%) | 0 (0.0%) |
| 75 Years and over | 0 (0.0%) | 0 (0.0%) |
Disability Class: Vision Difficulty
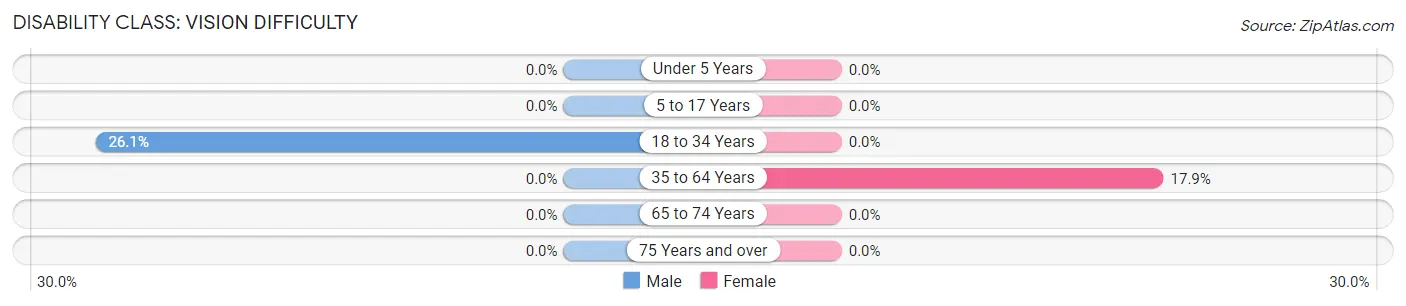
| Age Bracket | Male | Female |
| Under 5 Years | 0 (0.0%) | 0 (0.0%) |
| 5 to 17 Years | 0 (0.0%) | 0 (0.0%) |
| 18 to 34 Years | 31 (26.1%) | 0 (0.0%) |
| 35 to 64 Years | 0 (0.0%) | 19 (17.9%) |
| 65 to 74 Years | 0 (0.0%) | 0 (0.0%) |
| 75 Years and over | 0 (0.0%) | 0 (0.0%) |
Disability Class: Cognitive Difficulty
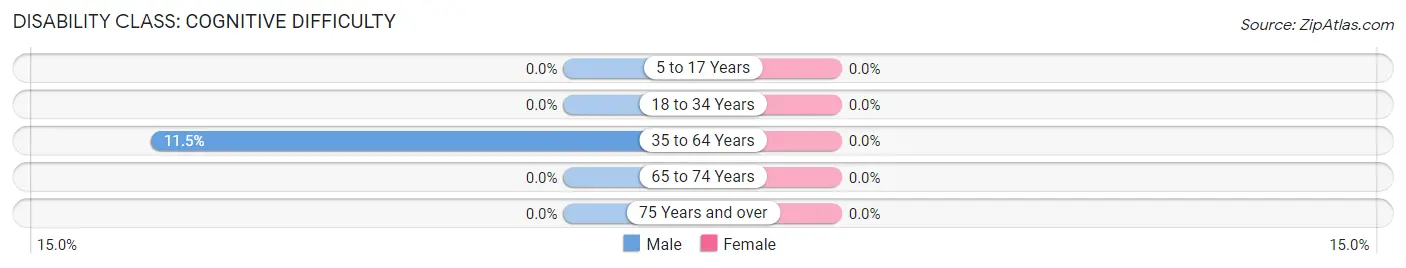
| Age Bracket | Male | Female |
| 5 to 17 Years | 0 (0.0%) | 0 (0.0%) |
| 18 to 34 Years | 0 (0.0%) | 0 (0.0%) |
| 35 to 64 Years | 14 (11.5%) | 0 (0.0%) |
| 65 to 74 Years | 0 (0.0%) | 0 (0.0%) |
| 75 Years and over | 0 (0.0%) | 0 (0.0%) |
Disability Class: Ambulatory Difficulty
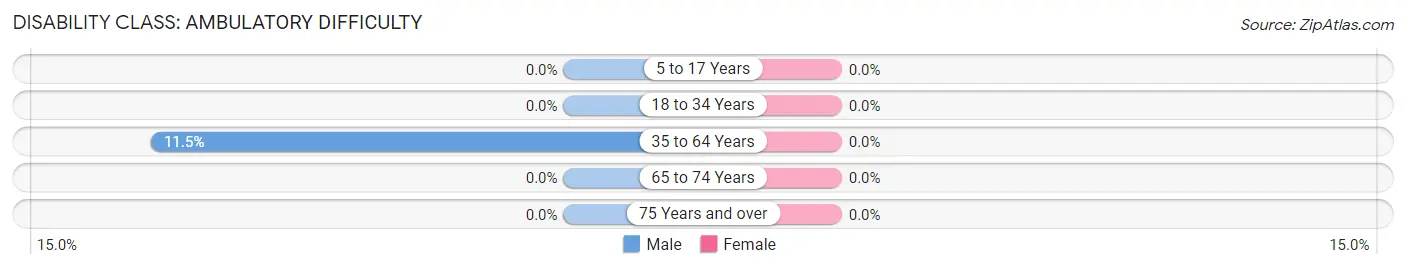
| Age Bracket | Male | Female |
| 5 to 17 Years | 0 (0.0%) | 0 (0.0%) |
| 18 to 34 Years | 0 (0.0%) | 0 (0.0%) |
| 35 to 64 Years | 14 (11.5%) | 0 (0.0%) |
| 65 to 74 Years | 0 (0.0%) | 0 (0.0%) |
| 75 Years and over | 0 (0.0%) | 0 (0.0%) |
Disability Class: Self-Care Difficulty
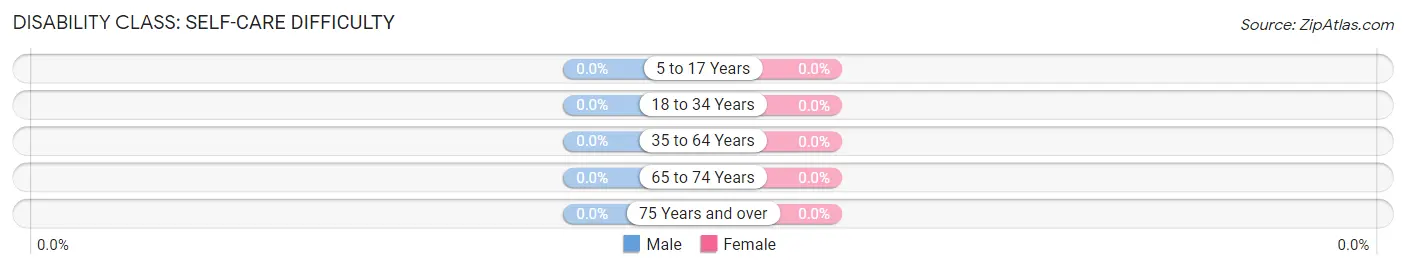
| Age Bracket | Male | Female |
| 5 to 17 Years | 0 (0.0%) | 0 (0.0%) |
| 18 to 34 Years | 0 (0.0%) | 0 (0.0%) |
| 35 to 64 Years | 0 (0.0%) | 0 (0.0%) |
| 65 to 74 Years | 0 (0.0%) | 0 (0.0%) |
| 75 Years and over | 0 (0.0%) | 0 (0.0%) |
Technology Access in Moose Creek
Computing Device Access in Moose Creek
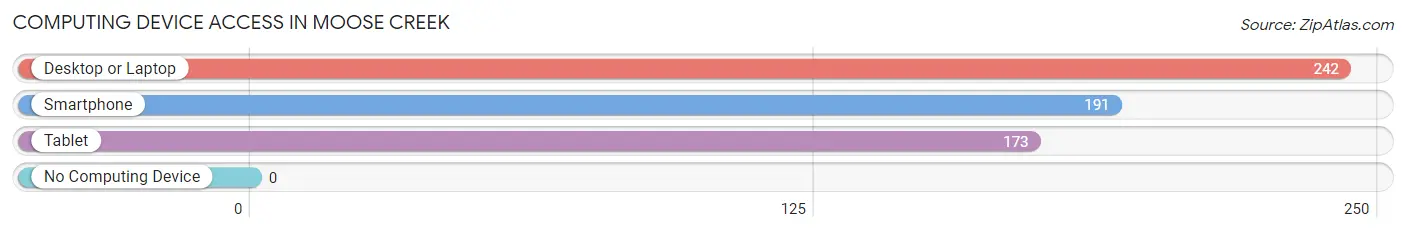
| Device Type | # Households | % Households |
| Desktop or Laptop | 242 | 100.0% |
| Smartphone | 191 | 78.9% |
| Tablet | 173 | 71.5% |
| No Computing Device | 0 | 0.0% |
| Total | 242 | 100.0% |
Internet Access in Moose Creek
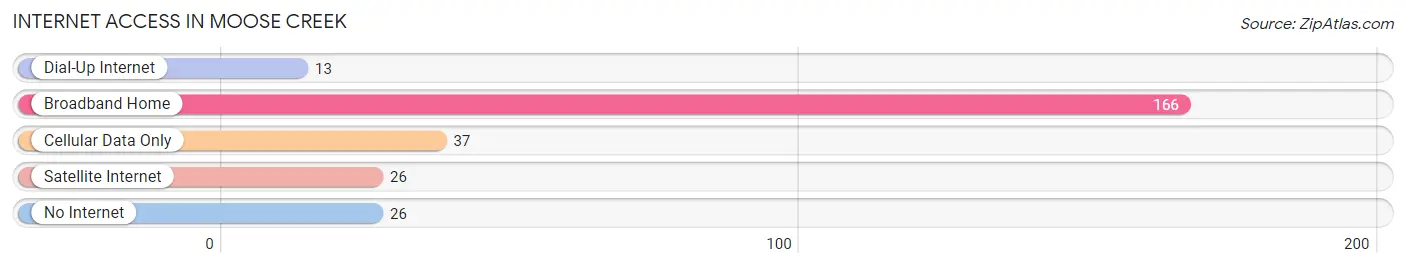
| Internet Type | # Households | % Households |
| Dial-Up Internet | 13 | 5.4% |
| Broadband Home | 166 | 68.6% |
| Cellular Data Only | 37 | 15.3% |
| Satellite Internet | 26 | 10.7% |
| No Internet | 26 | 10.7% |
| Total | 242 | 100.0% |
Moose Creek Summary
Moose Creek, Alaska is a small unincorporated community located in the Yukon-Koyukuk Census Area of Alaska. It is situated on the south bank of the Yukon River, approximately 40 miles east of the city of Fairbanks. The population of Moose Creek was estimated to be around 50 people in 2020.
History
Moose Creek was first established in the late 1800s as a trading post for the local Athabascan people. The trading post was operated by a man named John Moore, who was a trapper and trader from the Lower 48. Moore was the first non-Native American to settle in the area. He built a cabin and trading post near the mouth of Moose Creek, which is where the community gets its name.
In the early 1900s, the Alaska Railroad was built through the area, bringing more settlers to the area. The railroad also brought in supplies and goods, which allowed the community to grow and prosper.
In the 1950s, the Alaska Native Claims Settlement Act (ANCSA) was passed, which allowed the local Athabascan people to claim land in the area. This allowed the community to expand and develop further.
Geography
Moose Creek is located in the Yukon-Koyukuk Census Area of Alaska. It is situated on the south bank of the Yukon River, approximately 40 miles east of the city of Fairbanks. The area is mostly flat, with some rolling hills and mountains in the distance. The climate is subarctic, with cold winters and mild summers.
The area is home to a variety of wildlife, including moose, caribou, wolves, bears, and many species of birds. The Yukon River is also home to a variety of fish, including salmon, grayling, and whitefish.
Economy
The economy of Moose Creek is largely based on subsistence activities, such as hunting, fishing, and trapping. Many of the residents also work in the nearby oil and gas industry, as well as in the tourism industry.
The community is also home to a small store, which sells basic supplies and groceries. There is also a post office in the community.
Demographics
The population of Moose Creek was estimated to be around 50 people in 2020. The majority of the population is Native American, with the majority being of Athabascan descent. The median age of the population is around 40 years old. The median household income is around $30,000 per year.
Conclusion
Moose Creek, Alaska is a small unincorporated community located in the Yukon-Koyukuk Census Area of Alaska. It was first established in the late 1800s as a trading post for the local Athabascan people. The economy of Moose Creek is largely based on subsistence activities, such as hunting, fishing, and trapping. The population of Moose Creek was estimated to be around 50 people in 2020. The majority of the population is Native American, with the majority being of Athabascan descent. The median age of the population is around 40 years old. The median household income is around $30,000 per year.
Common Questions
What is Per Capita Income in Moose Creek?
Per Capita income in Moose Creek is $41,271.
What is the Median Family Income in Moose Creek?
Median Family Income in Moose Creek is $74,762.
What is the Median Household income in Moose Creek?
Median Household Income in Moose Creek is $74,762.
What is Inequality or Gini Index in Moose Creek?
Inequality or Gini Index in Moose Creek is 0.46.
What is the Total Population of Moose Creek?
Total Population of Moose Creek is 584.
What is the Total Male Population of Moose Creek?
Total Male Population of Moose Creek is 366.
What is the Total Female Population of Moose Creek?
Total Female Population of Moose Creek is 218.
What is the Ratio of Males per 100 Females in Moose Creek?
There are 167.89 Males per 100 Females in Moose Creek.
What is the Ratio of Females per 100 Males in Moose Creek?
There are 59.56 Females per 100 Males in Moose Creek.
What is the Median Population Age in Moose Creek?
Median Population Age in Moose Creek is 29.8 Years.
What is the Average Family Size in Moose Creek
Average Family Size in Moose Creek is 2.5 People.
What is the Average Household Size in Moose Creek
Average Household Size in Moose Creek is 2.4 People.
How Large is the Labor Force in Moose Creek?
There are 300 People in the Labor Forcein in Moose Creek.
What is the Percentage of People in the Labor Force in Moose Creek?
54.2% of People are in the Labor Force in Moose Creek.
What is the Unemployment Rate in Moose Creek?
Unemployment Rate in Moose Creek is 0.4%.