Chickaloon, AK Map & Demographics
Chickaloon Map
Chickaloon Overview
$30,229
PER CAPITA INCOME
$59,375
AVG FAMILY INCOME
$51,875
AVG HOUSEHOLD INCOME
0.40
INEQUALITY / GINI INDEX
283
TOTAL POPULATION
142
MALE POPULATION
141
FEMALE POPULATION
100.71
MALES / 100 FEMALES
99.30
FEMALES / 100 MALES
59.0
MEDIAN AGE
2.9
AVG FAMILY SIZE
2.4
AVG HOUSEHOLD SIZE
85
LABOR FORCE [ PEOPLE ]
36.0%
PERCENT IN LABOR FORCE
23.5%
UNEMPLOYMENT RATE
Chickaloon Area Codes
Income in Chickaloon
Income Overview in Chickaloon
Per Capita Income in Chickaloon is $30,229, while median incomes of families and households are $59,375 and $51,875 respectively.
| Characteristic | Number | Measure |
| Per Capita Income | 283 | $30,229 |
| Median Family Income | 72 | $59,375 |
| Mean Family Income | 72 | $81,378 |
| Median Household Income | 120 | $51,875 |
| Mean Household Income | 120 | $70,171 |
| Income Deficit | 72 | $0 |
| Wage / Income Gap (%) | 283 | 0.00% |
| Wage / Income Gap ($) | 283 | 100.00¢ per $1 |
| Gini / Inequality Index | 283 | 0.40 |
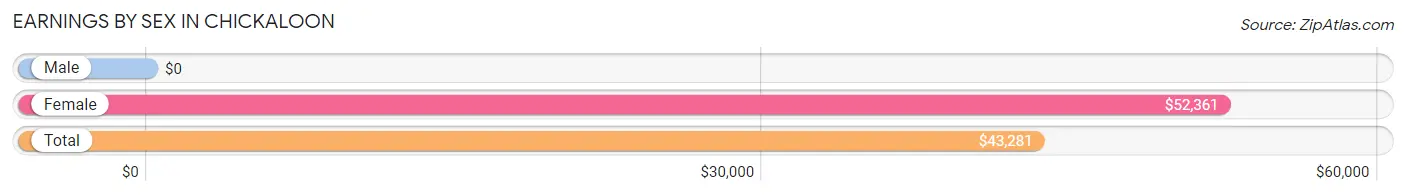
Earnings by Sex in Chickaloon
| Sex | Number | Average Earnings |
| Male | 60 (67.4%) | $0 |
| Female | 29 (32.6%) | $52,361 |
| Total | 89 (100.0%) | $43,281 |
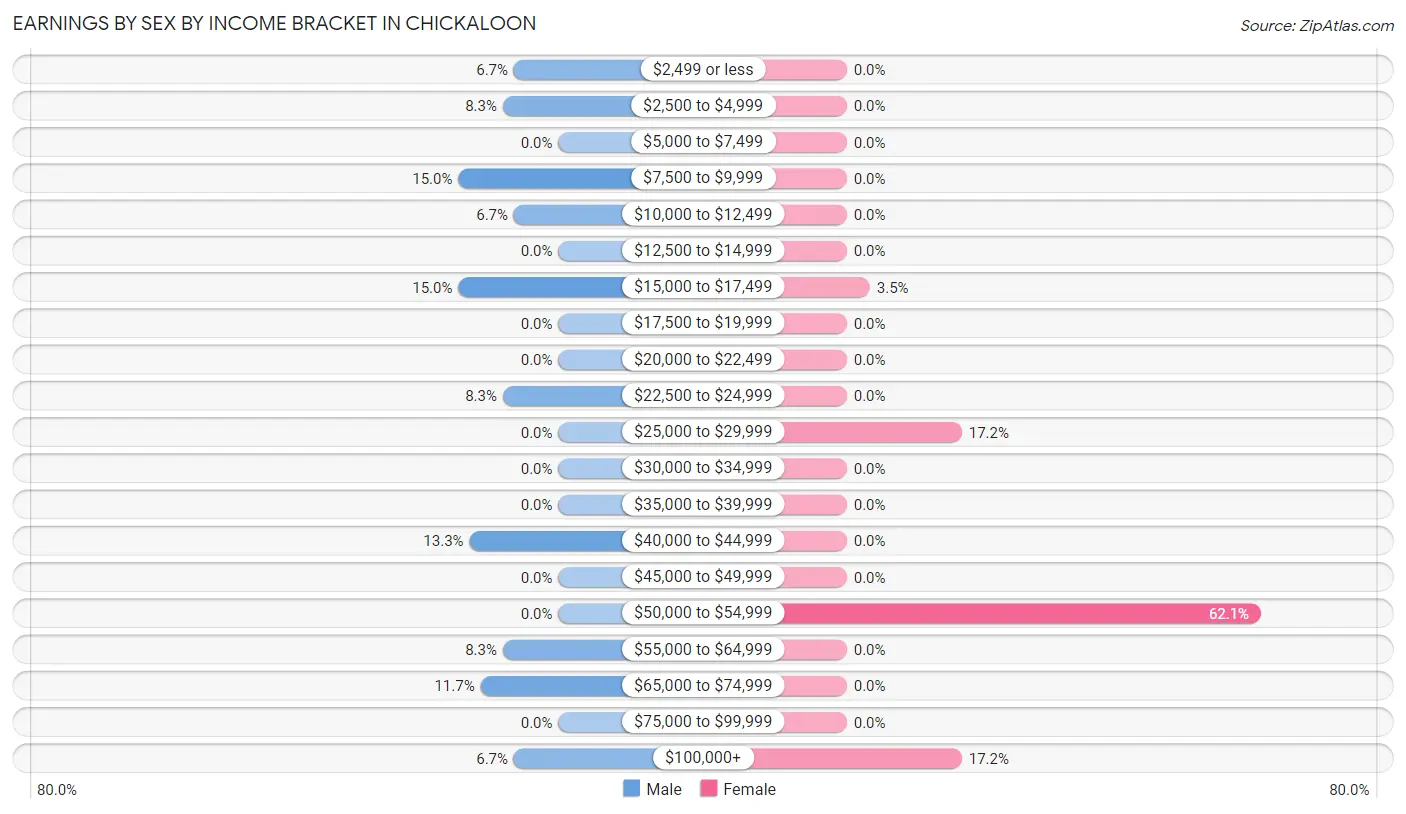
Earnings by Sex by Income Bracket in Chickaloon
The most common earnings brackets in Chickaloon are $7,500 to $9,999 for men (9 | 15.0%) and $50,000 to $54,999 for women (18 | 62.1%).
| Income | Male | Female |
| $2,499 or less | 4 (6.7%) | 0 (0.0%) |
| $2,500 to $4,999 | 5 (8.3%) | 0 (0.0%) |
| $5,000 to $7,499 | 0 (0.0%) | 0 (0.0%) |
| $7,500 to $9,999 | 9 (15.0%) | 0 (0.0%) |
| $10,000 to $12,499 | 4 (6.7%) | 0 (0.0%) |
| $12,500 to $14,999 | 0 (0.0%) | 0 (0.0%) |
| $15,000 to $17,499 | 9 (15.0%) | 1 (3.5%) |
| $17,500 to $19,999 | 0 (0.0%) | 0 (0.0%) |
| $20,000 to $22,499 | 0 (0.0%) | 0 (0.0%) |
| $22,500 to $24,999 | 5 (8.3%) | 0 (0.0%) |
| $25,000 to $29,999 | 0 (0.0%) | 5 (17.2%) |
| $30,000 to $34,999 | 0 (0.0%) | 0 (0.0%) |
| $35,000 to $39,999 | 0 (0.0%) | 0 (0.0%) |
| $40,000 to $44,999 | 8 (13.3%) | 0 (0.0%) |
| $45,000 to $49,999 | 0 (0.0%) | 0 (0.0%) |
| $50,000 to $54,999 | 0 (0.0%) | 18 (62.1%) |
| $55,000 to $64,999 | 5 (8.3%) | 0 (0.0%) |
| $65,000 to $74,999 | 7 (11.7%) | 0 (0.0%) |
| $75,000 to $99,999 | 0 (0.0%) | 0 (0.0%) |
| $100,000+ | 4 (6.7%) | 5 (17.2%) |
| Total | 60 (100.0%) | 29 (100.0%) |
Earnings by Sex by Educational Attainment in Chickaloon

| Educational Attainment | Male Income | Female Income |
| Less than High School | - | - |
| High School Diploma | - | - |
| College or Associate's Degree | $43,594 | $0 |
| Bachelor's Degree | - | - |
| Graduate Degree | - | - |
| Total | - | - |
Family Income in Chickaloon
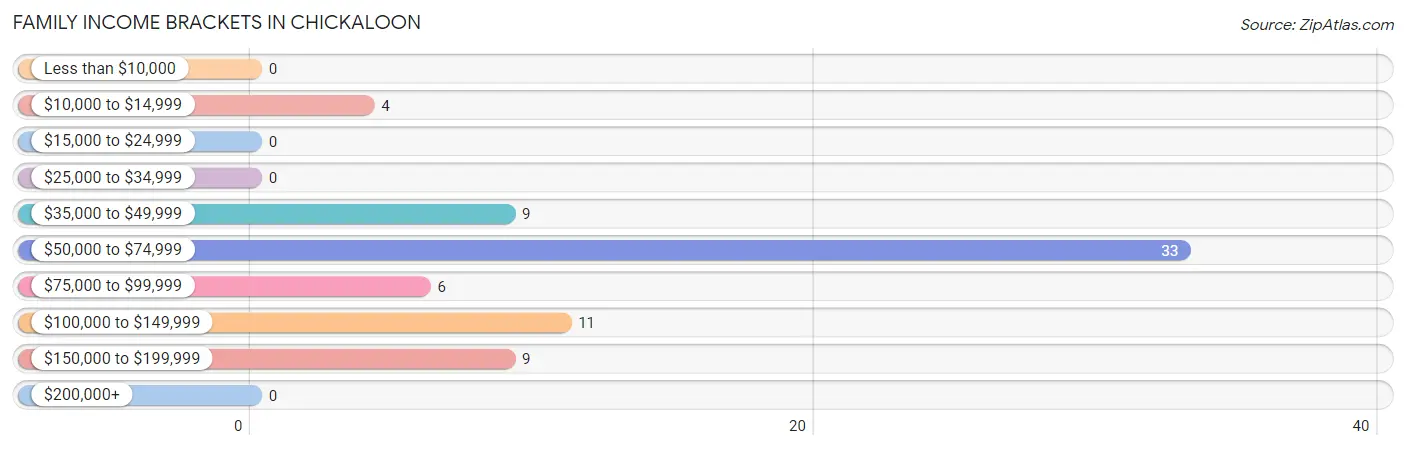
Family Income Brackets in Chickaloon
According to the Chickaloon family income data, there are 33 families falling into the $50,000 to $74,999 income range, which is the most common income bracket and makes up 45.8% of all families.
| Income Bracket | # Families | % Families |
| Less than $10,000 | 0 | 0.0% |
| $10,000 to $14,999 | 4 | 5.6% |
| $15,000 to $24,999 | 0 | 0.0% |
| $25,000 to $34,999 | 0 | 0.0% |
| $35,000 to $49,999 | 9 | 12.5% |
| $50,000 to $74,999 | 33 | 45.8% |
| $75,000 to $99,999 | 6 | 8.3% |
| $100,000 to $149,999 | 11 | 15.3% |
| $150,000 to $199,999 | 9 | 12.5% |
| $200,000+ | 0 | 0.0% |
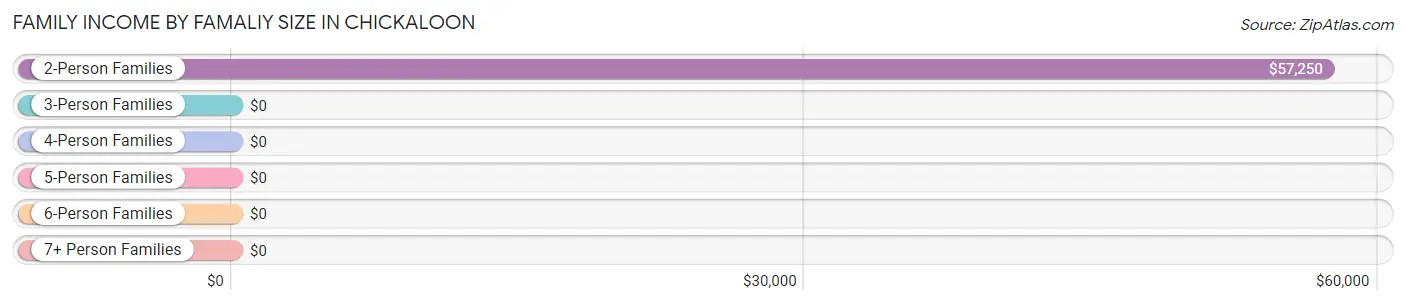
Family Income by Famaliy Size in Chickaloon
2-person families (59 | 81.9%) account for the highest median family income in Chickaloon with $57,250 per family, while 2-person families (59 | 81.9%) have the highest median income of $28,625 per family member.
| Income Bracket | # Families | Median Income |
| 2-Person Families | 59 (81.9%) | $57,250 |
| 3-Person Families | 5 (6.9%) | $0 |
| 4-Person Families | 0 (0.0%) | $0 |
| 5-Person Families | 0 (0.0%) | $0 |
| 6-Person Families | 0 (0.0%) | $0 |
| 7+ Person Families | 8 (11.1%) | $0 |
| Total | 72 (100.0%) | $59,375 |
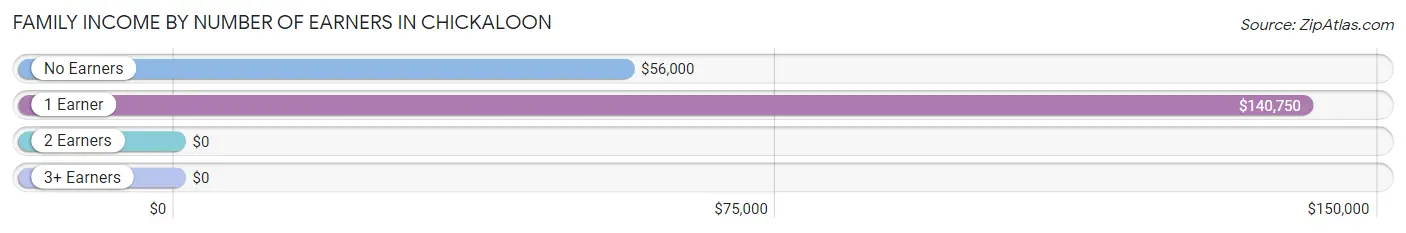
Family Income by Number of Earners in Chickaloon
| Number of Earners | # Families | Median Income |
| No Earners | 44 (61.1%) | $56,000 |
| 1 Earner | 15 (20.8%) | $140,750 |
| 2 Earners | 5 (6.9%) | $0 |
| 3+ Earners | 8 (11.1%) | $0 |
| Total | 72 (100.0%) | $59,375 |
Household Income in Chickaloon
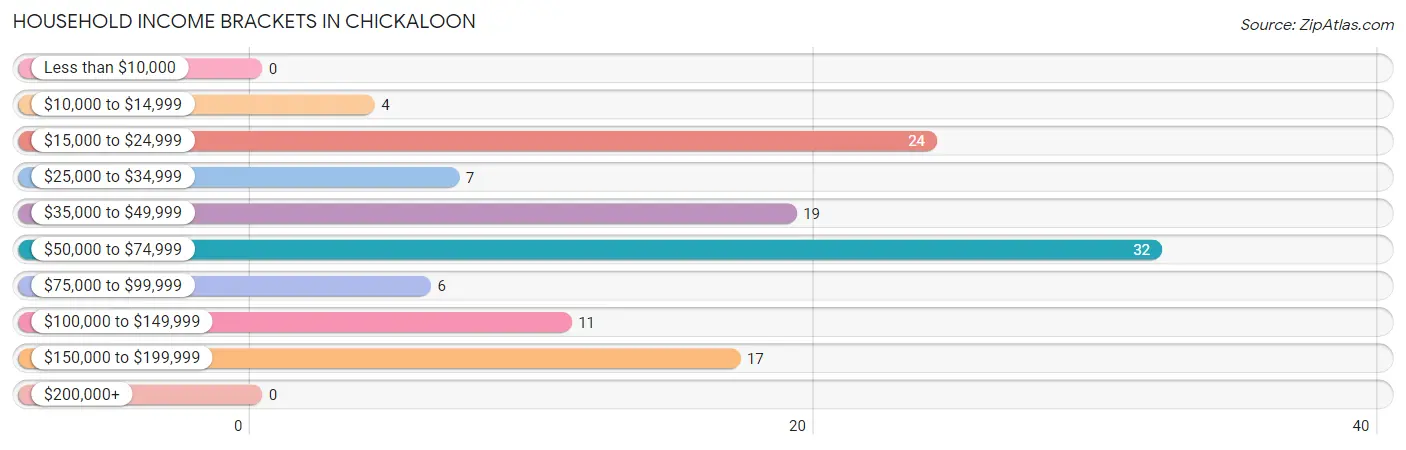
Household Income Brackets in Chickaloon
With 32 households falling in the category, the $50,000 to $74,999 income range is the most frequent in Chickaloon, accounting for 26.7% of all households.
| Income Bracket | # Households | % Households |
| Less than $10,000 | 0 | 0.0% |
| $10,000 to $14,999 | 4 | 3.3% |
| $15,000 to $24,999 | 24 | 20.0% |
| $25,000 to $34,999 | 7 | 5.8% |
| $35,000 to $49,999 | 19 | 15.8% |
| $50,000 to $74,999 | 32 | 26.7% |
| $75,000 to $99,999 | 6 | 5.0% |
| $100,000 to $149,999 | 11 | 9.2% |
| $150,000 to $199,999 | 17 | 14.2% |
| $200,000+ | 0 | 0.0% |
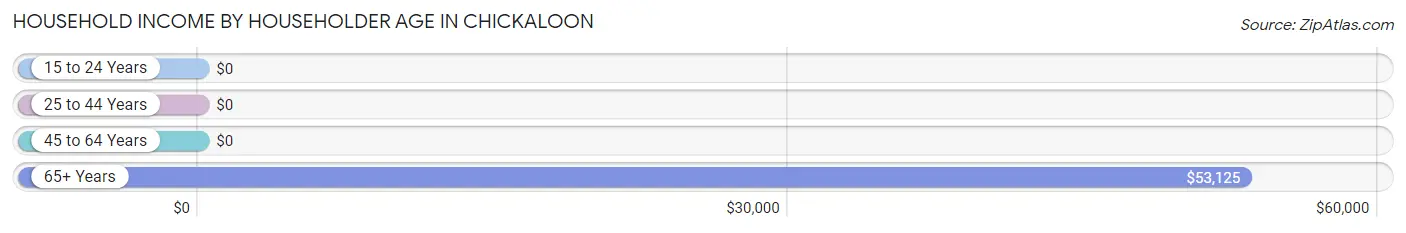
Household Income by Householder Age in Chickaloon
The median household income in Chickaloon is $51,875, with the highest median household income of $53,125 found in the 65+ years age bracket for the primary householder. A total of 52 households (43.3%) fall into this category.
| Income Bracket | # Households | Median Income |
| 15 to 24 Years | 0 (0.0%) | $0 |
| 25 to 44 Years | 24 (20.0%) | $0 |
| 45 to 64 Years | 44 (36.7%) | $0 |
| 65+ Years | 52 (43.3%) | $53,125 |
| Total | 120 (100.0%) | $51,875 |
Poverty in Chickaloon
Income Below Poverty by Sex and Age in Chickaloon
With 5.6% poverty level for males and 2.8% for females among the residents of Chickaloon, 45 to 54 year old males and 35 to 44 year old females are the most vulnerable to poverty, with 4 males (100.0%) and 4 females (44.4%) in their respective age groups living below the poverty level.
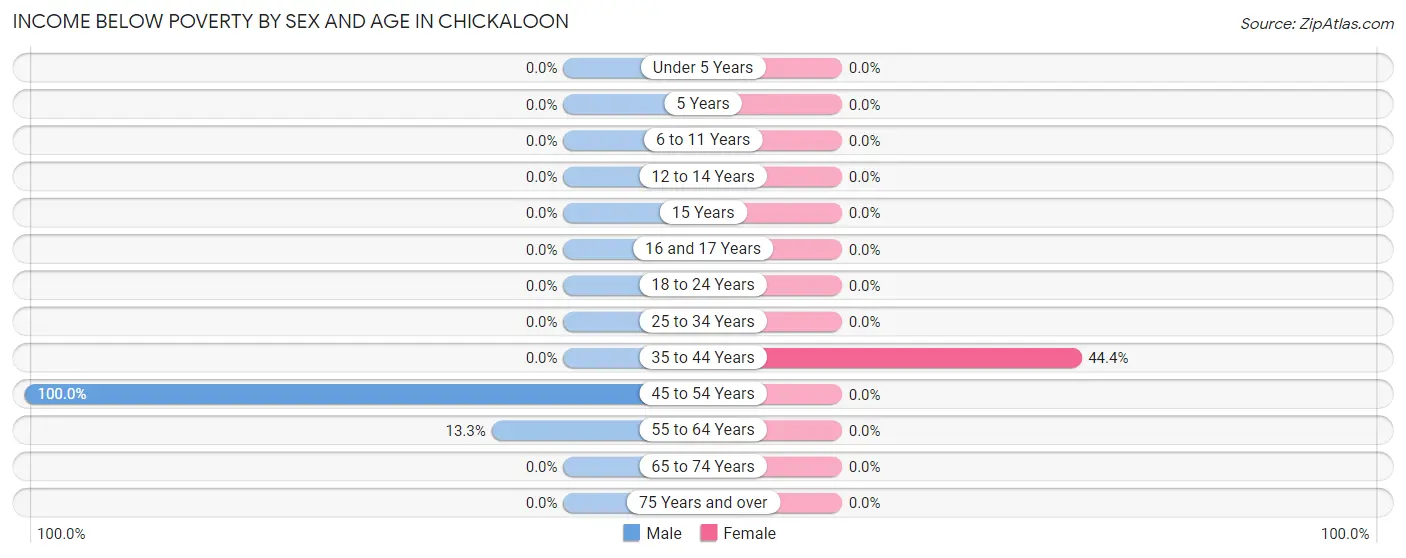
| Age Bracket | Male | Female |
| Under 5 Years | 0 (0.0%) | 0 (0.0%) |
| 5 Years | 0 (0.0%) | 0 (0.0%) |
| 6 to 11 Years | 0 (0.0%) | 0 (0.0%) |
| 12 to 14 Years | 0 (0.0%) | 0 (0.0%) |
| 15 Years | 0 (0.0%) | 0 (0.0%) |
| 16 and 17 Years | 0 (0.0%) | 0 (0.0%) |
| 18 to 24 Years | 0 (0.0%) | 0 (0.0%) |
| 25 to 34 Years | 0 (0.0%) | 0 (0.0%) |
| 35 to 44 Years | 0 (0.0%) | 4 (44.4%) |
| 45 to 54 Years | 4 (100.0%) | 0 (0.0%) |
| 55 to 64 Years | 4 (13.3%) | 0 (0.0%) |
| 65 to 74 Years | 0 (0.0%) | 0 (0.0%) |
| 75 Years and over | 0 (0.0%) | 0 (0.0%) |
| Total | 8 (5.6%) | 4 (2.8%) |
Income Above Poverty by Sex and Age in Chickaloon
According to the poverty statistics in Chickaloon, males aged under 5 years and females aged under 5 years are the age groups that are most secure financially, with 100.0% of males and 100.0% of females in these age groups living above the poverty line.
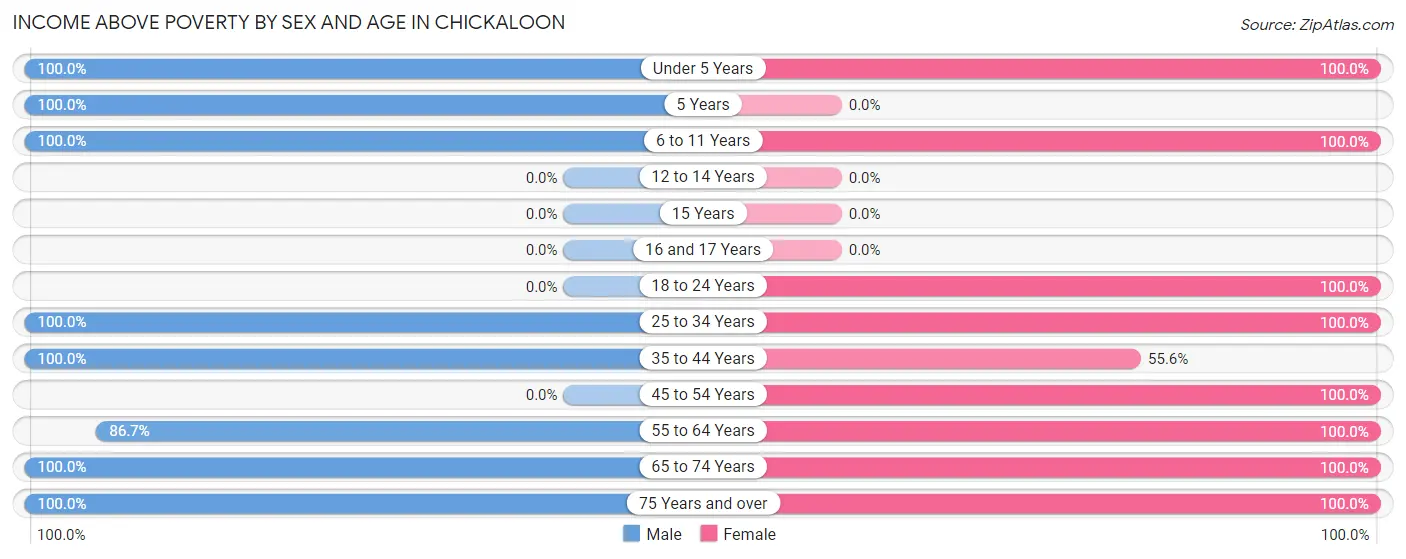
| Age Bracket | Male | Female |
| Under 5 Years | 7 (100.0%) | 21 (100.0%) |
| 5 Years | 6 (100.0%) | 0 (0.0%) |
| 6 to 11 Years | 7 (100.0%) | 6 (100.0%) |
| 12 to 14 Years | 0 (0.0%) | 0 (0.0%) |
| 15 Years | 0 (0.0%) | 0 (0.0%) |
| 16 and 17 Years | 0 (0.0%) | 0 (0.0%) |
| 18 to 24 Years | 0 (0.0%) | 9 (100.0%) |
| 25 to 34 Years | 31 (100.0%) | 17 (100.0%) |
| 35 to 44 Years | 7 (100.0%) | 5 (55.6%) |
| 45 to 54 Years | 0 (0.0%) | 7 (100.0%) |
| 55 to 64 Years | 26 (86.7%) | 21 (100.0%) |
| 65 to 74 Years | 45 (100.0%) | 40 (100.0%) |
| 75 Years and over | 5 (100.0%) | 11 (100.0%) |
| Total | 134 (94.4%) | 137 (97.2%) |
Income Below Poverty Among Married-Couple Families in Chickaloon
The poverty statistics for married-couple families in Chickaloon show that 5.6% or 4 of the total 71 families live below the poverty line. Families with no children have the highest poverty rate of 6.9%, comprising of 4 families. On the other hand, families with 1 or 2 children have the lowest poverty rate of 0.0%, which includes 0 families.
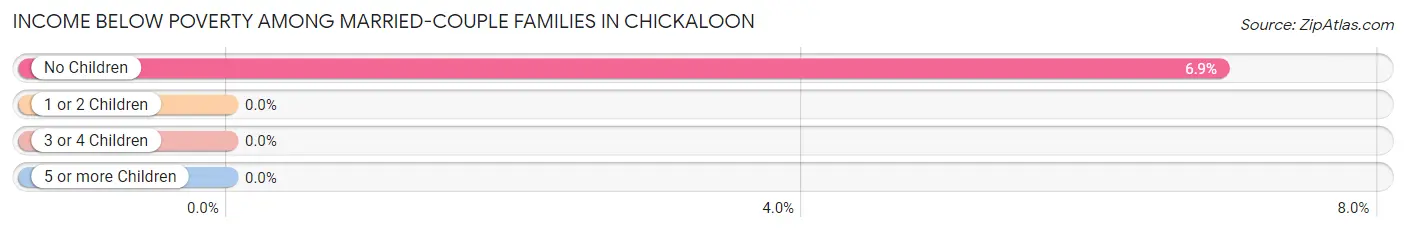
| Children | Above Poverty | Below Poverty |
| No Children | 54 (93.1%) | 4 (6.9%) |
| 1 or 2 Children | 5 (100.0%) | 0 (0.0%) |
| 3 or 4 Children | 0 (0.0%) | 0 (0.0%) |
| 5 or more Children | 8 (100.0%) | 0 (0.0%) |
| Total | 67 (94.4%) | 4 (5.6%) |
Income Below Poverty Among Single-Parent Households in Chickaloon
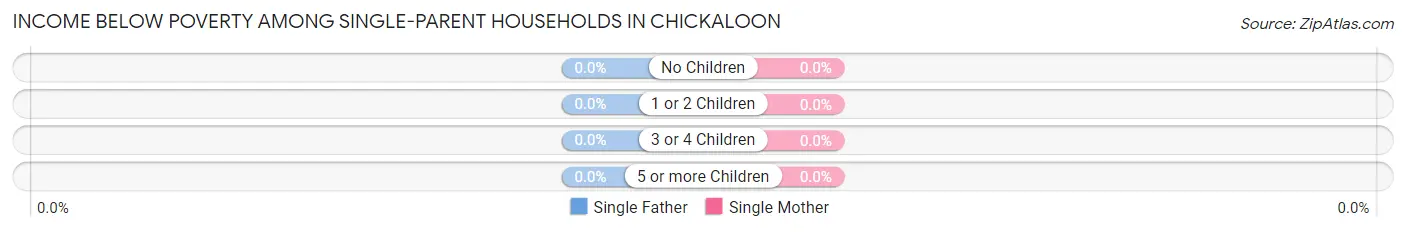
| Children | Single Father | Single Mother |
| No Children | 0 (0.0%) | 0 (0.0%) |
| 1 or 2 Children | 0 (0.0%) | 0 (0.0%) |
| 3 or 4 Children | 0 (0.0%) | 0 (0.0%) |
| 5 or more Children | 0 (0.0%) | 0 (0.0%) |
| Total | 0 (0.0%) | 0 (0.0%) |
Income Below Poverty Among Married-Couple vs Single-Parent Households in Chickaloon
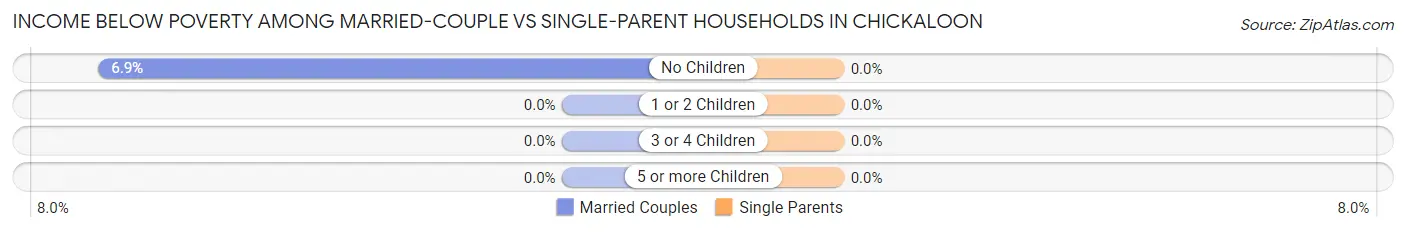
| Children | Married-Couple Families | Single-Parent Households |
| No Children | 4 (6.9%) | 0 (0.0%) |
| 1 or 2 Children | 0 (0.0%) | 0 (0.0%) |
| 3 or 4 Children | 0 (0.0%) | 0 (0.0%) |
| 5 or more Children | 0 (0.0%) | 0 (0.0%) |
| Total | 4 (5.6%) | 0 (0.0%) |
Race in Chickaloon
The most populous races in Chickaloon are White / Caucasian (241 | 85.2%), Two or more Races (35 | 12.4%), and Hispanic or Latino (11 | 3.9%).
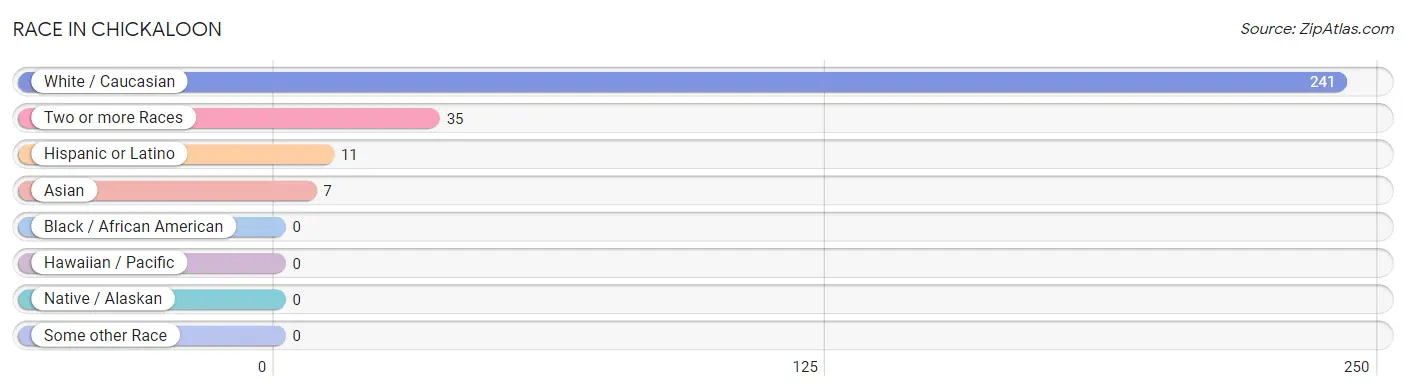
| Race | # Population | % Population |
| Asian | 7 | 2.5% |
| Black / African American | 0 | 0.0% |
| Hawaiian / Pacific | 0 | 0.0% |
| Hispanic or Latino | 11 | 3.9% |
| Native / Alaskan | 0 | 0.0% |
| White / Caucasian | 241 | 85.2% |
| Two or more Races | 35 | 12.4% |
| Some other Race | 0 | 0.0% |
| Total | 283 | 100.0% |
Ancestry in Chickaloon
The most populous ancestries reported in Chickaloon are German (69 | 24.4%), English (44 | 15.5%), Irish (39 | 13.8%), Scotch-Irish (15 | 5.3%), and Portuguese (13 | 4.6%), together accounting for 63.6% of all Chickaloon residents.
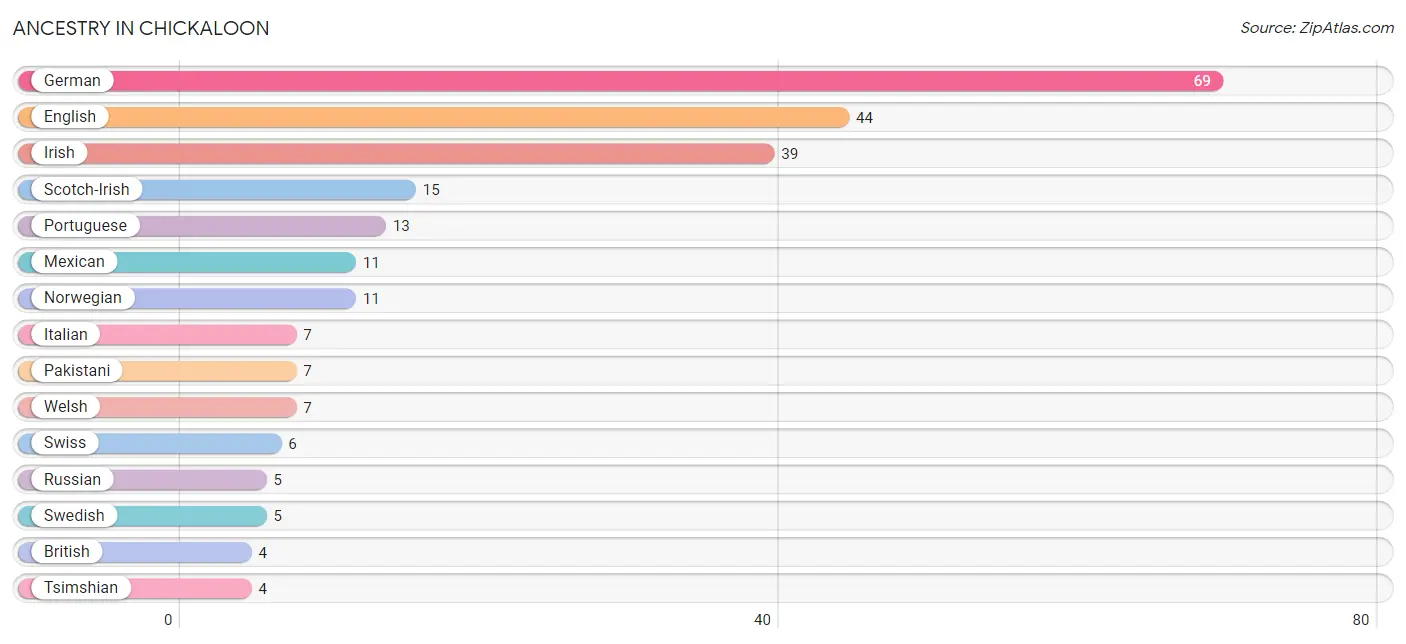
| Ancestry | # Population | % Population |
| British | 4 | 1.4% |
| English | 44 | 15.5% |
| German | 69 | 24.4% |
| Irish | 39 | 13.8% |
| Italian | 7 | 2.5% |
| Mexican | 11 | 3.9% |
| Norwegian | 11 | 3.9% |
| Pakistani | 7 | 2.5% |
| Portuguese | 13 | 4.6% |
| Russian | 5 | 1.8% |
| Scotch-Irish | 15 | 5.3% |
| Swedish | 5 | 1.8% |
| Swiss | 6 | 2.1% |
| Tsimshian | 4 | 1.4% |
| Welsh | 7 | 2.5% | View All 15 Rows |
Immigrants in Chickaloon
The most numerous immigrant groups reported in Chickaloon came from Asia (7 | 2.5%), Eastern Asia (7 | 2.5%), and Japan (7 | 2.5%), together accounting for 7.4% of all Chickaloon residents.
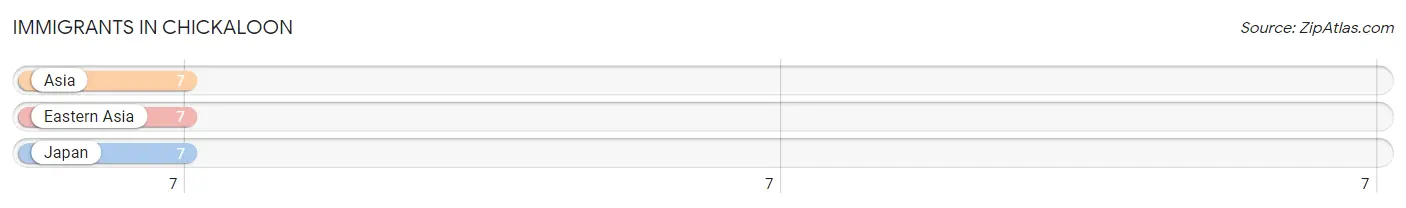
| Immigration Origin | # Population | % Population |
| Asia | 7 | 2.5% |
| Eastern Asia | 7 | 2.5% |
| Japan | 7 | 2.5% | View All 3 Rows |
Sex and Age in Chickaloon
Sex and Age in Chickaloon
The most populous age groups in Chickaloon are 70 to 74 Years (29 | 20.4%) for men and 70 to 74 Years (25 | 17.7%) for women.
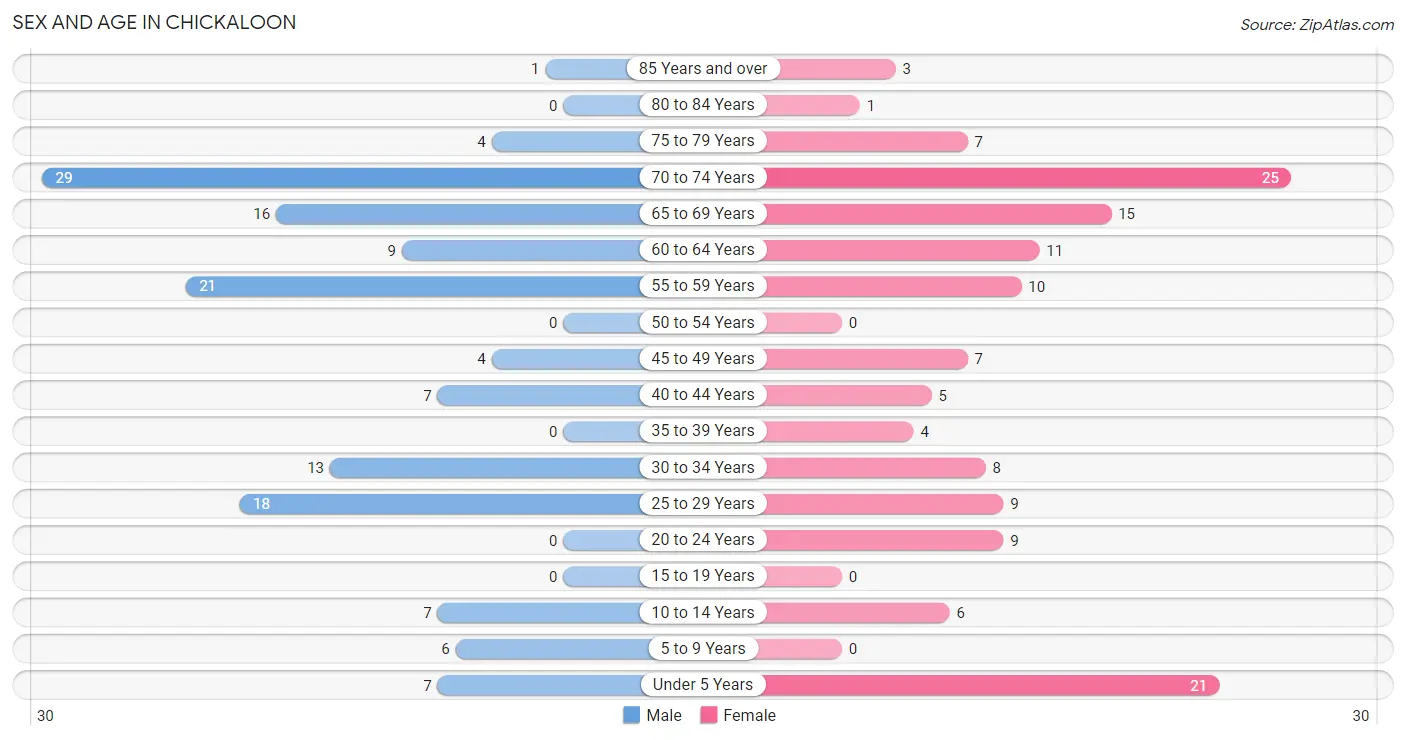
| Age Bracket | Male | Female |
| Under 5 Years | 7 (4.9%) | 21 (14.9%) |
| 5 to 9 Years | 6 (4.2%) | 0 (0.0%) |
| 10 to 14 Years | 7 (4.9%) | 6 (4.3%) |
| 15 to 19 Years | 0 (0.0%) | 0 (0.0%) |
| 20 to 24 Years | 0 (0.0%) | 9 (6.4%) |
| 25 to 29 Years | 18 (12.7%) | 9 (6.4%) |
| 30 to 34 Years | 13 (9.1%) | 8 (5.7%) |
| 35 to 39 Years | 0 (0.0%) | 4 (2.8%) |
| 40 to 44 Years | 7 (4.9%) | 5 (3.5%) |
| 45 to 49 Years | 4 (2.8%) | 7 (5.0%) |
| 50 to 54 Years | 0 (0.0%) | 0 (0.0%) |
| 55 to 59 Years | 21 (14.8%) | 10 (7.1%) |
| 60 to 64 Years | 9 (6.3%) | 11 (7.8%) |
| 65 to 69 Years | 16 (11.3%) | 15 (10.6%) |
| 70 to 74 Years | 29 (20.4%) | 25 (17.7%) |
| 75 to 79 Years | 4 (2.8%) | 7 (5.0%) |
| 80 to 84 Years | 0 (0.0%) | 1 (0.7%) |
| 85 Years and over | 1 (0.7%) | 3 (2.1%) |
| Total | 142 (100.0%) | 141 (100.0%) |
Families and Households in Chickaloon
Median Family Size in Chickaloon
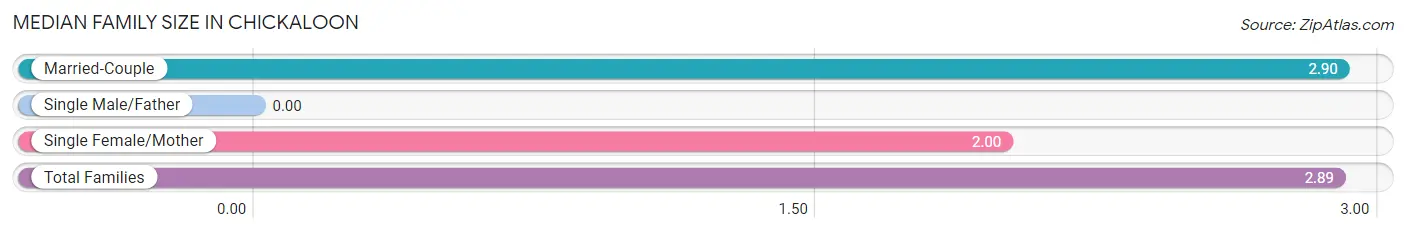
| Family Type | # Families | Family Size |
| Married-Couple | 71 (98.6%) | 2.90 |
| Single Male/Father | 0 (0.0%) | - |
| Single Female/Mother | 1 (1.4%) | 2.00 |
| Total Families | 72 (100.0%) | 2.89 |
Median Household Size in Chickaloon
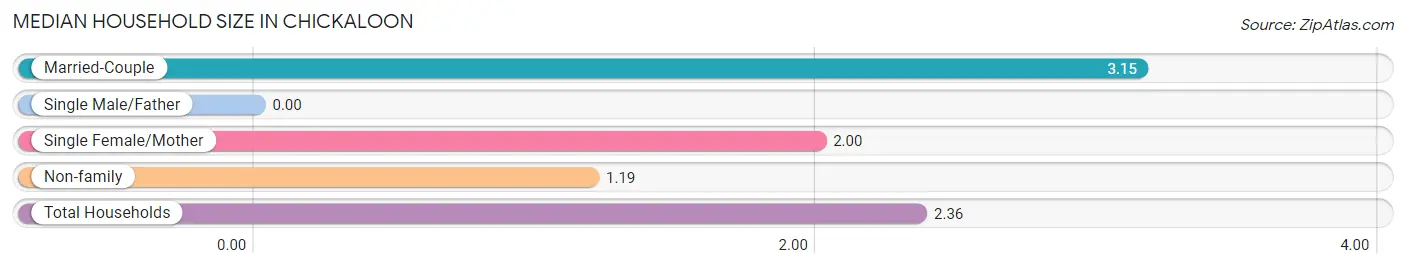
| Household Type | # Households | Household Size |
| Married-Couple | 71 (59.2%) | 3.15 |
| Single Male/Father | 0 (0.0%) | - |
| Single Female/Mother | 1 (0.8%) | 2.00 |
| Non-family | 48 (40.0%) | 1.19 |
| Total Households | 120 (100.0%) | 2.36 |
Household Size by Marriage Status in Chickaloon
Out of a total of 120 households in Chickaloon, 72 (60.0%) are family households, while 48 (40.0%) are nonfamily households. The most numerous type of family households are 2-person households, comprising 59, and the most common type of nonfamily households are 1-person households, comprising 39.
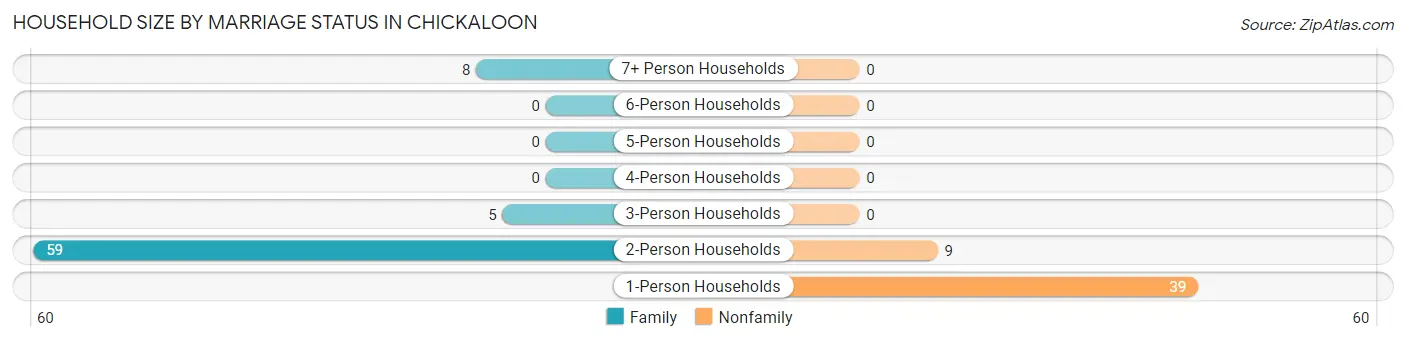
| Household Size | Family Households | Nonfamily Households |
| 1-Person Households | - | 39 (32.5%) |
| 2-Person Households | 59 (49.2%) | 9 (7.5%) |
| 3-Person Households | 5 (4.2%) | 0 (0.0%) |
| 4-Person Households | 0 (0.0%) | 0 (0.0%) |
| 5-Person Households | 0 (0.0%) | 0 (0.0%) |
| 6-Person Households | 0 (0.0%) | 0 (0.0%) |
| 7+ Person Households | 8 (6.7%) | 0 (0.0%) |
| Total | 72 (60.0%) | 48 (40.0%) |
Female Fertility in Chickaloon
Fertility by Age in Chickaloon
Average fertility rate in Chickaloon is 405.0 births per 1,000 women. Women in the age bracket of 20 to 34 years have the highest fertility rate with 654.0 births per 1,000 women. Women in the age bracket of 20 to 34 years acount for 100.0% of all women with births.
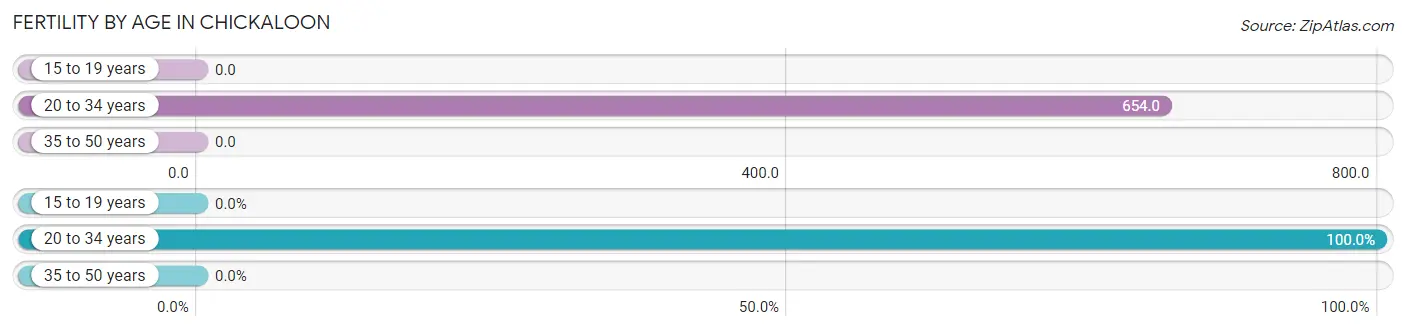
| Age Bracket | Women with Births | Births / 1,000 Women |
| 15 to 19 years | 0 (0.0%) | 0.0 |
| 20 to 34 years | 17 (100.0%) | 654.0 |
| 35 to 50 years | 0 (0.0%) | 0.0 |
| Total | 17 (100.0%) | 405.0 |
Fertility by Age by Marriage Status in Chickaloon
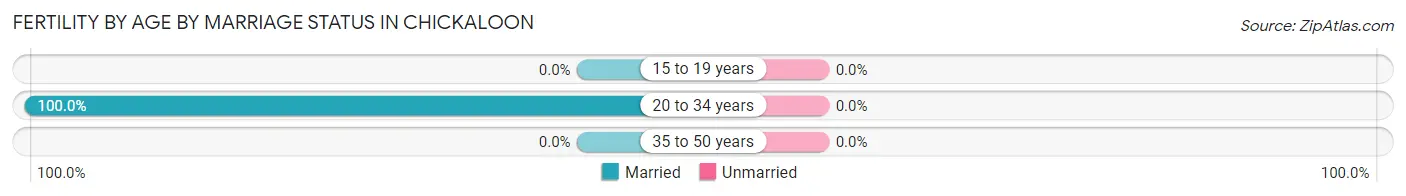
| Age Bracket | Married | Unmarried |
| 15 to 19 years | 0 (0.0%) | 0 (0.0%) |
| 20 to 34 years | 17 (100.0%) | 0 (0.0%) |
| 35 to 50 years | 0 (0.0%) | 0 (0.0%) |
| Total | 17 (100.0%) | 0 (0.0%) |
Fertility by Education in Chickaloon
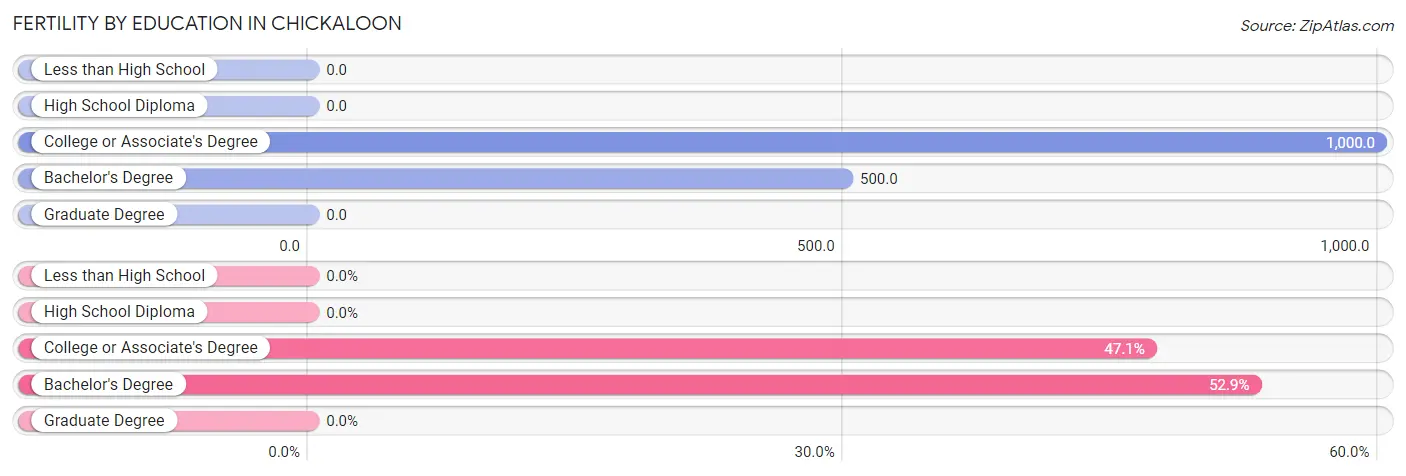
| Educational Attainment | Women with Births | Births / 1,000 Women |
| Less than High School | 0 (0.0%) | 0.0 |
| High School Diploma | 0 (0.0%) | 0.0 |
| College or Associate's Degree | 8 (47.1%) | 1,000.0 |
| Bachelor's Degree | 9 (52.9%) | 500.0 |
| Graduate Degree | 0 (0.0%) | 0.0 |
| Total | 17 (100.0%) | 405.0 |
Fertility by Education by Marriage Status in Chickaloon
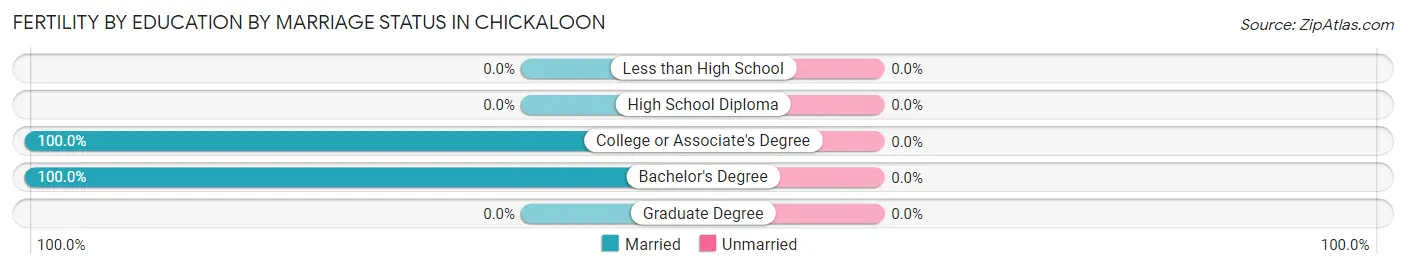
| Educational Attainment | Married | Unmarried |
| Less than High School | 0 (0.0%) | 0 (0.0%) |
| High School Diploma | 0 (0.0%) | 0 (0.0%) |
| College or Associate's Degree | 8 (100.0%) | 0 (0.0%) |
| Bachelor's Degree | 9 (100.0%) | 0 (0.0%) |
| Graduate Degree | 0 (0.0%) | 0 (0.0%) |
| Total | 17 (100.0%) | 0 (0.0%) |
Employment Characteristics in Chickaloon
Employment by Class of Employer in Chickaloon
Among the 65 employed individuals in Chickaloon, local government employees (15 | 23.1%), not-for-profit organizations (13 | 20.0%), and state government employees (13 | 20.0%) make up the most common classes of employment.
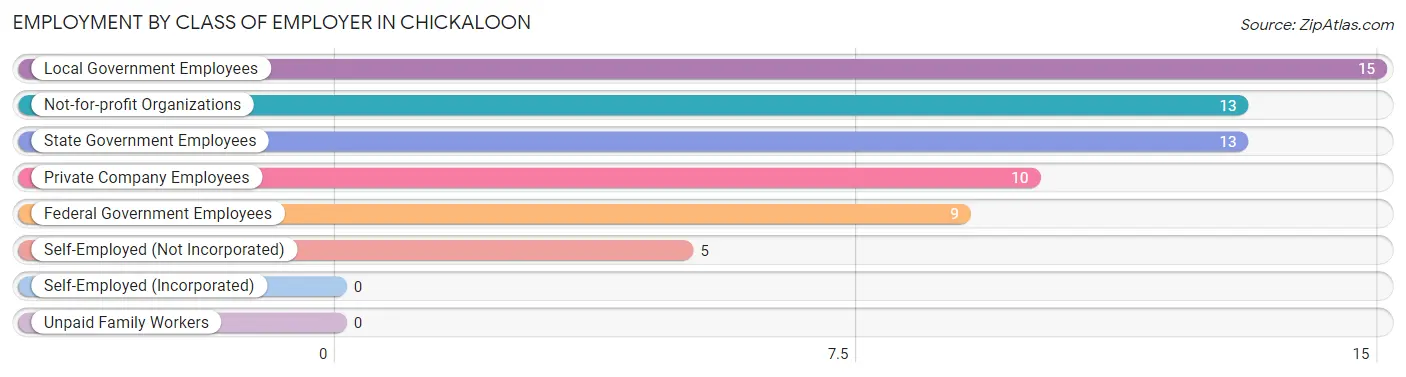
| Employer Class | # Employees | % Employees |
| Private Company Employees | 10 | 15.4% |
| Self-Employed (Incorporated) | 0 | 0.0% |
| Self-Employed (Not Incorporated) | 5 | 7.7% |
| Not-for-profit Organizations | 13 | 20.0% |
| Local Government Employees | 15 | 23.1% |
| State Government Employees | 13 | 20.0% |
| Federal Government Employees | 9 | 13.9% |
| Unpaid Family Workers | 0 | 0.0% |
| Total | 65 | 100.0% |
Employment Status by Age in Chickaloon
According to the labor force statistics for Chickaloon, out of the total population over 16 years of age (236), 36.0% or 85 individuals are in the labor force, with 23.5% or 20 of them unemployed. The age group with the highest labor force participation rate is 20 to 24 years, with 100.0% or 9 individuals in the labor force. Within the labor force, the 35 to 44 years age range has the highest percentage of unemployed individuals, with 58.3% or 7 of them being unemployed.
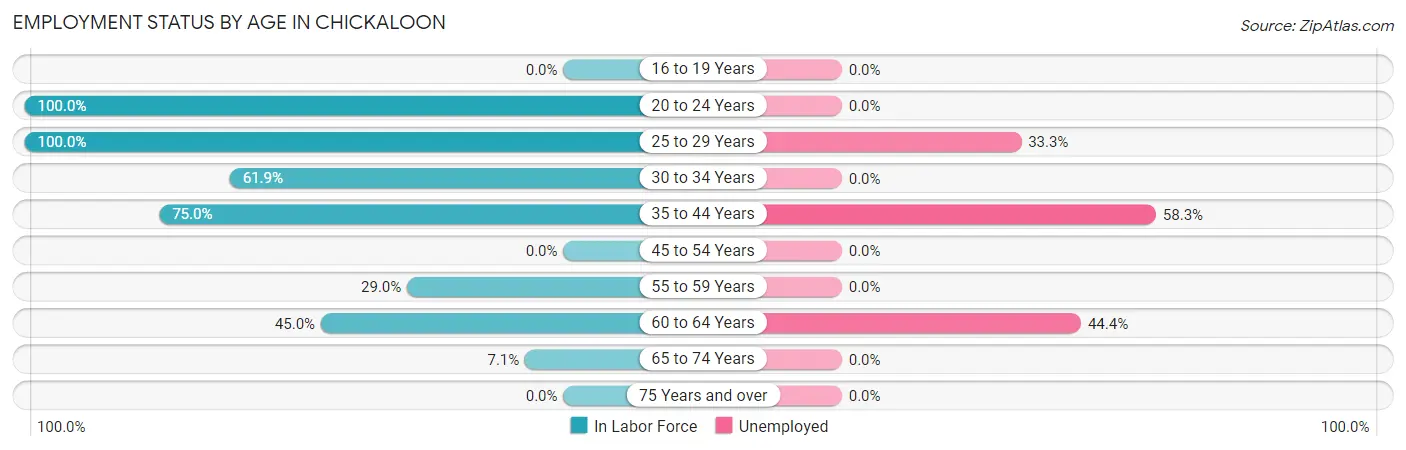
| Age Bracket | In Labor Force | Unemployed |
| 16 to 19 Years | 0 (0.0%) | 0 (0.0%) |
| 20 to 24 Years | 9 (100.0%) | 0 (0.0%) |
| 25 to 29 Years | 27 (100.0%) | 9 (33.3%) |
| 30 to 34 Years | 13 (61.9%) | 0 (0.0%) |
| 35 to 44 Years | 12 (75.0%) | 7 (58.3%) |
| 45 to 54 Years | 0 (0.0%) | 0 (0.0%) |
| 55 to 59 Years | 9 (29.0%) | 0 (0.0%) |
| 60 to 64 Years | 9 (45.0%) | 4 (44.4%) |
| 65 to 74 Years | 6 (7.1%) | 0 (0.0%) |
| 75 Years and over | 0 (0.0%) | 0 (0.0%) |
| Total | 85 (36.0%) | 20 (23.5%) |
Employment Status by Educational Attainment in Chickaloon
According to labor force statistics for Chickaloon, 55.6% of individuals (70) out of the total population between 25 and 64 years of age (126) are in the labor force, with 28.6% or 20 of them being unemployed. The group with the highest labor force participation rate are those with the educational attainment of bachelor's degree or higher, with 74.2% or 23 individuals in the labor force. Within the labor force, individuals with high school diploma education have the highest percentage of unemployment, with 44.0% or 11 of them being unemployed.
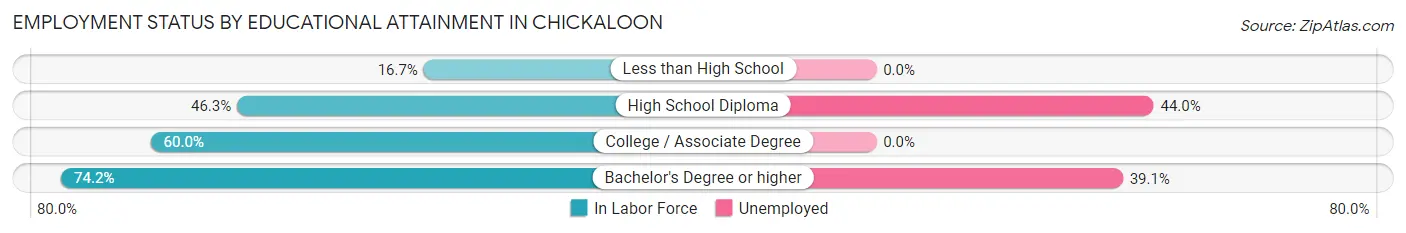
| Educational Attainment | In Labor Force | Unemployed |
| Less than High School | 1 (16.7%) | 0 (0.0%) |
| High School Diploma | 25 (46.3%) | 24 (44.0%) |
| College / Associate Degree | 21 (60.0%) | 0 (0.0%) |
| Bachelor's Degree or higher | 23 (74.2%) | 12 (39.1%) |
| Total | 70 (55.6%) | 36 (28.6%) |
Employment Occupations by Sex in Chickaloon
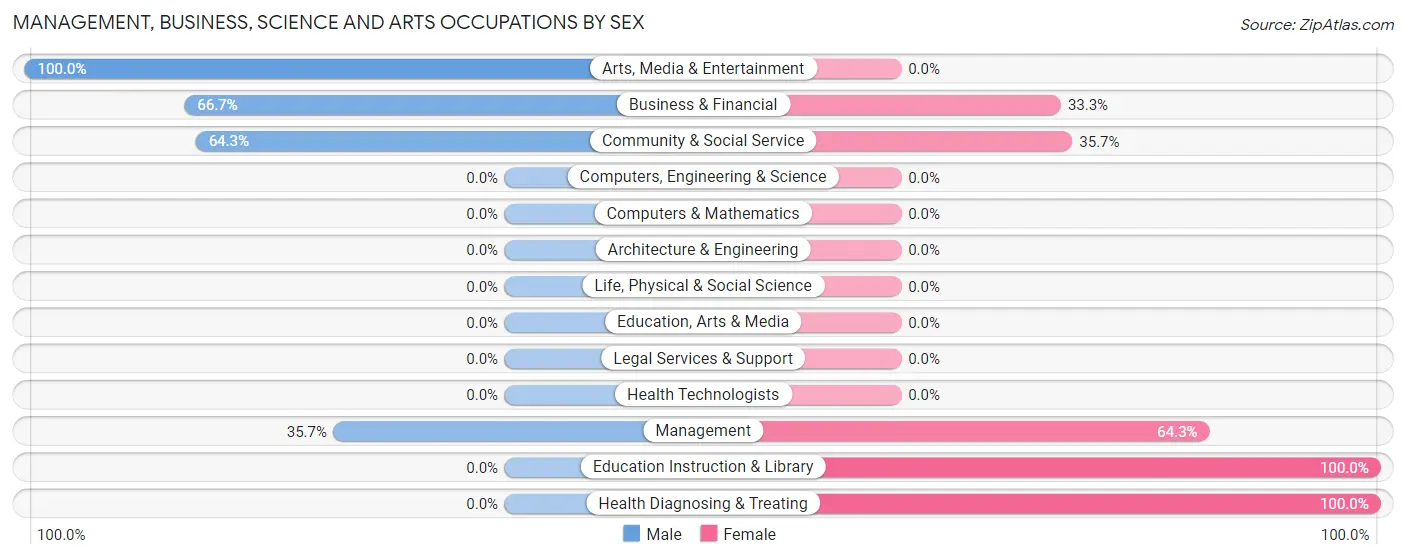
Management, Business, Science and Arts Occupations
The most common Management, Business, Science and Arts occupations in Chickaloon are Business & Financial (15 | 23.1%), Management (14 | 21.5%), Community & Social Service (14 | 21.5%), Arts, Media & Entertainment (9 | 13.9%), and Health Diagnosing & Treating (9 | 13.9%).
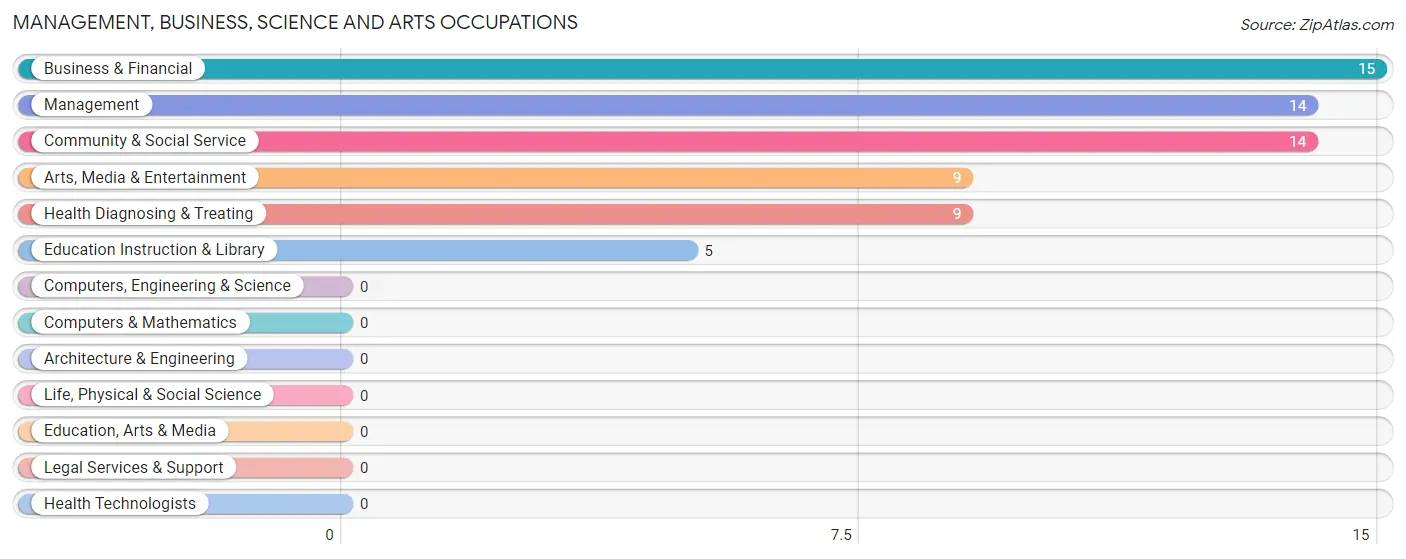
Management, Business, Science and Arts Occupations by Sex
Within the Management, Business, Science and Arts occupations in Chickaloon, the most male-oriented occupations are Arts, Media & Entertainment (100.0%), Business & Financial (66.7%), and Community & Social Service (64.3%), while the most female-oriented occupations are Education Instruction & Library (100.0%), Health Diagnosing & Treating (100.0%), and Management (64.3%).
| Occupation | Male | Female |
| Management | 5 (35.7%) | 9 (64.3%) |
| Business & Financial | 10 (66.7%) | 5 (33.3%) |
| Computers, Engineering & Science | 0 (0.0%) | 0 (0.0%) |
| Computers & Mathematics | 0 (0.0%) | 0 (0.0%) |
| Architecture & Engineering | 0 (0.0%) | 0 (0.0%) |
| Life, Physical & Social Science | 0 (0.0%) | 0 (0.0%) |
| Community & Social Service | 9 (64.3%) | 5 (35.7%) |
| Education, Arts & Media | 0 (0.0%) | 0 (0.0%) |
| Legal Services & Support | 0 (0.0%) | 0 (0.0%) |
| Education Instruction & Library | 0 (0.0%) | 5 (100.0%) |
| Arts, Media & Entertainment | 9 (100.0%) | 0 (0.0%) |
| Health Diagnosing & Treating | 0 (0.0%) | 9 (100.0%) |
| Health Technologists | 0 (0.0%) | 0 (0.0%) |
| Total (Category) | 24 (46.2%) | 28 (53.8%) |
| Total (Overall) | 36 (55.4%) | 29 (44.6%) |
Services Occupations
Services Occupations by Sex
| Occupation | Male | Female |
| Healthcare Support | 0 (0.0%) | 0 (0.0%) |
| Security & Protection | 0 (0.0%) | 0 (0.0%) |
| Firefighting & Prevention | 0 (0.0%) | 0 (0.0%) |
| Law Enforcement | 0 (0.0%) | 0 (0.0%) |
| Food Preparation & Serving | 0 (0.0%) | 0 (0.0%) |
| Cleaning & Maintenance | 0 (0.0%) | 0 (0.0%) |
| Personal Care & Service | 0 (0.0%) | 0 (0.0%) |
| Total (Category) | 0 (0.0%) | 0 (0.0%) |
| Total (Overall) | 36 (55.4%) | 29 (44.6%) |
Sales and Office Occupations
The most common Sales and Office occupations in Chickaloon are , and Office & Administration (8 | 12.3%).
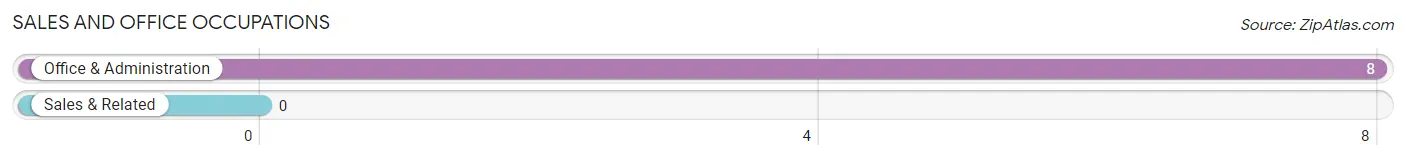
Sales and Office Occupations by Sex
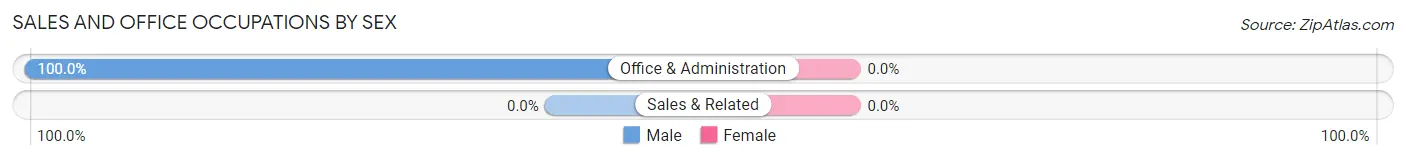
| Occupation | Male | Female |
| Sales & Related | 0 (0.0%) | 0 (0.0%) |
| Office & Administration | 8 (100.0%) | 0 (0.0%) |
| Total (Category) | 8 (100.0%) | 0 (0.0%) |
| Total (Overall) | 36 (55.4%) | 29 (44.6%) |
Natural Resources, Construction and Maintenance Occupations
The most common Natural Resources, Construction and Maintenance occupations in Chickaloon are , and Installation, Maintenance & Repair (4 | 6.1%).
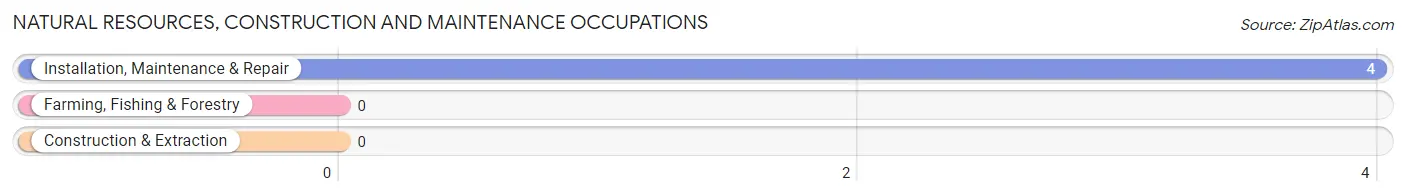
Natural Resources, Construction and Maintenance Occupations by Sex
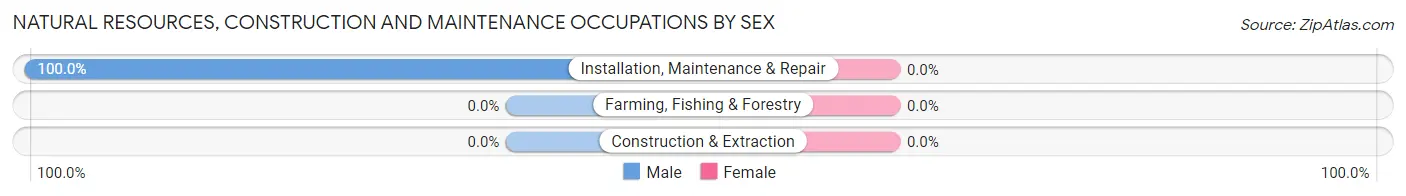
| Occupation | Male | Female |
| Farming, Fishing & Forestry | 0 (0.0%) | 0 (0.0%) |
| Construction & Extraction | 0 (0.0%) | 0 (0.0%) |
| Installation, Maintenance & Repair | 4 (100.0%) | 0 (0.0%) |
| Total (Category) | 4 (100.0%) | 0 (0.0%) |
| Total (Overall) | 36 (55.4%) | 29 (44.6%) |
Production, Transportation and Moving Occupations
The most common Production, Transportation and Moving occupations in Chickaloon are , and Transportation (1 | 1.5%).
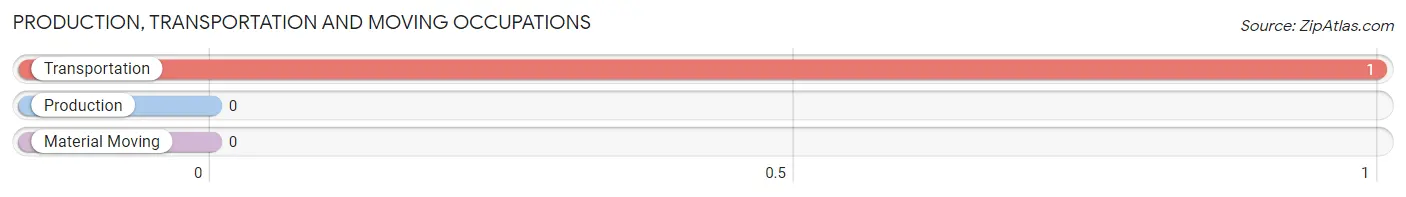
Production, Transportation and Moving Occupations by Sex
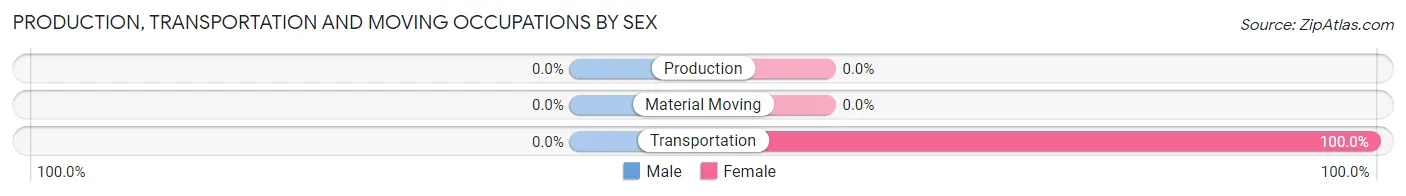
| Occupation | Male | Female |
| Production | 0 (0.0%) | 0 (0.0%) |
| Transportation | 0 (0.0%) | 1 (100.0%) |
| Material Moving | 0 (0.0%) | 0 (0.0%) |
| Total (Category) | 0 (0.0%) | 1 (100.0%) |
| Total (Overall) | 36 (55.4%) | 29 (44.6%) |
Employment Industries by Sex in Chickaloon
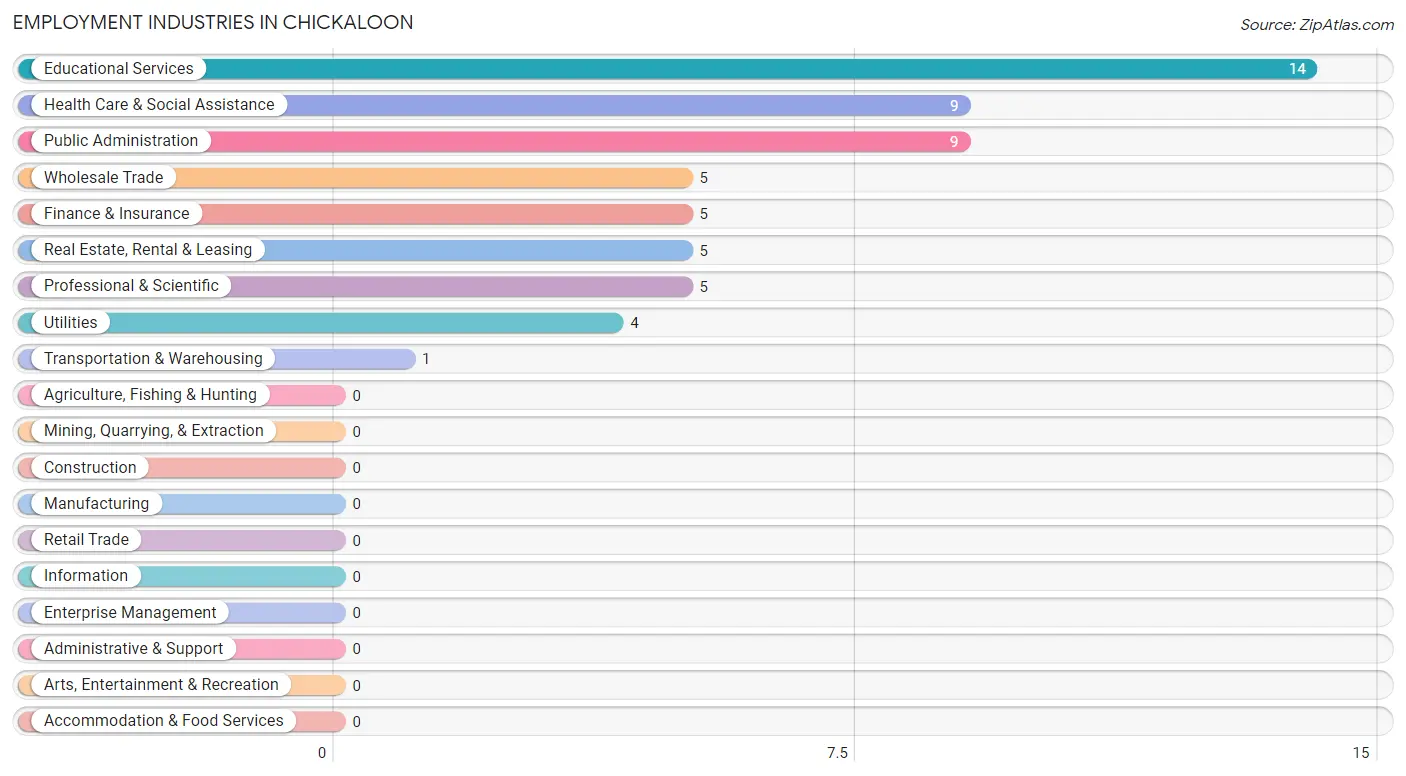
Employment Industries in Chickaloon
The major employment industries in Chickaloon include Educational Services (14 | 21.5%), Health Care & Social Assistance (9 | 13.9%), Public Administration (9 | 13.9%), Wholesale Trade (5 | 7.7%), and Finance & Insurance (5 | 7.7%).
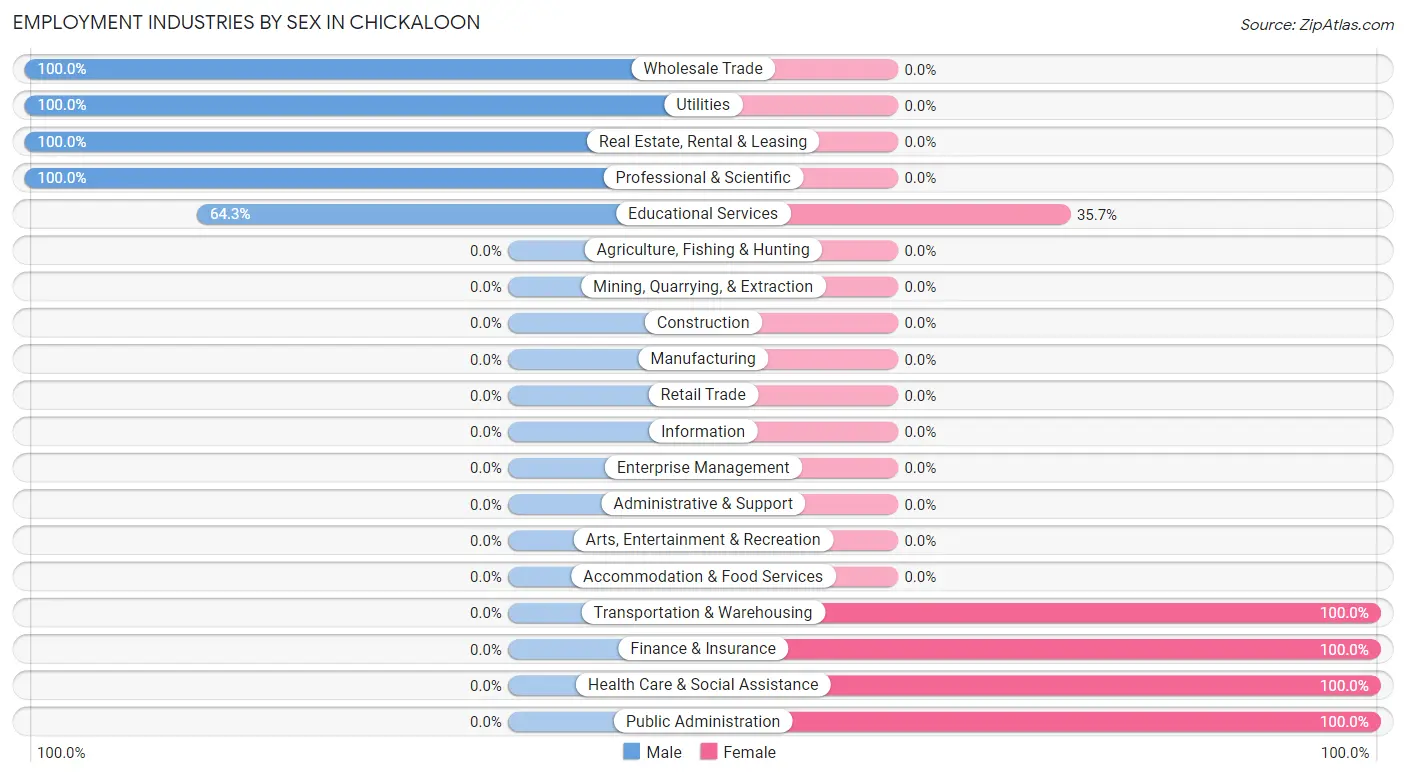
Employment Industries by Sex in Chickaloon
The Chickaloon industries that see more men than women are Wholesale Trade (100.0%), Utilities (100.0%), and Real Estate, Rental & Leasing (100.0%), whereas the industries that tend to have a higher number of women are Transportation & Warehousing (100.0%), Finance & Insurance (100.0%), and Health Care & Social Assistance (100.0%).
| Industry | Male | Female |
| Agriculture, Fishing & Hunting | 0 (0.0%) | 0 (0.0%) |
| Mining, Quarrying, & Extraction | 0 (0.0%) | 0 (0.0%) |
| Construction | 0 (0.0%) | 0 (0.0%) |
| Manufacturing | 0 (0.0%) | 0 (0.0%) |
| Wholesale Trade | 5 (100.0%) | 0 (0.0%) |
| Retail Trade | 0 (0.0%) | 0 (0.0%) |
| Transportation & Warehousing | 0 (0.0%) | 1 (100.0%) |
| Utilities | 4 (100.0%) | 0 (0.0%) |
| Information | 0 (0.0%) | 0 (0.0%) |
| Finance & Insurance | 0 (0.0%) | 5 (100.0%) |
| Real Estate, Rental & Leasing | 5 (100.0%) | 0 (0.0%) |
| Professional & Scientific | 5 (100.0%) | 0 (0.0%) |
| Enterprise Management | 0 (0.0%) | 0 (0.0%) |
| Administrative & Support | 0 (0.0%) | 0 (0.0%) |
| Educational Services | 9 (64.3%) | 5 (35.7%) |
| Health Care & Social Assistance | 0 (0.0%) | 9 (100.0%) |
| Arts, Entertainment & Recreation | 0 (0.0%) | 0 (0.0%) |
| Accommodation & Food Services | 0 (0.0%) | 0 (0.0%) |
| Public Administration | 0 (0.0%) | 9 (100.0%) |
| Total | 36 (55.4%) | 29 (44.6%) |
Education in Chickaloon
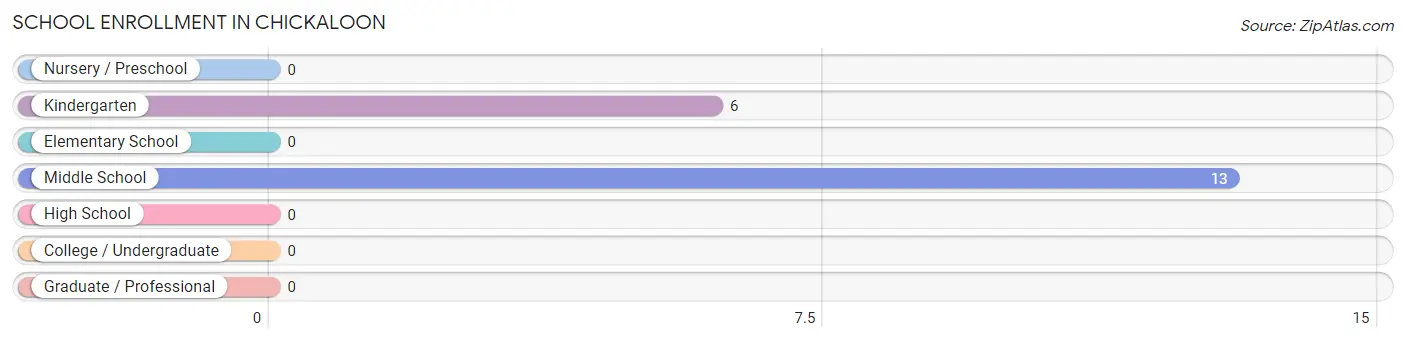
School Enrollment in Chickaloon
The most common levels of schooling among the 19 students in Chickaloon are middle school (13 | 68.4%), and kindergarten (6 | 31.6%).
| School Level | # Students | % Students |
| Nursery / Preschool | 0 | 0.0% |
| Kindergarten | 6 | 31.6% |
| Elementary School | 0 | 0.0% |
| Middle School | 13 | 68.4% |
| High School | 0 | 0.0% |
| College / Undergraduate | 0 | 0.0% |
| Graduate / Professional | 0 | 0.0% |
| Total | 19 | 100.0% |
School Enrollment by Age by Funding Source in Chickaloon
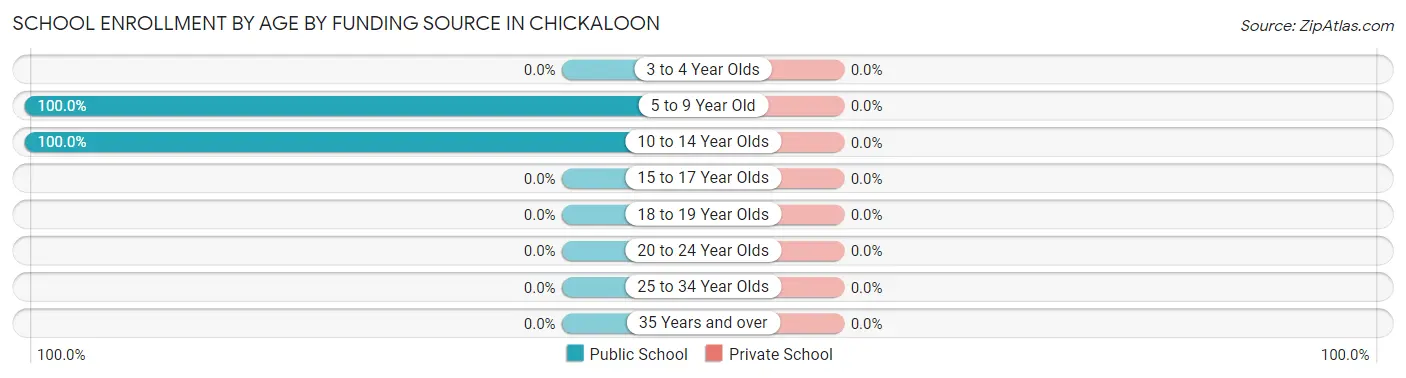
| Age Bracket | Public School | Private School |
| 3 to 4 Year Olds | 0 (0.0%) | 0 (0.0%) |
| 5 to 9 Year Old | 6 (100.0%) | 0 (0.0%) |
| 10 to 14 Year Olds | 13 (100.0%) | 0 (0.0%) |
| 15 to 17 Year Olds | 0 (0.0%) | 0 (0.0%) |
| 18 to 19 Year Olds | 0 (0.0%) | 0 (0.0%) |
| 20 to 24 Year Olds | 0 (0.0%) | 0 (0.0%) |
| 25 to 34 Year Olds | 0 (0.0%) | 0 (0.0%) |
| 35 Years and over | 0 (0.0%) | 0 (0.0%) |
| Total | 19 (100.0%) | 0 (0.0%) |
Educational Attainment by Field of Study in Chickaloon
Bio, nature & agricultural (9 | 20.0%), psychology (9 | 20.0%), education (9 | 20.0%), arts & humanities (9 | 20.0%), and business (5 | 11.1%) are the most common fields of study among 45 individuals in Chickaloon who have obtained a bachelor's degree or higher.
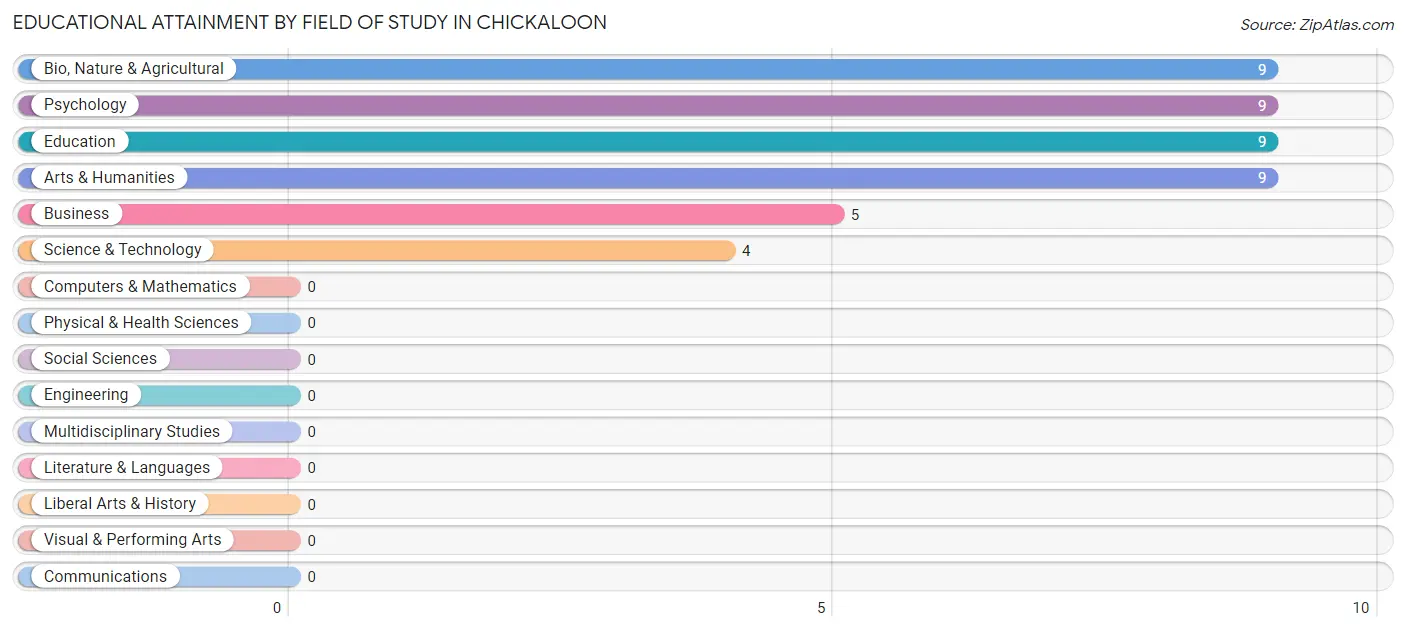
| Field of Study | # Graduates | % Graduates |
| Computers & Mathematics | 0 | 0.0% |
| Bio, Nature & Agricultural | 9 | 20.0% |
| Physical & Health Sciences | 0 | 0.0% |
| Psychology | 9 | 20.0% |
| Social Sciences | 0 | 0.0% |
| Engineering | 0 | 0.0% |
| Multidisciplinary Studies | 0 | 0.0% |
| Science & Technology | 4 | 8.9% |
| Business | 5 | 11.1% |
| Education | 9 | 20.0% |
| Literature & Languages | 0 | 0.0% |
| Liberal Arts & History | 0 | 0.0% |
| Visual & Performing Arts | 0 | 0.0% |
| Communications | 0 | 0.0% |
| Arts & Humanities | 9 | 20.0% |
| Total | 45 | 100.0% |
Transportation & Commute in Chickaloon
Vehicle Availability by Sex in Chickaloon
The most prevalent vehicle ownership categories in Chickaloon are males with 2 vehicles (26, accounting for 72.2%) and females with 2 vehicles (24, making up 89.7%).
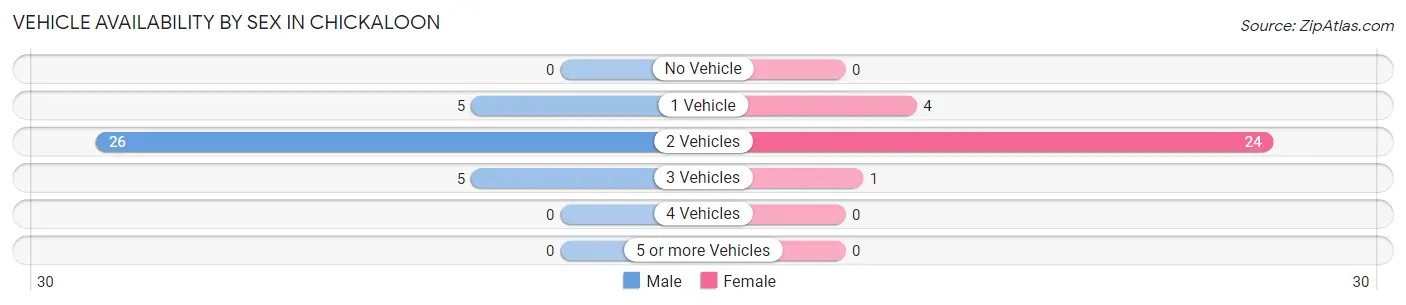
| Vehicles Available | Male | Female |
| No Vehicle | 0 (0.0%) | 0 (0.0%) |
| 1 Vehicle | 5 (13.9%) | 4 (13.8%) |
| 2 Vehicles | 26 (72.2%) | 24 (82.8%) |
| 3 Vehicles | 5 (13.9%) | 1 (3.5%) |
| 4 Vehicles | 0 (0.0%) | 0 (0.0%) |
| 5 or more Vehicles | 0 (0.0%) | 0 (0.0%) |
| Total | 36 (100.0%) | 29 (100.0%) |
Commute Time in Chickaloon
The most frequently occuring commute durations in Chickaloon are less than 5 minutes (26 commuters, 57.8%), 20 to 24 minutes (9 commuters, 20.0%), and 10 to 14 minutes (5 commuters, 11.1%).
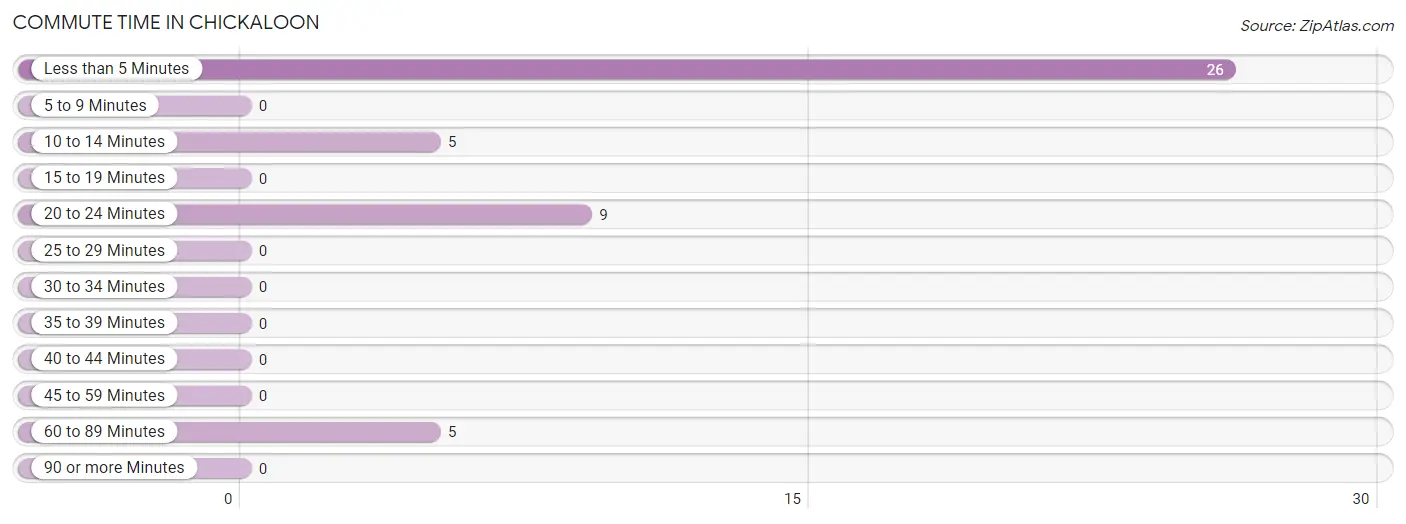
| Commute Time | # Commuters | % Commuters |
| Less than 5 Minutes | 26 | 57.8% |
| 5 to 9 Minutes | 0 | 0.0% |
| 10 to 14 Minutes | 5 | 11.1% |
| 15 to 19 Minutes | 0 | 0.0% |
| 20 to 24 Minutes | 9 | 20.0% |
| 25 to 29 Minutes | 0 | 0.0% |
| 30 to 34 Minutes | 0 | 0.0% |
| 35 to 39 Minutes | 0 | 0.0% |
| 40 to 44 Minutes | 0 | 0.0% |
| 45 to 59 Minutes | 0 | 0.0% |
| 60 to 89 Minutes | 5 | 11.1% |
| 90 or more Minutes | 0 | 0.0% |
Commute Time by Sex in Chickaloon
The most common commute times in Chickaloon are less than 5 minutes (17 commuters, 80.9%) for males and less than 5 minutes (9 commuters, 37.5%) for females.
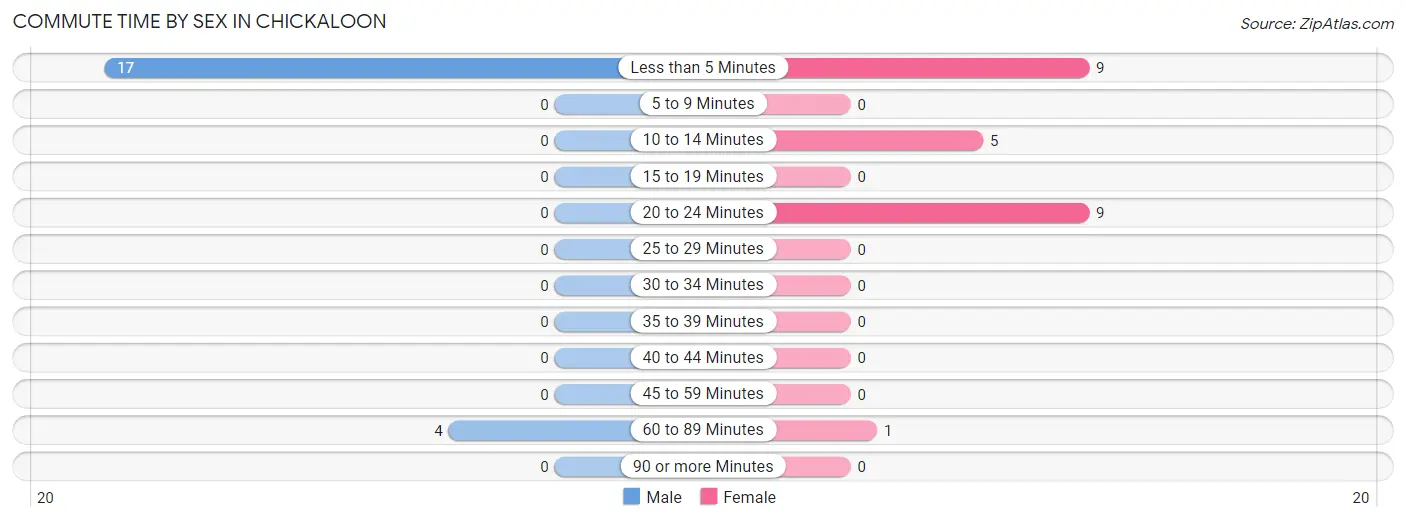
| Commute Time | Male | Female |
| Less than 5 Minutes | 17 (80.9%) | 9 (37.5%) |
| 5 to 9 Minutes | 0 (0.0%) | 0 (0.0%) |
| 10 to 14 Minutes | 0 (0.0%) | 5 (20.8%) |
| 15 to 19 Minutes | 0 (0.0%) | 0 (0.0%) |
| 20 to 24 Minutes | 0 (0.0%) | 9 (37.5%) |
| 25 to 29 Minutes | 0 (0.0%) | 0 (0.0%) |
| 30 to 34 Minutes | 0 (0.0%) | 0 (0.0%) |
| 35 to 39 Minutes | 0 (0.0%) | 0 (0.0%) |
| 40 to 44 Minutes | 0 (0.0%) | 0 (0.0%) |
| 45 to 59 Minutes | 0 (0.0%) | 0 (0.0%) |
| 60 to 89 Minutes | 4 (19.1%) | 1 (4.2%) |
| 90 or more Minutes | 0 (0.0%) | 0 (0.0%) |
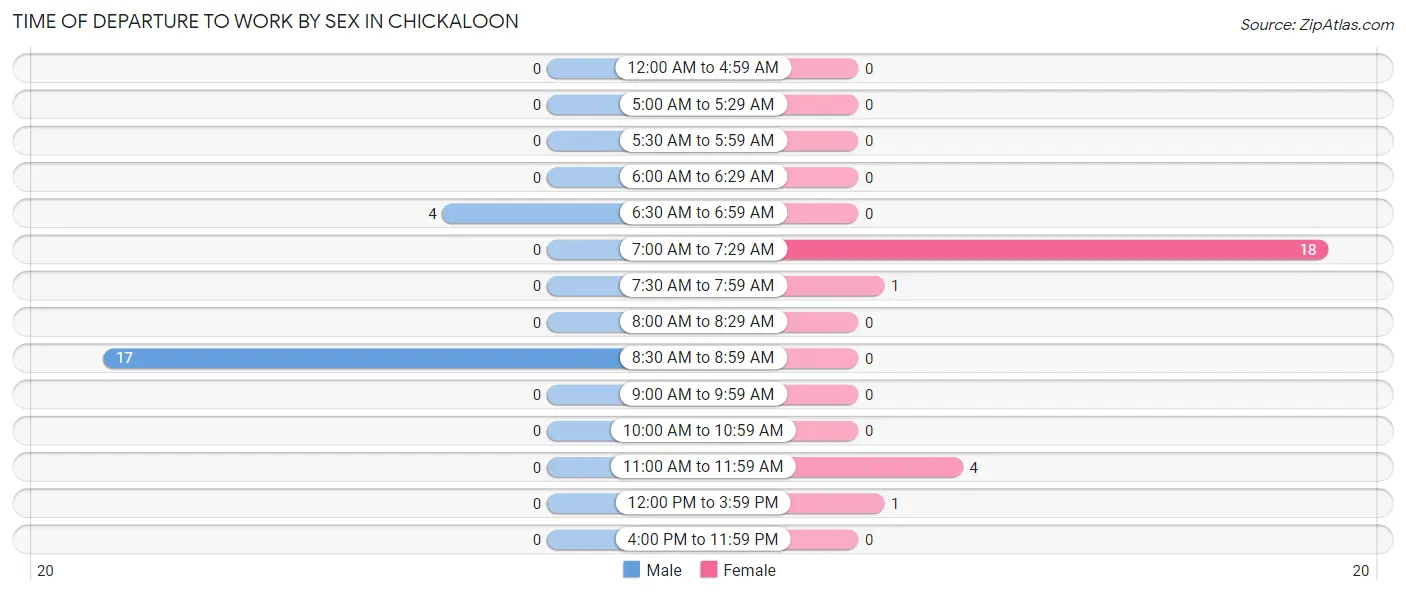
Time of Departure to Work by Sex in Chickaloon
The most frequent times of departure to work in Chickaloon are 8:30 AM to 8:59 AM (17, 80.9%) for males and 7:00 AM to 7:29 AM (18, 75.0%) for females.
| Time of Departure | Male | Female |
| 12:00 AM to 4:59 AM | 0 (0.0%) | 0 (0.0%) |
| 5:00 AM to 5:29 AM | 0 (0.0%) | 0 (0.0%) |
| 5:30 AM to 5:59 AM | 0 (0.0%) | 0 (0.0%) |
| 6:00 AM to 6:29 AM | 0 (0.0%) | 0 (0.0%) |
| 6:30 AM to 6:59 AM | 4 (19.1%) | 0 (0.0%) |
| 7:00 AM to 7:29 AM | 0 (0.0%) | 18 (75.0%) |
| 7:30 AM to 7:59 AM | 0 (0.0%) | 1 (4.2%) |
| 8:00 AM to 8:29 AM | 0 (0.0%) | 0 (0.0%) |
| 8:30 AM to 8:59 AM | 17 (80.9%) | 0 (0.0%) |
| 9:00 AM to 9:59 AM | 0 (0.0%) | 0 (0.0%) |
| 10:00 AM to 10:59 AM | 0 (0.0%) | 0 (0.0%) |
| 11:00 AM to 11:59 AM | 0 (0.0%) | 4 (16.7%) |
| 12:00 PM to 3:59 PM | 0 (0.0%) | 1 (4.2%) |
| 4:00 PM to 11:59 PM | 0 (0.0%) | 0 (0.0%) |
| Total | 21 (100.0%) | 24 (100.0%) |
Housing Occupancy in Chickaloon
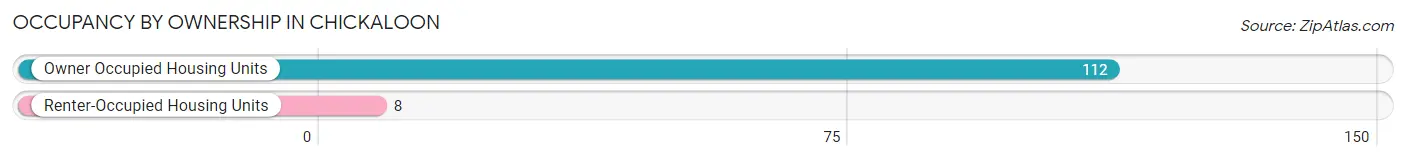
Occupancy by Ownership in Chickaloon
Of the total 120 dwellings in Chickaloon, owner-occupied units account for 112 (93.3%), while renter-occupied units make up 8 (6.7%).
| Occupancy | # Housing Units | % Housing Units |
| Owner Occupied Housing Units | 112 | 93.3% |
| Renter-Occupied Housing Units | 8 | 6.7% |
| Total Occupied Housing Units | 120 | 100.0% |
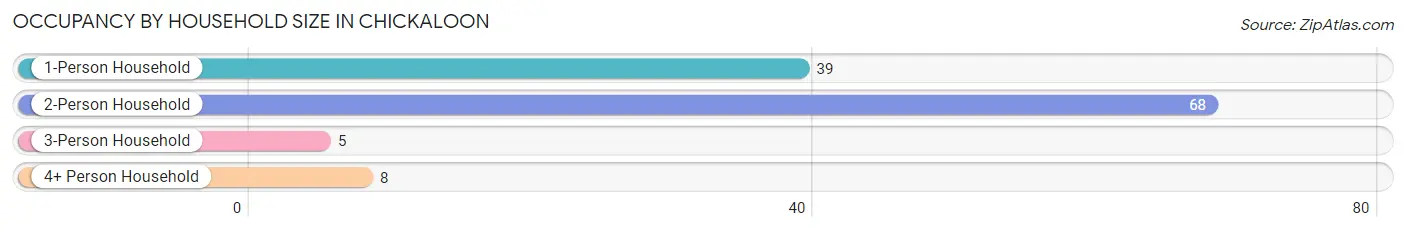
Occupancy by Household Size in Chickaloon
| Household Size | # Housing Units | % Housing Units |
| 1-Person Household | 39 | 32.5% |
| 2-Person Household | 68 | 56.7% |
| 3-Person Household | 5 | 4.2% |
| 4+ Person Household | 8 | 6.7% |
| Total Housing Units | 120 | 100.0% |
Occupancy by Ownership by Household Size in Chickaloon
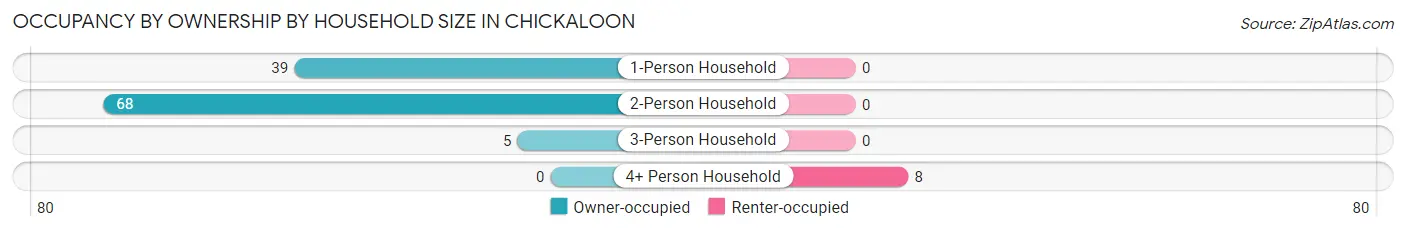
| Household Size | Owner-occupied | Renter-occupied |
| 1-Person Household | 39 (100.0%) | 0 (0.0%) |
| 2-Person Household | 68 (100.0%) | 0 (0.0%) |
| 3-Person Household | 5 (100.0%) | 0 (0.0%) |
| 4+ Person Household | 0 (0.0%) | 8 (100.0%) |
| Total Housing Units | 112 (93.3%) | 8 (6.7%) |
Occupancy by Educational Attainment in Chickaloon
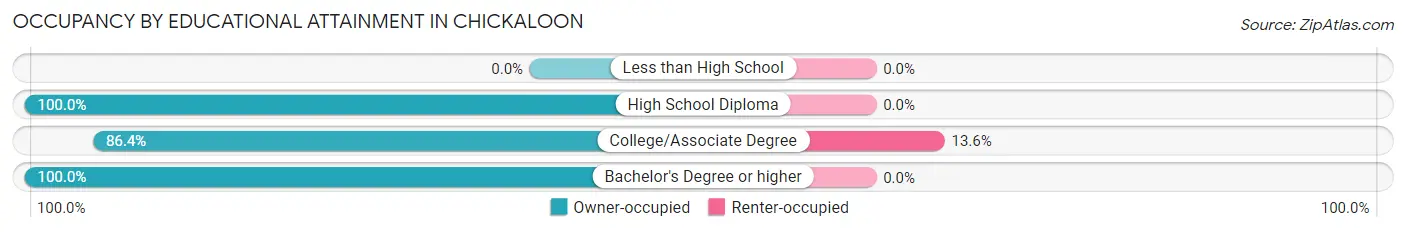
| Household Size | Owner-occupied | Renter-occupied |
| Less than High School | 0 (0.0%) | 0 (0.0%) |
| High School Diploma | 39 (100.0%) | 0 (0.0%) |
| College/Associate Degree | 51 (86.4%) | 8 (13.6%) |
| Bachelor's Degree or higher | 22 (100.0%) | 0 (0.0%) |
Occupancy by Age of Householder in Chickaloon
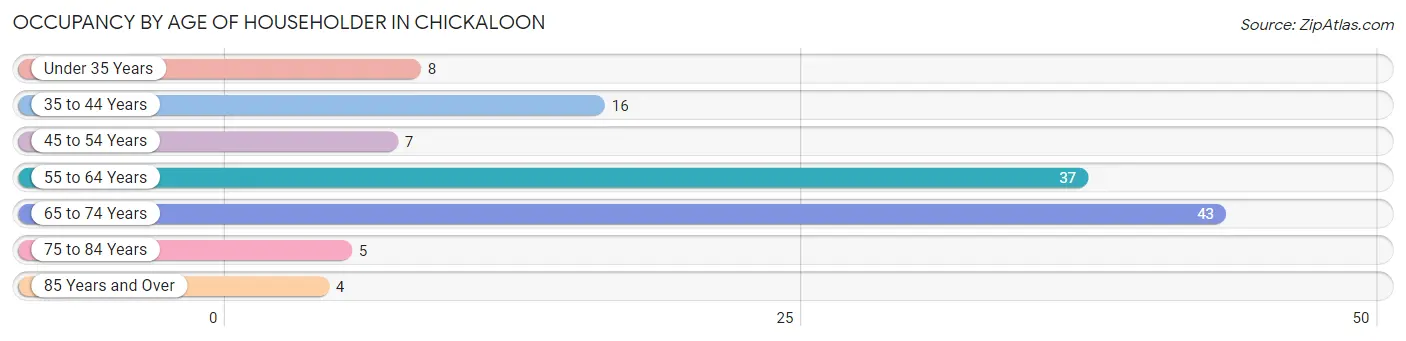
| Age Bracket | # Households | % Households |
| Under 35 Years | 8 | 6.7% |
| 35 to 44 Years | 16 | 13.3% |
| 45 to 54 Years | 7 | 5.8% |
| 55 to 64 Years | 37 | 30.8% |
| 65 to 74 Years | 43 | 35.8% |
| 75 to 84 Years | 5 | 4.2% |
| 85 Years and Over | 4 | 3.3% |
| Total | 120 | 100.0% |
Housing Finances in Chickaloon
Median Income by Occupancy in Chickaloon
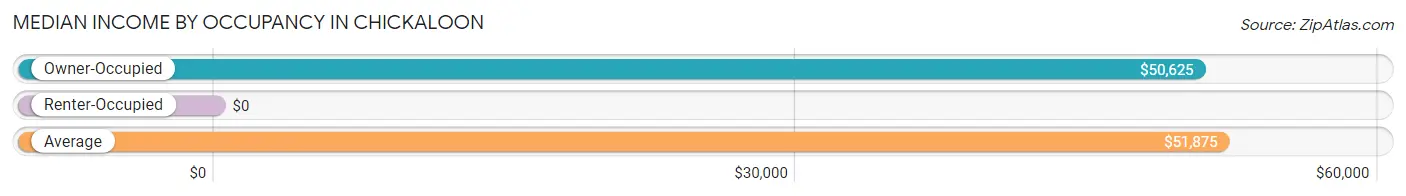
| Occupancy Type | # Households | Median Income |
| Owner-Occupied | 112 (93.3%) | $50,625 |
| Renter-Occupied | 8 (6.7%) | $0 |
| Average | 120 (100.0%) | $51,875 |
Occupancy by Householder Income Bracket in Chickaloon
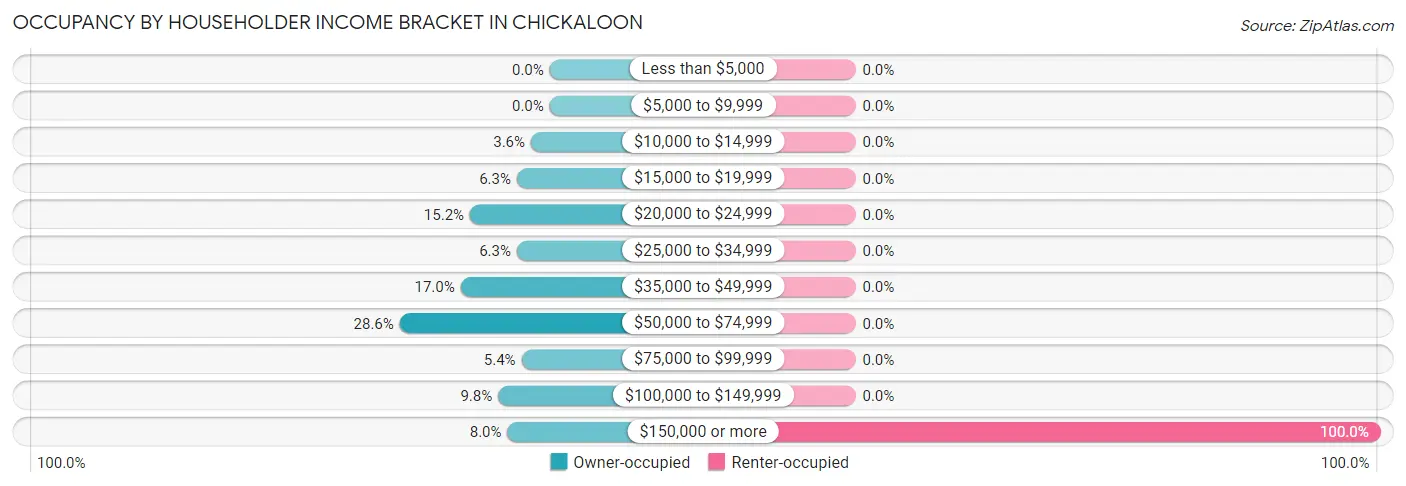
| Income Bracket | Owner-occupied | Renter-occupied |
| Less than $5,000 | 0 (0.0%) | 0 (0.0%) |
| $5,000 to $9,999 | 0 (0.0%) | 0 (0.0%) |
| $10,000 to $14,999 | 4 (3.6%) | 0 (0.0%) |
| $15,000 to $19,999 | 7 (6.2%) | 0 (0.0%) |
| $20,000 to $24,999 | 17 (15.2%) | 0 (0.0%) |
| $25,000 to $34,999 | 7 (6.2%) | 0 (0.0%) |
| $35,000 to $49,999 | 19 (17.0%) | 0 (0.0%) |
| $50,000 to $74,999 | 32 (28.6%) | 0 (0.0%) |
| $75,000 to $99,999 | 6 (5.4%) | 0 (0.0%) |
| $100,000 to $149,999 | 11 (9.8%) | 0 (0.0%) |
| $150,000 or more | 9 (8.0%) | 8 (100.0%) |
| Total | 112 (100.0%) | 8 (100.0%) |
Monthly Housing Cost Tiers in Chickaloon
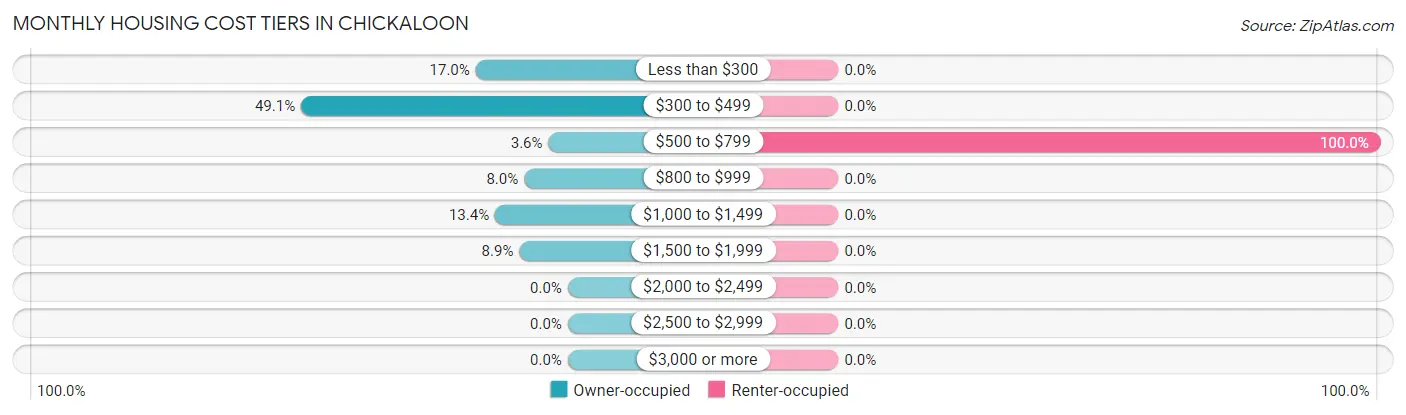
| Monthly Cost | Owner-occupied | Renter-occupied |
| Less than $300 | 19 (17.0%) | 0 (0.0%) |
| $300 to $499 | 55 (49.1%) | 0 (0.0%) |
| $500 to $799 | 4 (3.6%) | 8 (100.0%) |
| $800 to $999 | 9 (8.0%) | 0 (0.0%) |
| $1,000 to $1,499 | 15 (13.4%) | 0 (0.0%) |
| $1,500 to $1,999 | 10 (8.9%) | 0 (0.0%) |
| $2,000 to $2,499 | 0 (0.0%) | 0 (0.0%) |
| $2,500 to $2,999 | 0 (0.0%) | 0 (0.0%) |
| $3,000 or more | 0 (0.0%) | 0 (0.0%) |
| Total | 112 (100.0%) | 8 (100.0%) |
Physical Housing Characteristics in Chickaloon
Housing Structures in Chickaloon
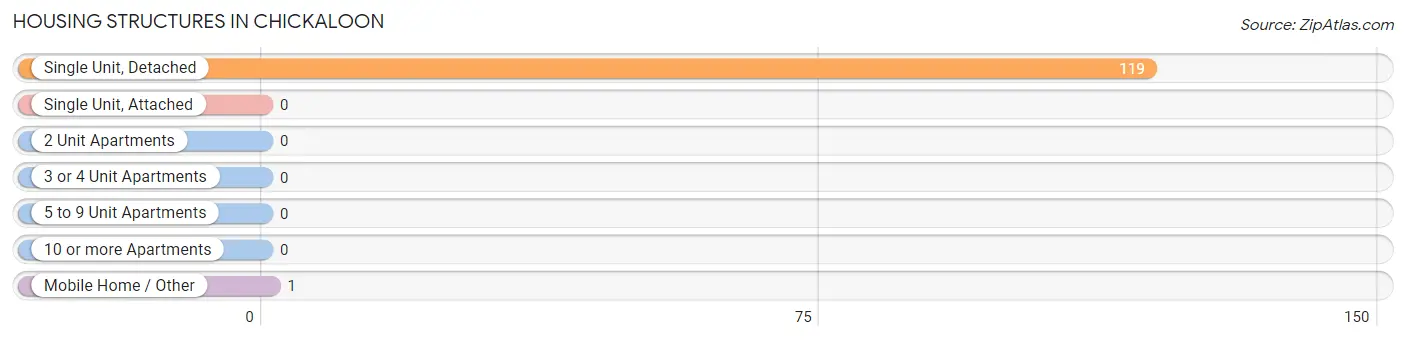
| Structure Type | # Housing Units | % Housing Units |
| Single Unit, Detached | 119 | 99.2% |
| Single Unit, Attached | 0 | 0.0% |
| 2 Unit Apartments | 0 | 0.0% |
| 3 or 4 Unit Apartments | 0 | 0.0% |
| 5 to 9 Unit Apartments | 0 | 0.0% |
| 10 or more Apartments | 0 | 0.0% |
| Mobile Home / Other | 1 | 0.8% |
| Total | 120 | 100.0% |
Housing Structures by Occupancy in Chickaloon
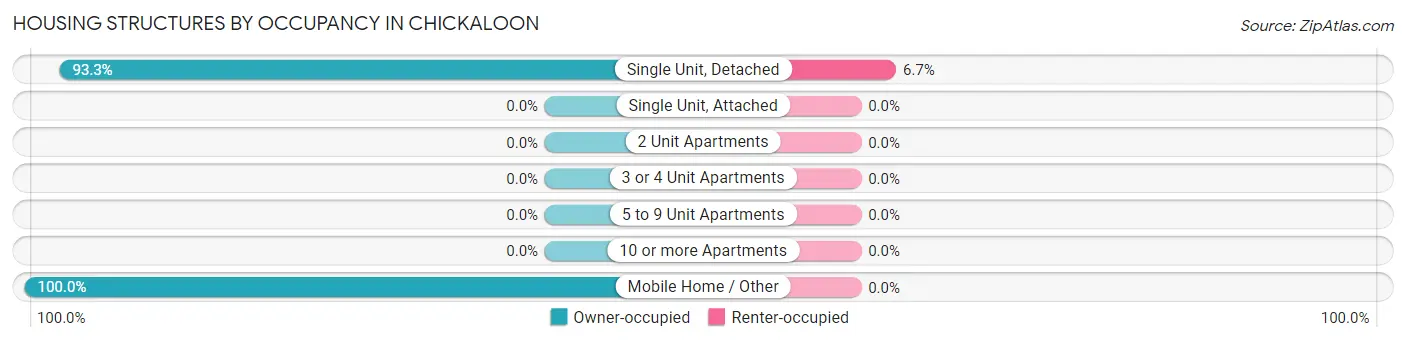
| Structure Type | Owner-occupied | Renter-occupied |
| Single Unit, Detached | 111 (93.3%) | 8 (6.7%) |
| Single Unit, Attached | 0 (0.0%) | 0 (0.0%) |
| 2 Unit Apartments | 0 (0.0%) | 0 (0.0%) |
| 3 or 4 Unit Apartments | 0 (0.0%) | 0 (0.0%) |
| 5 to 9 Unit Apartments | 0 (0.0%) | 0 (0.0%) |
| 10 or more Apartments | 0 (0.0%) | 0 (0.0%) |
| Mobile Home / Other | 1 (100.0%) | 0 (0.0%) |
| Total | 112 (93.3%) | 8 (6.7%) |
Housing Structures by Number of Rooms in Chickaloon
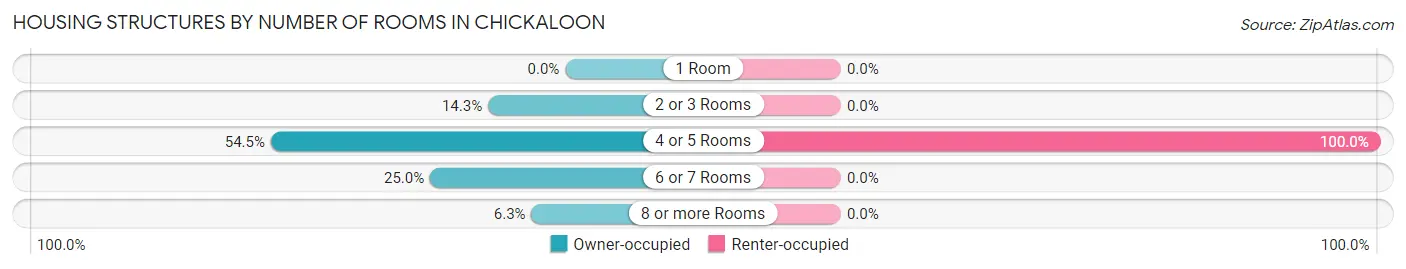
| Number of Rooms | Owner-occupied | Renter-occupied |
| 1 Room | 0 (0.0%) | 0 (0.0%) |
| 2 or 3 Rooms | 16 (14.3%) | 0 (0.0%) |
| 4 or 5 Rooms | 61 (54.5%) | 8 (100.0%) |
| 6 or 7 Rooms | 28 (25.0%) | 0 (0.0%) |
| 8 or more Rooms | 7 (6.2%) | 0 (0.0%) |
| Total | 112 (100.0%) | 8 (100.0%) |
Housing Structure by Heating Type in Chickaloon
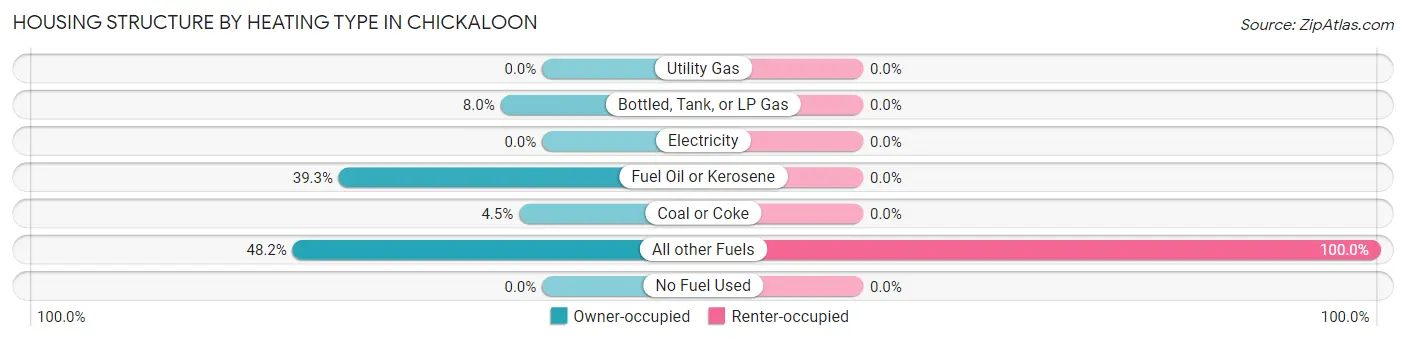
| Heating Type | Owner-occupied | Renter-occupied |
| Utility Gas | 0 (0.0%) | 0 (0.0%) |
| Bottled, Tank, or LP Gas | 9 (8.0%) | 0 (0.0%) |
| Electricity | 0 (0.0%) | 0 (0.0%) |
| Fuel Oil or Kerosene | 44 (39.3%) | 0 (0.0%) |
| Coal or Coke | 5 (4.5%) | 0 (0.0%) |
| All other Fuels | 54 (48.2%) | 8 (100.0%) |
| No Fuel Used | 0 (0.0%) | 0 (0.0%) |
| Total | 112 (100.0%) | 8 (100.0%) |
Household Vehicle Usage in Chickaloon
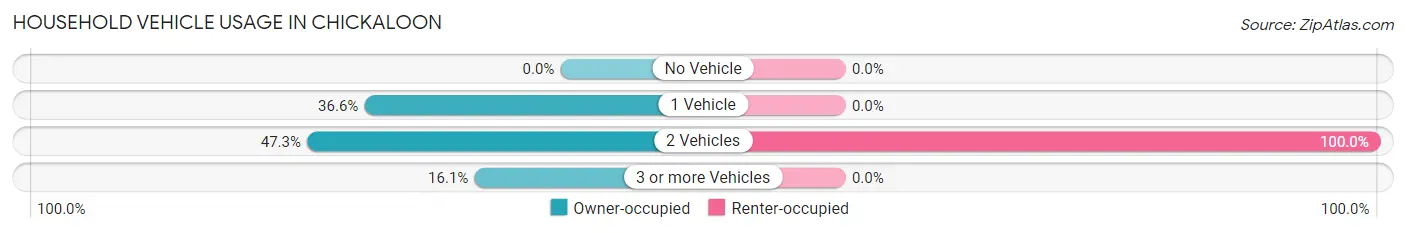
| Vehicles per Household | Owner-occupied | Renter-occupied |
| No Vehicle | 0 (0.0%) | 0 (0.0%) |
| 1 Vehicle | 41 (36.6%) | 0 (0.0%) |
| 2 Vehicles | 53 (47.3%) | 8 (100.0%) |
| 3 or more Vehicles | 18 (16.1%) | 0 (0.0%) |
| Total | 112 (100.0%) | 8 (100.0%) |
Real Estate & Mortgages in Chickaloon
Real Estate and Mortgage Overview in Chickaloon
| Characteristic | Without Mortgage | With Mortgage |
| Housing Units | 83 | 29 |
| Median Property Value | $237,500 | $243,200 |
| Median Household Income | $51,719 | $4 |
| Monthly Housing Costs | $390 | $0 |
| Real Estate Taxes | $2,353 | $6 |
Property Value by Mortgage Status in Chickaloon
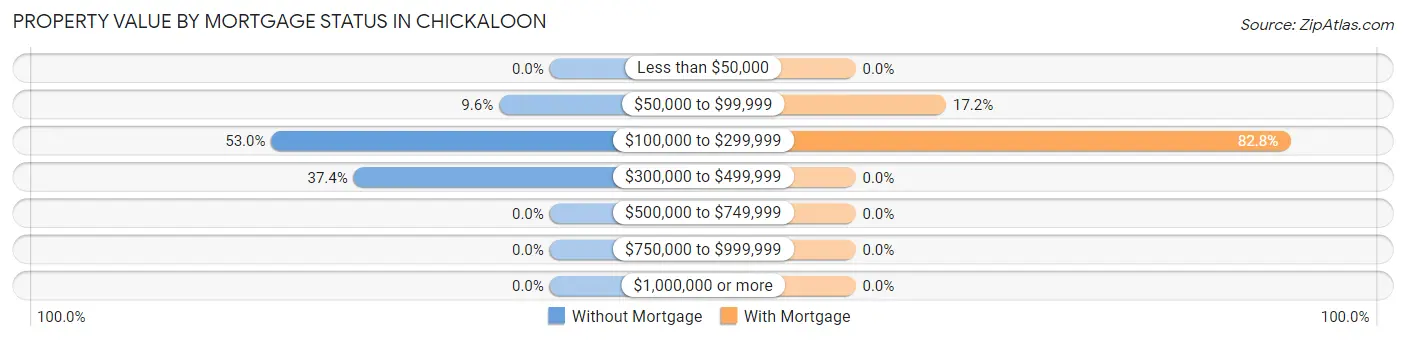
| Property Value | Without Mortgage | With Mortgage |
| Less than $50,000 | 0 (0.0%) | 0 (0.0%) |
| $50,000 to $99,999 | 8 (9.6%) | 5 (17.2%) |
| $100,000 to $299,999 | 44 (53.0%) | 24 (82.8%) |
| $300,000 to $499,999 | 31 (37.3%) | 0 (0.0%) |
| $500,000 to $749,999 | 0 (0.0%) | 0 (0.0%) |
| $750,000 to $999,999 | 0 (0.0%) | 0 (0.0%) |
| $1,000,000 or more | 0 (0.0%) | 0 (0.0%) |
| Total | 83 (100.0%) | 29 (100.0%) |
Household Income by Mortgage Status in Chickaloon
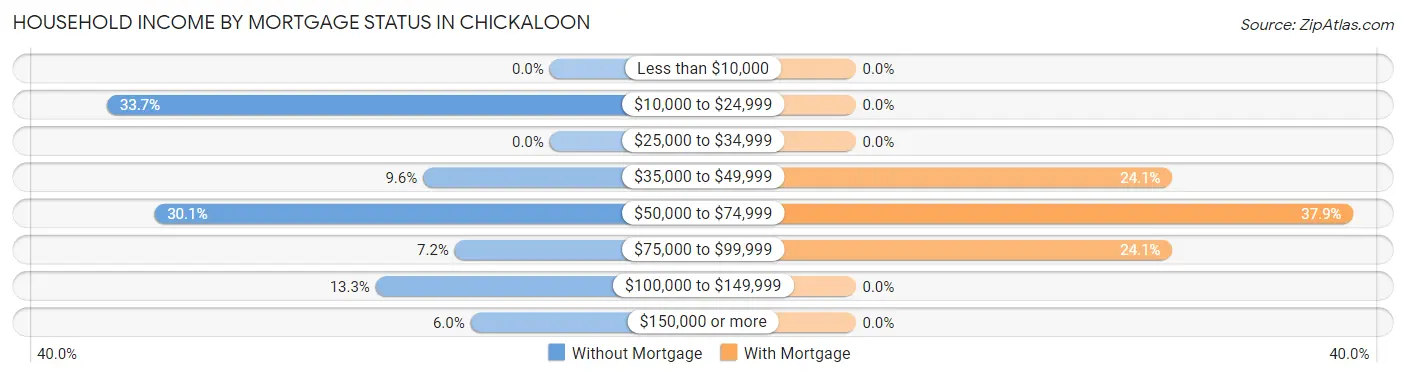
| Household Income | Without Mortgage | With Mortgage |
| Less than $10,000 | 0 (0.0%) | 0 (0.0%) |
| $10,000 to $24,999 | 28 (33.7%) | 0 (0.0%) |
| $25,000 to $34,999 | 0 (0.0%) | 0 (0.0%) |
| $35,000 to $49,999 | 8 (9.6%) | 7 (24.1%) |
| $50,000 to $74,999 | 25 (30.1%) | 11 (37.9%) |
| $75,000 to $99,999 | 6 (7.2%) | 7 (24.1%) |
| $100,000 to $149,999 | 11 (13.3%) | 0 (0.0%) |
| $150,000 or more | 5 (6.0%) | 0 (0.0%) |
| Total | 83 (100.0%) | 29 (100.0%) |
Property Value to Household Income Ratio in Chickaloon
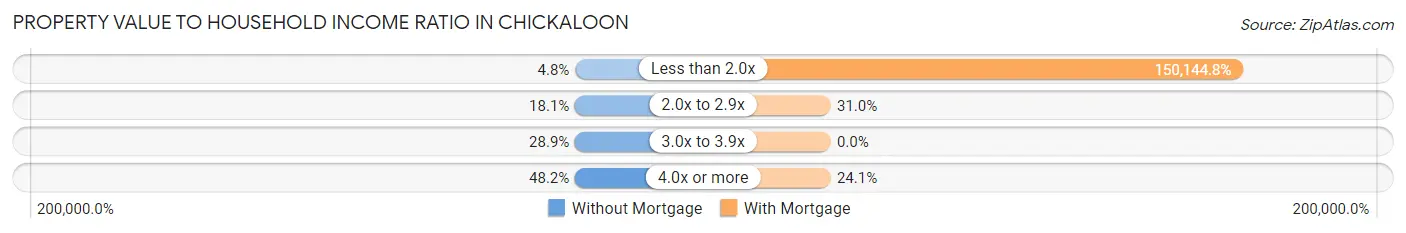
| Value-to-Income Ratio | Without Mortgage | With Mortgage |
| Less than 2.0x | 4 (4.8%) | 43,542 (150,144.8%) |
| 2.0x to 2.9x | 15 (18.1%) | 9 (31.0%) |
| 3.0x to 3.9x | 24 (28.9%) | 0 (0.0%) |
| 4.0x or more | 40 (48.2%) | 7 (24.1%) |
| Total | 83 (100.0%) | 29 (100.0%) |
Real Estate Taxes by Mortgage Status in Chickaloon
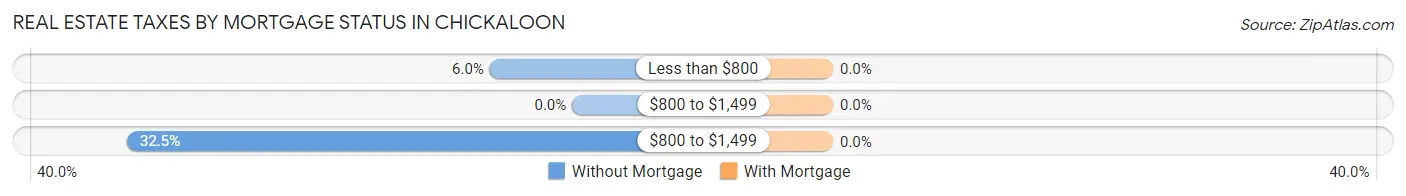
| Property Taxes | Without Mortgage | With Mortgage |
| Less than $800 | 5 (6.0%) | 0 (0.0%) |
| $800 to $1,499 | 0 (0.0%) | 0 (0.0%) |
| $800 to $1,499 | 27 (32.5%) | 0 (0.0%) |
| Total | 83 (100.0%) | 29 (100.0%) |
Health & Disability in Chickaloon
Health Insurance Coverage by Age in Chickaloon
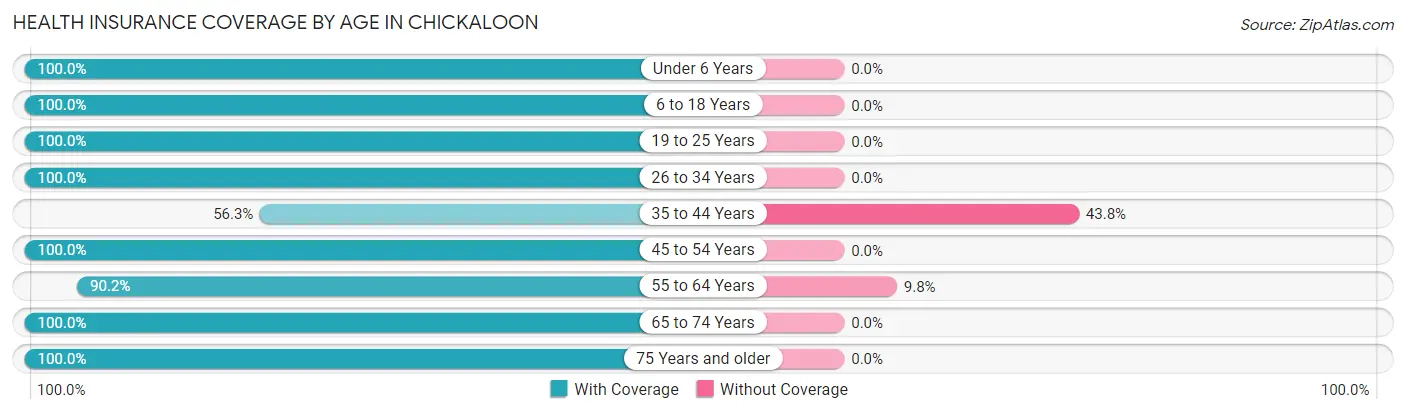
| Age Bracket | With Coverage | Without Coverage |
| Under 6 Years | 34 (100.0%) | 0 (0.0%) |
| 6 to 18 Years | 13 (100.0%) | 0 (0.0%) |
| 19 to 25 Years | 18 (100.0%) | 0 (0.0%) |
| 26 to 34 Years | 39 (100.0%) | 0 (0.0%) |
| 35 to 44 Years | 9 (56.2%) | 7 (43.8%) |
| 45 to 54 Years | 11 (100.0%) | 0 (0.0%) |
| 55 to 64 Years | 46 (90.2%) | 5 (9.8%) |
| 65 to 74 Years | 85 (100.0%) | 0 (0.0%) |
| 75 Years and older | 16 (100.0%) | 0 (0.0%) |
| Total | 271 (95.8%) | 12 (4.2%) |
Health Insurance Coverage by Citizenship Status in Chickaloon
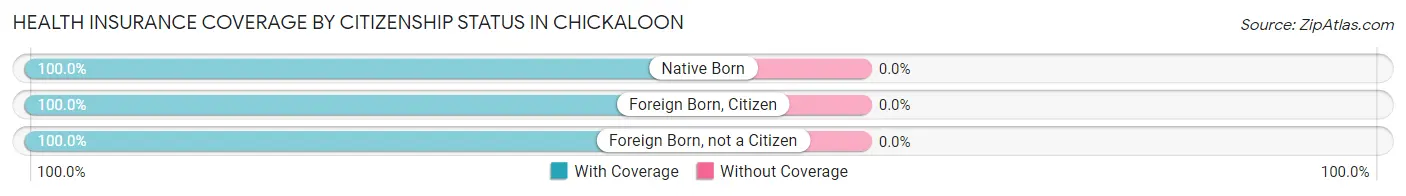
| Citizenship Status | With Coverage | Without Coverage |
| Native Born | 34 (100.0%) | 0 (0.0%) |
| Foreign Born, Citizen | 13 (100.0%) | 0 (0.0%) |
| Foreign Born, not a Citizen | 18 (100.0%) | 0 (0.0%) |
Health Insurance Coverage by Household Income in Chickaloon
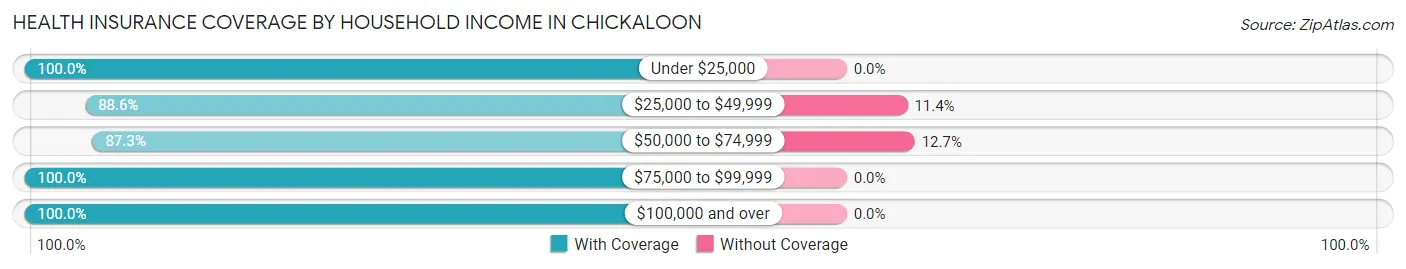
| Household Income | With Coverage | Without Coverage |
| Under $25,000 | 32 (100.0%) | 0 (0.0%) |
| $25,000 to $49,999 | 39 (88.6%) | 5 (11.4%) |
| $50,000 to $74,999 | 48 (87.3%) | 7 (12.7%) |
| $75,000 to $99,999 | 12 (100.0%) | 0 (0.0%) |
| $100,000 and over | 140 (100.0%) | 0 (0.0%) |
Public vs Private Health Insurance Coverage by Age in Chickaloon
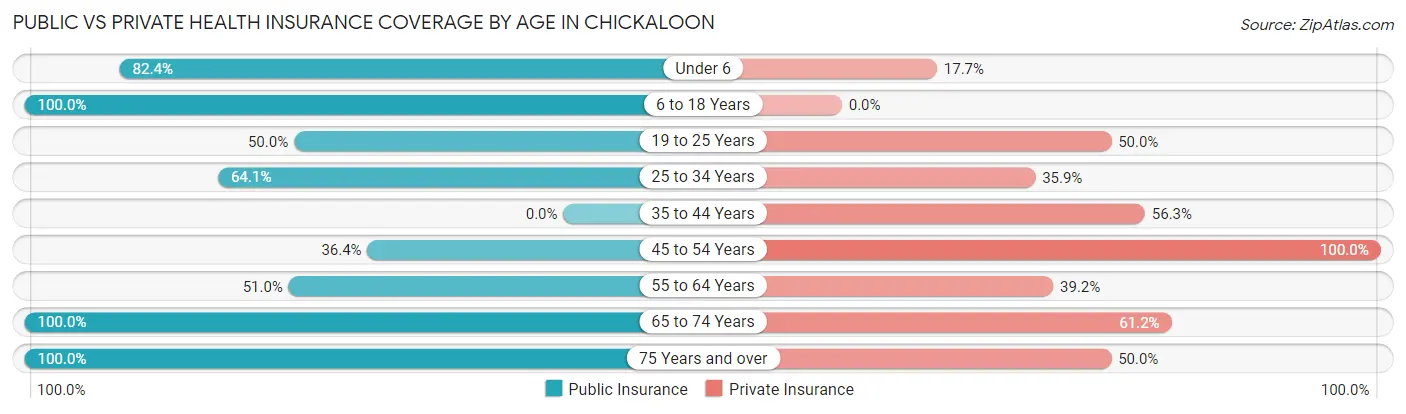
| Age Bracket | Public Insurance | Private Insurance |
| Under 6 | 28 (82.4%) | 6 (17.6%) |
| 6 to 18 Years | 13 (100.0%) | 0 (0.0%) |
| 19 to 25 Years | 9 (50.0%) | 9 (50.0%) |
| 25 to 34 Years | 25 (64.1%) | 14 (35.9%) |
| 35 to 44 Years | 0 (0.0%) | 9 (56.2%) |
| 45 to 54 Years | 4 (36.4%) | 11 (100.0%) |
| 55 to 64 Years | 26 (51.0%) | 20 (39.2%) |
| 65 to 74 Years | 85 (100.0%) | 52 (61.2%) |
| 75 Years and over | 16 (100.0%) | 8 (50.0%) |
| Total | 206 (72.8%) | 129 (45.6%) |
Disability Status by Sex by Age in Chickaloon
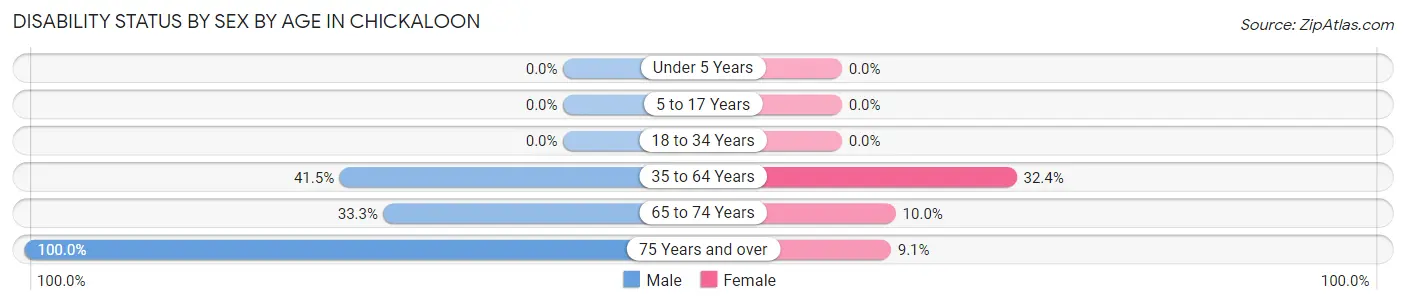
| Age Bracket | Male | Female |
| Under 5 Years | 0 (0.0%) | 0 (0.0%) |
| 5 to 17 Years | 0 (0.0%) | 0 (0.0%) |
| 18 to 34 Years | 0 (0.0%) | 0 (0.0%) |
| 35 to 64 Years | 17 (41.5%) | 12 (32.4%) |
| 65 to 74 Years | 15 (33.3%) | 4 (10.0%) |
| 75 Years and over | 5 (100.0%) | 1 (9.1%) |
Disability Class by Sex by Age in Chickaloon
Disability Class: Hearing Difficulty
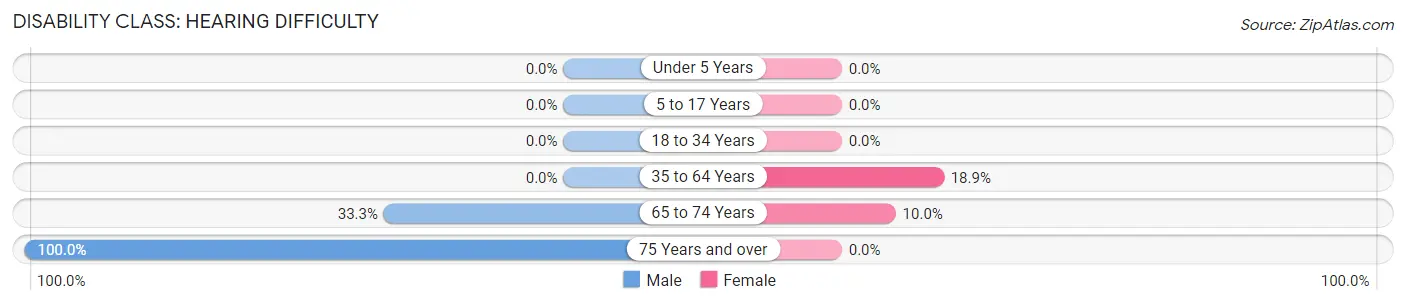
| Age Bracket | Male | Female |
| Under 5 Years | 0 (0.0%) | 0 (0.0%) |
| 5 to 17 Years | 0 (0.0%) | 0 (0.0%) |
| 18 to 34 Years | 0 (0.0%) | 0 (0.0%) |
| 35 to 64 Years | 0 (0.0%) | 7 (18.9%) |
| 65 to 74 Years | 15 (33.3%) | 4 (10.0%) |
| 75 Years and over | 5 (100.0%) | 0 (0.0%) |
Disability Class: Vision Difficulty
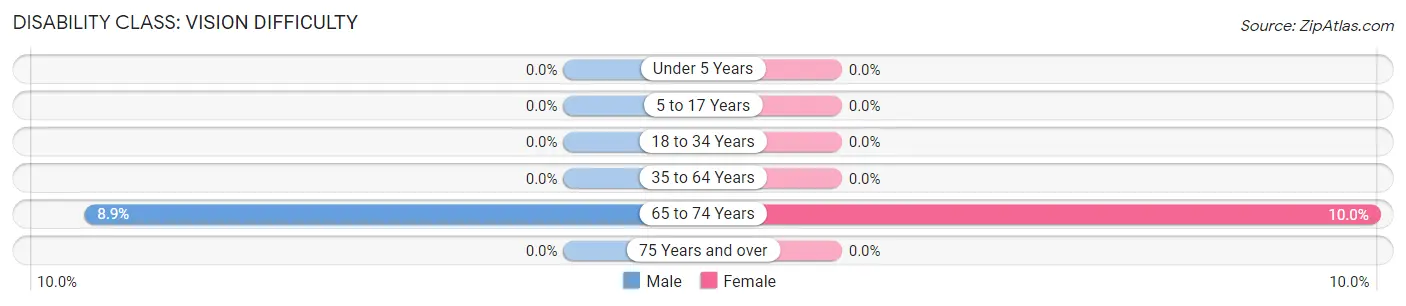
| Age Bracket | Male | Female |
| Under 5 Years | 0 (0.0%) | 0 (0.0%) |
| 5 to 17 Years | 0 (0.0%) | 0 (0.0%) |
| 18 to 34 Years | 0 (0.0%) | 0 (0.0%) |
| 35 to 64 Years | 0 (0.0%) | 0 (0.0%) |
| 65 to 74 Years | 4 (8.9%) | 4 (10.0%) |
| 75 Years and over | 0 (0.0%) | 0 (0.0%) |
Disability Class: Cognitive Difficulty
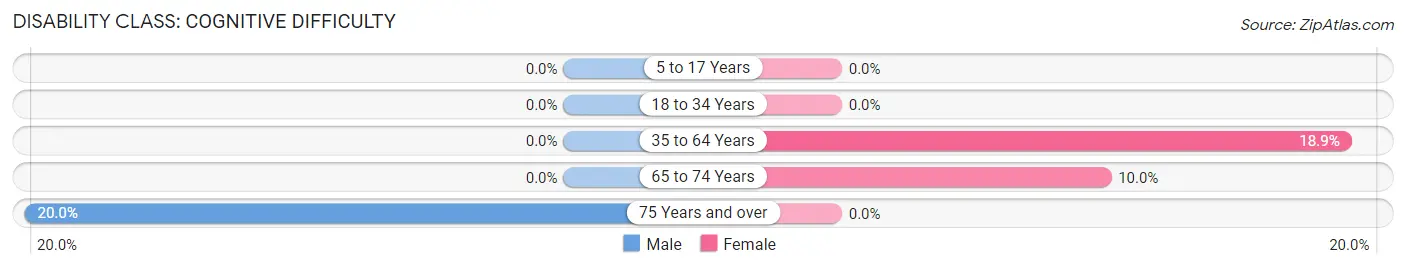
| Age Bracket | Male | Female |
| 5 to 17 Years | 0 (0.0%) | 0 (0.0%) |
| 18 to 34 Years | 0 (0.0%) | 0 (0.0%) |
| 35 to 64 Years | 0 (0.0%) | 7 (18.9%) |
| 65 to 74 Years | 0 (0.0%) | 4 (10.0%) |
| 75 Years and over | 1 (20.0%) | 0 (0.0%) |
Disability Class: Ambulatory Difficulty
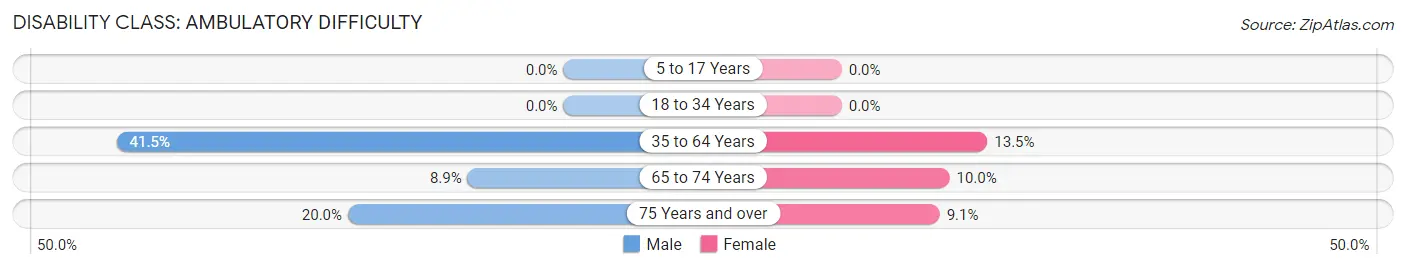
| Age Bracket | Male | Female |
| 5 to 17 Years | 0 (0.0%) | 0 (0.0%) |
| 18 to 34 Years | 0 (0.0%) | 0 (0.0%) |
| 35 to 64 Years | 17 (41.5%) | 5 (13.5%) |
| 65 to 74 Years | 4 (8.9%) | 4 (10.0%) |
| 75 Years and over | 1 (20.0%) | 1 (9.1%) |
Disability Class: Self-Care Difficulty
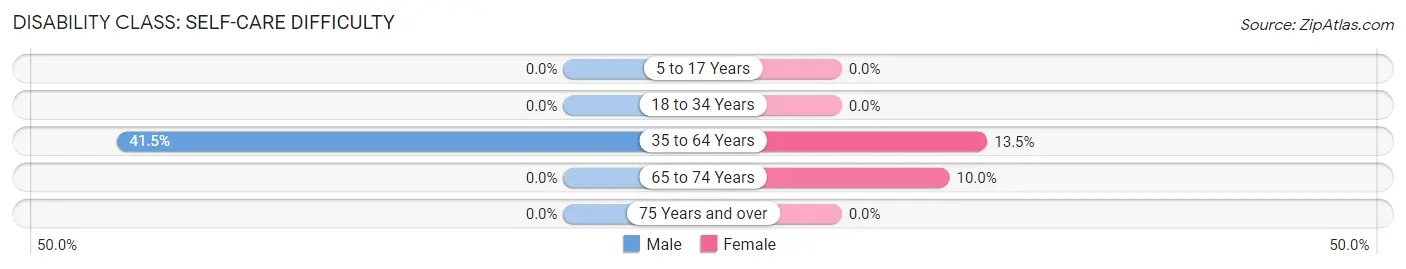
| Age Bracket | Male | Female |
| 5 to 17 Years | 0 (0.0%) | 0 (0.0%) |
| 18 to 34 Years | 0 (0.0%) | 0 (0.0%) |
| 35 to 64 Years | 17 (41.5%) | 5 (13.5%) |
| 65 to 74 Years | 0 (0.0%) | 4 (10.0%) |
| 75 Years and over | 0 (0.0%) | 0 (0.0%) |
Technology Access in Chickaloon
Computing Device Access in Chickaloon
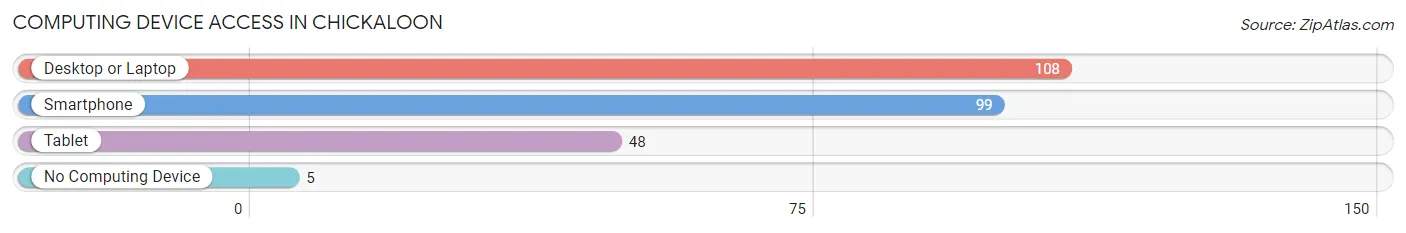
| Device Type | # Households | % Households |
| Desktop or Laptop | 108 | 90.0% |
| Smartphone | 99 | 82.5% |
| Tablet | 48 | 40.0% |
| No Computing Device | 5 | 4.2% |
| Total | 120 | 100.0% |
Internet Access in Chickaloon
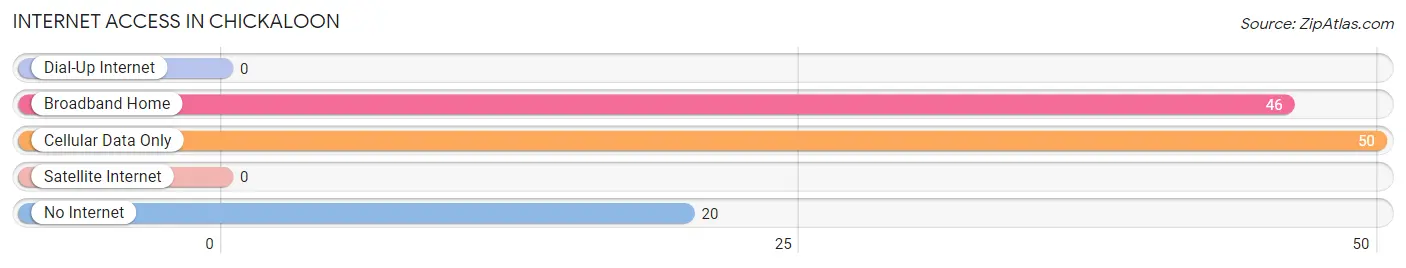
| Internet Type | # Households | % Households |
| Dial-Up Internet | 0 | 0.0% |
| Broadband Home | 46 | 38.3% |
| Cellular Data Only | 50 | 41.7% |
| Satellite Internet | 0 | 0.0% |
| No Internet | 20 | 16.7% |
| Total | 120 | 100.0% |
Chickaloon Summary
Chickaloon is a small unincorporated community located in the Matanuska-Susitna Borough of Alaska. It is situated on the western edge of the Chugach Mountains, approximately 40 miles northeast of Anchorage. The community is home to approximately 200 people, most of whom are of Native American descent.
History
The Chickaloon area has been inhabited by Native Americans for thousands of years. The Dena’ina Athabascan people have lived in the area for centuries, and the Chickaloon Village Tribal Council is the federally recognized tribal government for the area. The first non-Native settlers arrived in the area in the late 1800s, and the community was officially established in 1902. The name “Chickaloon” is derived from the Dena’ina word “Chikalun”, which means “place of many berries”.
Geography
Chickaloon is located in the Matanuska-Susitna Borough of Alaska, approximately 40 miles northeast of Anchorage. The community is situated on the western edge of the Chugach Mountains, and is surrounded by the Matanuska and Susitna Rivers. The area is characterized by rolling hills, forests, and numerous lakes and streams. The climate is generally mild, with temperatures ranging from -20°F in the winter to 70°F in the summer.
Economy
The economy of Chickaloon is largely based on subsistence activities, such as fishing, hunting, and gathering. The community is also home to several small businesses, including a general store, a gas station, and a restaurant. The Chickaloon Village Tribal Council operates a fish hatchery, which provides employment for many of the community’s residents. The area is also home to several tourist attractions, including the Alaska Wildlife Conservation Center and the Matanuska Glacier.
Demographics
As of the 2010 census, the population of Chickaloon was approximately 200 people. The majority of the population is of Native American descent, with the Dena’ina Athabascan people making up the largest ethnic group. The median household income in the community is $45,000, and the median age is 35. The unemployment rate is approximately 8%, and the poverty rate is approximately 20%.
Overall, Chickaloon is a small, rural community with a rich history and culture. The area is home to a diverse population, and the economy is largely based on subsistence activities and tourism. The community is also home to several tourist attractions, and is a popular destination for outdoor enthusiasts.
Common Questions
What is Per Capita Income in Chickaloon?
Per Capita income in Chickaloon is $30,229.
What is the Median Family Income in Chickaloon?
Median Family Income in Chickaloon is $59,375.
What is the Median Household income in Chickaloon?
Median Household Income in Chickaloon is $51,875.
What is Inequality or Gini Index in Chickaloon?
Inequality or Gini Index in Chickaloon is 0.40.
What is the Total Population of Chickaloon?
Total Population of Chickaloon is 283.
What is the Total Male Population of Chickaloon?
Total Male Population of Chickaloon is 142.
What is the Total Female Population of Chickaloon?
Total Female Population of Chickaloon is 141.
What is the Ratio of Males per 100 Females in Chickaloon?
There are 100.71 Males per 100 Females in Chickaloon.
What is the Ratio of Females per 100 Males in Chickaloon?
There are 99.30 Females per 100 Males in Chickaloon.
What is the Median Population Age in Chickaloon?
Median Population Age in Chickaloon is 59.0 Years.
What is the Average Family Size in Chickaloon
Average Family Size in Chickaloon is 2.9 People.
What is the Average Household Size in Chickaloon
Average Household Size in Chickaloon is 2.4 People.
How Large is the Labor Force in Chickaloon?
There are 85 People in the Labor Forcein in Chickaloon.
What is the Percentage of People in the Labor Force in Chickaloon?
36.0% of People are in the Labor Force in Chickaloon.
What is the Unemployment Rate in Chickaloon?
Unemployment Rate in Chickaloon is 23.5%.