Farmers Loop, AK Map & Demographics
Farmers Loop Map
Farmers Loop Overview
$46,658
PER CAPITA INCOME
$116,036
AVG FAMILY INCOME
$100,638
AVG HOUSEHOLD INCOME
42.6%
WAGE / INCOME GAP [ % ]
57.4¢/ $1
WAGE / INCOME GAP [ $ ]
0.29
INEQUALITY / GINI INDEX
4,179
TOTAL POPULATION
2,234
MALE POPULATION
1,945
FEMALE POPULATION
114.86
MALES / 100 FEMALES
87.06
FEMALES / 100 MALES
35.2
MEDIAN AGE
3.1
AVG FAMILY SIZE
2.5
AVG HOUSEHOLD SIZE
2,386
LABOR FORCE [ PEOPLE ]
71.4%
PERCENT IN LABOR FORCE
3.7%
UNEMPLOYMENT RATE
Income in Farmers Loop
Income Overview in Farmers Loop
Per Capita Income in Farmers Loop is $46,658, while median incomes of families and households are $116,036 and $100,638 respectively.
| Characteristic | Number | Measure |
| Per Capita Income | 4,179 | $46,658 |
| Median Family Income | 1,055 | $116,036 |
| Mean Family Income | 1,055 | $134,238 |
| Median Household Income | 1,658 | $100,638 |
| Mean Household Income | 1,658 | $116,951 |
| Income Deficit | 1,055 | $0 |
| Wage / Income Gap (%) | 4,179 | 42.61% |
| Wage / Income Gap ($) | 4,179 | 57.39¢ per $1 |
| Gini / Inequality Index | 4,179 | 0.29 |
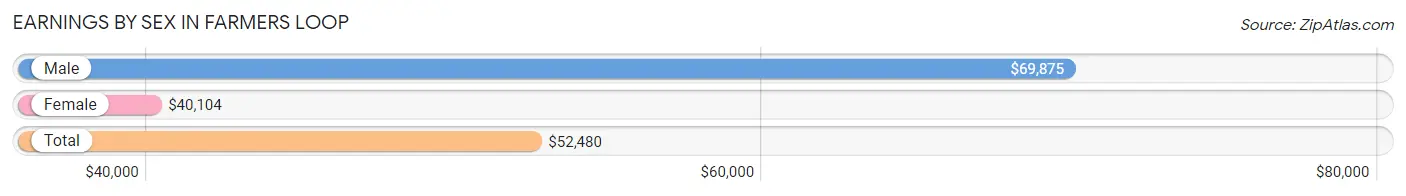
Earnings by Sex in Farmers Loop
Average Earnings in Farmers Loop are $52,480, $69,875 for men and $40,104 for women, a difference of 42.6%.
| Sex | Number | Average Earnings |
| Male | 1,573 (61.3%) | $69,875 |
| Female | 995 (38.8%) | $40,104 |
| Total | 2,568 (100.0%) | $52,480 |
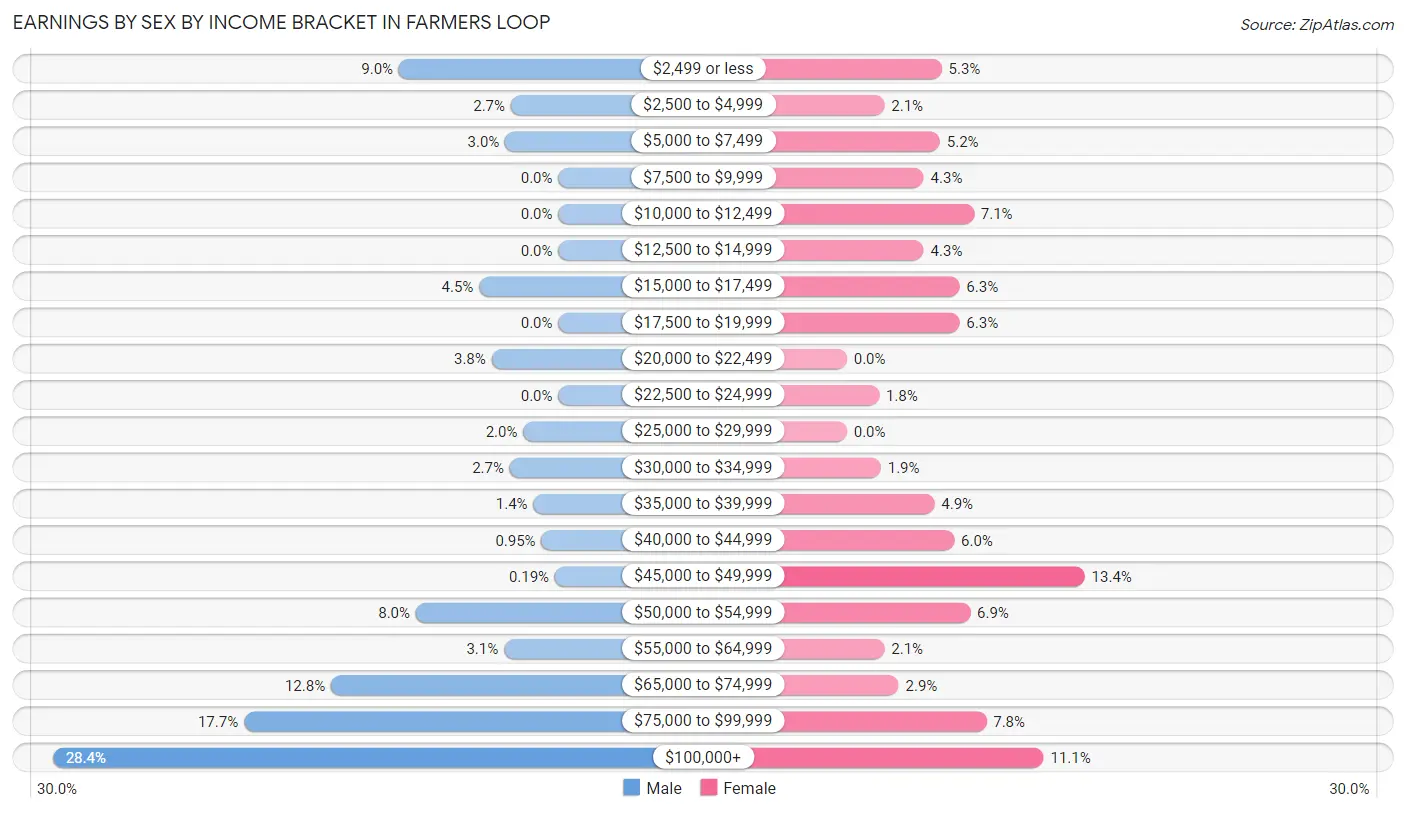
Earnings by Sex by Income Bracket in Farmers Loop
The most common earnings brackets in Farmers Loop are $100,000+ for men (447 | 28.4%) and $45,000 to $49,999 for women (133 | 13.4%).
| Income | Male | Female |
| $2,499 or less | 141 (9.0%) | 53 (5.3%) |
| $2,500 to $4,999 | 42 (2.7%) | 21 (2.1%) |
| $5,000 to $7,499 | 47 (3.0%) | 52 (5.2%) |
| $7,500 to $9,999 | 0 (0.0%) | 43 (4.3%) |
| $10,000 to $12,499 | 0 (0.0%) | 71 (7.1%) |
| $12,500 to $14,999 | 0 (0.0%) | 43 (4.3%) |
| $15,000 to $17,499 | 70 (4.4%) | 63 (6.3%) |
| $17,500 to $19,999 | 0 (0.0%) | 63 (6.3%) |
| $20,000 to $22,499 | 59 (3.7%) | 0 (0.0%) |
| $22,500 to $24,999 | 0 (0.0%) | 18 (1.8%) |
| $25,000 to $29,999 | 31 (2.0%) | 0 (0.0%) |
| $30,000 to $34,999 | 43 (2.7%) | 19 (1.9%) |
| $35,000 to $39,999 | 22 (1.4%) | 49 (4.9%) |
| $40,000 to $44,999 | 15 (0.9%) | 60 (6.0%) |
| $45,000 to $49,999 | 3 (0.2%) | 133 (13.4%) |
| $50,000 to $54,999 | 126 (8.0%) | 69 (6.9%) |
| $55,000 to $64,999 | 48 (3.0%) | 21 (2.1%) |
| $65,000 to $74,999 | 201 (12.8%) | 29 (2.9%) |
| $75,000 to $99,999 | 278 (17.7%) | 78 (7.8%) |
| $100,000+ | 447 (28.4%) | 110 (11.1%) |
| Total | 1,573 (100.0%) | 995 (100.0%) |
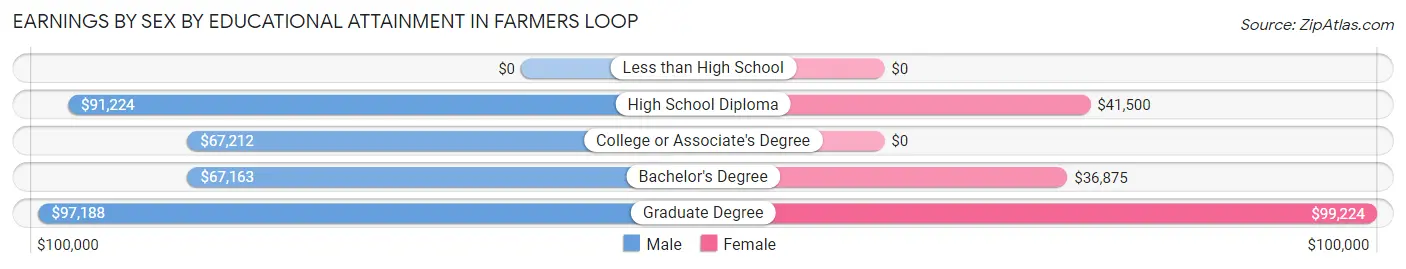
Earnings by Sex by Educational Attainment in Farmers Loop
Average earnings in Farmers Loop are $90,185 for men and $46,125 for women, a difference of 48.9%. Men with an educational attainment of graduate degree enjoy the highest average annual earnings of $97,188, while those with bachelor's degree education earn the least with $67,163. Women with an educational attainment of graduate degree earn the most with the average annual earnings of $99,224, while those with bachelor's degree education have the smallest earnings of $36,875.
| Educational Attainment | Male Income | Female Income |
| Less than High School | - | - |
| High School Diploma | $91,224 | $41,500 |
| College or Associate's Degree | $67,212 | $0 |
| Bachelor's Degree | $67,163 | $36,875 |
| Graduate Degree | $97,188 | $99,224 |
| Total | $90,185 | $46,125 |
Family Income in Farmers Loop
Family Income Brackets in Farmers Loop
According to the Farmers Loop family income data, there are 316 families falling into the $100,000 to $149,999 income range, which is the most common income bracket and makes up 29.9% of all families.
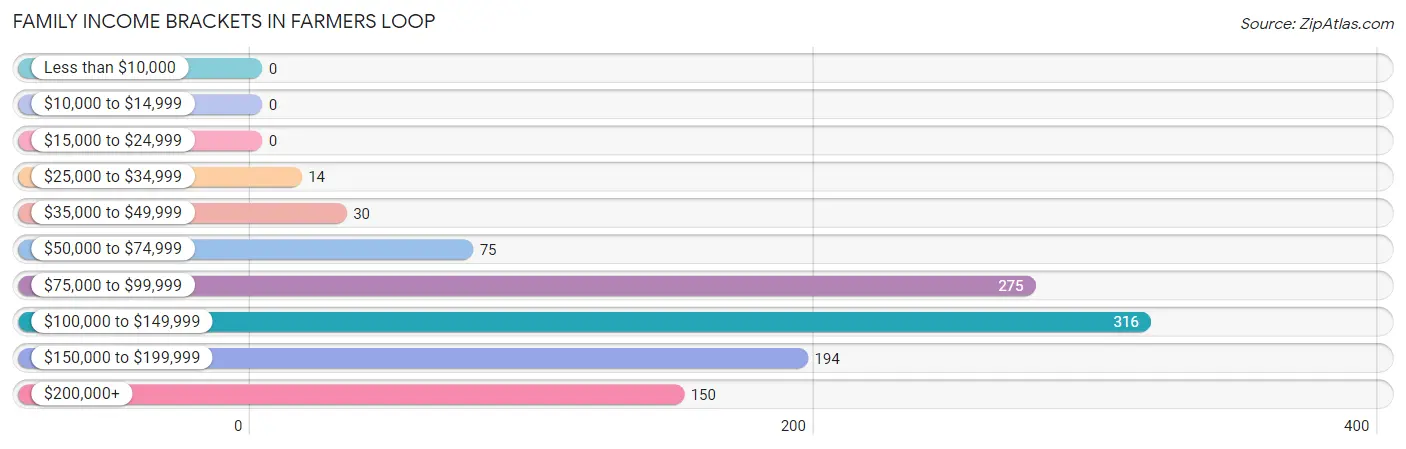
| Income Bracket | # Families | % Families |
| Less than $10,000 | 0 | 0.0% |
| $10,000 to $14,999 | 0 | 0.0% |
| $15,000 to $24,999 | 0 | 0.0% |
| $25,000 to $34,999 | 14 | 1.3% |
| $35,000 to $49,999 | 30 | 2.8% |
| $50,000 to $74,999 | 75 | 7.1% |
| $75,000 to $99,999 | 275 | 26.1% |
| $100,000 to $149,999 | 316 | 30.0% |
| $150,000 to $199,999 | 194 | 18.4% |
| $200,000+ | 150 | 14.2% |
Family Income by Famaliy Size in Farmers Loop
3-person families (193 | 18.3%) account for the highest median family income in Farmers Loop with $151,645 per family, while 2-person families (564 | 53.5%) have the highest median income of $54,312 per family member.
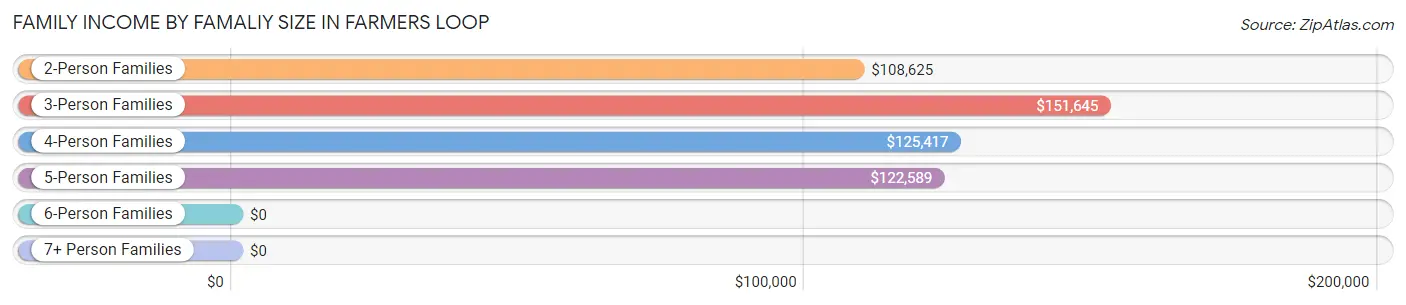
| Income Bracket | # Families | Median Income |
| 2-Person Families | 564 (53.5%) | $108,625 |
| 3-Person Families | 193 (18.3%) | $151,645 |
| 4-Person Families | 155 (14.7%) | $125,417 |
| 5-Person Families | 75 (7.1%) | $122,589 |
| 6-Person Families | 0 (0.0%) | $0 |
| 7+ Person Families | 68 (6.5%) | $0 |
| Total | 1,055 (100.0%) | $116,036 |
Family Income by Number of Earners in Farmers Loop
The median family income in Farmers Loop is $116,036, with families comprising 3+ earners (130) having the highest median family income of $190,089, while families with 1 earner (469) have the lowest median family income of $99,510, accounting for 12.3% and 44.5% of families, respectively.
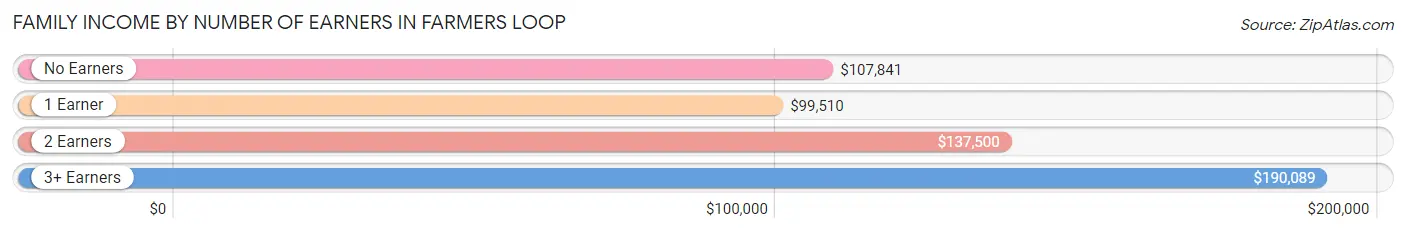
| Number of Earners | # Families | Median Income |
| No Earners | 38 (3.6%) | $107,841 |
| 1 Earner | 469 (44.5%) | $99,510 |
| 2 Earners | 418 (39.6%) | $137,500 |
| 3+ Earners | 130 (12.3%) | $190,089 |
| Total | 1,055 (100.0%) | $116,036 |
Household Income in Farmers Loop
Household Income Brackets in Farmers Loop
With 487 households falling in the category, the $100,000 to $149,999 income range is the most frequent in Farmers Loop, accounting for 29.4% of all households.
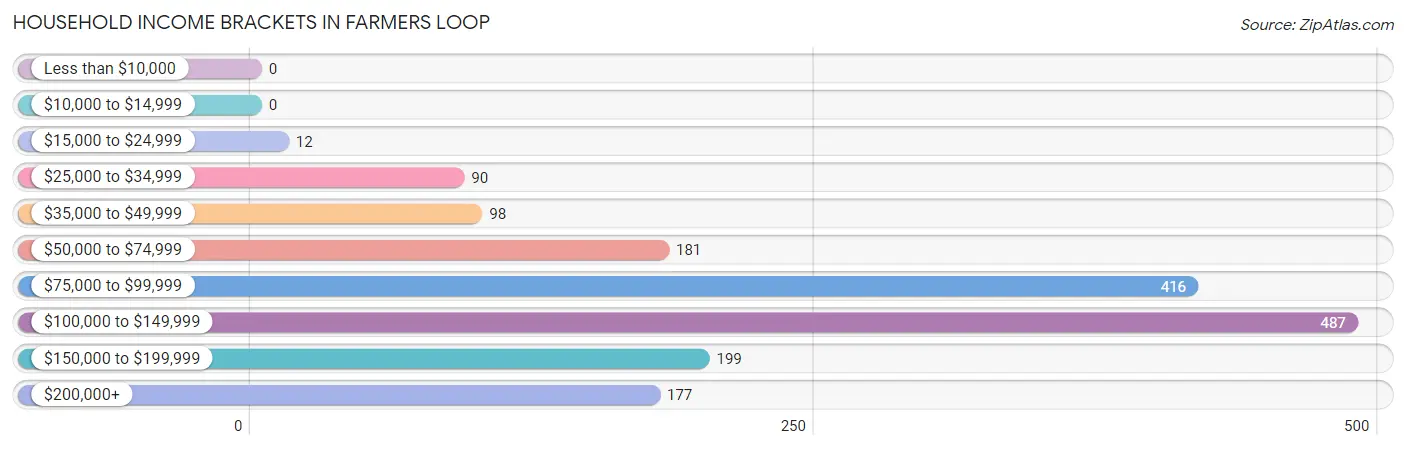
| Income Bracket | # Households | % Households |
| Less than $10,000 | 0 | 0.0% |
| $10,000 to $14,999 | 0 | 0.0% |
| $15,000 to $24,999 | 12 | 0.7% |
| $25,000 to $34,999 | 90 | 5.4% |
| $35,000 to $49,999 | 98 | 5.9% |
| $50,000 to $74,999 | 181 | 10.9% |
| $75,000 to $99,999 | 416 | 25.1% |
| $100,000 to $149,999 | 487 | 29.4% |
| $150,000 to $199,999 | 199 | 12.0% |
| $200,000+ | 177 | 10.7% |
Household Income by Householder Age in Farmers Loop
The median household income in Farmers Loop is $100,638, with the highest median household income of $105,333 found in the 45 to 64 years age bracket for the primary householder. A total of 724 households (43.7%) fall into this category. Meanwhile, the 15 to 24 years age bracket for the primary householder has the lowest median household income of $0, with 11 households (0.7%) in this group.
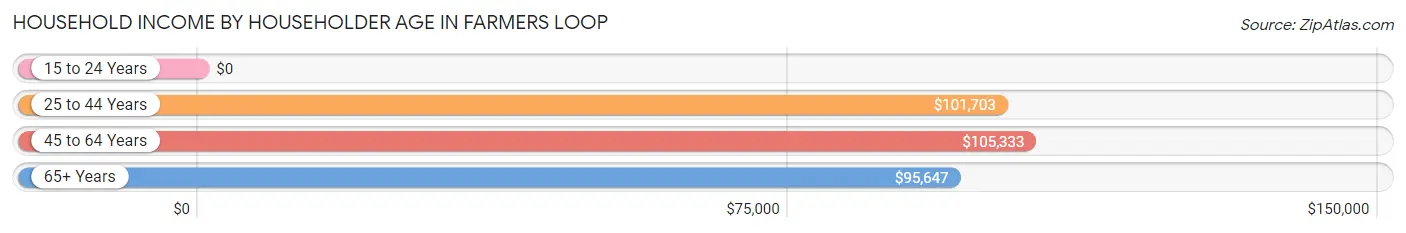
| Income Bracket | # Households | Median Income |
| 15 to 24 Years | 11 (0.7%) | $0 |
| 25 to 44 Years | 620 (37.4%) | $101,703 |
| 45 to 64 Years | 724 (43.7%) | $105,333 |
| 65+ Years | 303 (18.3%) | $95,647 |
| Total | 1,658 (100.0%) | $100,638 |
Poverty in Farmers Loop
Income Below Poverty by Sex and Age in Farmers Loop
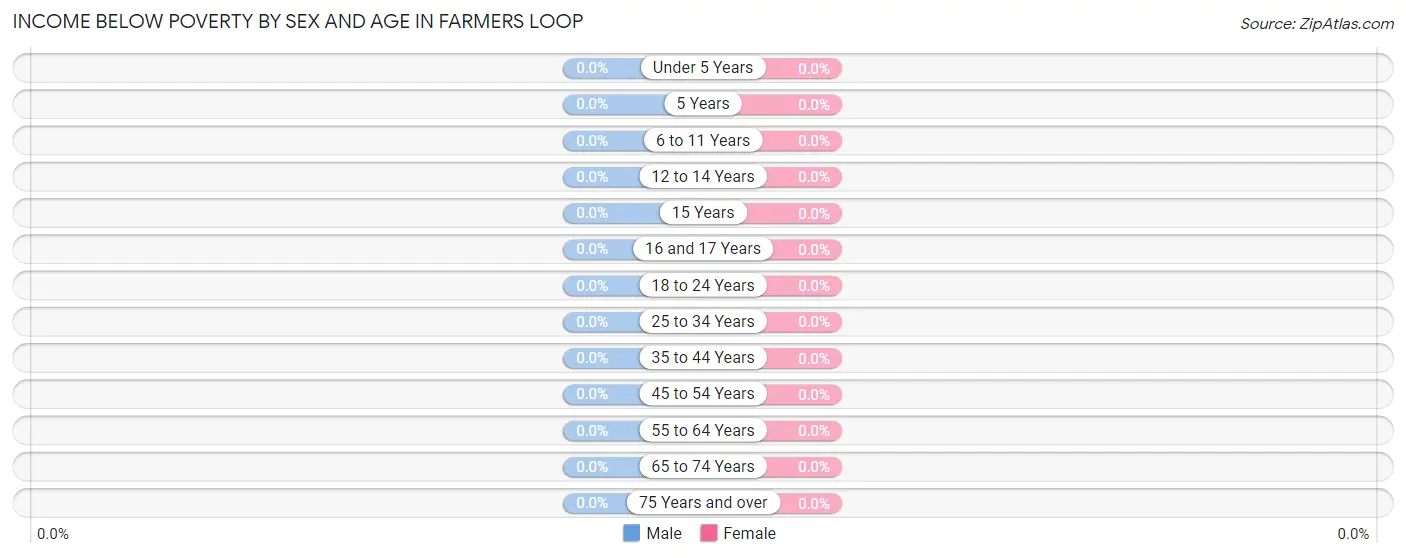
| Age Bracket | Male | Female |
| Under 5 Years | 0 (0.0%) | 0 (0.0%) |
| 5 Years | 0 (0.0%) | 0 (0.0%) |
| 6 to 11 Years | 0 (0.0%) | 0 (0.0%) |
| 12 to 14 Years | 0 (0.0%) | 0 (0.0%) |
| 15 Years | 0 (0.0%) | 0 (0.0%) |
| 16 and 17 Years | 0 (0.0%) | 0 (0.0%) |
| 18 to 24 Years | 0 (0.0%) | 0 (0.0%) |
| 25 to 34 Years | 0 (0.0%) | 0 (0.0%) |
| 35 to 44 Years | 0 (0.0%) | 0 (0.0%) |
| 45 to 54 Years | 0 (0.0%) | 0 (0.0%) |
| 55 to 64 Years | 0 (0.0%) | 0 (0.0%) |
| 65 to 74 Years | 0 (0.0%) | 0 (0.0%) |
| 75 Years and over | 0 (0.0%) | 0 (0.0%) |
| Total | 0 (0.0%) | 0 (0.0%) |
Income Above Poverty by Sex and Age in Farmers Loop
According to the poverty statistics in Farmers Loop, males aged under 5 years and females aged under 5 years are the age groups that are most secure financially, with 100.0% of males and 100.0% of females in these age groups living above the poverty line.
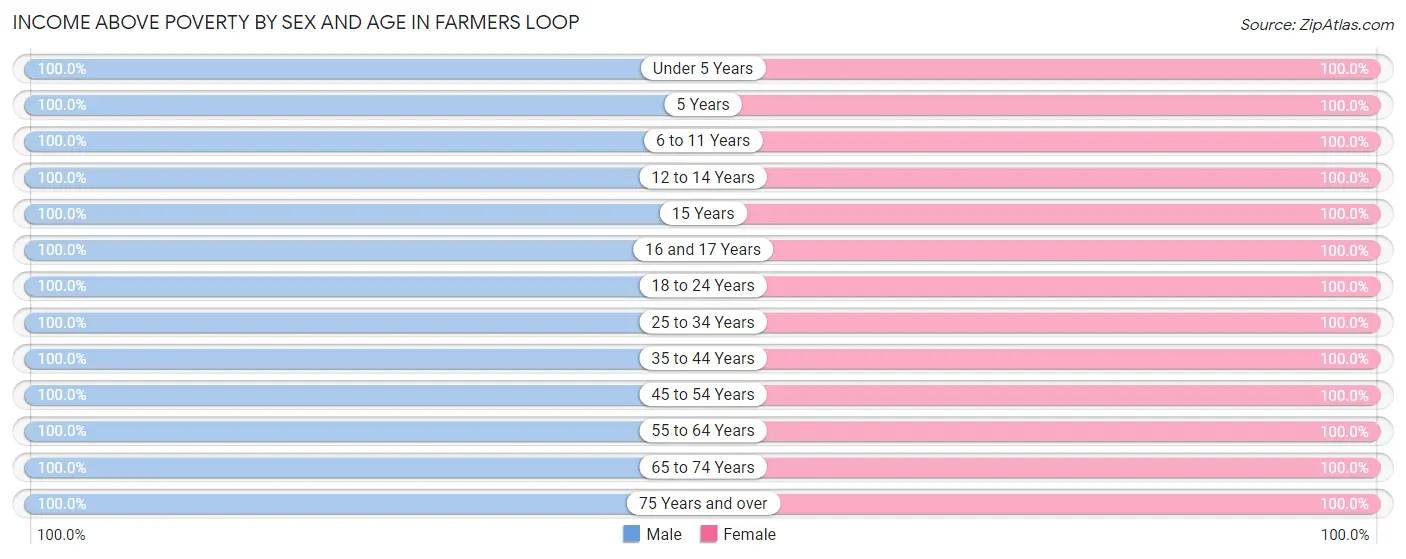
| Age Bracket | Male | Female |
| Under 5 Years | 75 (100.0%) | 148 (100.0%) |
| 5 Years | 26 (100.0%) | 47 (100.0%) |
| 6 to 11 Years | 164 (100.0%) | 200 (100.0%) |
| 12 to 14 Years | 50 (100.0%) | 64 (100.0%) |
| 15 Years | 55 (100.0%) | 8 (100.0%) |
| 16 and 17 Years | 80 (100.0%) | 109 (100.0%) |
| 18 to 24 Years | 182 (100.0%) | 95 (100.0%) |
| 25 to 34 Years | 395 (100.0%) | 377 (100.0%) |
| 35 to 44 Years | 291 (100.0%) | 267 (100.0%) |
| 45 to 54 Years | 332 (100.0%) | 165 (100.0%) |
| 55 to 64 Years | 338 (100.0%) | 312 (100.0%) |
| 65 to 74 Years | 227 (100.0%) | 104 (100.0%) |
| 75 Years and over | 19 (100.0%) | 49 (100.0%) |
| Total | 2,234 (100.0%) | 1,945 (100.0%) |
Income Below Poverty Among Married-Couple Families in Farmers Loop
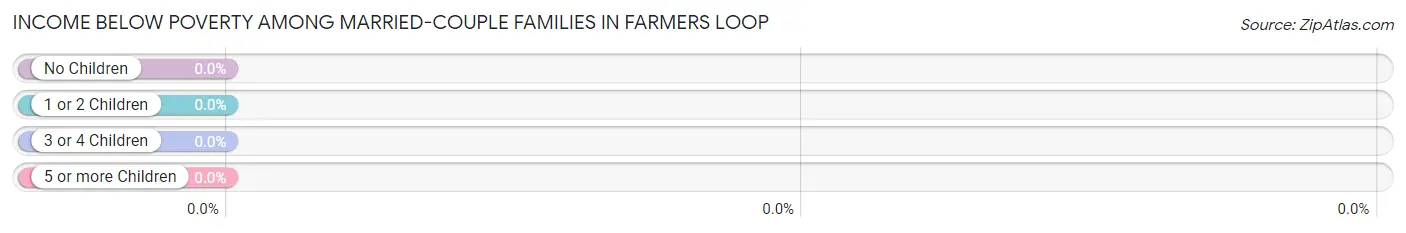
| Children | Above Poverty | Below Poverty |
| No Children | 506 (100.0%) | 0 (0.0%) |
| 1 or 2 Children | 258 (100.0%) | 0 (0.0%) |
| 3 or 4 Children | 46 (100.0%) | 0 (0.0%) |
| 5 or more Children | 68 (100.0%) | 0 (0.0%) |
| Total | 878 (100.0%) | 0 (0.0%) |
Income Below Poverty Among Single-Parent Households in Farmers Loop
| Children | Single Father | Single Mother |
| No Children | 0 (0.0%) | 0 (0.0%) |
| 1 or 2 Children | 0 (0.0%) | 0 (0.0%) |
| 3 or 4 Children | 0 (0.0%) | 0 (0.0%) |
| 5 or more Children | 0 (0.0%) | 0 (0.0%) |
| Total | 0 (0.0%) | 0 (0.0%) |
Income Below Poverty Among Married-Couple vs Single-Parent Households in Farmers Loop
| Children | Married-Couple Families | Single-Parent Households |
| No Children | 0 (0.0%) | 0 (0.0%) |
| 1 or 2 Children | 0 (0.0%) | 0 (0.0%) |
| 3 or 4 Children | 0 (0.0%) | 0 (0.0%) |
| 5 or more Children | 0 (0.0%) | 0 (0.0%) |
| Total | 0 (0.0%) | 0 (0.0%) |
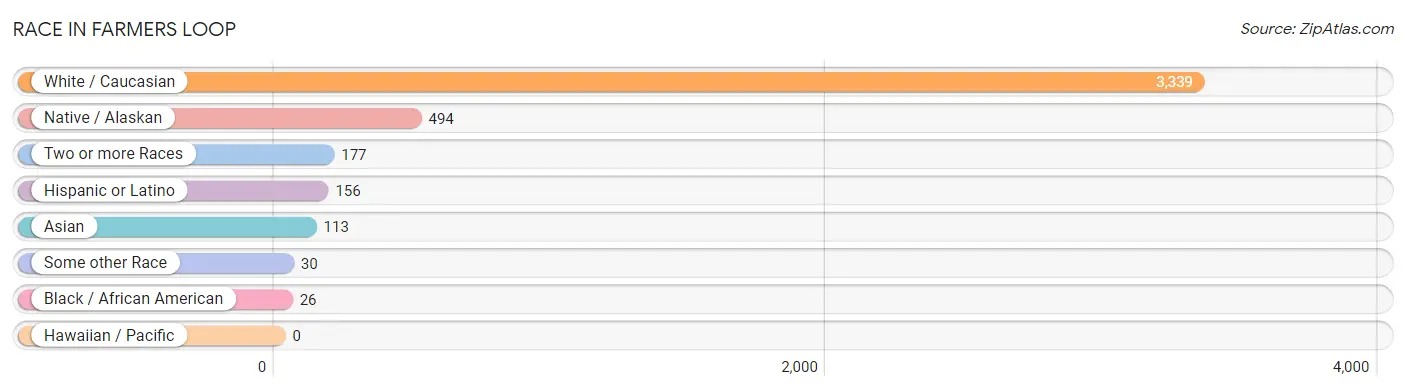
Race in Farmers Loop
The most populous races in Farmers Loop are White / Caucasian (3,339 | 79.9%), Native / Alaskan (494 | 11.8%), and Two or more Races (177 | 4.2%).
| Race | # Population | % Population |
| Asian | 113 | 2.7% |
| Black / African American | 26 | 0.6% |
| Hawaiian / Pacific | 0 | 0.0% |
| Hispanic or Latino | 156 | 3.7% |
| Native / Alaskan | 494 | 11.8% |
| White / Caucasian | 3,339 | 79.9% |
| Two or more Races | 177 | 4.2% |
| Some other Race | 30 | 0.7% |
| Total | 4,179 | 100.0% |
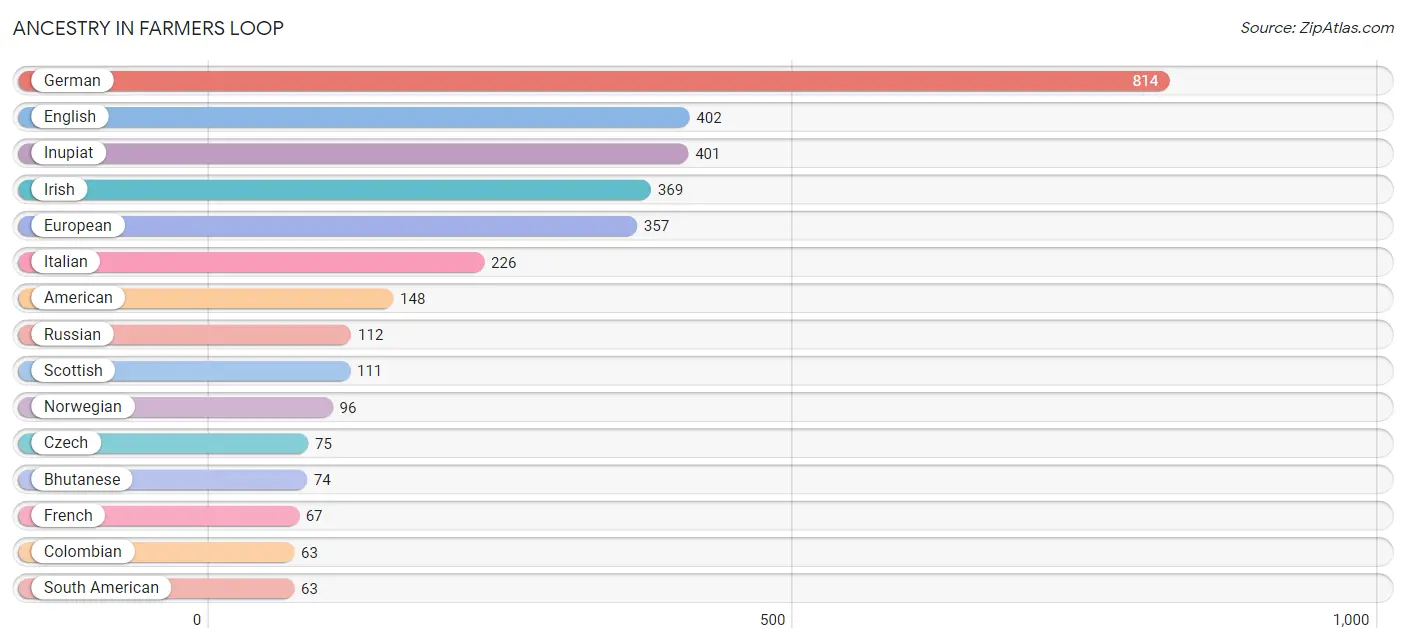
Ancestry in Farmers Loop
The most populous ancestries reported in Farmers Loop are German (814 | 19.5%), English (402 | 9.6%), Inupiat (401 | 9.6%), Irish (369 | 8.8%), and European (357 | 8.5%), together accounting for 56.1% of all Farmers Loop residents.
| Ancestry | # Population | % Population |
| Alaskan Athabascan | 62 | 1.5% |
| American | 148 | 3.5% |
| Austrian | 23 | 0.5% |
| Bhutanese | 74 | 1.8% |
| Burmese | 23 | 0.5% |
| Canadian | 7 | 0.2% |
| Cherokee | 31 | 0.7% |
| Colombian | 63 | 1.5% |
| Crow | 10 | 0.2% |
| Cuban | 26 | 0.6% |
| Czech | 75 | 1.8% |
| Danish | 27 | 0.6% |
| Dutch | 17 | 0.4% |
| English | 402 | 9.6% |
| European | 357 | 8.5% |
| Filipino | 31 | 0.7% |
| French | 67 | 1.6% |
| French Canadian | 37 | 0.9% |
| German | 814 | 19.5% |
| Greek | 38 | 0.9% |
| Indian (Asian) | 34 | 0.8% |
| Inupiat | 401 | 9.6% |
| Irish | 369 | 8.8% |
| Italian | 226 | 5.4% |
| Lithuanian | 45 | 1.1% |
| Luxembourger | 23 | 0.5% |
| Mexican | 33 | 0.8% |
| Norwegian | 96 | 2.3% |
| Polish | 35 | 0.8% |
| Puerto Rican | 34 | 0.8% |
| Russian | 112 | 2.7% |
| Scandinavian | 11 | 0.3% |
| Scottish | 111 | 2.7% |
| Serbian | 59 | 1.4% |
| South American | 63 | 1.5% |
| Swedish | 13 | 0.3% |
| Ukrainian | 19 | 0.4% |
| Welsh | 23 | 0.5% |
| Yugoslavian | 11 | 0.3% | View All 39 Rows |
Immigrants in Farmers Loop
The most numerous immigrant groups reported in Farmers Loop came from Eastern Europe (97 | 2.3%), Europe (97 | 2.3%), Asia (70 | 1.7%), Eastern Asia (70 | 1.7%), and China (65 | 1.6%), together accounting for 9.6% of all Farmers Loop residents.
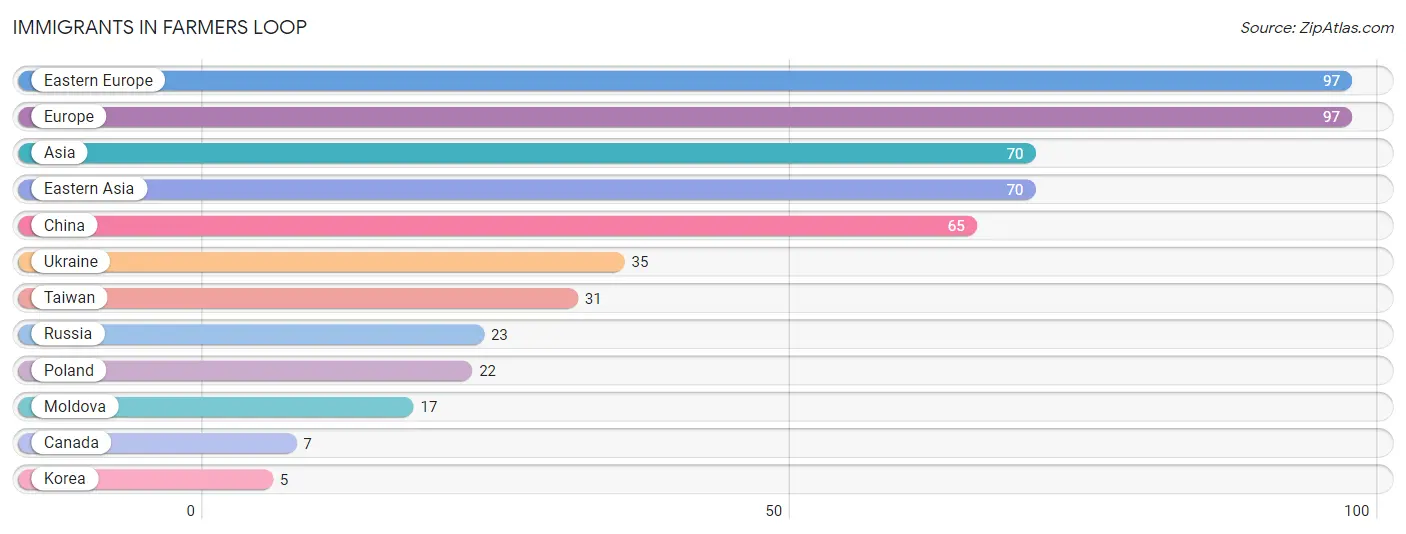
| Immigration Origin | # Population | % Population |
| Asia | 70 | 1.7% |
| Canada | 7 | 0.2% |
| China | 65 | 1.6% |
| Eastern Asia | 70 | 1.7% |
| Eastern Europe | 97 | 2.3% |
| Europe | 97 | 2.3% |
| Korea | 5 | 0.1% |
| Moldova | 17 | 0.4% |
| Poland | 22 | 0.5% |
| Russia | 23 | 0.5% |
| Taiwan | 31 | 0.7% |
| Ukraine | 35 | 0.8% | View All 12 Rows |
Sex and Age in Farmers Loop
Sex and Age in Farmers Loop
The most populous age groups in Farmers Loop are 30 to 34 Years (268 | 12.0%) for men and 25 to 29 Years (284 | 14.6%) for women.
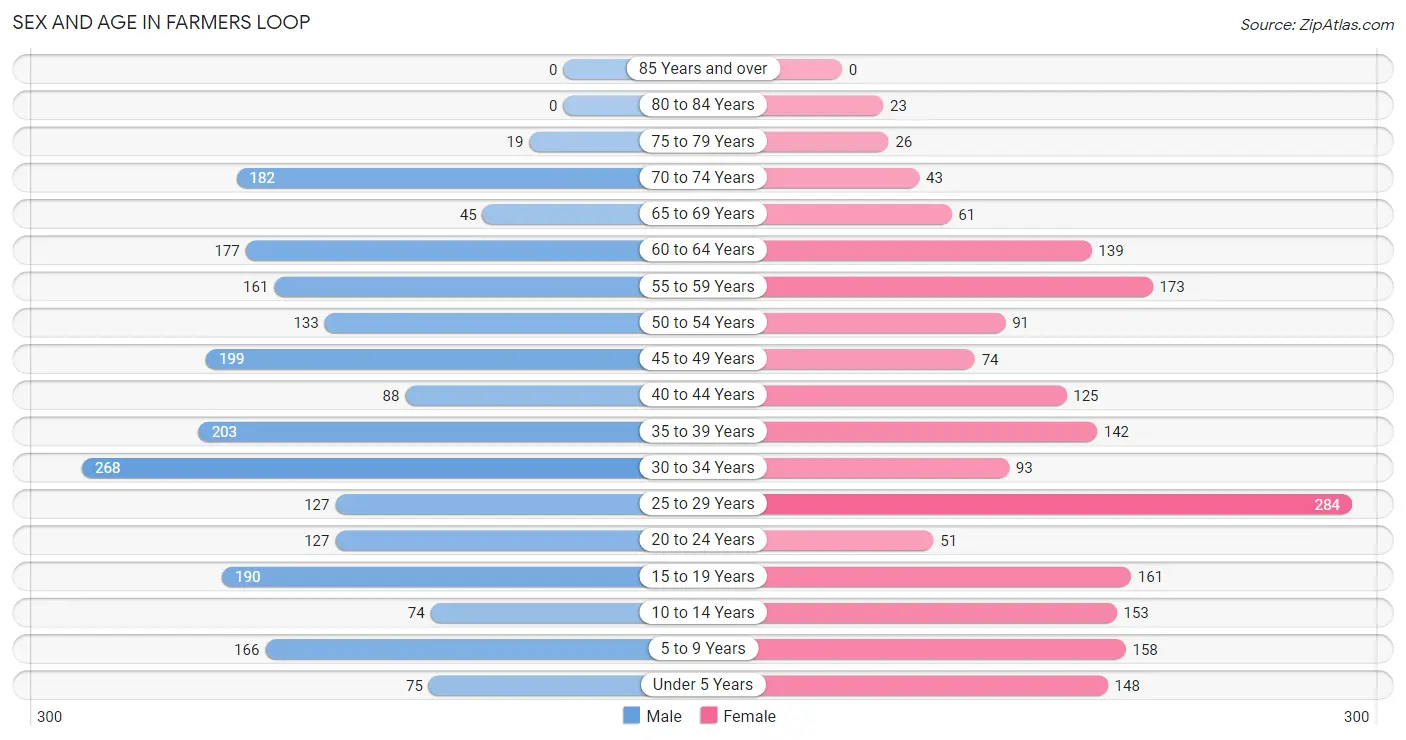
| Age Bracket | Male | Female |
| Under 5 Years | 75 (3.4%) | 148 (7.6%) |
| 5 to 9 Years | 166 (7.4%) | 158 (8.1%) |
| 10 to 14 Years | 74 (3.3%) | 153 (7.9%) |
| 15 to 19 Years | 190 (8.5%) | 161 (8.3%) |
| 20 to 24 Years | 127 (5.7%) | 51 (2.6%) |
| 25 to 29 Years | 127 (5.7%) | 284 (14.6%) |
| 30 to 34 Years | 268 (12.0%) | 93 (4.8%) |
| 35 to 39 Years | 203 (9.1%) | 142 (7.3%) |
| 40 to 44 Years | 88 (3.9%) | 125 (6.4%) |
| 45 to 49 Years | 199 (8.9%) | 74 (3.8%) |
| 50 to 54 Years | 133 (5.9%) | 91 (4.7%) |
| 55 to 59 Years | 161 (7.2%) | 173 (8.9%) |
| 60 to 64 Years | 177 (7.9%) | 139 (7.1%) |
| 65 to 69 Years | 45 (2.0%) | 61 (3.1%) |
| 70 to 74 Years | 182 (8.2%) | 43 (2.2%) |
| 75 to 79 Years | 19 (0.9%) | 26 (1.3%) |
| 80 to 84 Years | 0 (0.0%) | 23 (1.2%) |
| 85 Years and over | 0 (0.0%) | 0 (0.0%) |
| Total | 2,234 (100.0%) | 1,945 (100.0%) |
Families and Households in Farmers Loop
Median Family Size in Farmers Loop
The median family size in Farmers Loop is 3.06 persons per family, with single female/mother families (48 | 4.5%) accounting for the largest median family size of 3.33 persons per family. On the other hand, single male/father families (129 | 12.2%) represent the smallest median family size with 2.37 persons per family.
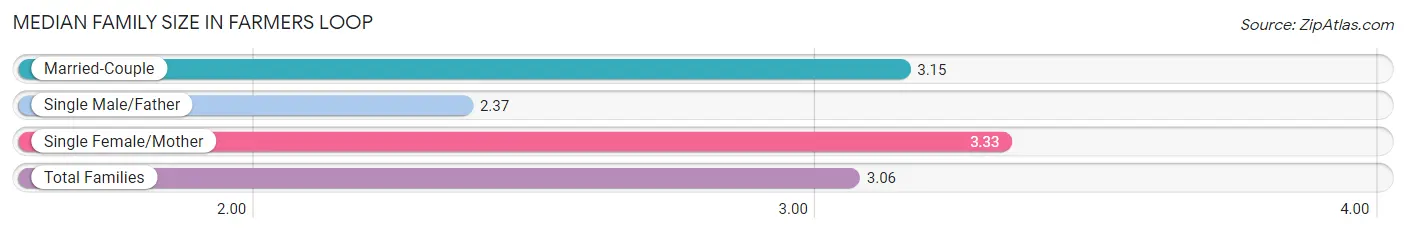
| Family Type | # Families | Family Size |
| Married-Couple | 878 (83.2%) | 3.15 |
| Single Male/Father | 129 (12.2%) | 2.37 |
| Single Female/Mother | 48 (4.5%) | 3.33 |
| Total Families | 1,055 (100.0%) | 3.06 |
Median Household Size in Farmers Loop
The median household size in Farmers Loop is 2.52 persons per household, with single female/mother households (48 | 2.9%) accounting for the largest median household size of 3.33 persons per household. non-family households (603 | 36.4%) represent the smallest median household size with 1.55 persons per household.
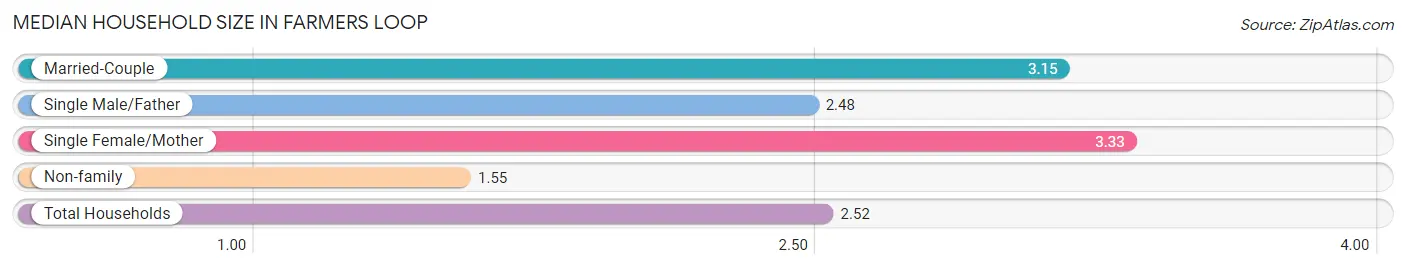
| Household Type | # Households | Household Size |
| Married-Couple | 878 (53.0%) | 3.15 |
| Single Male/Father | 129 (7.8%) | 2.48 |
| Single Female/Mother | 48 (2.9%) | 3.33 |
| Non-family | 603 (36.4%) | 1.55 |
| Total Households | 1,658 (100.0%) | 2.52 |
Household Size by Marriage Status in Farmers Loop
Out of a total of 1,658 households in Farmers Loop, 1,055 (63.6%) are family households, while 603 (36.4%) are nonfamily households. The most numerous type of family households are 2-person households, comprising 564, and the most common type of nonfamily households are 1-person households, comprising 380.
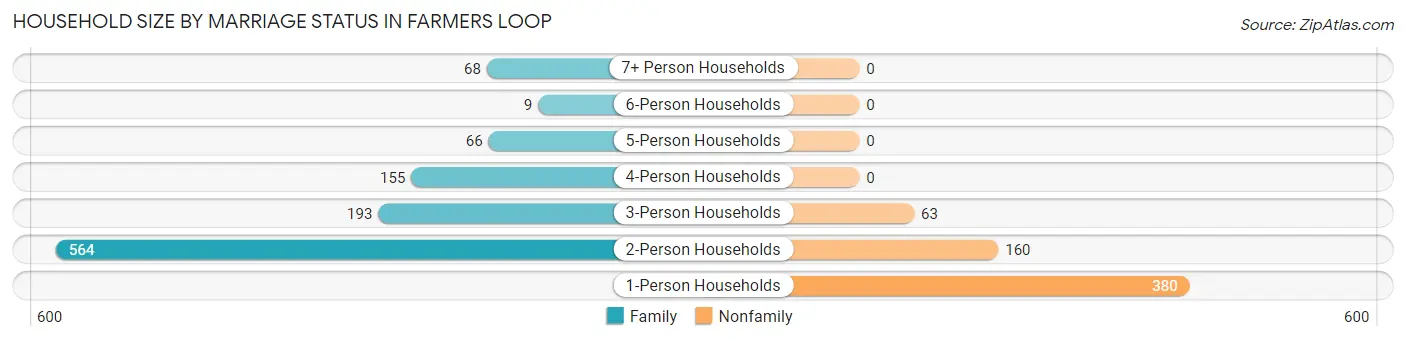
| Household Size | Family Households | Nonfamily Households |
| 1-Person Households | - | 380 (22.9%) |
| 2-Person Households | 564 (34.0%) | 160 (9.7%) |
| 3-Person Households | 193 (11.6%) | 63 (3.8%) |
| 4-Person Households | 155 (9.3%) | 0 (0.0%) |
| 5-Person Households | 66 (4.0%) | 0 (0.0%) |
| 6-Person Households | 9 (0.5%) | 0 (0.0%) |
| 7+ Person Households | 68 (4.1%) | 0 (0.0%) |
| Total | 1,055 (63.6%) | 603 (36.4%) |
Female Fertility in Farmers Loop
Fertility by Age in Farmers Loop
Average fertility rate in Farmers Loop is 74.0 births per 1,000 women. Women in the age bracket of 20 to 34 years have the highest fertility rate with 150.0 births per 1,000 women. Women in the age bracket of 20 to 34 years acount for 92.7% of all women with births.
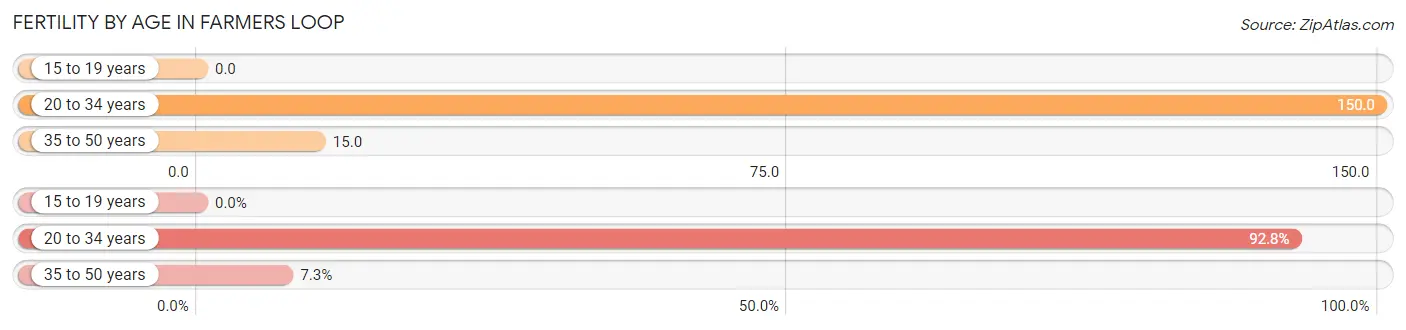
| Age Bracket | Women with Births | Births / 1,000 Women |
| 15 to 19 years | 0 (0.0%) | 0.0 |
| 20 to 34 years | 64 (92.7%) | 150.0 |
| 35 to 50 years | 5 (7.2%) | 15.0 |
| Total | 69 (100.0%) | 74.0 |
Fertility by Age by Marriage Status in Farmers Loop
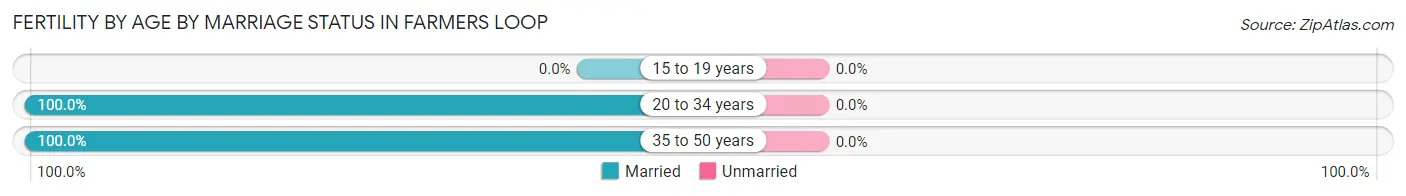
| Age Bracket | Married | Unmarried |
| 15 to 19 years | 0 (0.0%) | 0 (0.0%) |
| 20 to 34 years | 64 (100.0%) | 0 (0.0%) |
| 35 to 50 years | 5 (100.0%) | 0 (0.0%) |
| Total | 69 (100.0%) | 0 (0.0%) |
Fertility by Education in Farmers Loop
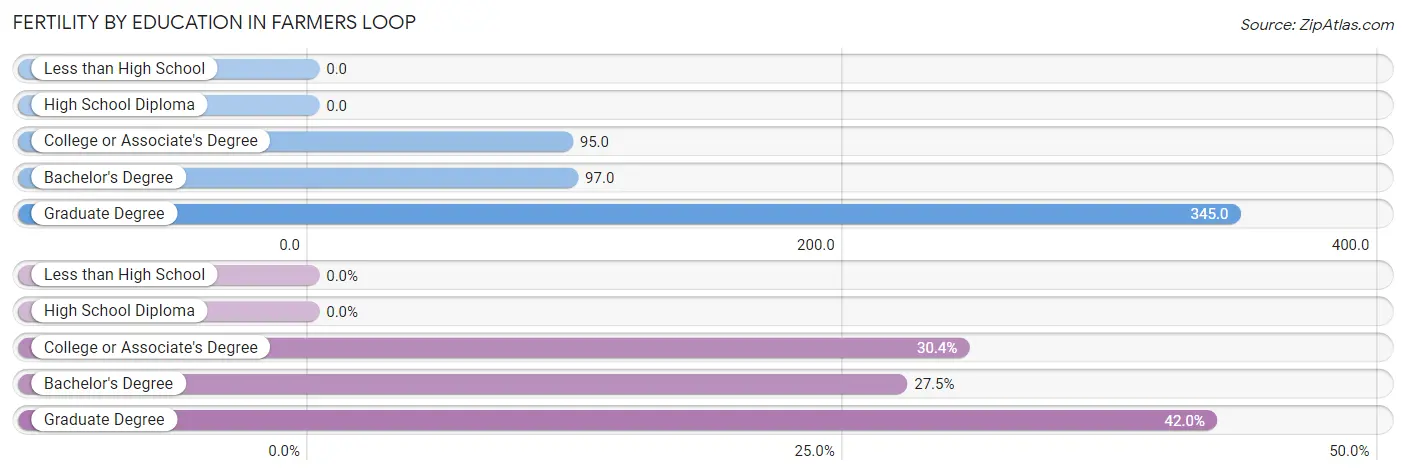
| Educational Attainment | Women with Births | Births / 1,000 Women |
| Less than High School | 0 (0.0%) | 0.0 |
| High School Diploma | 0 (0.0%) | 0.0 |
| College or Associate's Degree | 21 (30.4%) | 95.0 |
| Bachelor's Degree | 19 (27.5%) | 97.0 |
| Graduate Degree | 29 (42.0%) | 345.0 |
| Total | 69 (100.0%) | 74.0 |
Fertility by Education by Marriage Status in Farmers Loop
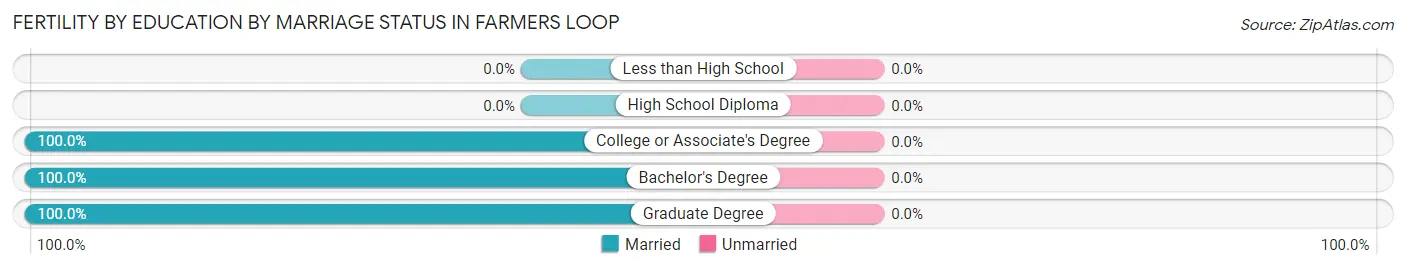
| Educational Attainment | Married | Unmarried |
| Less than High School | 0 (0.0%) | 0 (0.0%) |
| High School Diploma | 0 (0.0%) | 0 (0.0%) |
| College or Associate's Degree | 21 (100.0%) | 0 (0.0%) |
| Bachelor's Degree | 19 (100.0%) | 0 (0.0%) |
| Graduate Degree | 29 (100.0%) | 0 (0.0%) |
| Total | 69 (100.0%) | 0 (0.0%) |
Employment Characteristics in Farmers Loop
Employment by Class of Employer in Farmers Loop
Among the 2,298 employed individuals in Farmers Loop, private company employees (1,377 | 59.9%), federal government employees (335 | 14.6%), and state government employees (307 | 13.4%) make up the most common classes of employment.
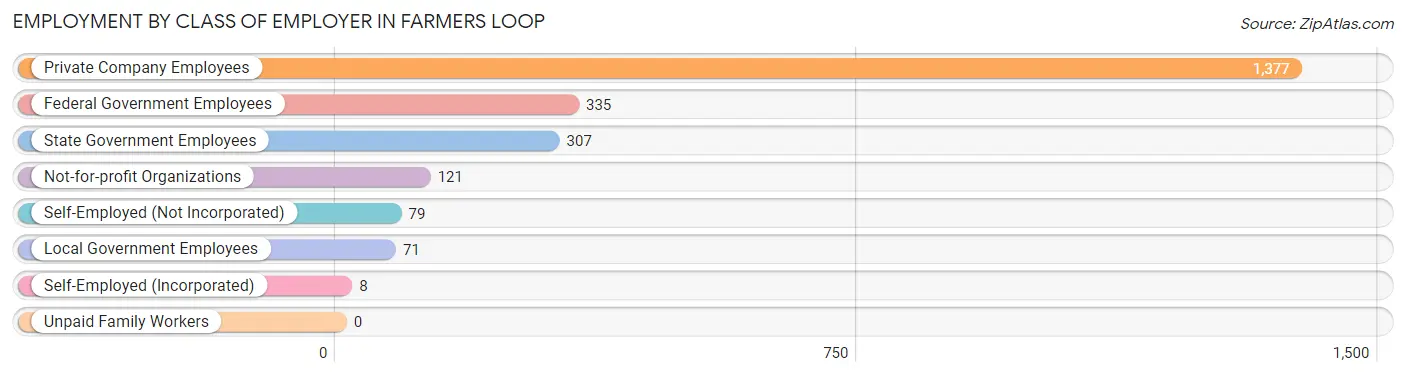
| Employer Class | # Employees | % Employees |
| Private Company Employees | 1,377 | 59.9% |
| Self-Employed (Incorporated) | 8 | 0.4% |
| Self-Employed (Not Incorporated) | 79 | 3.4% |
| Not-for-profit Organizations | 121 | 5.3% |
| Local Government Employees | 71 | 3.1% |
| State Government Employees | 307 | 13.4% |
| Federal Government Employees | 335 | 14.6% |
| Unpaid Family Workers | 0 | 0.0% |
| Total | 2,298 | 100.0% |
Employment Status by Age in Farmers Loop
According to the labor force statistics for Farmers Loop, out of the total population over 16 years of age (3,342), 71.4% or 2,386 individuals are in the labor force, with 3.7% or 88 of them unemployed. The age group with the highest labor force participation rate is 30 to 34 years, with 95.6% or 345 individuals in the labor force. Within the labor force, the 20 to 24 years age range has the highest percentage of unemployed individuals, with 58.0% or 40 of them being unemployed.
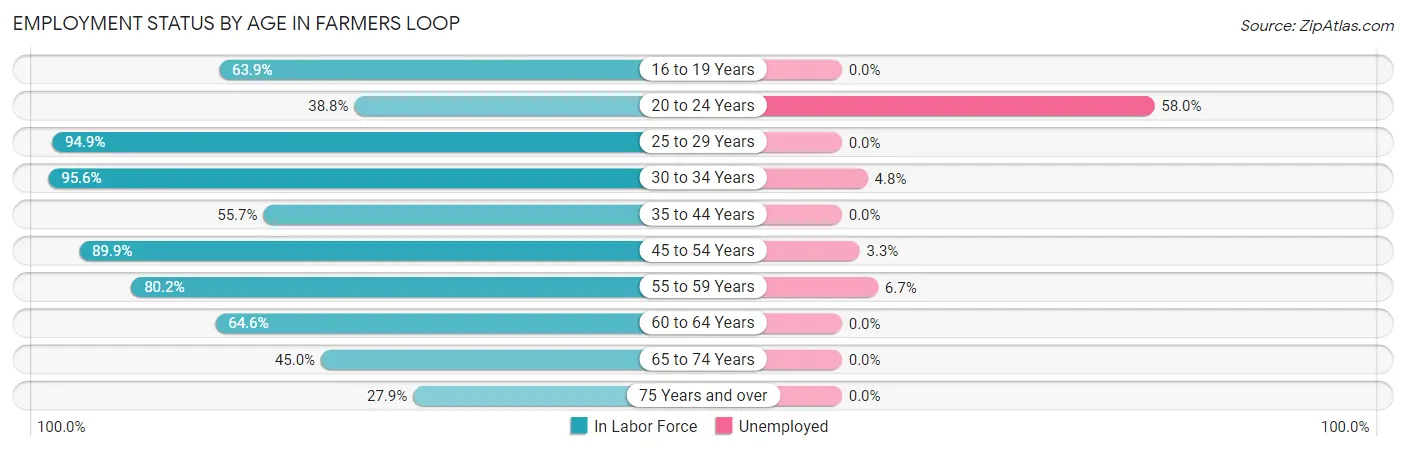
| Age Bracket | In Labor Force | Unemployed |
| 16 to 19 Years | 184 (63.9%) | 0 (0.0%) |
| 20 to 24 Years | 69 (38.8%) | 40 (58.0%) |
| 25 to 29 Years | 390 (94.9%) | 0 (0.0%) |
| 30 to 34 Years | 345 (95.6%) | 17 (4.8%) |
| 35 to 44 Years | 311 (55.7%) | 0 (0.0%) |
| 45 to 54 Years | 447 (89.9%) | 15 (3.3%) |
| 55 to 59 Years | 268 (80.2%) | 18 (6.7%) |
| 60 to 64 Years | 204 (64.6%) | 0 (0.0%) |
| 65 to 74 Years | 149 (45.0%) | 0 (0.0%) |
| 75 Years and over | 19 (27.9%) | 0 (0.0%) |
| Total | 2,386 (71.4%) | 88 (3.7%) |
Employment Status by Educational Attainment in Farmers Loop
According to labor force statistics for Farmers Loop, 79.3% of individuals (1,964) out of the total population between 25 and 64 years of age (2,477) are in the labor force, with 2.5% or 49 of them being unemployed. The group with the highest labor force participation rate are those with the educational attainment of high school diploma, with 83.9% or 869 individuals in the labor force. Within the labor force, individuals with college / associate degree education have the highest percentage of unemployment, with 4.6% or 25 of them being unemployed.
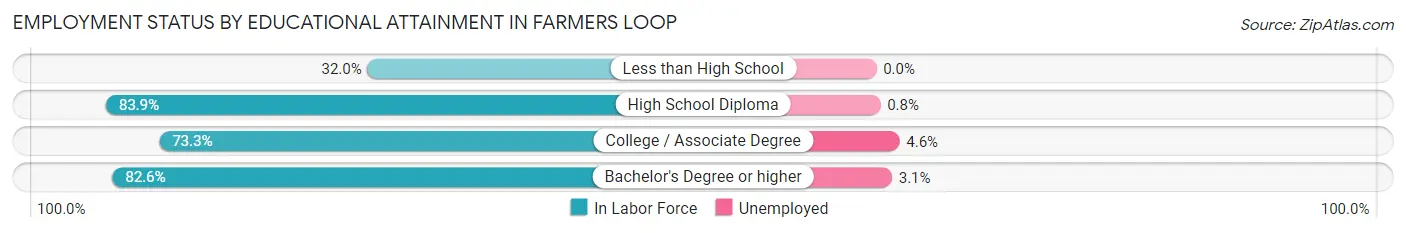
| Educational Attainment | In Labor Force | Unemployed |
| Less than High School | 16 (32.0%) | 0 (0.0%) |
| High School Diploma | 869 (83.9%) | 8 (0.8%) |
| College / Associate Degree | 547 (73.3%) | 34 (4.6%) |
| Bachelor's Degree or higher | 533 (82.6%) | 20 (3.1%) |
| Total | 1,964 (79.3%) | 62 (2.5%) |
Employment Occupations by Sex in Farmers Loop
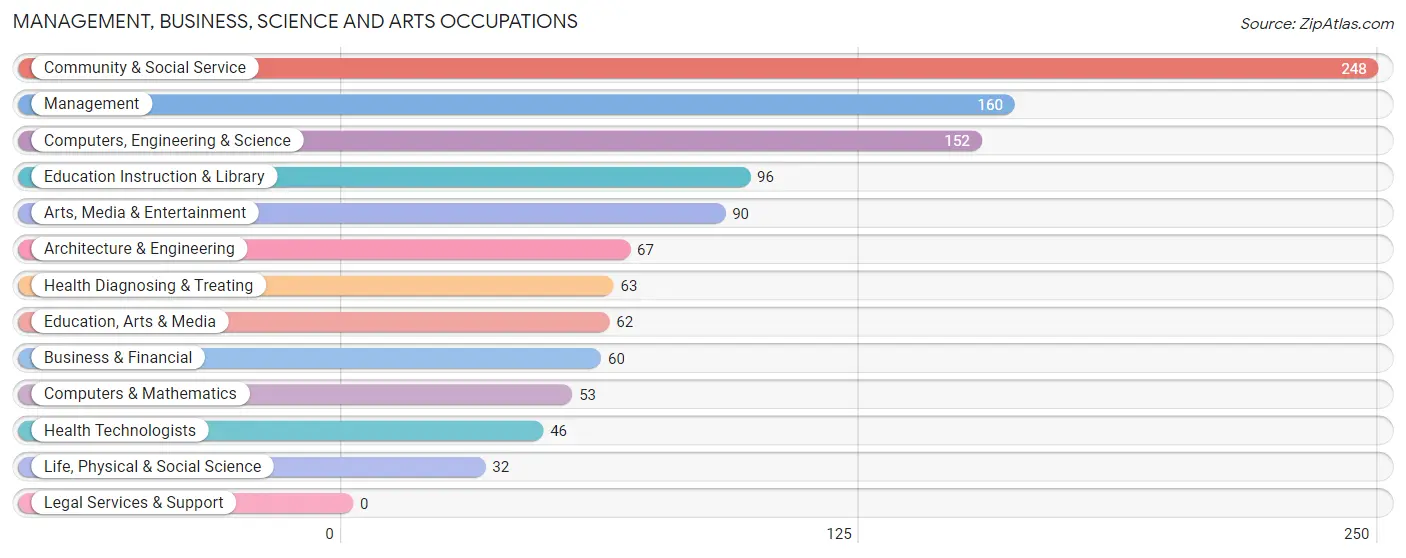
Management, Business, Science and Arts Occupations
The most common Management, Business, Science and Arts occupations in Farmers Loop are Community & Social Service (248 | 11.0%), Management (160 | 7.1%), Computers, Engineering & Science (152 | 6.7%), Education Instruction & Library (96 | 4.2%), and Arts, Media & Entertainment (90 | 4.0%).
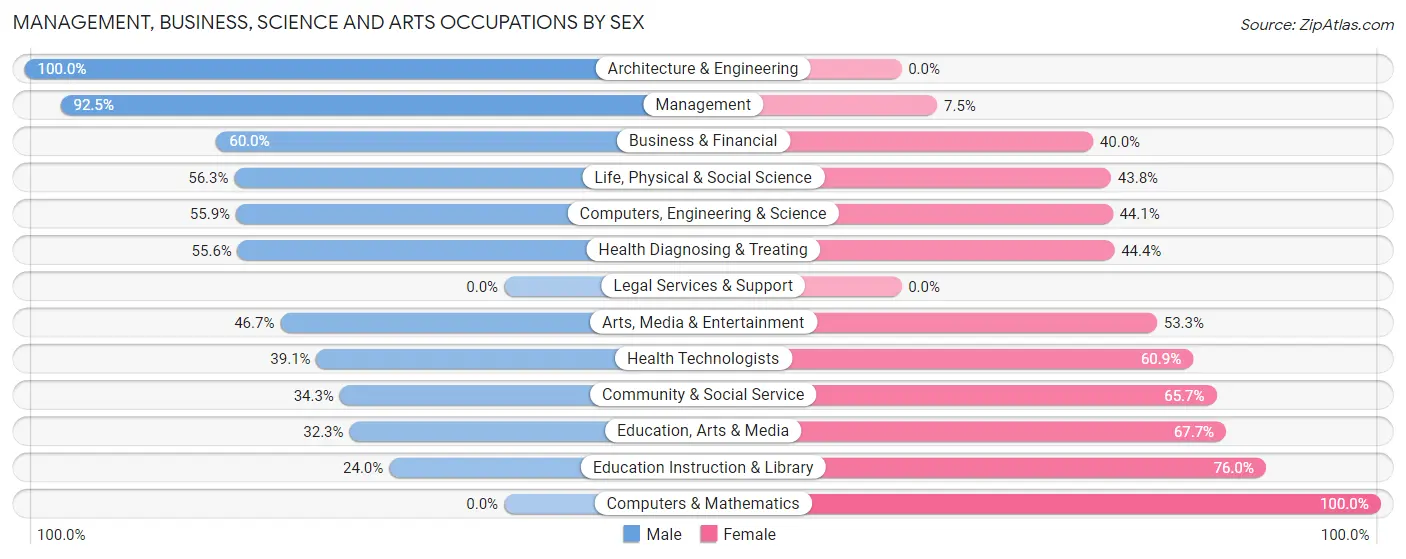
Management, Business, Science and Arts Occupations by Sex
Within the Management, Business, Science and Arts occupations in Farmers Loop, the most male-oriented occupations are Architecture & Engineering (100.0%), Management (92.5%), and Business & Financial (60.0%), while the most female-oriented occupations are Computers & Mathematics (100.0%), Education Instruction & Library (76.0%), and Education, Arts & Media (67.7%).
| Occupation | Male | Female |
| Management | 148 (92.5%) | 12 (7.5%) |
| Business & Financial | 36 (60.0%) | 24 (40.0%) |
| Computers, Engineering & Science | 85 (55.9%) | 67 (44.1%) |
| Computers & Mathematics | 0 (0.0%) | 53 (100.0%) |
| Architecture & Engineering | 67 (100.0%) | 0 (0.0%) |
| Life, Physical & Social Science | 18 (56.2%) | 14 (43.8%) |
| Community & Social Service | 85 (34.3%) | 163 (65.7%) |
| Education, Arts & Media | 20 (32.3%) | 42 (67.7%) |
| Legal Services & Support | 0 (0.0%) | 0 (0.0%) |
| Education Instruction & Library | 23 (24.0%) | 73 (76.0%) |
| Arts, Media & Entertainment | 42 (46.7%) | 48 (53.3%) |
| Health Diagnosing & Treating | 35 (55.6%) | 28 (44.4%) |
| Health Technologists | 18 (39.1%) | 28 (60.9%) |
| Total (Category) | 389 (57.0%) | 294 (43.0%) |
| Total (Overall) | 1,422 (62.8%) | 842 (37.2%) |
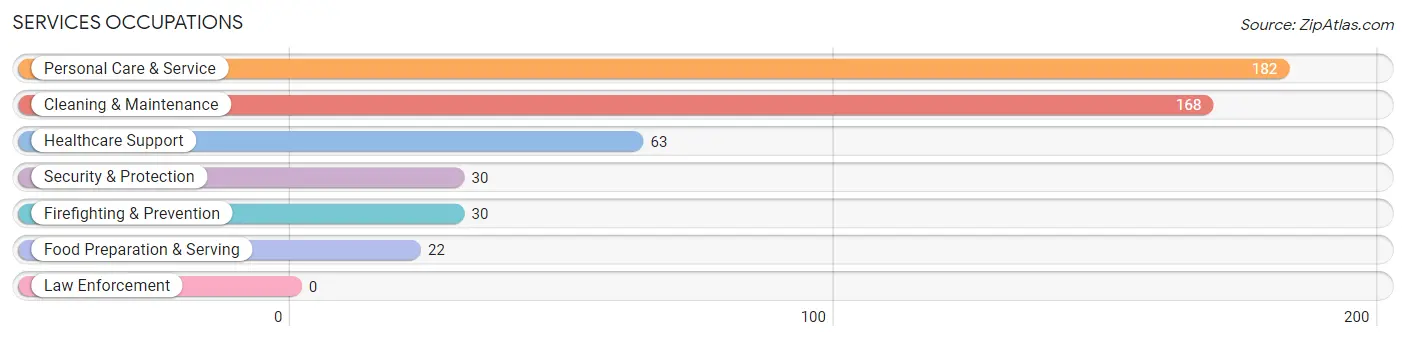
Services Occupations
The most common Services occupations in Farmers Loop are Personal Care & Service (182 | 8.0%), Cleaning & Maintenance (168 | 7.4%), Healthcare Support (63 | 2.8%), Security & Protection (30 | 1.3%), and Firefighting & Prevention (30 | 1.3%).
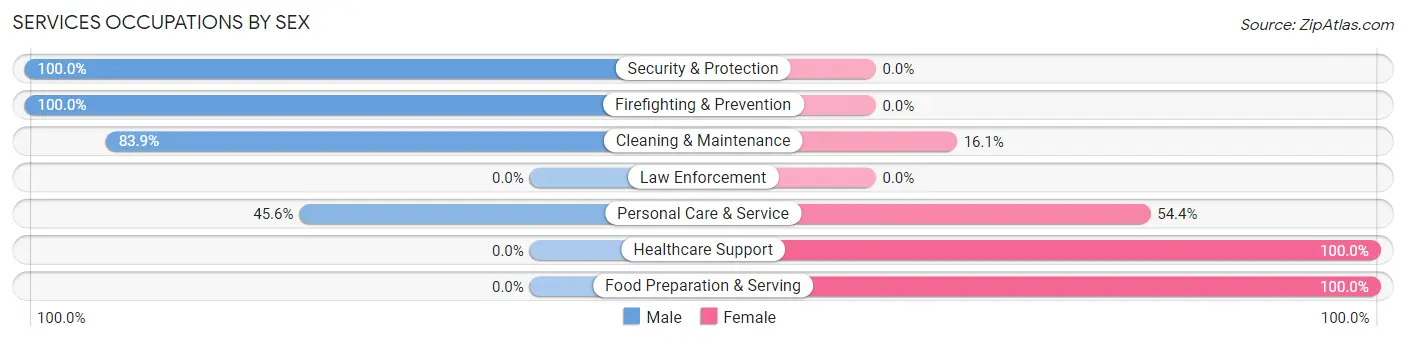
Services Occupations by Sex
Within the Services occupations in Farmers Loop, the most male-oriented occupations are Security & Protection (100.0%), Firefighting & Prevention (100.0%), and Cleaning & Maintenance (83.9%), while the most female-oriented occupations are Healthcare Support (100.0%), Food Preparation & Serving (100.0%), and Personal Care & Service (54.4%).
| Occupation | Male | Female |
| Healthcare Support | 0 (0.0%) | 63 (100.0%) |
| Security & Protection | 30 (100.0%) | 0 (0.0%) |
| Firefighting & Prevention | 30 (100.0%) | 0 (0.0%) |
| Law Enforcement | 0 (0.0%) | 0 (0.0%) |
| Food Preparation & Serving | 0 (0.0%) | 22 (100.0%) |
| Cleaning & Maintenance | 141 (83.9%) | 27 (16.1%) |
| Personal Care & Service | 83 (45.6%) | 99 (54.4%) |
| Total (Category) | 254 (54.6%) | 211 (45.4%) |
| Total (Overall) | 1,422 (62.8%) | 842 (37.2%) |
Sales and Office Occupations
The most common Sales and Office occupations in Farmers Loop are Sales & Related (289 | 12.8%), and Office & Administration (225 | 9.9%).
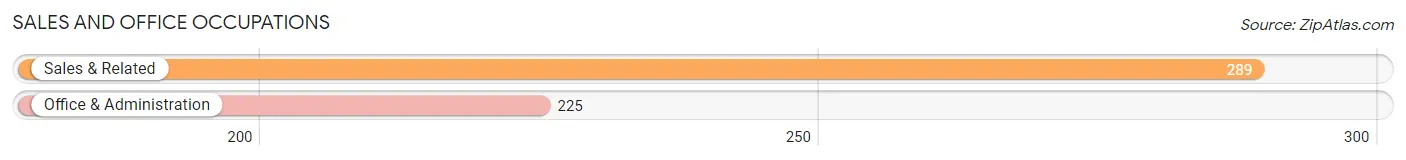
Sales and Office Occupations by Sex
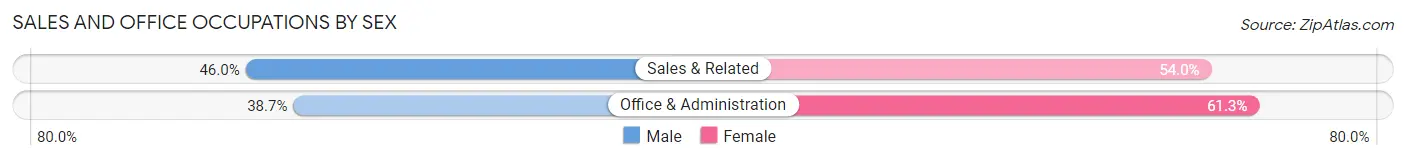
| Occupation | Male | Female |
| Sales & Related | 133 (46.0%) | 156 (54.0%) |
| Office & Administration | 87 (38.7%) | 138 (61.3%) |
| Total (Category) | 220 (42.8%) | 294 (57.2%) |
| Total (Overall) | 1,422 (62.8%) | 842 (37.2%) |
Natural Resources, Construction and Maintenance Occupations
The most common Natural Resources, Construction and Maintenance occupations in Farmers Loop are Installation, Maintenance & Repair (227 | 10.0%), Construction & Extraction (109 | 4.8%), and Farming, Fishing & Forestry (59 | 2.6%).
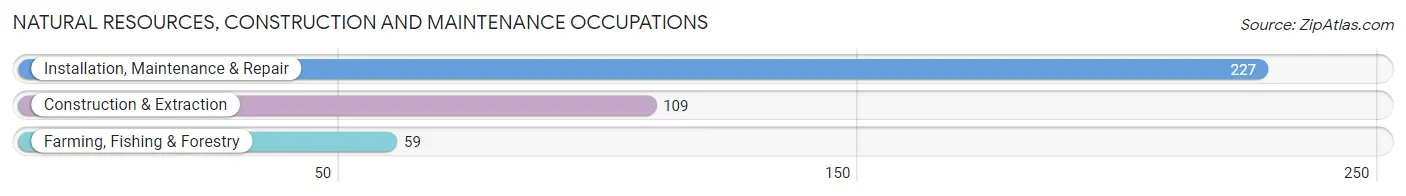
Natural Resources, Construction and Maintenance Occupations by Sex
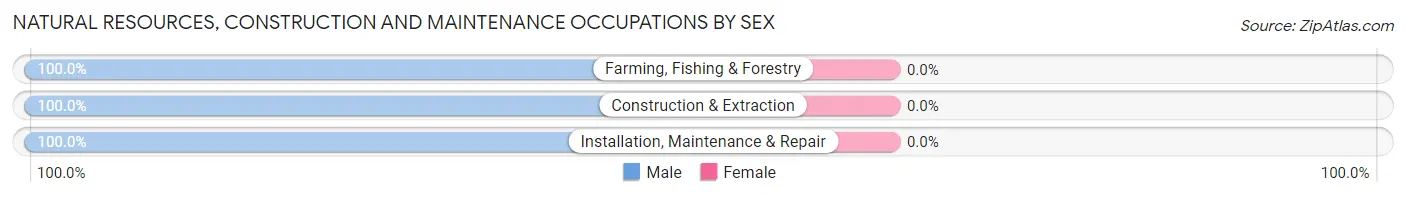
| Occupation | Male | Female |
| Farming, Fishing & Forestry | 59 (100.0%) | 0 (0.0%) |
| Construction & Extraction | 109 (100.0%) | 0 (0.0%) |
| Installation, Maintenance & Repair | 227 (100.0%) | 0 (0.0%) |
| Total (Category) | 395 (100.0%) | 0 (0.0%) |
| Total (Overall) | 1,422 (62.8%) | 842 (37.2%) |
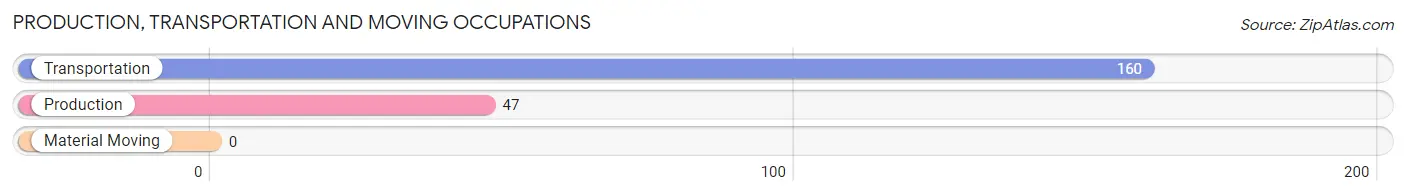
Production, Transportation and Moving Occupations
The most common Production, Transportation and Moving occupations in Farmers Loop are Transportation (160 | 7.1%), and Production (47 | 2.1%).
Production, Transportation and Moving Occupations by Sex
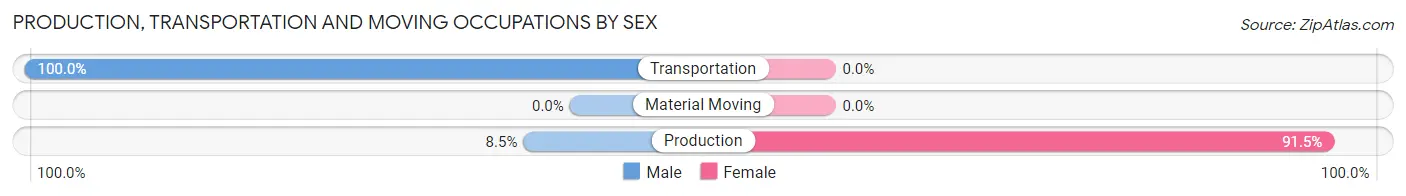
| Occupation | Male | Female |
| Production | 4 (8.5%) | 43 (91.5%) |
| Transportation | 160 (100.0%) | 0 (0.0%) |
| Material Moving | 0 (0.0%) | 0 (0.0%) |
| Total (Category) | 164 (79.2%) | 43 (20.8%) |
| Total (Overall) | 1,422 (62.8%) | 842 (37.2%) |
Employment Industries by Sex in Farmers Loop
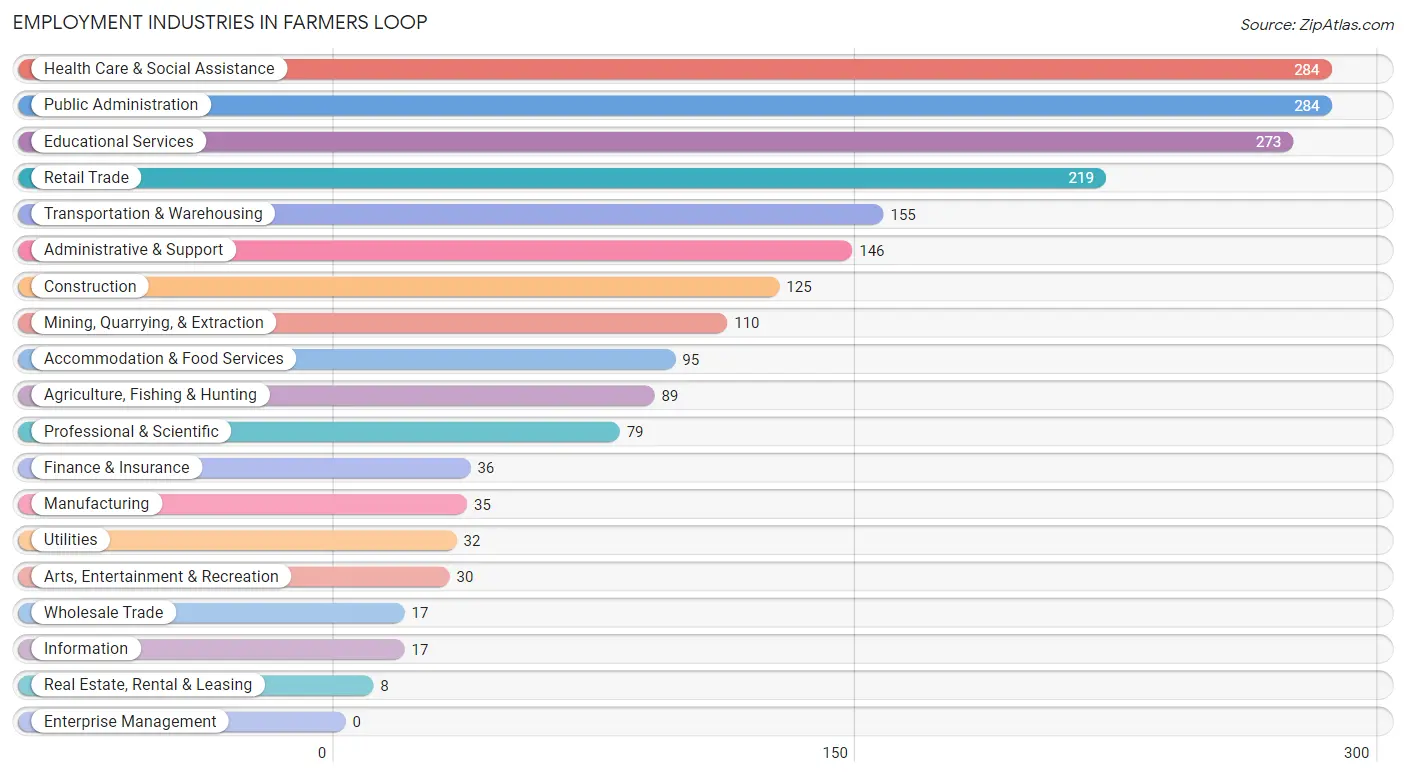
Employment Industries in Farmers Loop
The major employment industries in Farmers Loop include Health Care & Social Assistance (284 | 12.5%), Public Administration (284 | 12.5%), Educational Services (273 | 12.1%), Retail Trade (219 | 9.7%), and Transportation & Warehousing (155 | 6.9%).
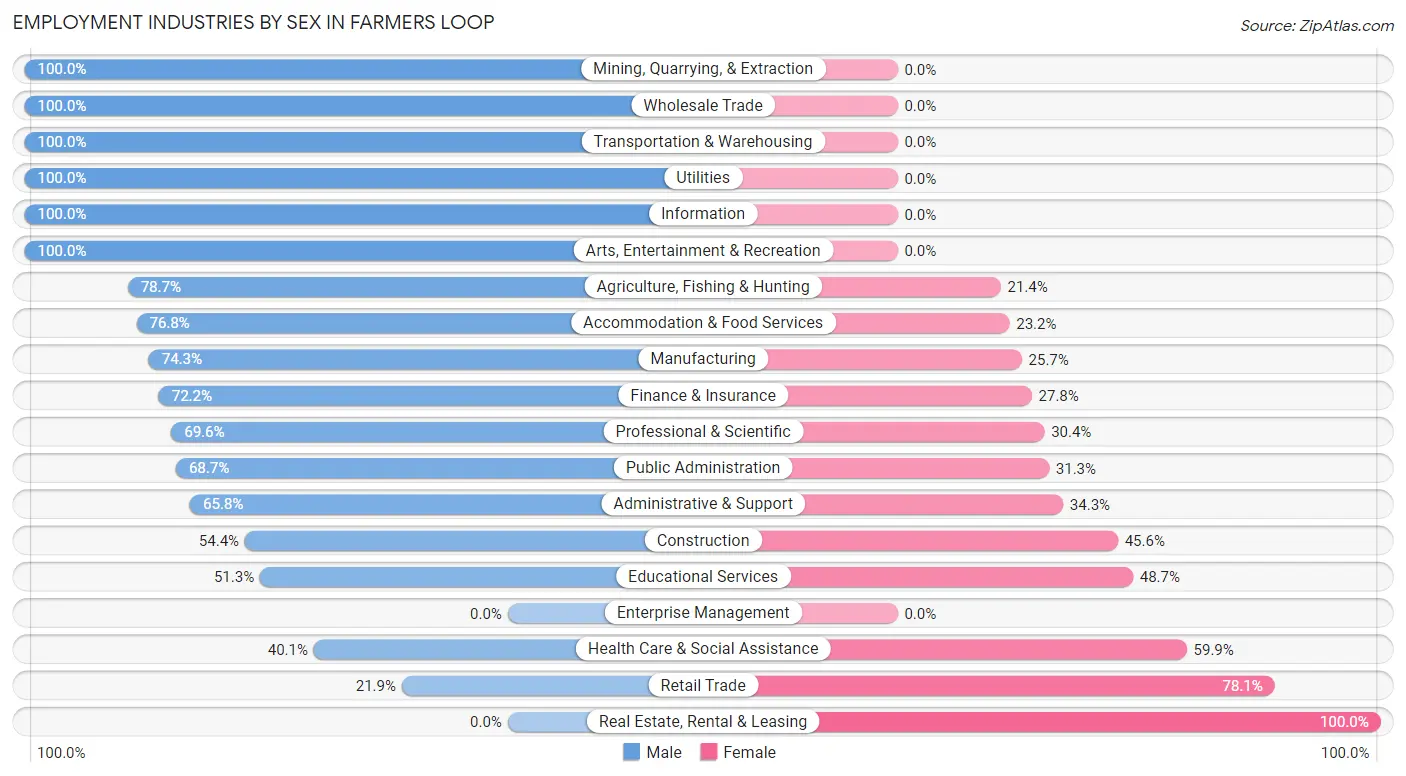
Employment Industries by Sex in Farmers Loop
The Farmers Loop industries that see more men than women are Mining, Quarrying, & Extraction (100.0%), Wholesale Trade (100.0%), and Transportation & Warehousing (100.0%), whereas the industries that tend to have a higher number of women are Real Estate, Rental & Leasing (100.0%), Retail Trade (78.1%), and Health Care & Social Assistance (59.9%).
| Industry | Male | Female |
| Agriculture, Fishing & Hunting | 70 (78.6%) | 19 (21.3%) |
| Mining, Quarrying, & Extraction | 110 (100.0%) | 0 (0.0%) |
| Construction | 68 (54.4%) | 57 (45.6%) |
| Manufacturing | 26 (74.3%) | 9 (25.7%) |
| Wholesale Trade | 17 (100.0%) | 0 (0.0%) |
| Retail Trade | 48 (21.9%) | 171 (78.1%) |
| Transportation & Warehousing | 155 (100.0%) | 0 (0.0%) |
| Utilities | 32 (100.0%) | 0 (0.0%) |
| Information | 17 (100.0%) | 0 (0.0%) |
| Finance & Insurance | 26 (72.2%) | 10 (27.8%) |
| Real Estate, Rental & Leasing | 0 (0.0%) | 8 (100.0%) |
| Professional & Scientific | 55 (69.6%) | 24 (30.4%) |
| Enterprise Management | 0 (0.0%) | 0 (0.0%) |
| Administrative & Support | 96 (65.7%) | 50 (34.3%) |
| Educational Services | 140 (51.3%) | 133 (48.7%) |
| Health Care & Social Assistance | 114 (40.1%) | 170 (59.9%) |
| Arts, Entertainment & Recreation | 30 (100.0%) | 0 (0.0%) |
| Accommodation & Food Services | 73 (76.8%) | 22 (23.2%) |
| Public Administration | 195 (68.7%) | 89 (31.3%) |
| Total | 1,422 (62.8%) | 842 (37.2%) |
Education in Farmers Loop
School Enrollment in Farmers Loop
The most common levels of schooling among the 1,197 students in Farmers Loop are high school (297 | 24.8%), college / undergraduate (239 | 20.0%), and elementary school (236 | 19.7%).
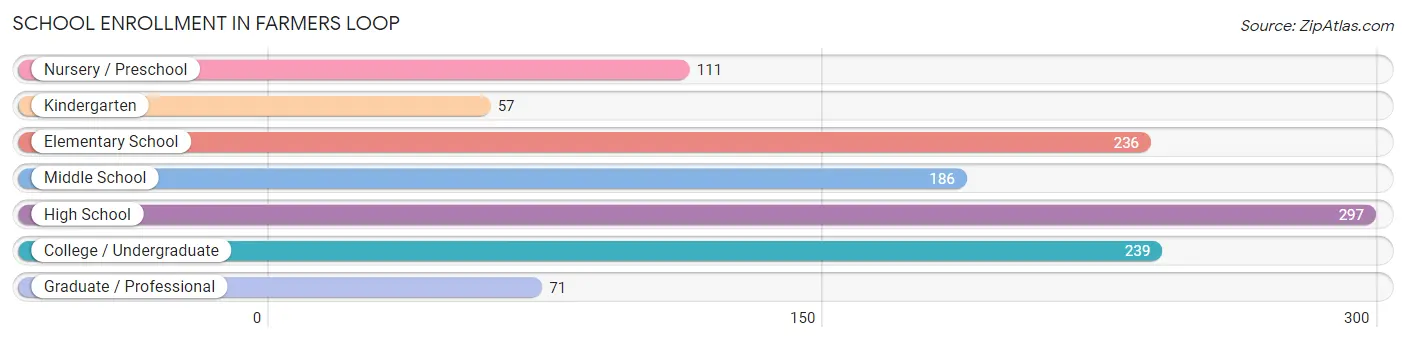
| School Level | # Students | % Students |
| Nursery / Preschool | 111 | 9.3% |
| Kindergarten | 57 | 4.8% |
| Elementary School | 236 | 19.7% |
| Middle School | 186 | 15.5% |
| High School | 297 | 24.8% |
| College / Undergraduate | 239 | 20.0% |
| Graduate / Professional | 71 | 5.9% |
| Total | 1,197 | 100.0% |
School Enrollment by Age by Funding Source in Farmers Loop
Out of a total of 1,197 students who are enrolled in schools in Farmers Loop, 502 (41.9%) attend a private institution, while the remaining 695 (58.1%) are enrolled in public schools. The age group of 3 to 4 year olds has the highest likelihood of being enrolled in private schools, with 58 (100.0% in the age bracket) enrolled. Conversely, the age group of 20 to 24 year olds has the lowest likelihood of being enrolled in a private school, with 106 (100.0% in the age bracket) attending a public institution.
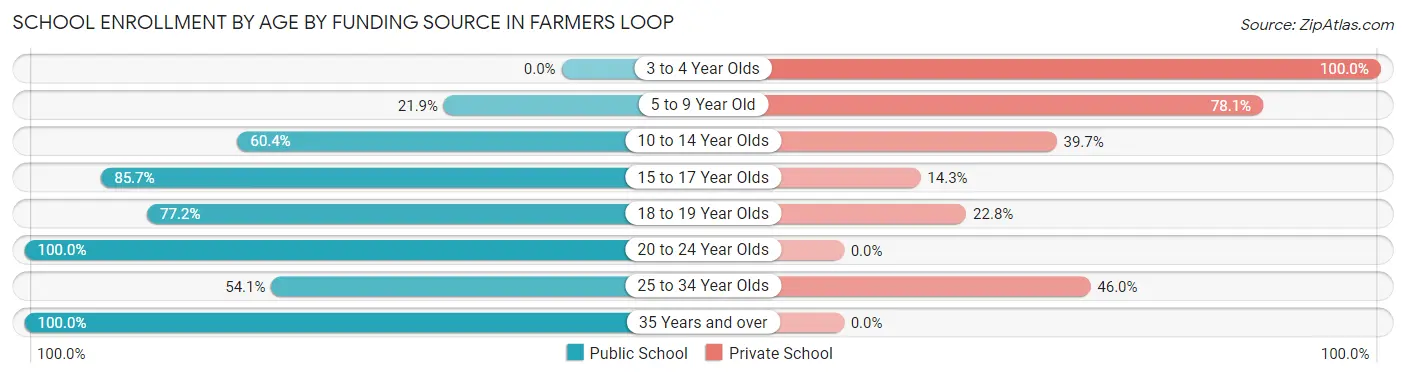
| Age Bracket | Public School | Private School |
| 3 to 4 Year Olds | 0 (0.0%) | 58 (100.0%) |
| 5 to 9 Year Old | 71 (21.9%) | 253 (78.1%) |
| 10 to 14 Year Olds | 137 (60.4%) | 90 (39.7%) |
| 15 to 17 Year Olds | 216 (85.7%) | 36 (14.3%) |
| 18 to 19 Year Olds | 44 (77.2%) | 13 (22.8%) |
| 20 to 24 Year Olds | 106 (100.0%) | 0 (0.0%) |
| 25 to 34 Year Olds | 60 (54.0%) | 51 (46.0%) |
| 35 Years and over | 62 (100.0%) | 0 (0.0%) |
| Total | 695 (58.1%) | 502 (41.9%) |
Educational Attainment by Field of Study in Farmers Loop
Bio, nature & agricultural (170 | 19.3%), physical & health sciences (126 | 14.3%), social sciences (87 | 9.9%), arts & humanities (85 | 9.6%), and education (73 | 8.3%) are the most common fields of study among 882 individuals in Farmers Loop who have obtained a bachelor's degree or higher.
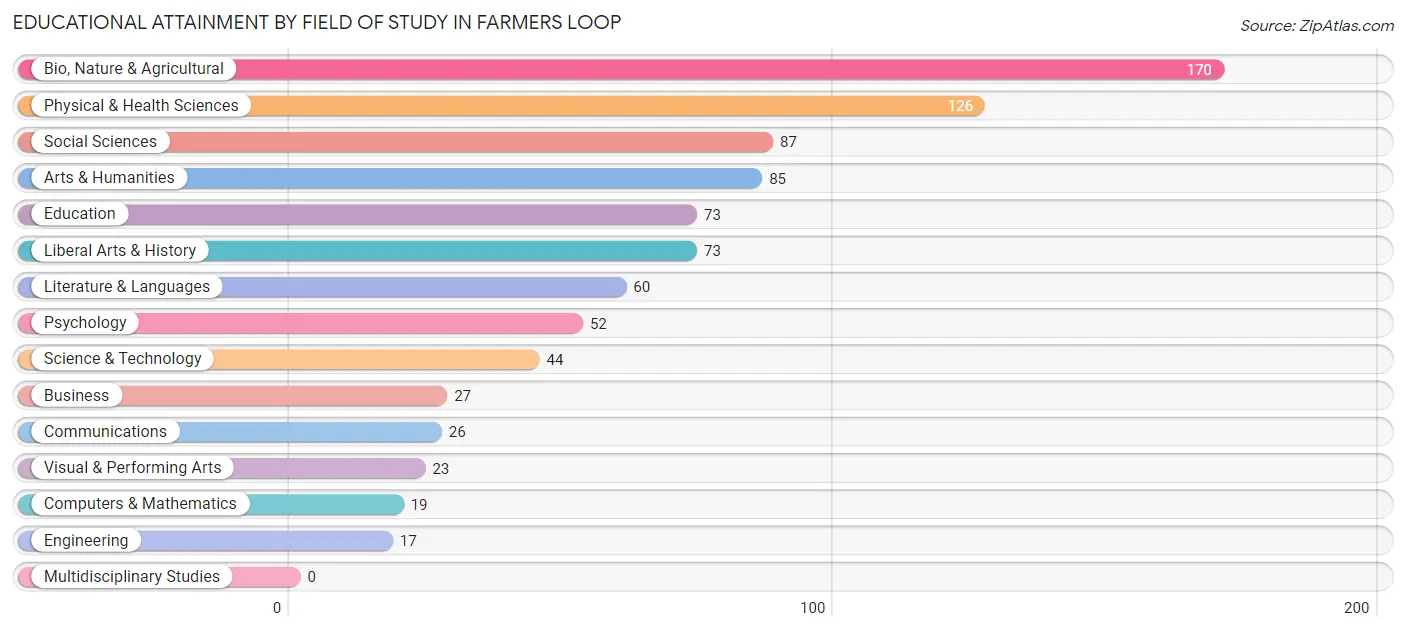
| Field of Study | # Graduates | % Graduates |
| Computers & Mathematics | 19 | 2.1% |
| Bio, Nature & Agricultural | 170 | 19.3% |
| Physical & Health Sciences | 126 | 14.3% |
| Psychology | 52 | 5.9% |
| Social Sciences | 87 | 9.9% |
| Engineering | 17 | 1.9% |
| Multidisciplinary Studies | 0 | 0.0% |
| Science & Technology | 44 | 5.0% |
| Business | 27 | 3.1% |
| Education | 73 | 8.3% |
| Literature & Languages | 60 | 6.8% |
| Liberal Arts & History | 73 | 8.3% |
| Visual & Performing Arts | 23 | 2.6% |
| Communications | 26 | 2.9% |
| Arts & Humanities | 85 | 9.6% |
| Total | 882 | 100.0% |
Transportation & Commute in Farmers Loop
Vehicle Availability by Sex in Farmers Loop
The most prevalent vehicle ownership categories in Farmers Loop are males with 2 vehicles (480, accounting for 33.0%) and females with 2 vehicles (261, making up 57.0%).
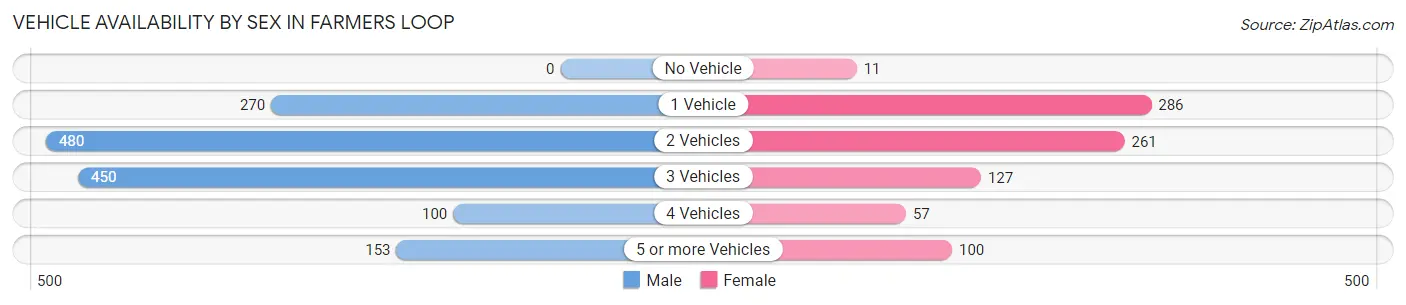
| Vehicles Available | Male | Female |
| No Vehicle | 0 (0.0%) | 11 (1.3%) |
| 1 Vehicle | 270 (18.6%) | 286 (34.0%) |
| 2 Vehicles | 480 (33.0%) | 261 (31.0%) |
| 3 Vehicles | 450 (31.0%) | 127 (15.1%) |
| 4 Vehicles | 100 (6.9%) | 57 (6.8%) |
| 5 or more Vehicles | 153 (10.5%) | 100 (11.9%) |
| Total | 1,453 (100.0%) | 842 (100.0%) |
Commute Time in Farmers Loop
The most frequently occuring commute durations in Farmers Loop are 15 to 19 minutes (729 commuters, 33.4%), 20 to 24 minutes (469 commuters, 21.5%), and 25 to 29 minutes (312 commuters, 14.3%).
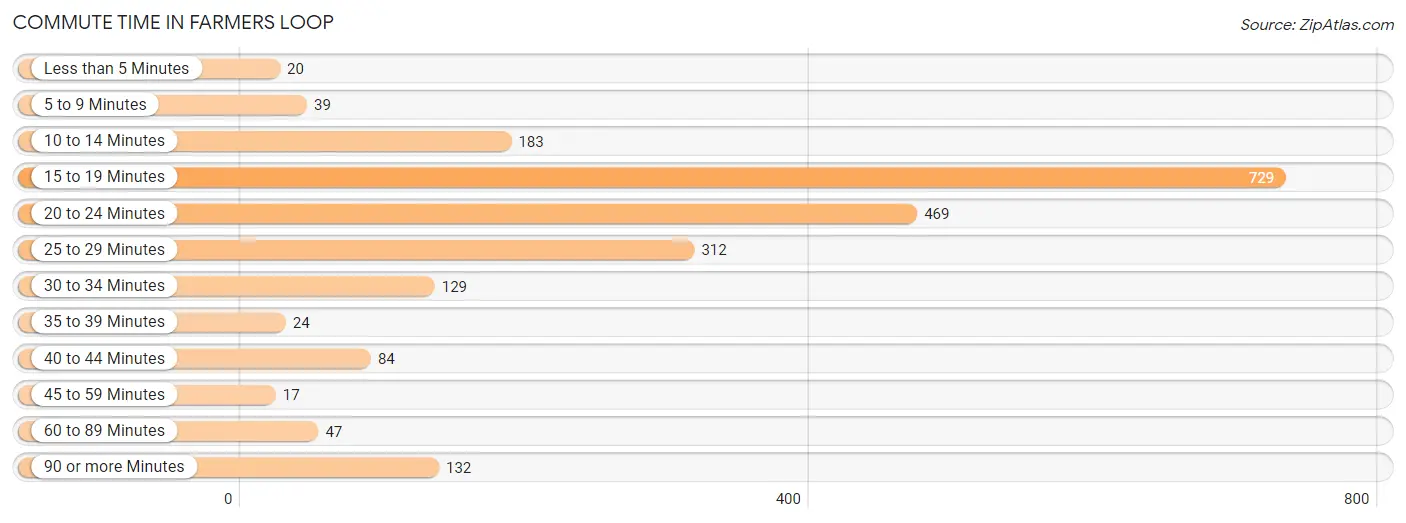
| Commute Time | # Commuters | % Commuters |
| Less than 5 Minutes | 20 | 0.9% |
| 5 to 9 Minutes | 39 | 1.8% |
| 10 to 14 Minutes | 183 | 8.4% |
| 15 to 19 Minutes | 729 | 33.4% |
| 20 to 24 Minutes | 469 | 21.5% |
| 25 to 29 Minutes | 312 | 14.3% |
| 30 to 34 Minutes | 129 | 5.9% |
| 35 to 39 Minutes | 24 | 1.1% |
| 40 to 44 Minutes | 84 | 3.8% |
| 45 to 59 Minutes | 17 | 0.8% |
| 60 to 89 Minutes | 47 | 2.1% |
| 90 or more Minutes | 132 | 6.0% |
Commute Time by Sex in Farmers Loop
The most common commute times in Farmers Loop are 15 to 19 minutes (407 commuters, 28.7%) for males and 15 to 19 minutes (322 commuters, 42.1%) for females.
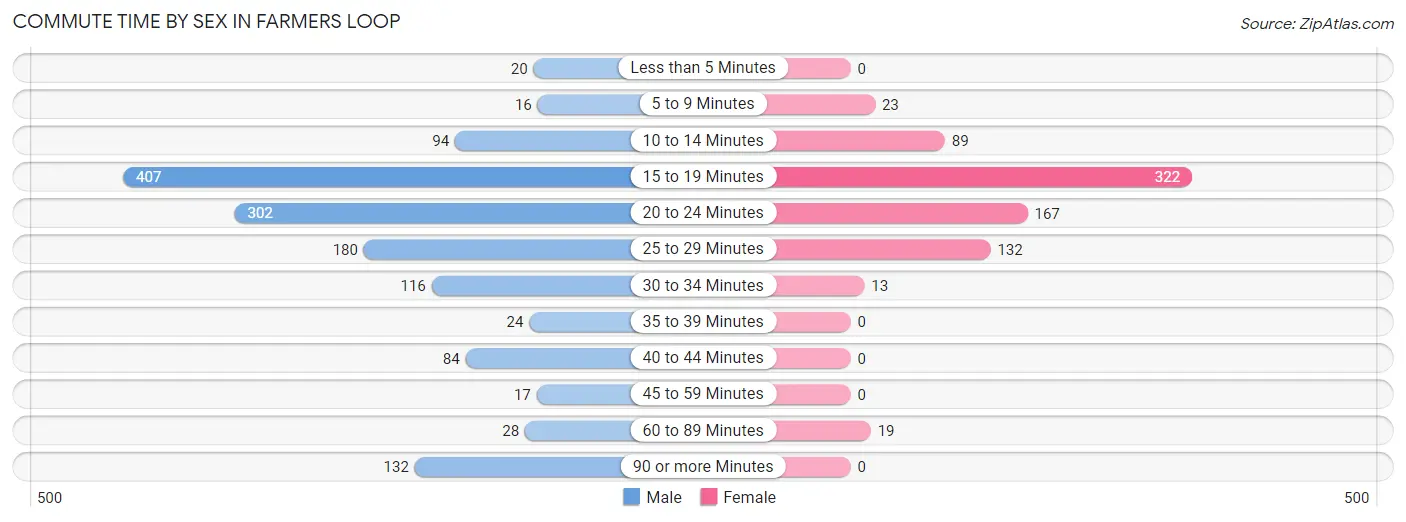
| Commute Time | Male | Female |
| Less than 5 Minutes | 20 (1.4%) | 0 (0.0%) |
| 5 to 9 Minutes | 16 (1.1%) | 23 (3.0%) |
| 10 to 14 Minutes | 94 (6.6%) | 89 (11.6%) |
| 15 to 19 Minutes | 407 (28.7%) | 322 (42.1%) |
| 20 to 24 Minutes | 302 (21.3%) | 167 (21.8%) |
| 25 to 29 Minutes | 180 (12.7%) | 132 (17.2%) |
| 30 to 34 Minutes | 116 (8.2%) | 13 (1.7%) |
| 35 to 39 Minutes | 24 (1.7%) | 0 (0.0%) |
| 40 to 44 Minutes | 84 (5.9%) | 0 (0.0%) |
| 45 to 59 Minutes | 17 (1.2%) | 0 (0.0%) |
| 60 to 89 Minutes | 28 (2.0%) | 19 (2.5%) |
| 90 or more Minutes | 132 (9.3%) | 0 (0.0%) |
Time of Departure to Work by Sex in Farmers Loop
The most frequent times of departure to work in Farmers Loop are 7:30 AM to 7:59 AM (289, 20.3%) for males and 12:00 AM to 4:59 AM (141, 18.4%) for females.
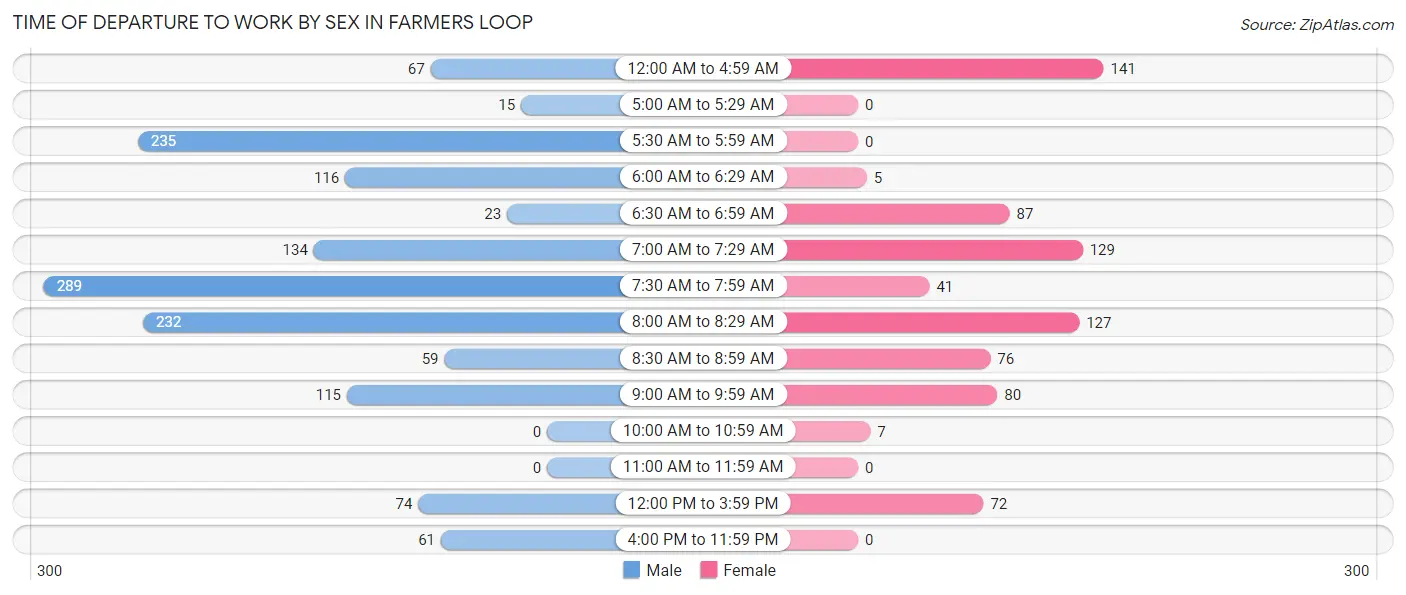
| Time of Departure | Male | Female |
| 12:00 AM to 4:59 AM | 67 (4.7%) | 141 (18.4%) |
| 5:00 AM to 5:29 AM | 15 (1.1%) | 0 (0.0%) |
| 5:30 AM to 5:59 AM | 235 (16.6%) | 0 (0.0%) |
| 6:00 AM to 6:29 AM | 116 (8.2%) | 5 (0.6%) |
| 6:30 AM to 6:59 AM | 23 (1.6%) | 87 (11.4%) |
| 7:00 AM to 7:29 AM | 134 (9.4%) | 129 (16.9%) |
| 7:30 AM to 7:59 AM | 289 (20.3%) | 41 (5.4%) |
| 8:00 AM to 8:29 AM | 232 (16.3%) | 127 (16.6%) |
| 8:30 AM to 8:59 AM | 59 (4.2%) | 76 (9.9%) |
| 9:00 AM to 9:59 AM | 115 (8.1%) | 80 (10.5%) |
| 10:00 AM to 10:59 AM | 0 (0.0%) | 7 (0.9%) |
| 11:00 AM to 11:59 AM | 0 (0.0%) | 0 (0.0%) |
| 12:00 PM to 3:59 PM | 74 (5.2%) | 72 (9.4%) |
| 4:00 PM to 11:59 PM | 61 (4.3%) | 0 (0.0%) |
| Total | 1,420 (100.0%) | 765 (100.0%) |
Housing Occupancy in Farmers Loop
Occupancy by Ownership in Farmers Loop
Of the total 1,658 dwellings in Farmers Loop, owner-occupied units account for 1,247 (75.2%), while renter-occupied units make up 411 (24.8%).
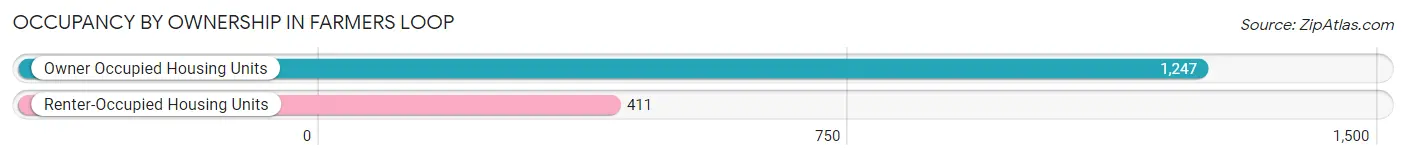
| Occupancy | # Housing Units | % Housing Units |
| Owner Occupied Housing Units | 1,247 | 75.2% |
| Renter-Occupied Housing Units | 411 | 24.8% |
| Total Occupied Housing Units | 1,658 | 100.0% |
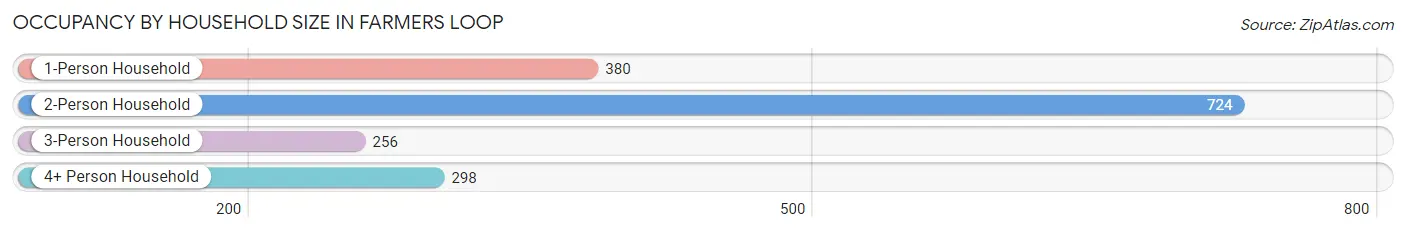
Occupancy by Household Size in Farmers Loop
| Household Size | # Housing Units | % Housing Units |
| 1-Person Household | 380 | 22.9% |
| 2-Person Household | 724 | 43.7% |
| 3-Person Household | 256 | 15.4% |
| 4+ Person Household | 298 | 18.0% |
| Total Housing Units | 1,658 | 100.0% |
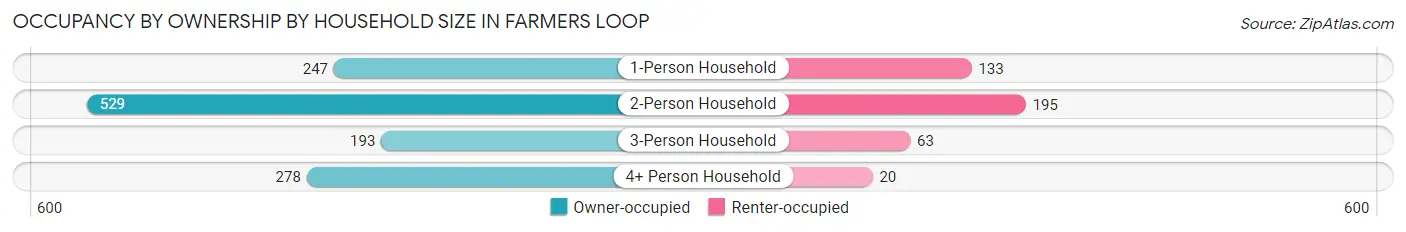
Occupancy by Ownership by Household Size in Farmers Loop
| Household Size | Owner-occupied | Renter-occupied |
| 1-Person Household | 247 (65.0%) | 133 (35.0%) |
| 2-Person Household | 529 (73.1%) | 195 (26.9%) |
| 3-Person Household | 193 (75.4%) | 63 (24.6%) |
| 4+ Person Household | 278 (93.3%) | 20 (6.7%) |
| Total Housing Units | 1,247 (75.2%) | 411 (24.8%) |
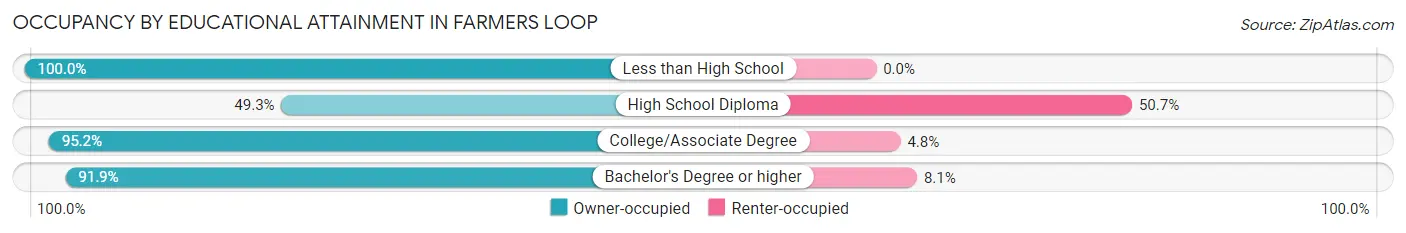
Occupancy by Educational Attainment in Farmers Loop
| Household Size | Owner-occupied | Renter-occupied |
| Less than High School | 41 (100.0%) | 0 (0.0%) |
| High School Diploma | 342 (49.3%) | 352 (50.7%) |
| College/Associate Degree | 455 (95.2%) | 23 (4.8%) |
| Bachelor's Degree or higher | 409 (91.9%) | 36 (8.1%) |
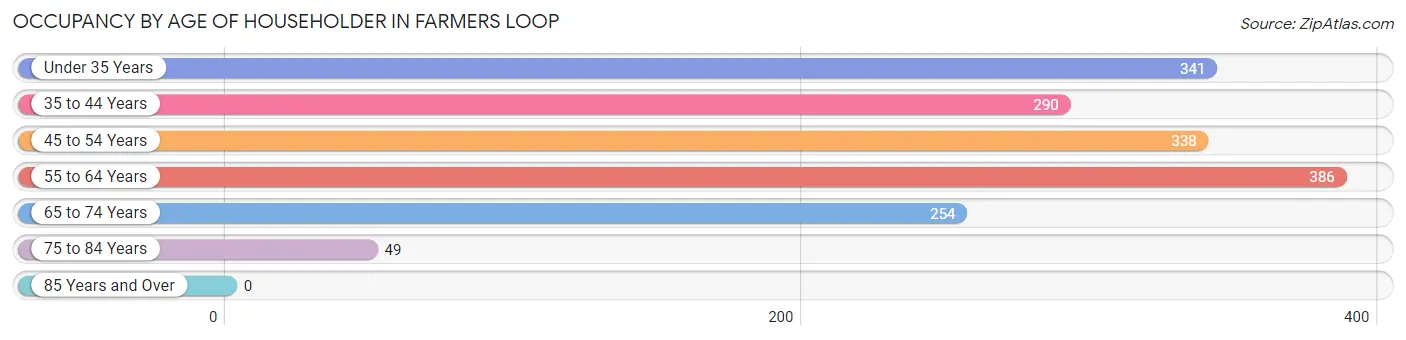
Occupancy by Age of Householder in Farmers Loop
| Age Bracket | # Households | % Households |
| Under 35 Years | 341 | 20.6% |
| 35 to 44 Years | 290 | 17.5% |
| 45 to 54 Years | 338 | 20.4% |
| 55 to 64 Years | 386 | 23.3% |
| 65 to 74 Years | 254 | 15.3% |
| 75 to 84 Years | 49 | 3.0% |
| 85 Years and Over | 0 | 0.0% |
| Total | 1,658 | 100.0% |
Housing Finances in Farmers Loop
Median Income by Occupancy in Farmers Loop
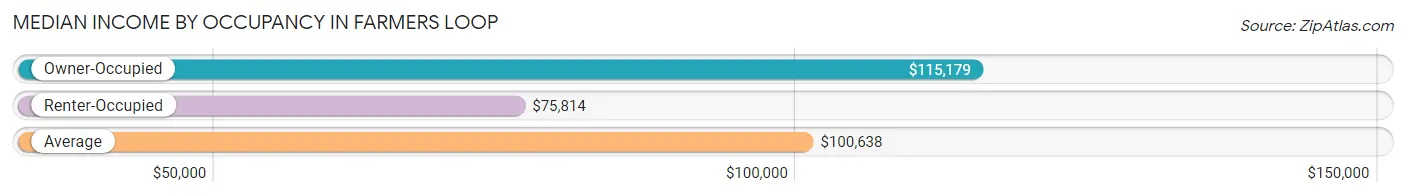
| Occupancy Type | # Households | Median Income |
| Owner-Occupied | 1,247 (75.2%) | $115,179 |
| Renter-Occupied | 411 (24.8%) | $75,814 |
| Average | 1,658 (100.0%) | $100,638 |
Occupancy by Householder Income Bracket in Farmers Loop
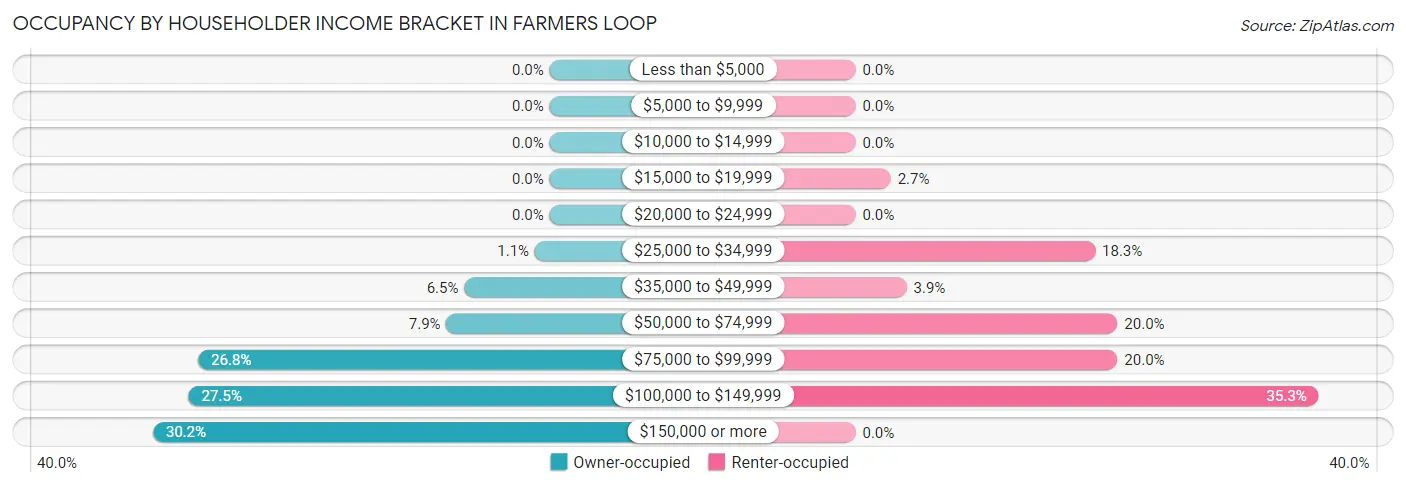
| Income Bracket | Owner-occupied | Renter-occupied |
| Less than $5,000 | 0 (0.0%) | 0 (0.0%) |
| $5,000 to $9,999 | 0 (0.0%) | 0 (0.0%) |
| $10,000 to $14,999 | 0 (0.0%) | 0 (0.0%) |
| $15,000 to $19,999 | 0 (0.0%) | 11 (2.7%) |
| $20,000 to $24,999 | 0 (0.0%) | 0 (0.0%) |
| $25,000 to $34,999 | 14 (1.1%) | 75 (18.2%) |
| $35,000 to $49,999 | 81 (6.5%) | 16 (3.9%) |
| $50,000 to $74,999 | 98 (7.9%) | 82 (20.0%) |
| $75,000 to $99,999 | 334 (26.8%) | 82 (20.0%) |
| $100,000 to $149,999 | 343 (27.5%) | 145 (35.3%) |
| $150,000 or more | 377 (30.2%) | 0 (0.0%) |
| Total | 1,247 (100.0%) | 411 (100.0%) |
Monthly Housing Cost Tiers in Farmers Loop
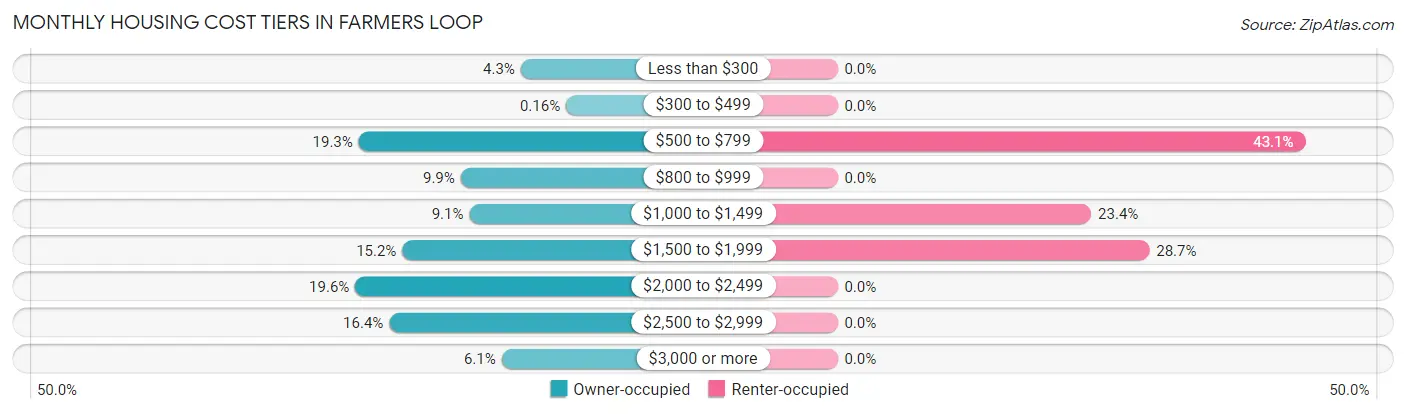
| Monthly Cost | Owner-occupied | Renter-occupied |
| Less than $300 | 54 (4.3%) | 0 (0.0%) |
| $300 to $499 | 2 (0.2%) | 0 (0.0%) |
| $500 to $799 | 240 (19.3%) | 177 (43.1%) |
| $800 to $999 | 123 (9.9%) | 0 (0.0%) |
| $1,000 to $1,499 | 113 (9.1%) | 96 (23.4%) |
| $1,500 to $1,999 | 190 (15.2%) | 118 (28.7%) |
| $2,000 to $2,499 | 244 (19.6%) | 0 (0.0%) |
| $2,500 to $2,999 | 205 (16.4%) | 0 (0.0%) |
| $3,000 or more | 76 (6.1%) | 0 (0.0%) |
| Total | 1,247 (100.0%) | 411 (100.0%) |
Physical Housing Characteristics in Farmers Loop
Housing Structures in Farmers Loop
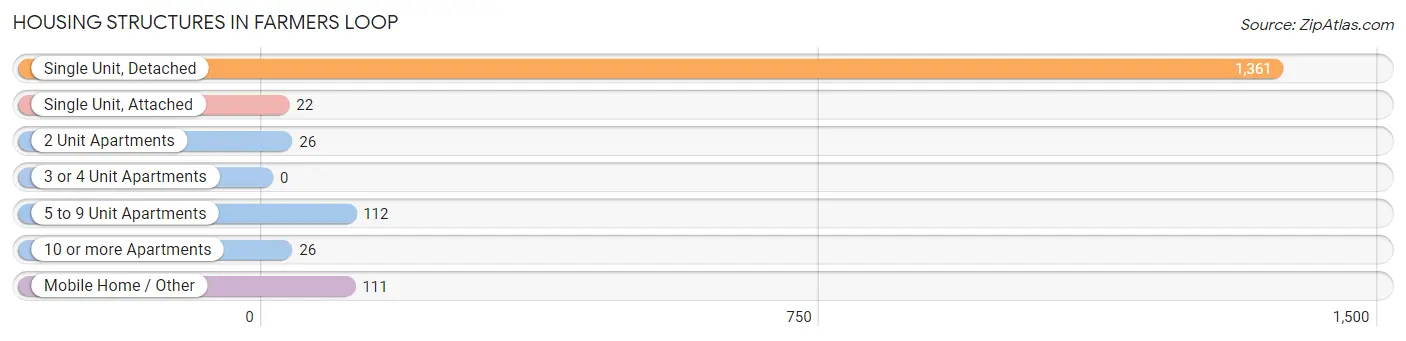
| Structure Type | # Housing Units | % Housing Units |
| Single Unit, Detached | 1,361 | 82.1% |
| Single Unit, Attached | 22 | 1.3% |
| 2 Unit Apartments | 26 | 1.6% |
| 3 or 4 Unit Apartments | 0 | 0.0% |
| 5 to 9 Unit Apartments | 112 | 6.8% |
| 10 or more Apartments | 26 | 1.6% |
| Mobile Home / Other | 111 | 6.7% |
| Total | 1,658 | 100.0% |
Housing Structures by Occupancy in Farmers Loop
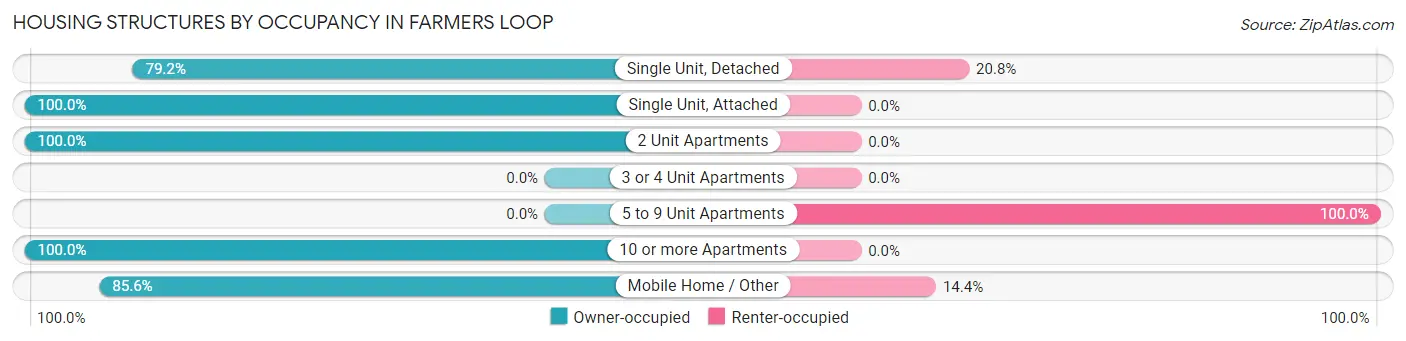
| Structure Type | Owner-occupied | Renter-occupied |
| Single Unit, Detached | 1,078 (79.2%) | 283 (20.8%) |
| Single Unit, Attached | 22 (100.0%) | 0 (0.0%) |
| 2 Unit Apartments | 26 (100.0%) | 0 (0.0%) |
| 3 or 4 Unit Apartments | 0 (0.0%) | 0 (0.0%) |
| 5 to 9 Unit Apartments | 0 (0.0%) | 112 (100.0%) |
| 10 or more Apartments | 26 (100.0%) | 0 (0.0%) |
| Mobile Home / Other | 95 (85.6%) | 16 (14.4%) |
| Total | 1,247 (75.2%) | 411 (24.8%) |
Housing Structures by Number of Rooms in Farmers Loop
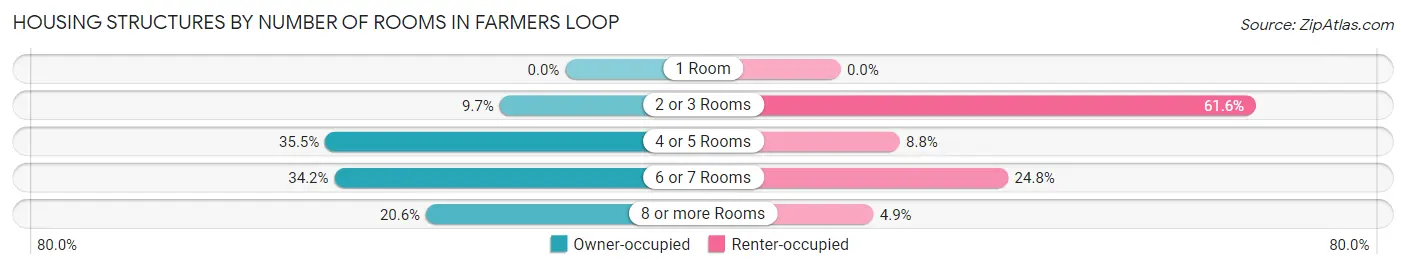
| Number of Rooms | Owner-occupied | Renter-occupied |
| 1 Room | 0 (0.0%) | 0 (0.0%) |
| 2 or 3 Rooms | 121 (9.7%) | 253 (61.6%) |
| 4 or 5 Rooms | 443 (35.5%) | 36 (8.8%) |
| 6 or 7 Rooms | 426 (34.2%) | 102 (24.8%) |
| 8 or more Rooms | 257 (20.6%) | 20 (4.9%) |
| Total | 1,247 (100.0%) | 411 (100.0%) |
Housing Structure by Heating Type in Farmers Loop
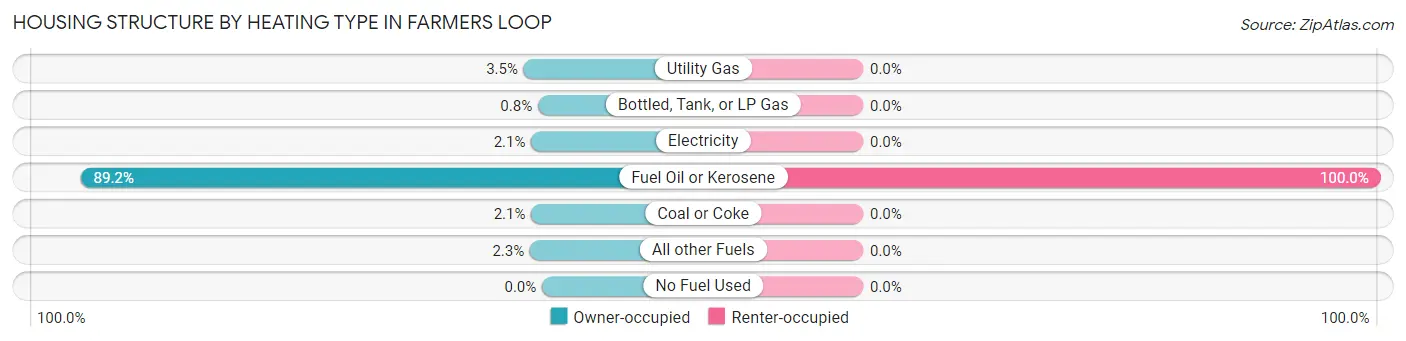
| Heating Type | Owner-occupied | Renter-occupied |
| Utility Gas | 44 (3.5%) | 0 (0.0%) |
| Bottled, Tank, or LP Gas | 10 (0.8%) | 0 (0.0%) |
| Electricity | 26 (2.1%) | 0 (0.0%) |
| Fuel Oil or Kerosene | 1,112 (89.2%) | 411 (100.0%) |
| Coal or Coke | 26 (2.1%) | 0 (0.0%) |
| All other Fuels | 29 (2.3%) | 0 (0.0%) |
| No Fuel Used | 0 (0.0%) | 0 (0.0%) |
| Total | 1,247 (100.0%) | 411 (100.0%) |
Household Vehicle Usage in Farmers Loop
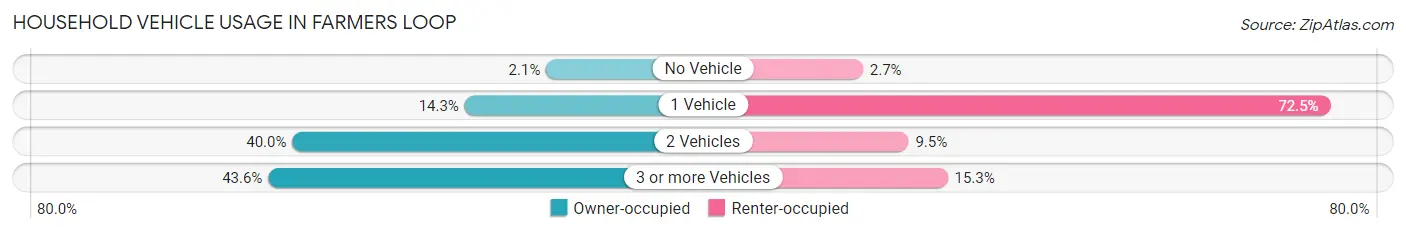
| Vehicles per Household | Owner-occupied | Renter-occupied |
| No Vehicle | 26 (2.1%) | 11 (2.7%) |
| 1 Vehicle | 178 (14.3%) | 298 (72.5%) |
| 2 Vehicles | 499 (40.0%) | 39 (9.5%) |
| 3 or more Vehicles | 544 (43.6%) | 63 (15.3%) |
| Total | 1,247 (100.0%) | 411 (100.0%) |
Real Estate & Mortgages in Farmers Loop
Real Estate and Mortgage Overview in Farmers Loop
| Characteristic | Without Mortgage | With Mortgage |
| Housing Units | 439 | 808 |
| Median Property Value | $229,200 | $299,200 |
| Median Household Income | $99,293 | $207 |
| Monthly Housing Costs | $677 | $76 |
| Real Estate Taxes | $3,247 | $28 |
Property Value by Mortgage Status in Farmers Loop
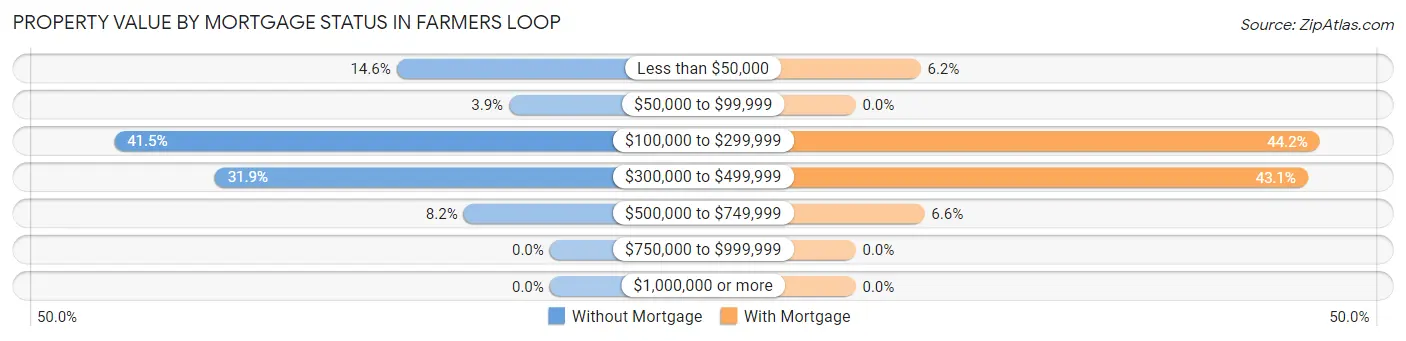
| Property Value | Without Mortgage | With Mortgage |
| Less than $50,000 | 64 (14.6%) | 50 (6.2%) |
| $50,000 to $99,999 | 17 (3.9%) | 0 (0.0%) |
| $100,000 to $299,999 | 182 (41.5%) | 357 (44.2%) |
| $300,000 to $499,999 | 140 (31.9%) | 348 (43.1%) |
| $500,000 to $749,999 | 36 (8.2%) | 53 (6.6%) |
| $750,000 to $999,999 | 0 (0.0%) | 0 (0.0%) |
| $1,000,000 or more | 0 (0.0%) | 0 (0.0%) |
| Total | 439 (100.0%) | 808 (100.0%) |
Household Income by Mortgage Status in Farmers Loop
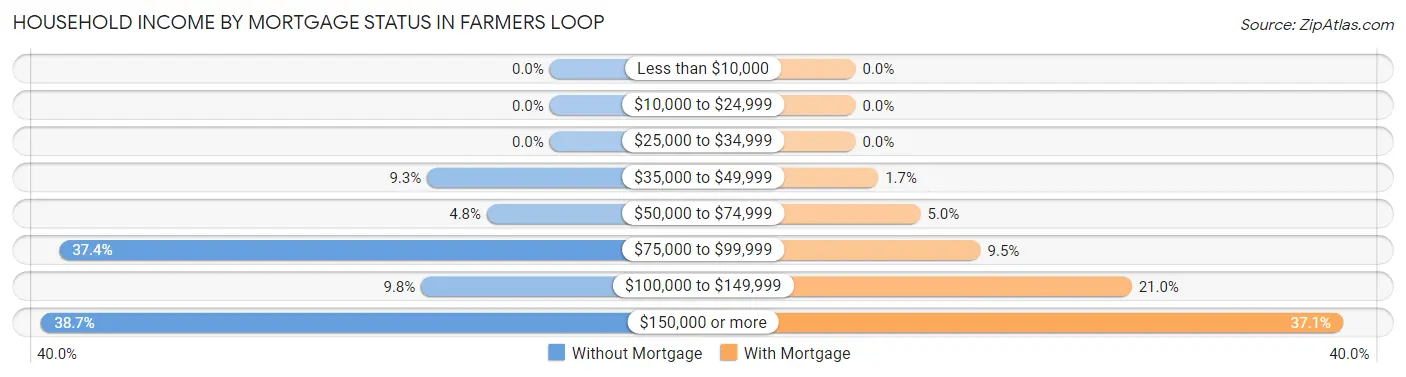
| Household Income | Without Mortgage | With Mortgage |
| Less than $10,000 | 0 (0.0%) | 0 (0.0%) |
| $10,000 to $24,999 | 0 (0.0%) | 0 (0.0%) |
| $25,000 to $34,999 | 0 (0.0%) | 0 (0.0%) |
| $35,000 to $49,999 | 41 (9.3%) | 14 (1.7%) |
| $50,000 to $74,999 | 21 (4.8%) | 40 (5.0%) |
| $75,000 to $99,999 | 164 (37.4%) | 77 (9.5%) |
| $100,000 to $149,999 | 43 (9.8%) | 170 (21.0%) |
| $150,000 or more | 170 (38.7%) | 300 (37.1%) |
| Total | 439 (100.0%) | 808 (100.0%) |
Property Value to Household Income Ratio in Farmers Loop
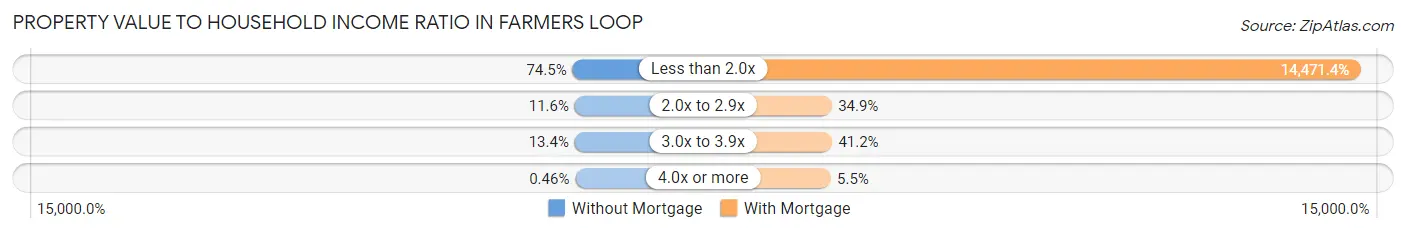
| Value-to-Income Ratio | Without Mortgage | With Mortgage |
| Less than 2.0x | 327 (74.5%) | 116,929 (14,471.4%) |
| 2.0x to 2.9x | 51 (11.6%) | 282 (34.9%) |
| 3.0x to 3.9x | 59 (13.4%) | 333 (41.2%) |
| 4.0x or more | 2 (0.5%) | 44 (5.4%) |
| Total | 439 (100.0%) | 808 (100.0%) |
Real Estate Taxes by Mortgage Status in Farmers Loop
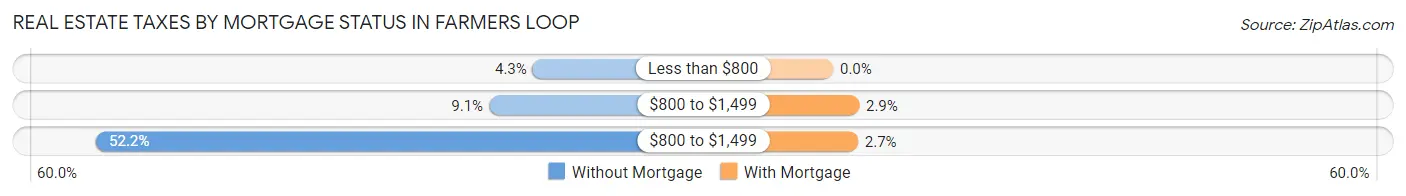
| Property Taxes | Without Mortgage | With Mortgage |
| Less than $800 | 19 (4.3%) | 0 (0.0%) |
| $800 to $1,499 | 40 (9.1%) | 23 (2.9%) |
| $800 to $1,499 | 229 (52.2%) | 22 (2.7%) |
| Total | 439 (100.0%) | 808 (100.0%) |
Health & Disability in Farmers Loop
Health Insurance Coverage by Age in Farmers Loop
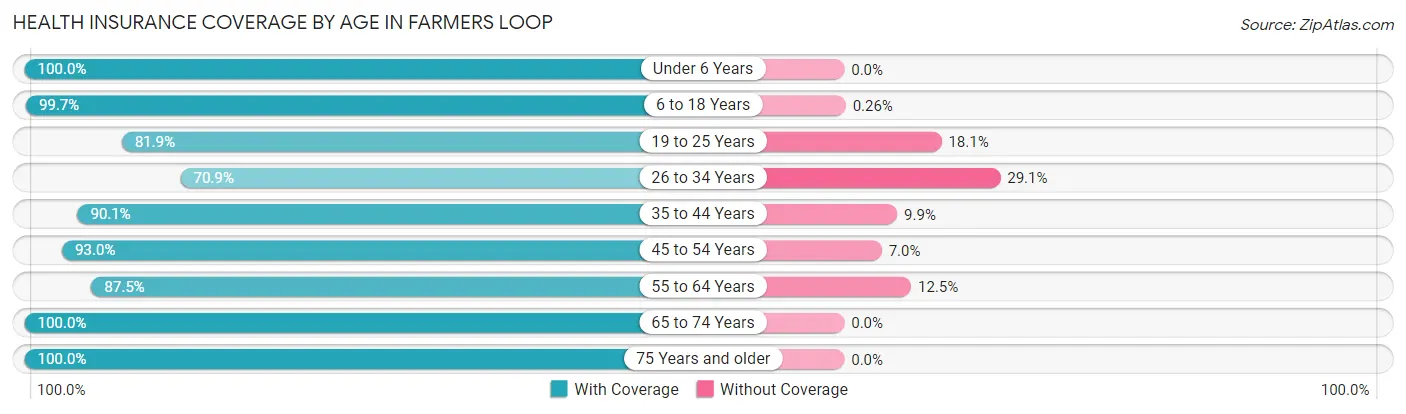
| Age Bracket | With Coverage | Without Coverage |
| Under 6 Years | 296 (100.0%) | 0 (0.0%) |
| 6 to 18 Years | 772 (99.7%) | 2 (0.3%) |
| 19 to 25 Years | 384 (81.9%) | 85 (18.1%) |
| 26 to 34 Years | 373 (70.9%) | 153 (29.1%) |
| 35 to 44 Years | 503 (90.1%) | 55 (9.9%) |
| 45 to 54 Years | 440 (93.0%) | 33 (7.0%) |
| 55 to 64 Years | 569 (87.5%) | 81 (12.5%) |
| 65 to 74 Years | 331 (100.0%) | 0 (0.0%) |
| 75 Years and older | 68 (100.0%) | 0 (0.0%) |
| Total | 3,736 (90.1%) | 409 (9.9%) |
Health Insurance Coverage by Citizenship Status in Farmers Loop
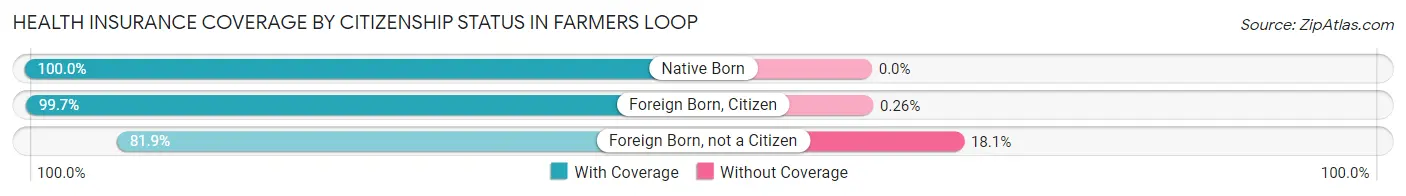
| Citizenship Status | With Coverage | Without Coverage |
| Native Born | 296 (100.0%) | 0 (0.0%) |
| Foreign Born, Citizen | 772 (99.7%) | 2 (0.3%) |
| Foreign Born, not a Citizen | 384 (81.9%) | 85 (18.1%) |
Health Insurance Coverage by Household Income in Farmers Loop
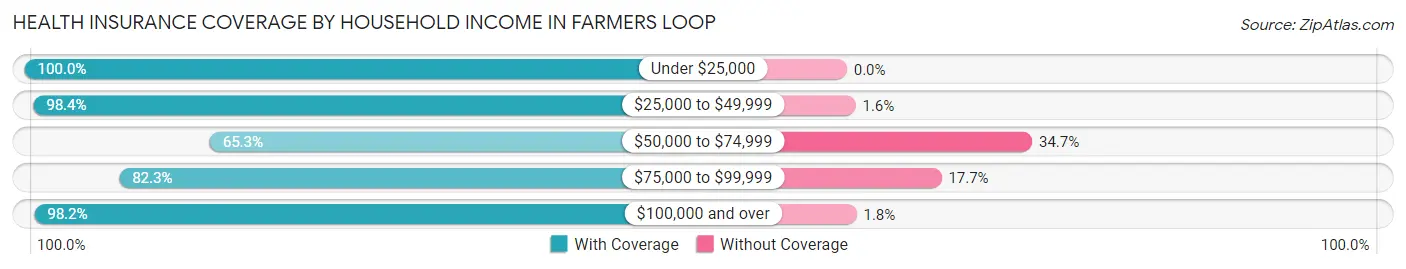
| Household Income | With Coverage | Without Coverage |
| Under $25,000 | 11 (100.0%) | 0 (0.0%) |
| $25,000 to $49,999 | 240 (98.4%) | 4 (1.6%) |
| $50,000 to $74,999 | 316 (65.3%) | 168 (34.7%) |
| $75,000 to $99,999 | 905 (82.3%) | 195 (17.7%) |
| $100,000 and over | 2,261 (98.2%) | 42 (1.8%) |
Public vs Private Health Insurance Coverage by Age in Farmers Loop
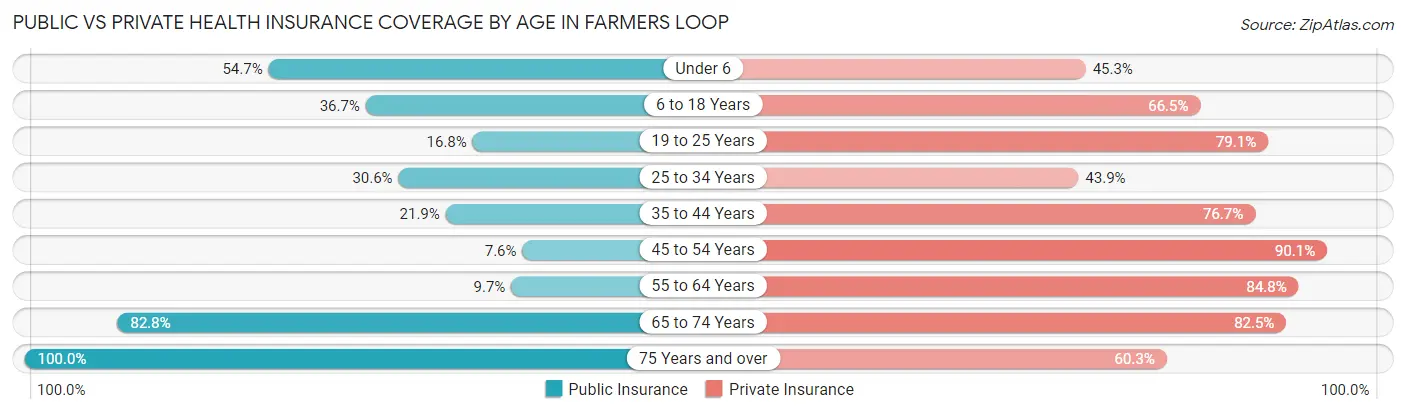
| Age Bracket | Public Insurance | Private Insurance |
| Under 6 | 162 (54.7%) | 134 (45.3%) |
| 6 to 18 Years | 284 (36.7%) | 515 (66.5%) |
| 19 to 25 Years | 79 (16.8%) | 371 (79.1%) |
| 25 to 34 Years | 161 (30.6%) | 231 (43.9%) |
| 35 to 44 Years | 122 (21.9%) | 428 (76.7%) |
| 45 to 54 Years | 36 (7.6%) | 426 (90.1%) |
| 55 to 64 Years | 63 (9.7%) | 551 (84.8%) |
| 65 to 74 Years | 274 (82.8%) | 273 (82.5%) |
| 75 Years and over | 68 (100.0%) | 41 (60.3%) |
| Total | 1,249 (30.1%) | 2,970 (71.7%) |
Disability Status by Sex by Age in Farmers Loop
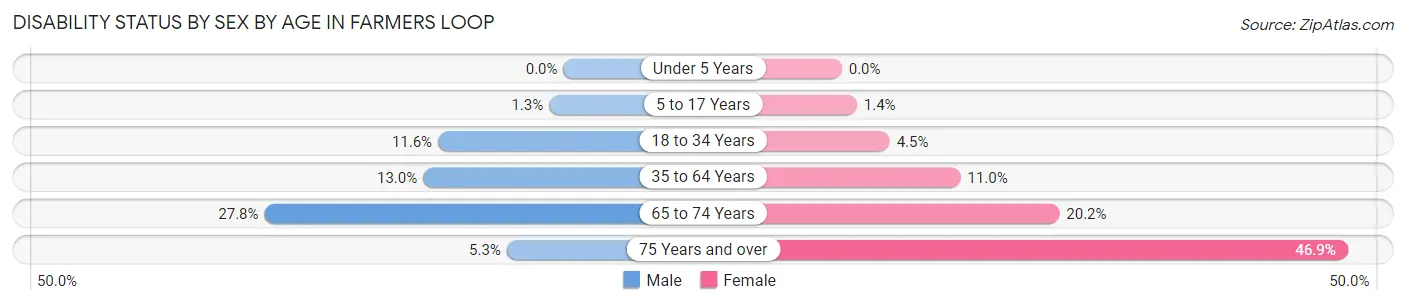
| Age Bracket | Male | Female |
| Under 5 Years | 0 (0.0%) | 0 (0.0%) |
| 5 to 17 Years | 5 (1.3%) | 6 (1.4%) |
| 18 to 34 Years | 66 (11.6%) | 21 (4.4%) |
| 35 to 64 Years | 122 (13.0%) | 82 (11.0%) |
| 65 to 74 Years | 63 (27.8%) | 21 (20.2%) |
| 75 Years and over | 1 (5.3%) | 23 (46.9%) |
Disability Class by Sex by Age in Farmers Loop
Disability Class: Hearing Difficulty
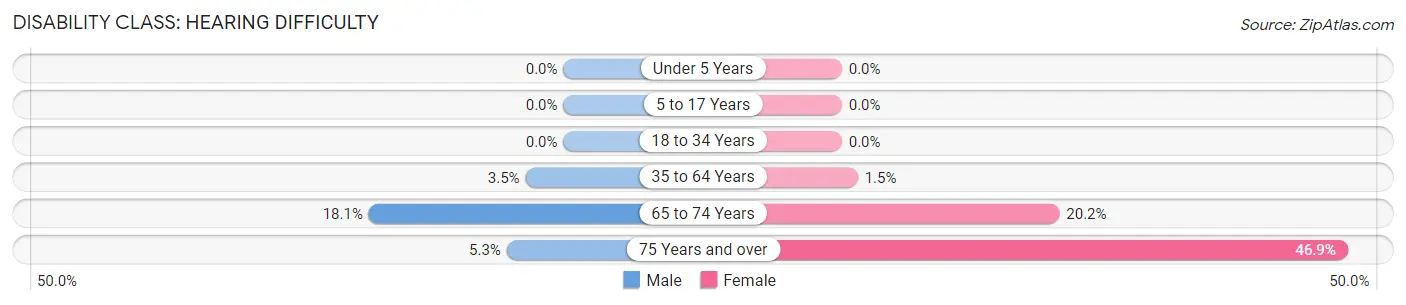
| Age Bracket | Male | Female |
| Under 5 Years | 0 (0.0%) | 0 (0.0%) |
| 5 to 17 Years | 0 (0.0%) | 0 (0.0%) |
| 18 to 34 Years | 0 (0.0%) | 0 (0.0%) |
| 35 to 64 Years | 33 (3.5%) | 11 (1.5%) |
| 65 to 74 Years | 41 (18.1%) | 21 (20.2%) |
| 75 Years and over | 1 (5.3%) | 23 (46.9%) |
Disability Class: Vision Difficulty
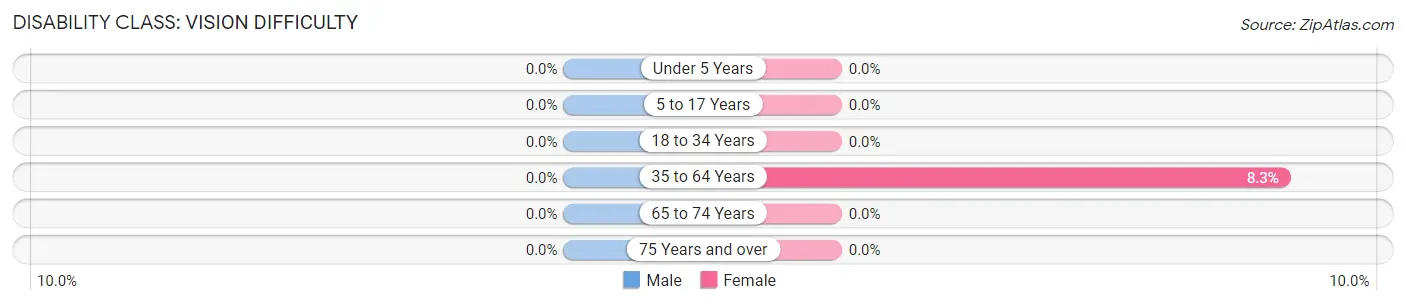
| Age Bracket | Male | Female |
| Under 5 Years | 0 (0.0%) | 0 (0.0%) |
| 5 to 17 Years | 0 (0.0%) | 0 (0.0%) |
| 18 to 34 Years | 0 (0.0%) | 0 (0.0%) |
| 35 to 64 Years | 0 (0.0%) | 62 (8.3%) |
| 65 to 74 Years | 0 (0.0%) | 0 (0.0%) |
| 75 Years and over | 0 (0.0%) | 0 (0.0%) |
Disability Class: Cognitive Difficulty
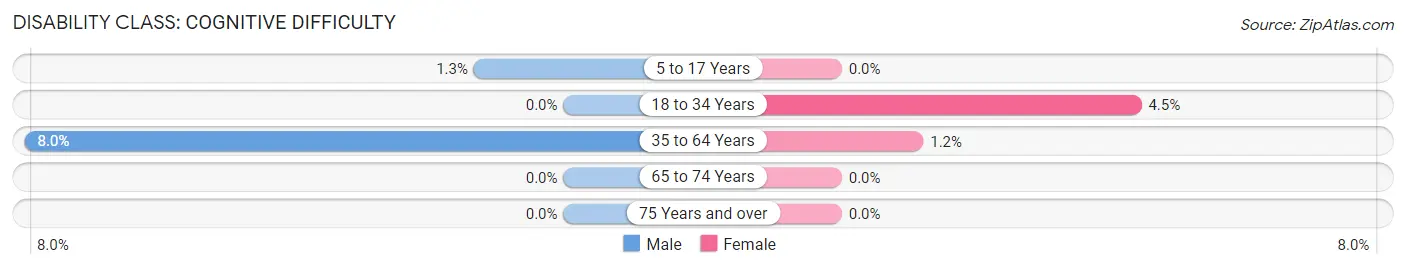
| Age Bracket | Male | Female |
| 5 to 17 Years | 5 (1.3%) | 0 (0.0%) |
| 18 to 34 Years | 0 (0.0%) | 21 (4.4%) |
| 35 to 64 Years | 75 (8.0%) | 9 (1.2%) |
| 65 to 74 Years | 0 (0.0%) | 0 (0.0%) |
| 75 Years and over | 0 (0.0%) | 0 (0.0%) |
Disability Class: Ambulatory Difficulty
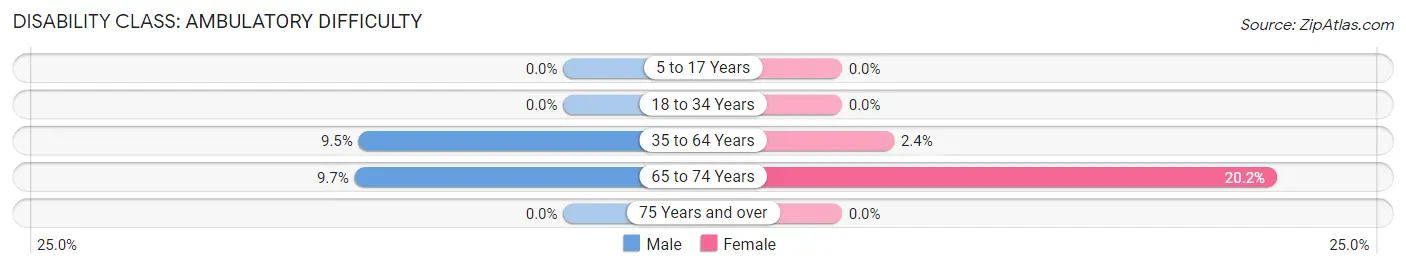
| Age Bracket | Male | Female |
| 5 to 17 Years | 0 (0.0%) | 0 (0.0%) |
| 18 to 34 Years | 0 (0.0%) | 0 (0.0%) |
| 35 to 64 Years | 89 (9.5%) | 18 (2.4%) |
| 65 to 74 Years | 22 (9.7%) | 21 (20.2%) |
| 75 Years and over | 0 (0.0%) | 0 (0.0%) |
Disability Class: Self-Care Difficulty

| Age Bracket | Male | Female |
| 5 to 17 Years | 0 (0.0%) | 6 (1.4%) |
| 18 to 34 Years | 0 (0.0%) | 0 (0.0%) |
| 35 to 64 Years | 14 (1.5%) | 0 (0.0%) |
| 65 to 74 Years | 0 (0.0%) | 21 (20.2%) |
| 75 Years and over | 0 (0.0%) | 0 (0.0%) |
Technology Access in Farmers Loop
Computing Device Access in Farmers Loop
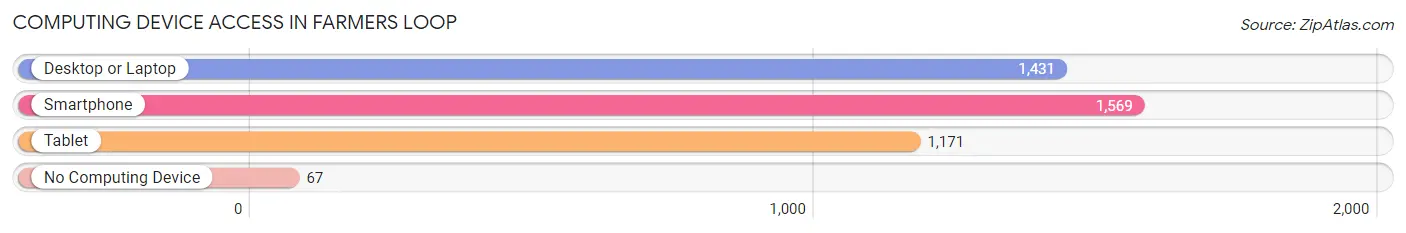
| Device Type | # Households | % Households |
| Desktop or Laptop | 1,431 | 86.3% |
| Smartphone | 1,569 | 94.6% |
| Tablet | 1,171 | 70.6% |
| No Computing Device | 67 | 4.0% |
| Total | 1,658 | 100.0% |
Internet Access in Farmers Loop
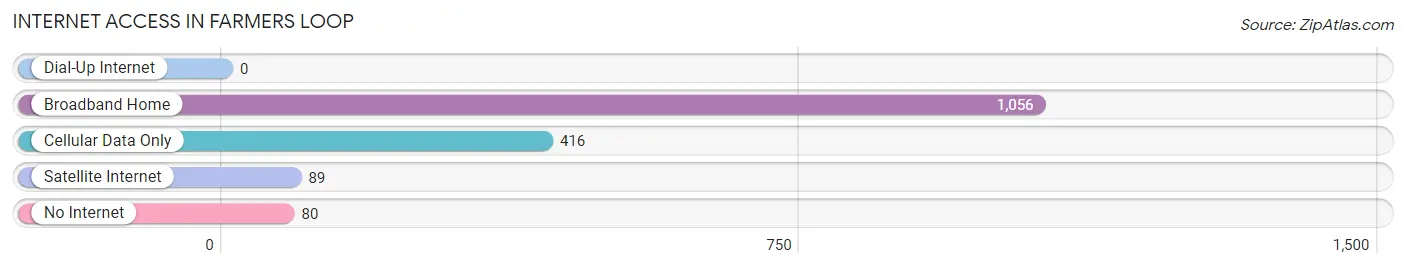
| Internet Type | # Households | % Households |
| Dial-Up Internet | 0 | 0.0% |
| Broadband Home | 1,056 | 63.7% |
| Cellular Data Only | 416 | 25.1% |
| Satellite Internet | 89 | 5.4% |
| No Internet | 80 | 4.8% |
| Total | 1,658 | 100.0% |
Farmers Loop Summary
Farmers Loop is an unincorporated community located in the Fairbanks North Star Borough of Alaska. It is located approximately 20 miles north of Fairbanks and is home to approximately 1,000 people. The community is located in the Tanana Valley, which is part of the Interior of Alaska. The area is known for its beautiful scenery and abundant wildlife.
History
The area now known as Farmers Loop was first settled in the late 1800s by miners and trappers. The area was originally known as “The Loop” due to its loop-like shape. The name was later changed to Farmers Loop when the area was settled by farmers in the early 1900s. The farmers were attracted to the area due to its fertile soil and abundant wildlife.
The area was also home to a number of Native American tribes, including the Tanana, Koyukon, and Inupiat. These tribes had lived in the area for centuries before the arrival of the settlers.
Geography
Farmers Loop is located in the Tanana Valley, which is part of the Interior of Alaska. The area is known for its beautiful scenery and abundant wildlife. The area is also home to a number of rivers, including the Tanana River, Chena River, and Salcha River.
The area is also home to a number of mountains, including the White Mountains, the Alaska Range, and the Brooks Range. The area is also home to a number of lakes, including the Chena Lake, the Salcha Lake, and the Tanana Lake.
Economy
The economy of Farmers Loop is largely based on agriculture and tourism. The area is home to a number of farms, which produce a variety of crops, including potatoes, carrots, and hay. The area is also home to a number of tourist attractions, including the Chena Hot Springs Resort and the Chena River State Recreation Area.
The area is also home to a number of businesses, including restaurants, stores, and gas stations. The area is also home to a number of small manufacturing companies, which produce a variety of products, including furniture, clothing, and jewelry.
Demographics
As of the 2010 census, the population of Farmers Loop was 1,000. The population is largely white, with a small percentage of Native Americans and other ethnicities. The median age of the population is 37. The median household income is $50,000.
Conclusion
Farmers Loop is an unincorporated community located in the Fairbanks North Star Borough of Alaska. It is located approximately 20 miles north of Fairbanks and is home to approximately 1,000 people. The area is known for its beautiful scenery and abundant wildlife. The economy of Farmers Loop is largely based on agriculture and tourism. The population is largely white, with a small percentage of Native Americans and other ethnicities. The median age of the population is 37 and the median household income is $50,000.
Common Questions
What is Per Capita Income in Farmers Loop?
Per Capita income in Farmers Loop is $46,658.
What is the Median Family Income in Farmers Loop?
Median Family Income in Farmers Loop is $116,036.
What is the Median Household income in Farmers Loop?
Median Household Income in Farmers Loop is $100,638.
What is Income or Wage Gap in Farmers Loop?
Income or Wage Gap in Farmers Loop is 42.6%.
Women in Farmers Loop earn 57.4 cents for every dollar earned by a man.
What is Inequality or Gini Index in Farmers Loop?
Inequality or Gini Index in Farmers Loop is 0.29.
What is the Total Population of Farmers Loop?
Total Population of Farmers Loop is 4,179.
What is the Total Male Population of Farmers Loop?
Total Male Population of Farmers Loop is 2,234.
What is the Total Female Population of Farmers Loop?
Total Female Population of Farmers Loop is 1,945.
What is the Ratio of Males per 100 Females in Farmers Loop?
There are 114.86 Males per 100 Females in Farmers Loop.
What is the Ratio of Females per 100 Males in Farmers Loop?
There are 87.06 Females per 100 Males in Farmers Loop.
What is the Median Population Age in Farmers Loop?
Median Population Age in Farmers Loop is 35.2 Years.
What is the Average Family Size in Farmers Loop
Average Family Size in Farmers Loop is 3.1 People.
What is the Average Household Size in Farmers Loop
Average Household Size in Farmers Loop is 2.5 People.
How Large is the Labor Force in Farmers Loop?
There are 2,386 People in the Labor Forcein in Farmers Loop.
What is the Percentage of People in the Labor Force in Farmers Loop?
71.4% of People are in the Labor Force in Farmers Loop.
What is the Unemployment Rate in Farmers Loop?
Unemployment Rate in Farmers Loop is 3.7%.