Chignik Lagoon, AK Map & Demographics
Chignik Lagoon Map
Chignik Lagoon Overview
$22,490
PER CAPITA INCOME
$66,667
AVG FAMILY INCOME
$65,833
AVG HOUSEHOLD INCOME
0.28
INEQUALITY / GINI INDEX
39
TOTAL POPULATION
14
MALE POPULATION
25
FEMALE POPULATION
56.00
MALES / 100 FEMALES
178.57
FEMALES / 100 MALES
40.8
MEDIAN AGE
2.9
AVG FAMILY SIZE
2.8
AVG HOUSEHOLD SIZE
14
LABOR FORCE [ PEOPLE ]
46.7%
PERCENT IN LABOR FORCE
Chignik Lagoon Zip Codes
Chignik Lagoon Area Codes
Income in Chignik Lagoon
Income Overview in Chignik Lagoon
Per Capita Income in Chignik Lagoon is $22,490, while median incomes of families and households are $66,667 and $65,833 respectively.
| Characteristic | Number | Measure |
| Per Capita Income | 39 | $22,490 |
| Median Family Income | 12 | $66,667 |
| Mean Family Income | 12 | $91,558 |
| Median Household Income | 14 | $65,833 |
| Mean Household Income | 14 | $84,121 |
| Income Deficit | 12 | $0 |
| Wage / Income Gap (%) | 39 | 0.00% |
| Wage / Income Gap ($) | 39 | 100.00¢ per $1 |
| Gini / Inequality Index | 39 | 0.28 |
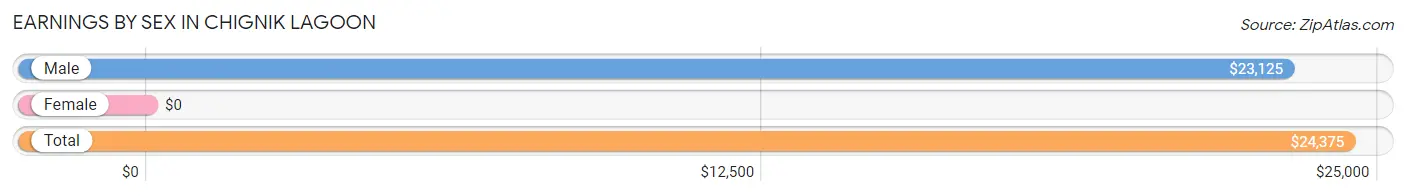
Earnings by Sex in Chignik Lagoon
| Sex | Number | Average Earnings |
| Male | 8 (50.0%) | $23,125 |
| Female | 8 (50.0%) | $0 |
| Total | 16 (100.0%) | $24,375 |
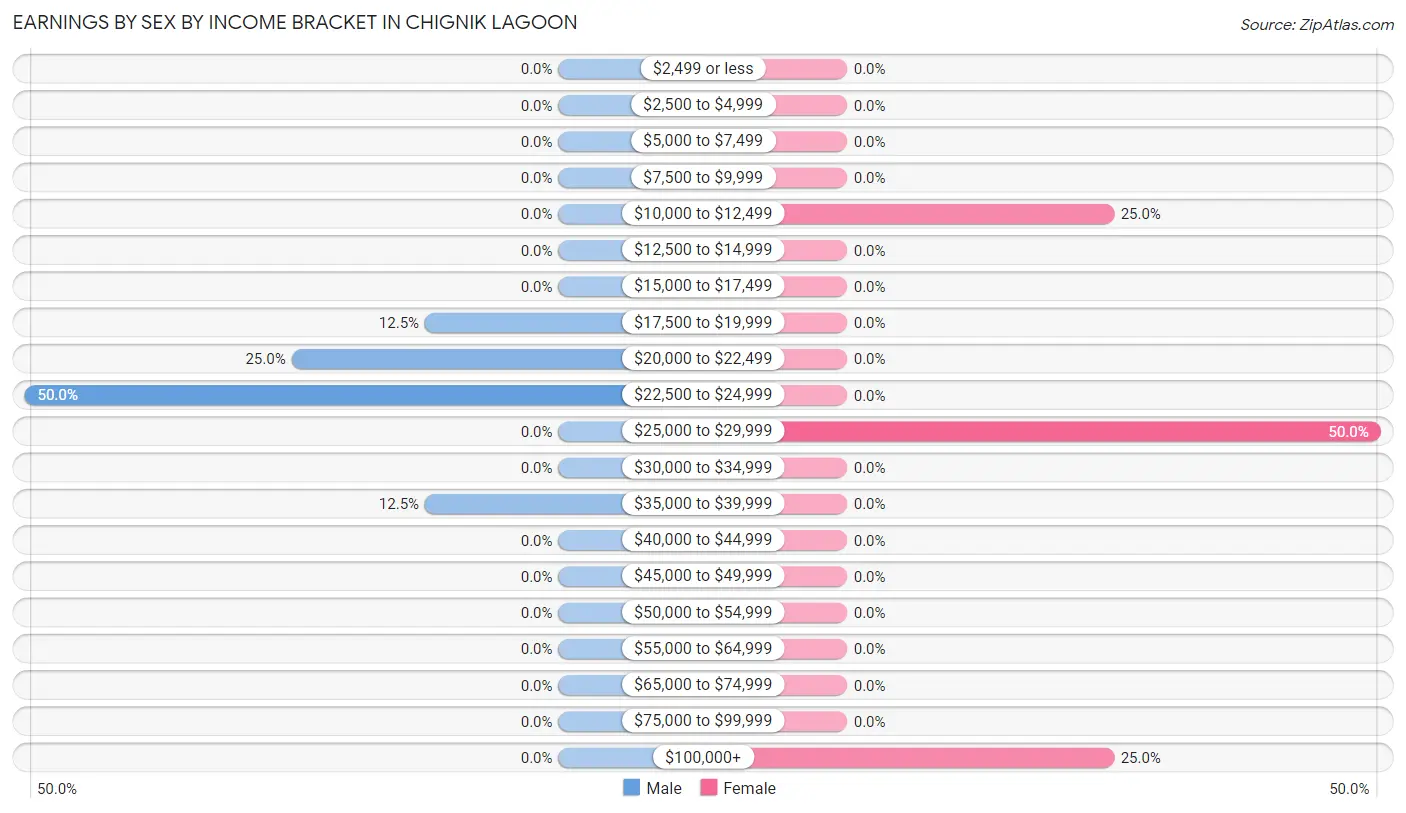
Earnings by Sex by Income Bracket in Chignik Lagoon
The most common earnings brackets in Chignik Lagoon are $22,500 to $24,999 for men (4 | 50.0%) and $25,000 to $29,999 for women (4 | 50.0%).
| Income | Male | Female |
| $2,499 or less | 0 (0.0%) | 0 (0.0%) |
| $2,500 to $4,999 | 0 (0.0%) | 0 (0.0%) |
| $5,000 to $7,499 | 0 (0.0%) | 0 (0.0%) |
| $7,500 to $9,999 | 0 (0.0%) | 0 (0.0%) |
| $10,000 to $12,499 | 0 (0.0%) | 2 (25.0%) |
| $12,500 to $14,999 | 0 (0.0%) | 0 (0.0%) |
| $15,000 to $17,499 | 0 (0.0%) | 0 (0.0%) |
| $17,500 to $19,999 | 1 (12.5%) | 0 (0.0%) |
| $20,000 to $22,499 | 2 (25.0%) | 0 (0.0%) |
| $22,500 to $24,999 | 4 (50.0%) | 0 (0.0%) |
| $25,000 to $29,999 | 0 (0.0%) | 4 (50.0%) |
| $30,000 to $34,999 | 0 (0.0%) | 0 (0.0%) |
| $35,000 to $39,999 | 1 (12.5%) | 0 (0.0%) |
| $40,000 to $44,999 | 0 (0.0%) | 0 (0.0%) |
| $45,000 to $49,999 | 0 (0.0%) | 0 (0.0%) |
| $50,000 to $54,999 | 0 (0.0%) | 0 (0.0%) |
| $55,000 to $64,999 | 0 (0.0%) | 0 (0.0%) |
| $65,000 to $74,999 | 0 (0.0%) | 0 (0.0%) |
| $75,000 to $99,999 | 0 (0.0%) | 0 (0.0%) |
| $100,000+ | 0 (0.0%) | 2 (25.0%) |
| Total | 8 (100.0%) | 8 (100.0%) |
Earnings by Sex by Educational Attainment in Chignik Lagoon
| Educational Attainment | Male Income | Female Income |
| Less than High School | - | - |
| High School Diploma | - | - |
| College or Associate's Degree | - | - |
| Bachelor's Degree | - | - |
| Graduate Degree | - | - |
| Total | $23,125 | $0 |
Family Income in Chignik Lagoon
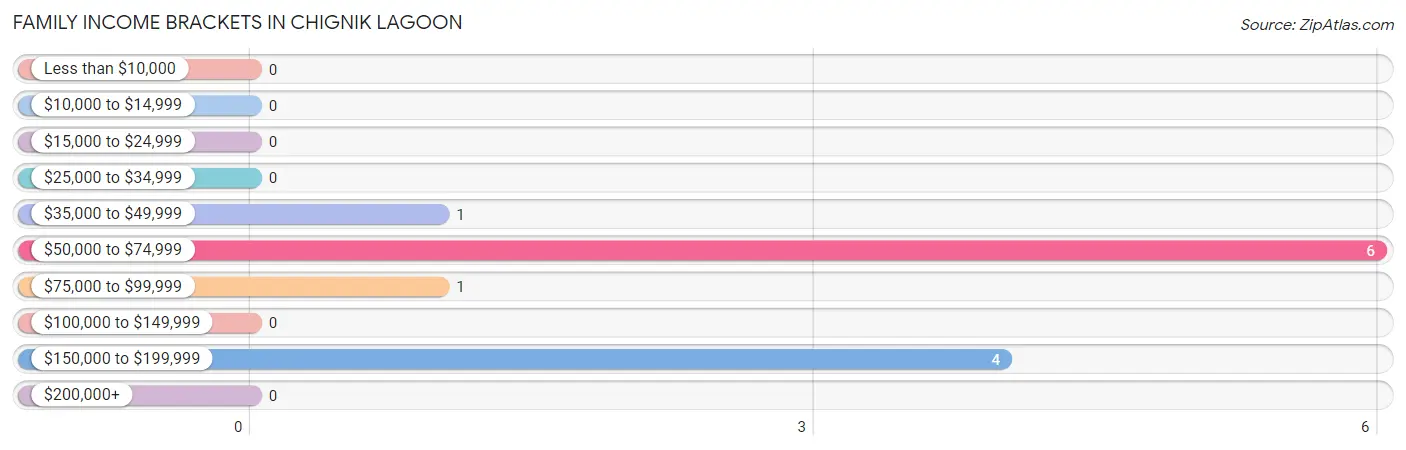
Family Income Brackets in Chignik Lagoon
According to the Chignik Lagoon family income data, there are 6 families falling into the $50,000 to $74,999 income range, which is the most common income bracket and makes up 50.0% of all families.
| Income Bracket | # Families | % Families |
| Less than $10,000 | 0 | 0.0% |
| $10,000 to $14,999 | 0 | 0.0% |
| $15,000 to $24,999 | 0 | 0.0% |
| $25,000 to $34,999 | 0 | 0.0% |
| $35,000 to $49,999 | 1 | 8.3% |
| $50,000 to $74,999 | 6 | 50.0% |
| $75,000 to $99,999 | 1 | 8.3% |
| $100,000 to $149,999 | 0 | 0.0% |
| $150,000 to $199,999 | 4 | 33.3% |
| $200,000+ | 0 | 0.0% |
Family Income by Famaliy Size in Chignik Lagoon
| Income Bracket | # Families | Median Income |
| 2-Person Families | 4 (33.3%) | $0 |
| 3-Person Families | 3 (25.0%) | $0 |
| 4-Person Families | 1 (8.3%) | $0 |
| 5-Person Families | 0 (0.0%) | $0 |
| 6-Person Families | 4 (33.3%) | $0 |
| 7+ Person Families | 0 (0.0%) | $0 |
| Total | 12 (100.0%) | $66,667 |
Family Income by Number of Earners in Chignik Lagoon
| Number of Earners | # Families | Median Income |
| No Earners | 3 (25.0%) | $0 |
| 1 Earner | 1 (8.3%) | $0 |
| 2 Earners | 8 (66.7%) | $0 |
| 3+ Earners | 0 (0.0%) | $0 |
| Total | 12 (100.0%) | $66,667 |
Household Income in Chignik Lagoon
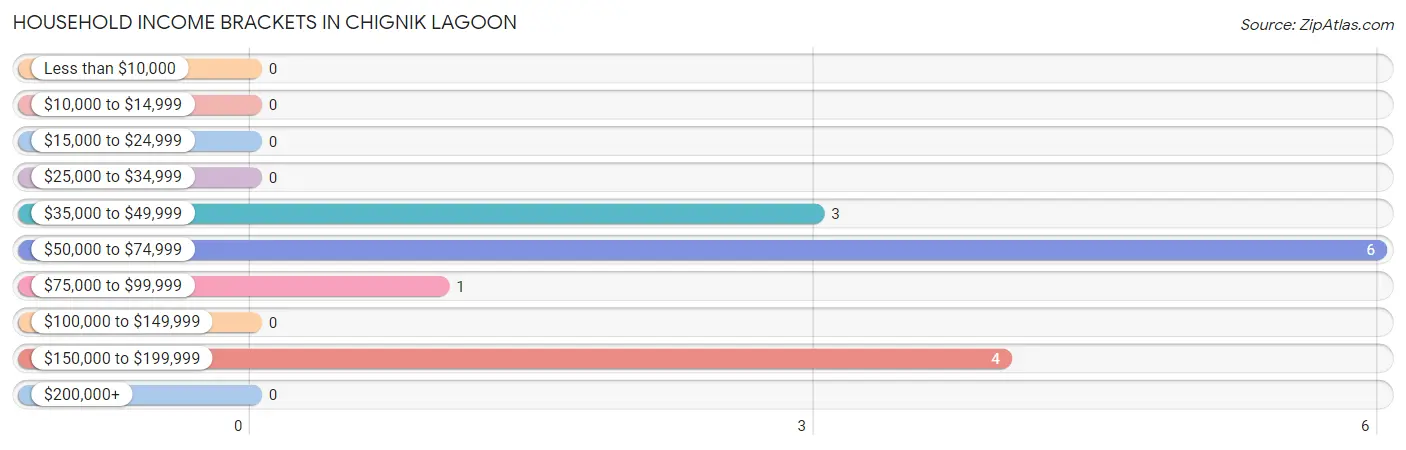
Household Income Brackets in Chignik Lagoon
With 6 households falling in the category, the $50,000 to $74,999 income range is the most frequent in Chignik Lagoon, accounting for 42.9% of all households.
| Income Bracket | # Households | % Households |
| Less than $10,000 | 0 | 0.0% |
| $10,000 to $14,999 | 0 | 0.0% |
| $15,000 to $24,999 | 0 | 0.0% |
| $25,000 to $34,999 | 0 | 0.0% |
| $35,000 to $49,999 | 3 | 21.4% |
| $50,000 to $74,999 | 6 | 42.9% |
| $75,000 to $99,999 | 1 | 7.1% |
| $100,000 to $149,999 | 0 | 0.0% |
| $150,000 to $199,999 | 4 | 28.6% |
| $200,000+ | 0 | 0.0% |
Household Income by Householder Age in Chignik Lagoon
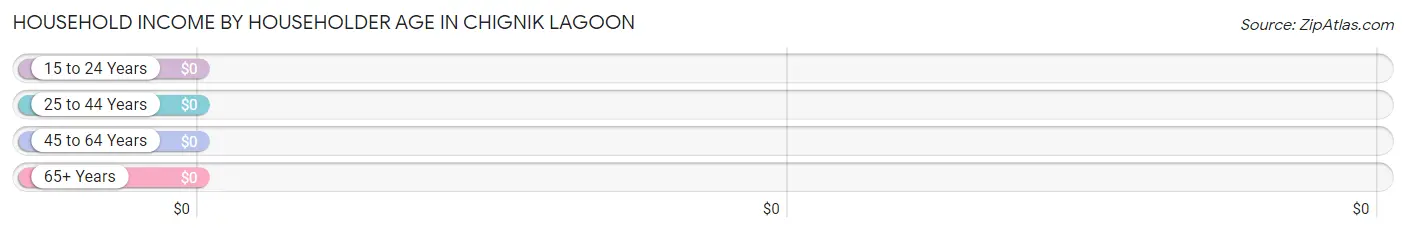
| Income Bracket | # Households | Median Income |
| 15 to 24 Years | 0 (0.0%) | $0 |
| 25 to 44 Years | 5 (35.7%) | $0 |
| 45 to 64 Years | 5 (35.7%) | $0 |
| 65+ Years | 4 (28.6%) | $0 |
| Total | 14 (100.0%) | $65,833 |
Poverty in Chignik Lagoon
Income Below Poverty by Sex and Age in Chignik Lagoon
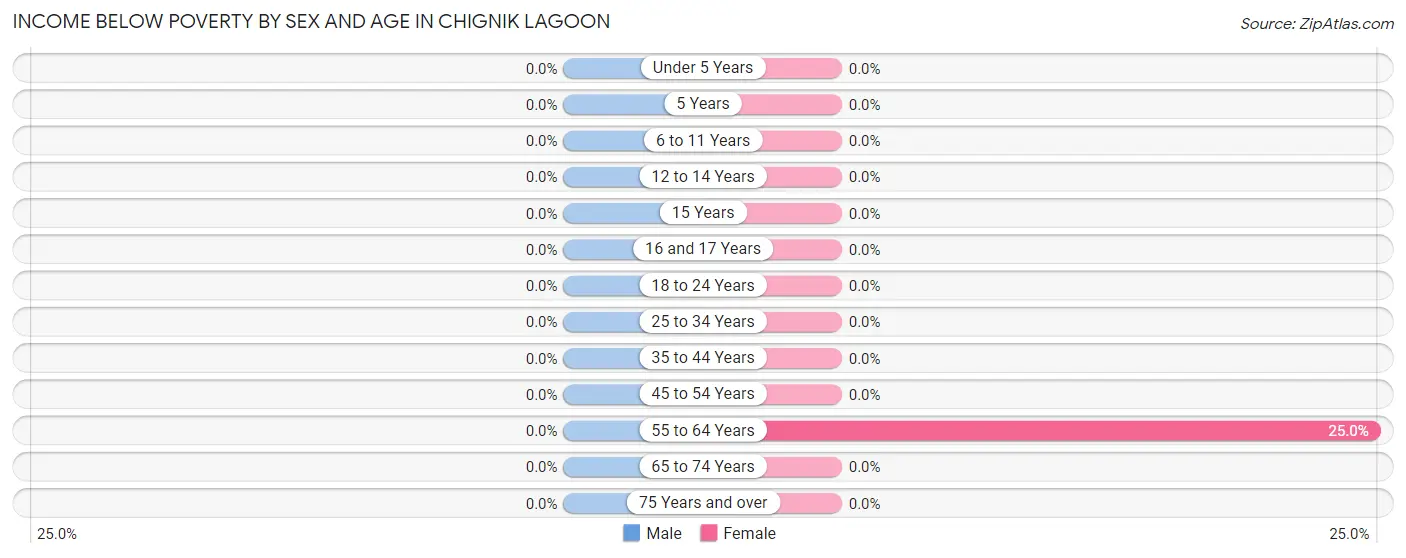
| Age Bracket | Male | Female |
| Under 5 Years | 0 (0.0%) | 0 (0.0%) |
| 5 Years | 0 (0.0%) | 0 (0.0%) |
| 6 to 11 Years | 0 (0.0%) | 0 (0.0%) |
| 12 to 14 Years | 0 (0.0%) | 0 (0.0%) |
| 15 Years | 0 (0.0%) | 0 (0.0%) |
| 16 and 17 Years | 0 (0.0%) | 0 (0.0%) |
| 18 to 24 Years | 0 (0.0%) | 0 (0.0%) |
| 25 to 34 Years | 0 (0.0%) | 0 (0.0%) |
| 35 to 44 Years | 0 (0.0%) | 0 (0.0%) |
| 45 to 54 Years | 0 (0.0%) | 0 (0.0%) |
| 55 to 64 Years | 0 (0.0%) | 2 (25.0%) |
| 65 to 74 Years | 0 (0.0%) | 0 (0.0%) |
| 75 Years and over | 0 (0.0%) | 0 (0.0%) |
| Total | 0 (0.0%) | 2 (8.0%) |
Income Above Poverty by Sex and Age in Chignik Lagoon
According to the poverty statistics in Chignik Lagoon, males aged 25 to 34 years and females aged under 5 years are the age groups that are most secure financially, with 100.0% of males and 100.0% of females in these age groups living above the poverty line.
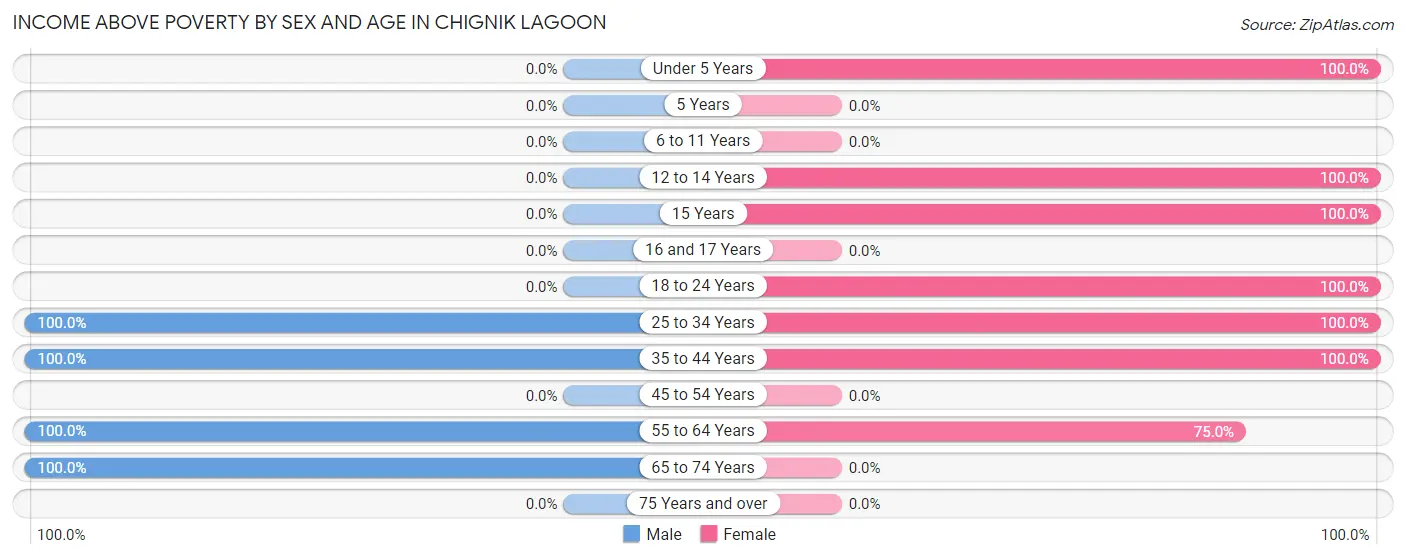
| Age Bracket | Male | Female |
| Under 5 Years | 0 (0.0%) | 5 (100.0%) |
| 5 Years | 0 (0.0%) | 0 (0.0%) |
| 6 to 11 Years | 0 (0.0%) | 0 (0.0%) |
| 12 to 14 Years | 0 (0.0%) | 2 (100.0%) |
| 15 Years | 0 (0.0%) | 2 (100.0%) |
| 16 and 17 Years | 0 (0.0%) | 0 (0.0%) |
| 18 to 24 Years | 0 (0.0%) | 4 (100.0%) |
| 25 to 34 Years | 3 (100.0%) | 2 (100.0%) |
| 35 to 44 Years | 4 (100.0%) | 2 (100.0%) |
| 45 to 54 Years | 0 (0.0%) | 0 (0.0%) |
| 55 to 64 Years | 2 (100.0%) | 6 (75.0%) |
| 65 to 74 Years | 5 (100.0%) | 0 (0.0%) |
| 75 Years and over | 0 (0.0%) | 0 (0.0%) |
| Total | 14 (100.0%) | 23 (92.0%) |
Income Below Poverty Among Married-Couple Families in Chignik Lagoon
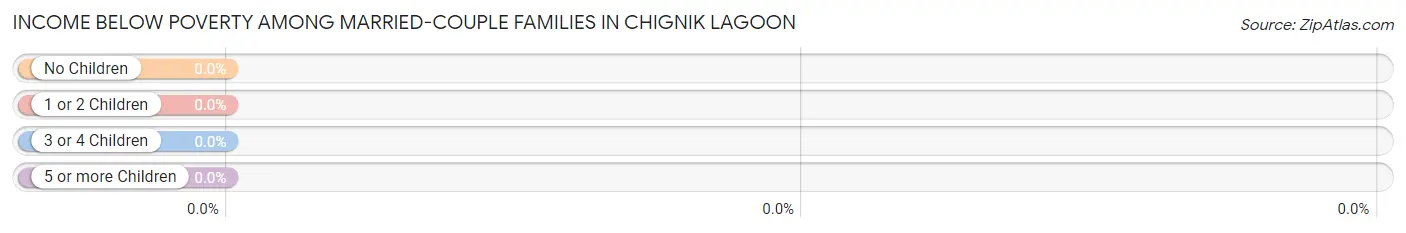
| Children | Above Poverty | Below Poverty |
| No Children | 7 (100.0%) | 0 (0.0%) |
| 1 or 2 Children | 1 (100.0%) | 0 (0.0%) |
| 3 or 4 Children | 4 (100.0%) | 0 (0.0%) |
| 5 or more Children | 0 (0.0%) | 0 (0.0%) |
| Total | 12 (100.0%) | 0 (0.0%) |
Income Below Poverty Among Single-Parent Households in Chignik Lagoon
| Children | Single Father | Single Mother |
| No Children | 0 (0.0%) | 0 (0.0%) |
| 1 or 2 Children | 0 (0.0%) | 0 (0.0%) |
| 3 or 4 Children | 0 (0.0%) | 0 (0.0%) |
| 5 or more Children | 0 (0.0%) | 0 (0.0%) |
| Total | 0 (0.0%) | 0 (0.0%) |
Income Below Poverty Among Married-Couple vs Single-Parent Households in Chignik Lagoon
| Children | Married-Couple Families | Single-Parent Households |
| No Children | 0 (0.0%) | 0 (0.0%) |
| 1 or 2 Children | 0 (0.0%) | 0 (0.0%) |
| 3 or 4 Children | 0 (0.0%) | 0 (0.0%) |
| 5 or more Children | 0 (0.0%) | 0 (0.0%) |
| Total | 0 (0.0%) | 0 (0.0%) |
Race in Chignik Lagoon
The most populous races in Chignik Lagoon are Native / Alaskan (26 | 66.7%), Two or more Races (7 | 17.9%), and White / Caucasian (6 | 15.4%).
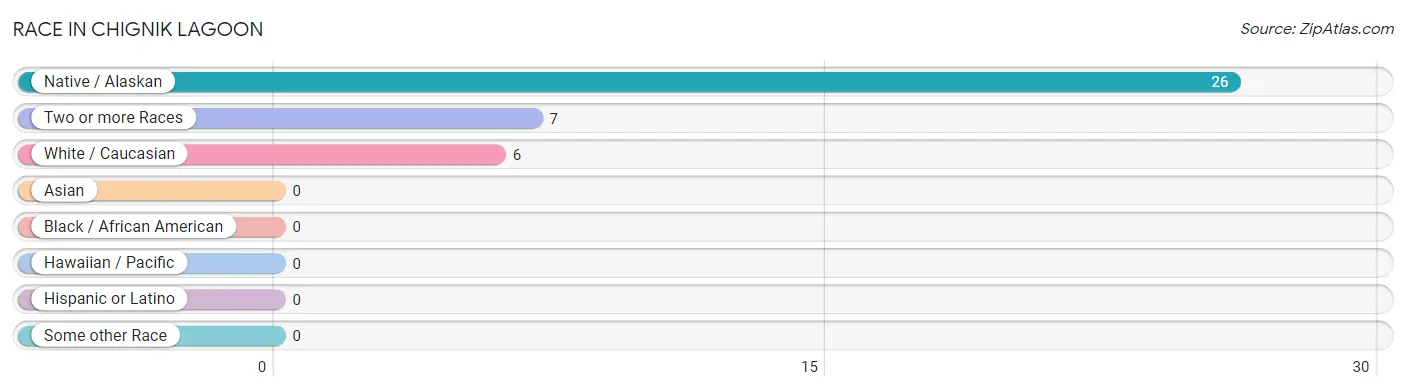
| Race | # Population | % Population |
| Asian | 0 | 0.0% |
| Black / African American | 0 | 0.0% |
| Hawaiian / Pacific | 0 | 0.0% |
| Hispanic or Latino | 0 | 0.0% |
| Native / Alaskan | 26 | 66.7% |
| White / Caucasian | 6 | 15.4% |
| Two or more Races | 7 | 17.9% |
| Some other Race | 0 | 0.0% |
| Total | 39 | 100.0% |
Ancestry in Chignik Lagoon
The most populous ancestries reported in Chignik Lagoon are Aleut (22 | 56.4%), Alaskan Athabascan (11 | 28.2%), German (5 | 12.8%), Irish (2 | 5.1%), and Italian (2 | 5.1%), together accounting for 107.7% of all Chignik Lagoon residents.
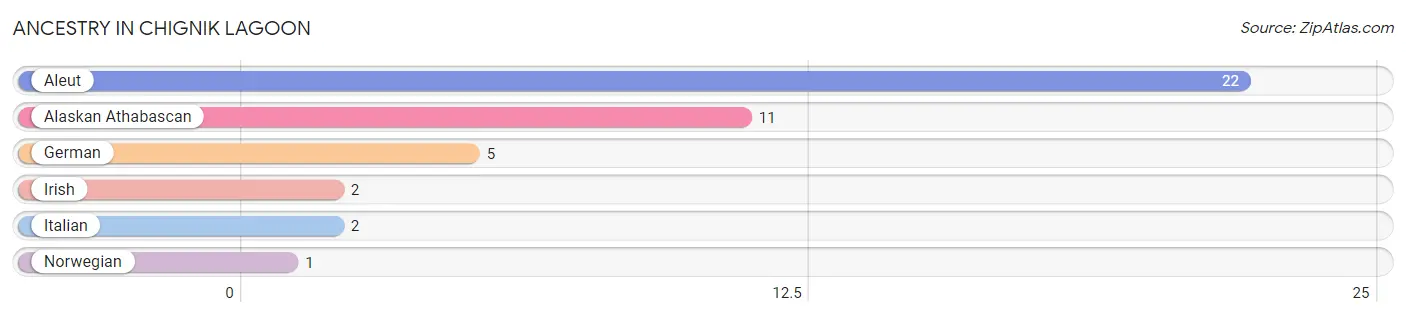
| Ancestry | # Population | % Population |
| Alaskan Athabascan | 11 | 28.2% |
| Aleut | 22 | 56.4% |
| German | 5 | 12.8% |
| Irish | 2 | 5.1% |
| Italian | 2 | 5.1% |
| Norwegian | 1 | 2.6% | View All 6 Rows |
Immigrants in Chignik Lagoon

| Immigration Origin | # Population | % Population | View All 0 Rows |
Sex and Age in Chignik Lagoon
Sex and Age in Chignik Lagoon
The most populous age groups in Chignik Lagoon are 65 to 69 Years (5 | 35.7%) for men and 15 to 19 Years (6 | 24.0%) for women.
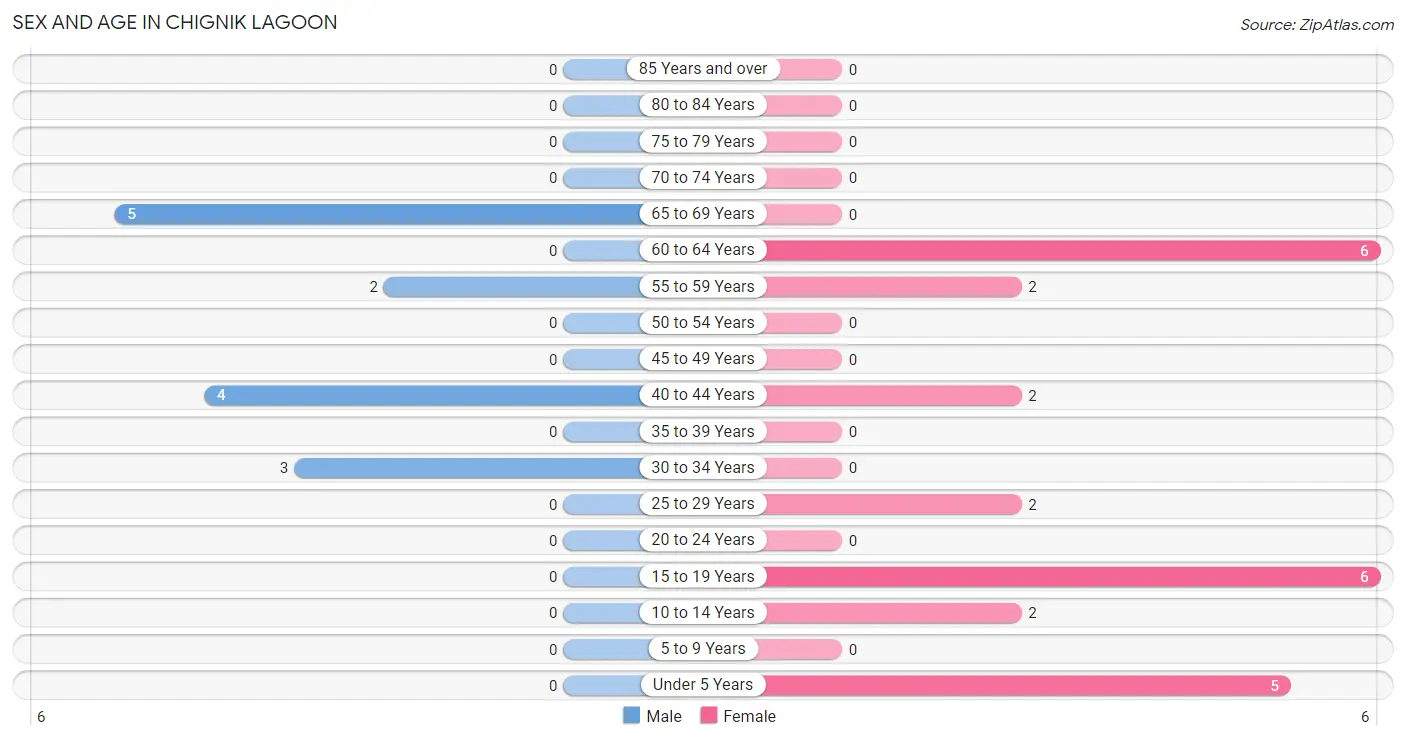
| Age Bracket | Male | Female |
| Under 5 Years | 0 (0.0%) | 5 (20.0%) |
| 5 to 9 Years | 0 (0.0%) | 0 (0.0%) |
| 10 to 14 Years | 0 (0.0%) | 2 (8.0%) |
| 15 to 19 Years | 0 (0.0%) | 6 (24.0%) |
| 20 to 24 Years | 0 (0.0%) | 0 (0.0%) |
| 25 to 29 Years | 0 (0.0%) | 2 (8.0%) |
| 30 to 34 Years | 3 (21.4%) | 0 (0.0%) |
| 35 to 39 Years | 0 (0.0%) | 0 (0.0%) |
| 40 to 44 Years | 4 (28.6%) | 2 (8.0%) |
| 45 to 49 Years | 0 (0.0%) | 0 (0.0%) |
| 50 to 54 Years | 0 (0.0%) | 0 (0.0%) |
| 55 to 59 Years | 2 (14.3%) | 2 (8.0%) |
| 60 to 64 Years | 0 (0.0%) | 6 (24.0%) |
| 65 to 69 Years | 5 (35.7%) | 0 (0.0%) |
| 70 to 74 Years | 0 (0.0%) | 0 (0.0%) |
| 75 to 79 Years | 0 (0.0%) | 0 (0.0%) |
| 80 to 84 Years | 0 (0.0%) | 0 (0.0%) |
| 85 Years and over | 0 (0.0%) | 0 (0.0%) |
| Total | 14 (100.0%) | 25 (100.0%) |
Families and Households in Chignik Lagoon
Median Family Size in Chignik Lagoon
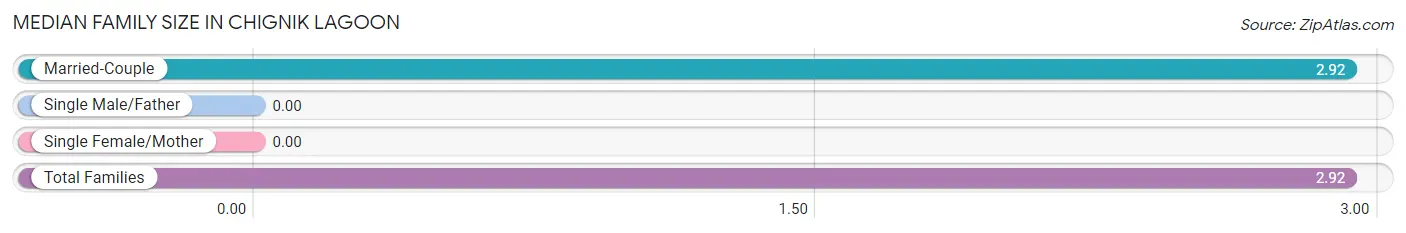
| Family Type | # Families | Family Size |
| Married-Couple | 12 (100.0%) | 2.92 |
| Single Male/Father | 0 (0.0%) | - |
| Single Female/Mother | 0 (0.0%) | - |
| Total Families | 12 (100.0%) | 2.92 |
Median Household Size in Chignik Lagoon
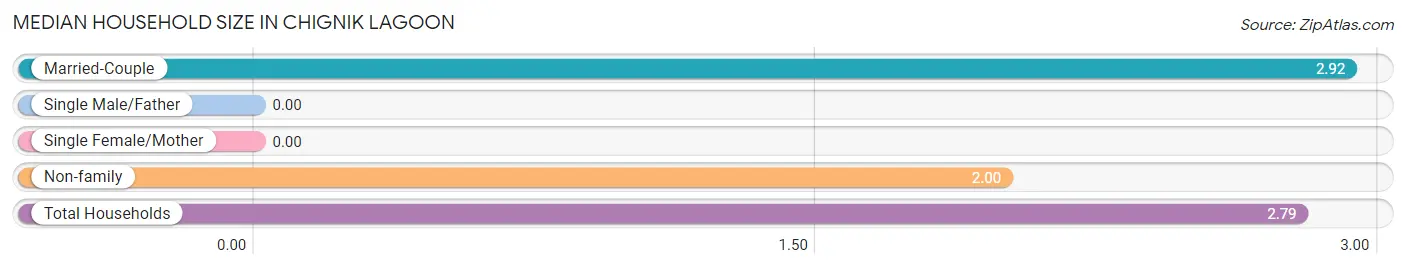
| Household Type | # Households | Household Size |
| Married-Couple | 12 (85.7%) | 2.92 |
| Single Male/Father | 0 (0.0%) | - |
| Single Female/Mother | 0 (0.0%) | - |
| Non-family | 2 (14.3%) | 2.00 |
| Total Households | 14 (100.0%) | 2.79 |
Household Size by Marriage Status in Chignik Lagoon
Out of a total of 14 households in Chignik Lagoon, 12 (85.7%) are family households, while 2 (14.3%) are nonfamily households. The most numerous type of family households are 2-person households, comprising 4, and the most common type of nonfamily households are 2-person households, comprising 2.
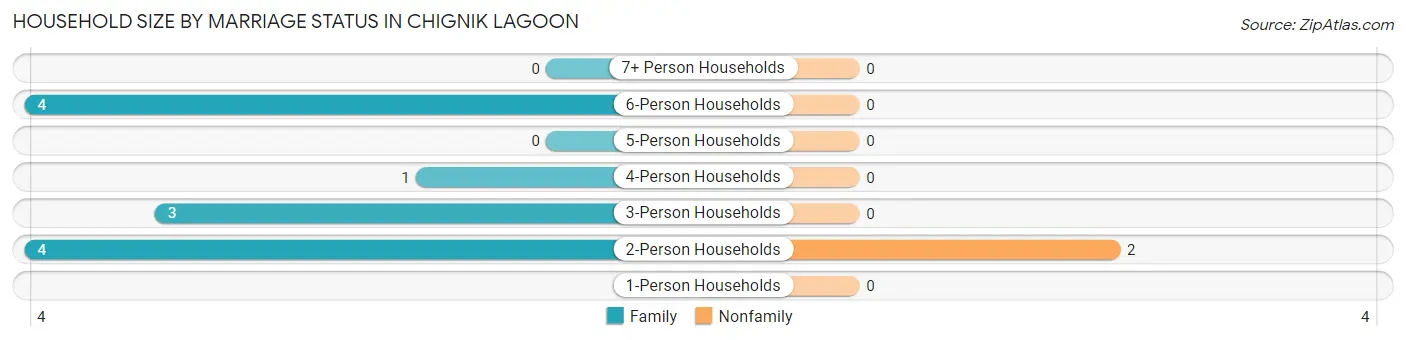
| Household Size | Family Households | Nonfamily Households |
| 1-Person Households | - | 0 (0.0%) |
| 2-Person Households | 4 (28.6%) | 2 (14.3%) |
| 3-Person Households | 3 (21.4%) | 0 (0.0%) |
| 4-Person Households | 1 (7.1%) | 0 (0.0%) |
| 5-Person Households | 0 (0.0%) | 0 (0.0%) |
| 6-Person Households | 4 (28.6%) | 0 (0.0%) |
| 7+ Person Households | 0 (0.0%) | 0 (0.0%) |
| Total | 12 (85.7%) | 2 (14.3%) |
Female Fertility in Chignik Lagoon
Fertility by Age in Chignik Lagoon
Average fertility rate in Chignik Lagoon is 200.0 births per 1,000 women. Women in the age bracket of 20 to 34 years have the highest fertility rate with 1,000.0 births per 1,000 women. Women in the age bracket of 20 to 34 years acount for 100.0% of all women with births.
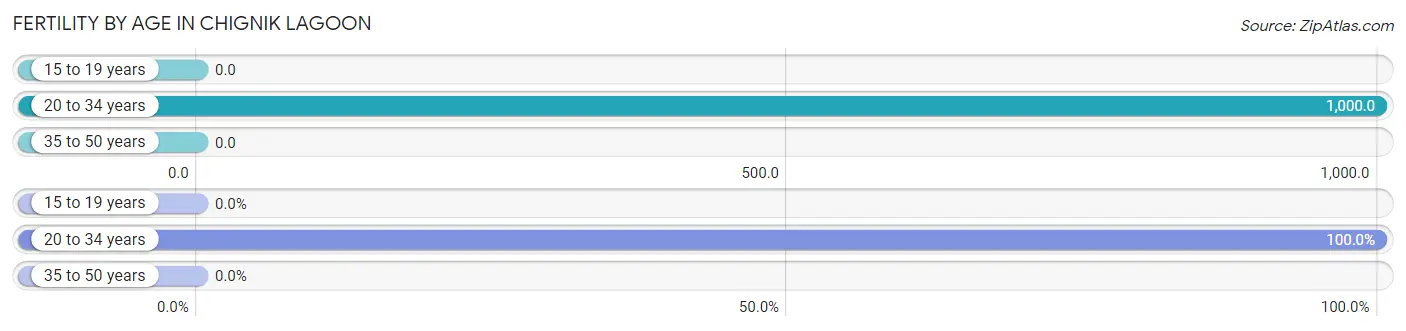
| Age Bracket | Women with Births | Births / 1,000 Women |
| 15 to 19 years | 0 (0.0%) | 0.0 |
| 20 to 34 years | 2 (100.0%) | 1,000.0 |
| 35 to 50 years | 0 (0.0%) | 0.0 |
| Total | 2 (100.0%) | 200.0 |
Fertility by Age by Marriage Status in Chignik Lagoon
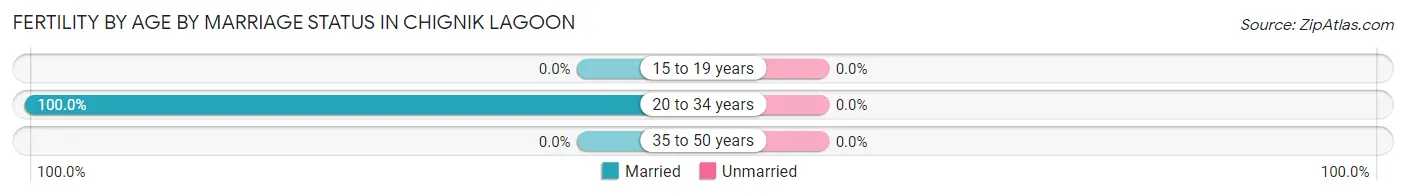
| Age Bracket | Married | Unmarried |
| 15 to 19 years | 0 (0.0%) | 0 (0.0%) |
| 20 to 34 years | 2 (100.0%) | 0 (0.0%) |
| 35 to 50 years | 0 (0.0%) | 0 (0.0%) |
| Total | 2 (100.0%) | 0 (0.0%) |
Fertility by Education in Chignik Lagoon
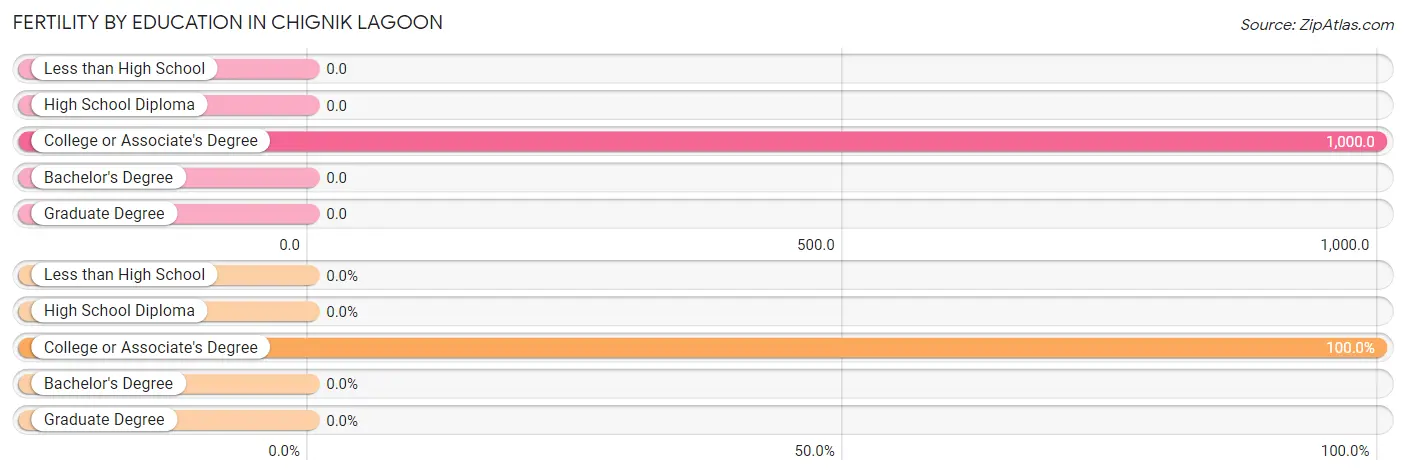
| Educational Attainment | Women with Births | Births / 1,000 Women |
| Less than High School | 0 (0.0%) | 0.0 |
| High School Diploma | 0 (0.0%) | 0.0 |
| College or Associate's Degree | 2 (100.0%) | 1,000.0 |
| Bachelor's Degree | 0 (0.0%) | 0.0 |
| Graduate Degree | 0 (0.0%) | 0.0 |
| Total | 2 (100.0%) | 200.0 |
Fertility by Education by Marriage Status in Chignik Lagoon
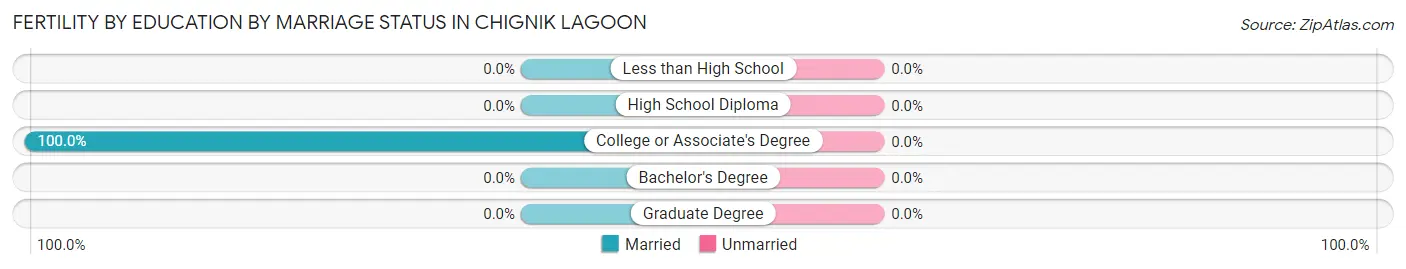
| Educational Attainment | Married | Unmarried |
| Less than High School | 0 (0.0%) | 0 (0.0%) |
| High School Diploma | 0 (0.0%) | 0 (0.0%) |
| College or Associate's Degree | 2 (100.0%) | 0 (0.0%) |
| Bachelor's Degree | 0 (0.0%) | 0 (0.0%) |
| Graduate Degree | 0 (0.0%) | 0 (0.0%) |
| Total | 2 (100.0%) | 0 (0.0%) |
Employment Characteristics in Chignik Lagoon
Employment by Class of Employer in Chignik Lagoon
Among the 14 employed individuals in Chignik Lagoon, local government employees (5 | 35.7%), federal government employees (4 | 28.6%), and state government employees (3 | 21.4%) make up the most common classes of employment.
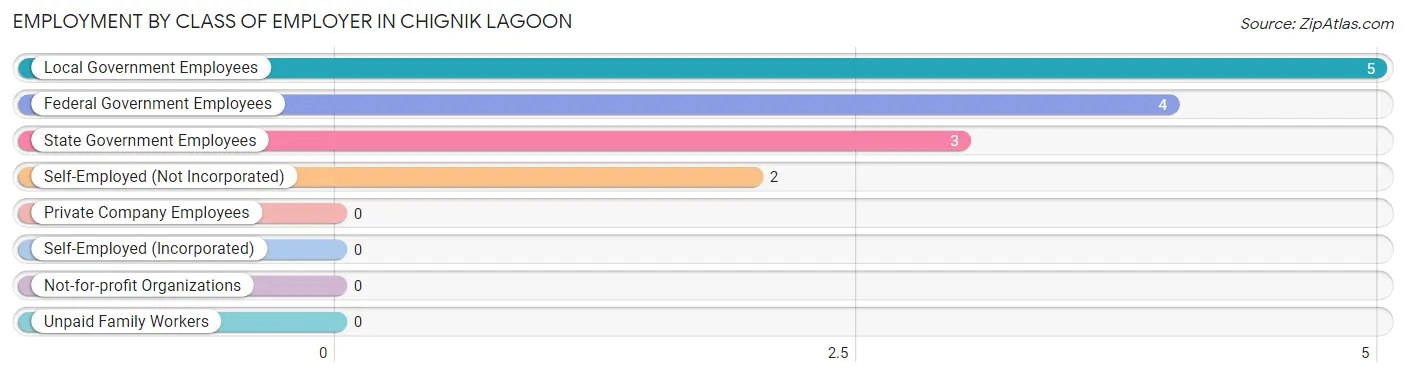
| Employer Class | # Employees | % Employees |
| Private Company Employees | 0 | 0.0% |
| Self-Employed (Incorporated) | 0 | 0.0% |
| Self-Employed (Not Incorporated) | 2 | 14.3% |
| Not-for-profit Organizations | 0 | 0.0% |
| Local Government Employees | 5 | 35.7% |
| State Government Employees | 3 | 21.4% |
| Federal Government Employees | 4 | 28.6% |
| Unpaid Family Workers | 0 | 0.0% |
| Total | 14 | 100.0% |
Employment Status by Age in Chignik Lagoon
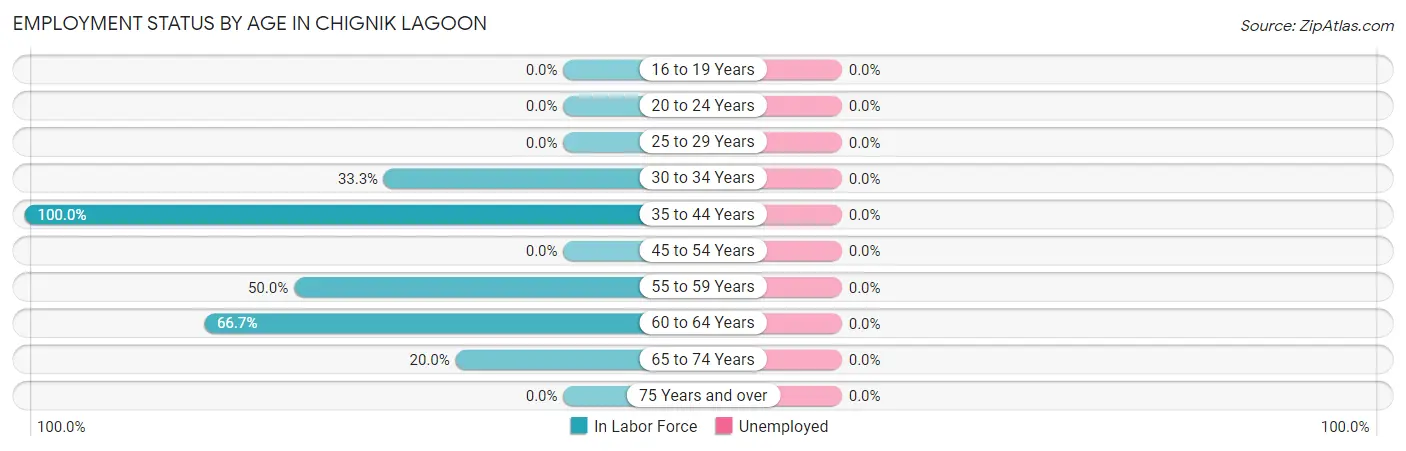
| Age Bracket | In Labor Force | Unemployed |
| 16 to 19 Years | 0 (0.0%) | 0 (0.0%) |
| 20 to 24 Years | 0 (0.0%) | 0 (0.0%) |
| 25 to 29 Years | 0 (0.0%) | 0 (0.0%) |
| 30 to 34 Years | 1 (33.3%) | 0 (0.0%) |
| 35 to 44 Years | 6 (100.0%) | 0 (0.0%) |
| 45 to 54 Years | 0 (0.0%) | 0 (0.0%) |
| 55 to 59 Years | 2 (50.0%) | 0 (0.0%) |
| 60 to 64 Years | 4 (66.7%) | 0 (0.0%) |
| 65 to 74 Years | 1 (20.0%) | 0 (0.0%) |
| 75 Years and over | 0 (0.0%) | 0 (0.0%) |
| Total | 14 (46.7%) | 0 (0.0%) |
Employment Status by Educational Attainment in Chignik Lagoon
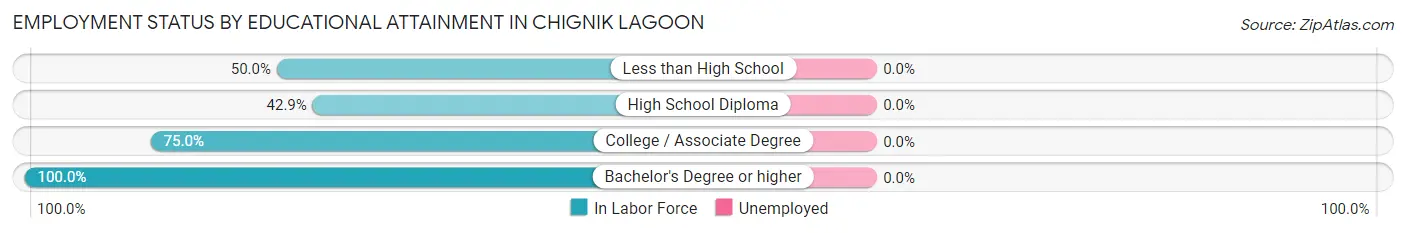
| Educational Attainment | In Labor Force | Unemployed |
| Less than High School | 2 (50.0%) | 0 (0.0%) |
| High School Diploma | 3 (42.9%) | 0 (0.0%) |
| College / Associate Degree | 6 (75.0%) | 0 (0.0%) |
| Bachelor's Degree or higher | 2 (100.0%) | 0 (0.0%) |
| Total | 13 (61.9%) | 0 (0.0%) |
Employment Occupations by Sex in Chignik Lagoon
Management, Business, Science and Arts Occupations
The most common Management, Business, Science and Arts occupations in Chignik Lagoon are Management (5 | 35.7%), Community & Social Service (2 | 14.3%), and Education Instruction & Library (2 | 14.3%).
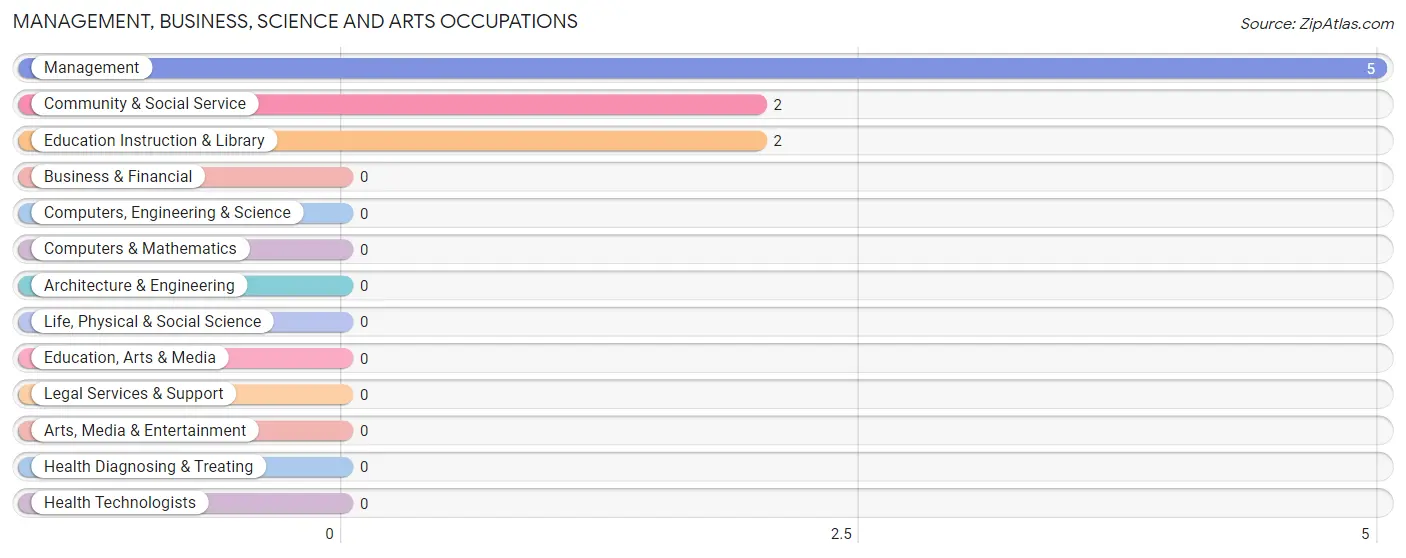
Management, Business, Science and Arts Occupations by Sex
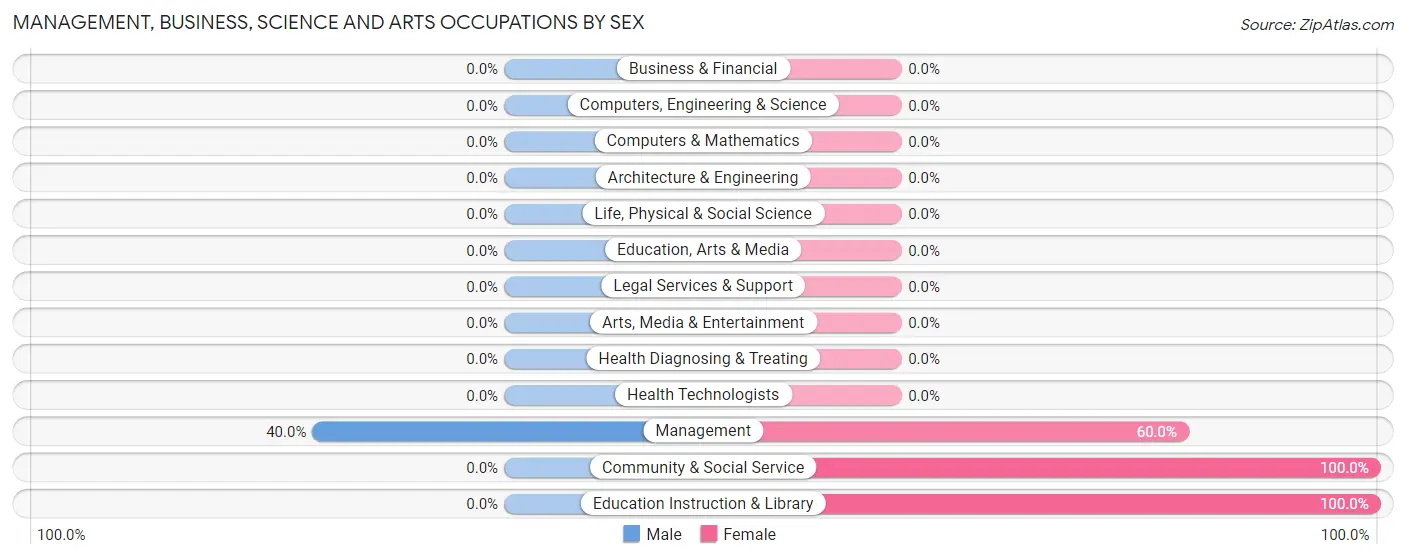
| Occupation | Male | Female |
| Management | 2 (40.0%) | 3 (60.0%) |
| Business & Financial | 0 (0.0%) | 0 (0.0%) |
| Computers, Engineering & Science | 0 (0.0%) | 0 (0.0%) |
| Computers & Mathematics | 0 (0.0%) | 0 (0.0%) |
| Architecture & Engineering | 0 (0.0%) | 0 (0.0%) |
| Life, Physical & Social Science | 0 (0.0%) | 0 (0.0%) |
| Community & Social Service | 0 (0.0%) | 2 (100.0%) |
| Education, Arts & Media | 0 (0.0%) | 0 (0.0%) |
| Legal Services & Support | 0 (0.0%) | 0 (0.0%) |
| Education Instruction & Library | 0 (0.0%) | 2 (100.0%) |
| Arts, Media & Entertainment | 0 (0.0%) | 0 (0.0%) |
| Health Diagnosing & Treating | 0 (0.0%) | 0 (0.0%) |
| Health Technologists | 0 (0.0%) | 0 (0.0%) |
| Total (Category) | 2 (28.6%) | 5 (71.4%) |
| Total (Overall) | 8 (57.1%) | 6 (42.9%) |
Services Occupations
The most common Services occupations in Chignik Lagoon are , and Healthcare Support (1 | 7.1%).
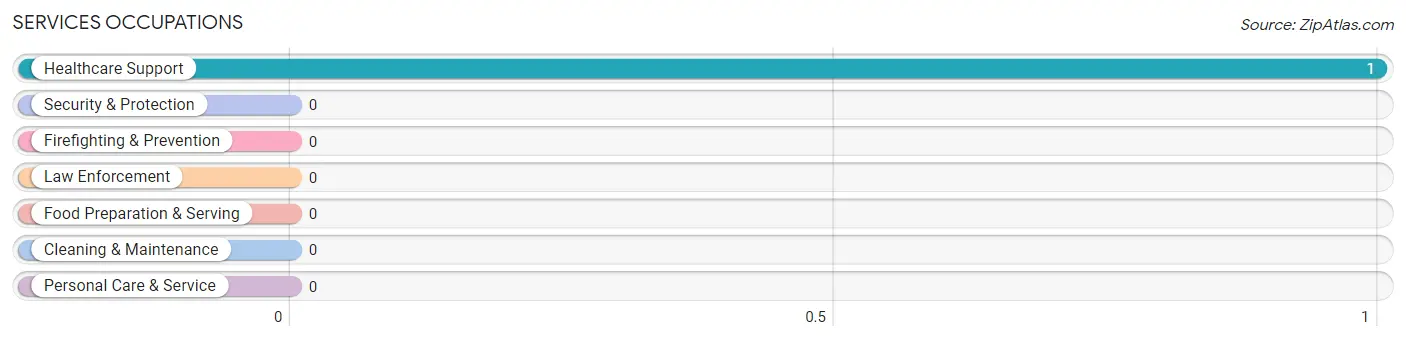
Services Occupations by Sex
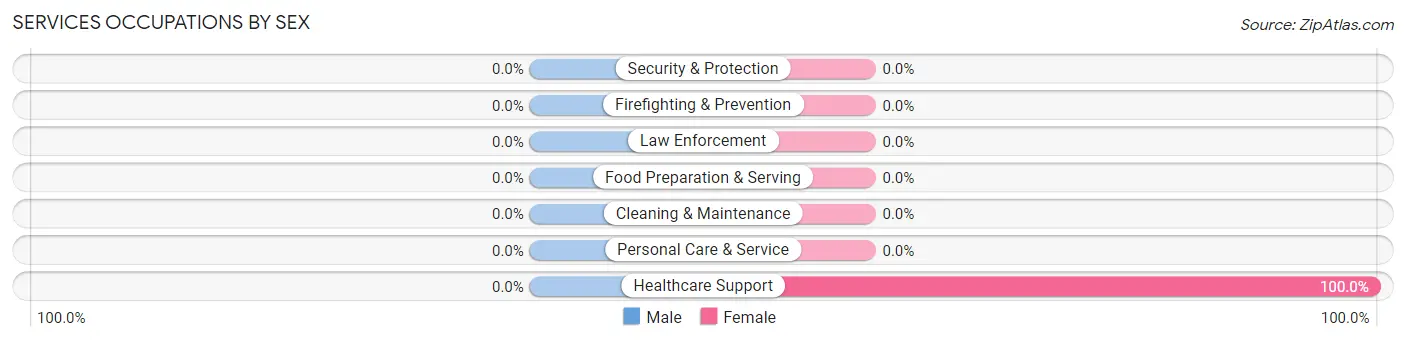
| Occupation | Male | Female |
| Healthcare Support | 0 (0.0%) | 1 (100.0%) |
| Security & Protection | 0 (0.0%) | 0 (0.0%) |
| Firefighting & Prevention | 0 (0.0%) | 0 (0.0%) |
| Law Enforcement | 0 (0.0%) | 0 (0.0%) |
| Food Preparation & Serving | 0 (0.0%) | 0 (0.0%) |
| Cleaning & Maintenance | 0 (0.0%) | 0 (0.0%) |
| Personal Care & Service | 0 (0.0%) | 0 (0.0%) |
| Total (Category) | 0 (0.0%) | 1 (100.0%) |
| Total (Overall) | 8 (57.1%) | 6 (42.9%) |
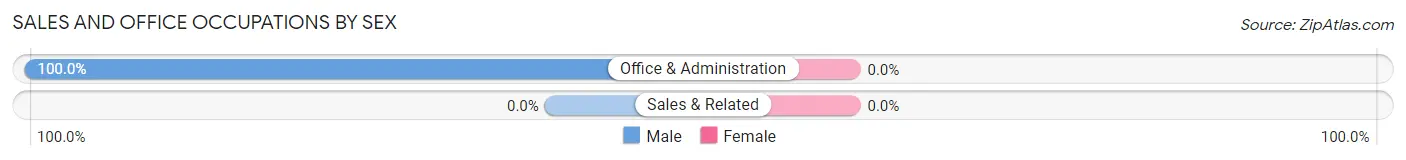
Sales and Office Occupations
The most common Sales and Office occupations in Chignik Lagoon are , and Office & Administration (4 | 28.6%).
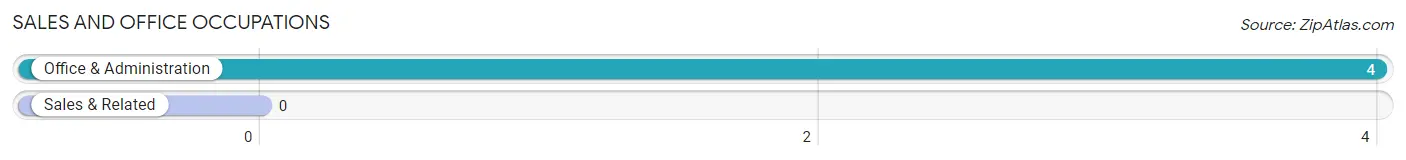
Sales and Office Occupations by Sex
| Occupation | Male | Female |
| Sales & Related | 0 (0.0%) | 0 (0.0%) |
| Office & Administration | 4 (100.0%) | 0 (0.0%) |
| Total (Category) | 4 (100.0%) | 0 (0.0%) |
| Total (Overall) | 8 (57.1%) | 6 (42.9%) |
Natural Resources, Construction and Maintenance Occupations
The most common Natural Resources, Construction and Maintenance occupations in Chignik Lagoon are , and Installation, Maintenance & Repair (1 | 7.1%).
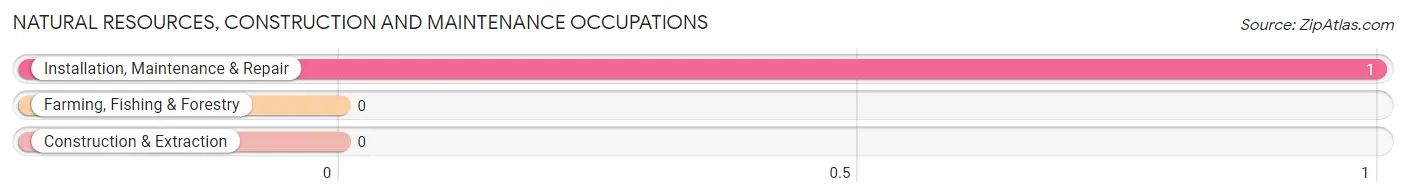
Natural Resources, Construction and Maintenance Occupations by Sex
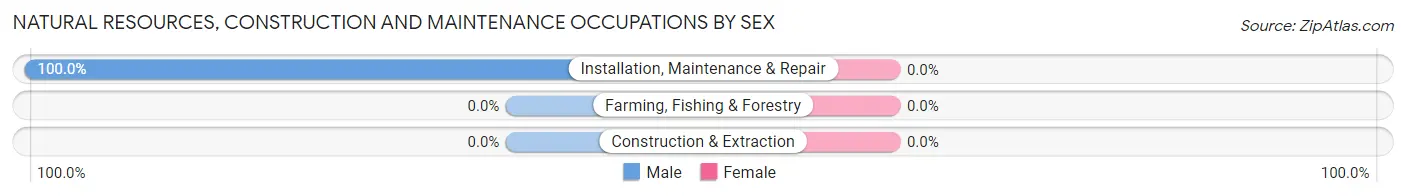
| Occupation | Male | Female |
| Farming, Fishing & Forestry | 0 (0.0%) | 0 (0.0%) |
| Construction & Extraction | 0 (0.0%) | 0 (0.0%) |
| Installation, Maintenance & Repair | 1 (100.0%) | 0 (0.0%) |
| Total (Category) | 1 (100.0%) | 0 (0.0%) |
| Total (Overall) | 8 (57.1%) | 6 (42.9%) |
Production, Transportation and Moving Occupations
The most common Production, Transportation and Moving occupations in Chignik Lagoon are , and Transportation (1 | 7.1%).
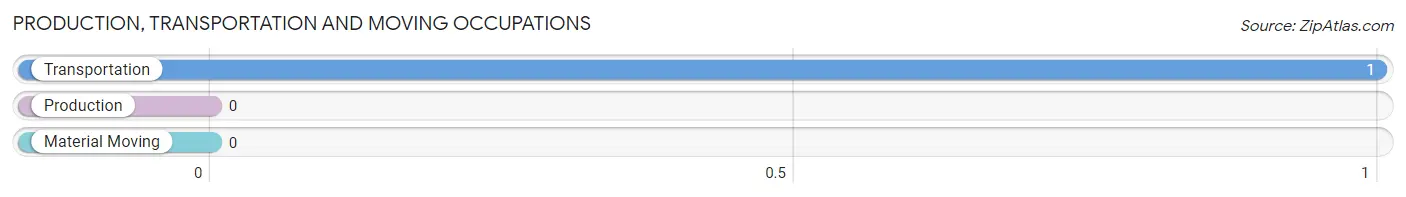
Production, Transportation and Moving Occupations by Sex
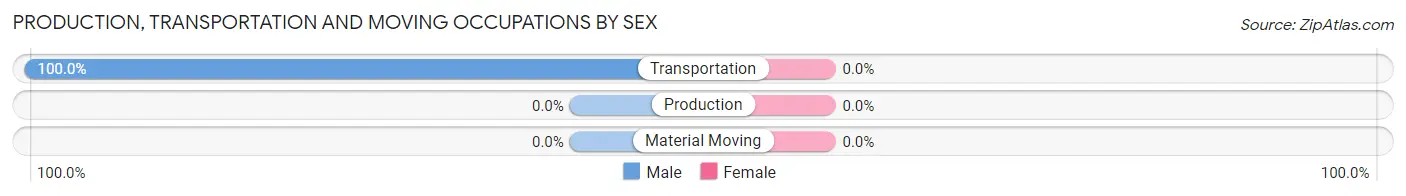
| Occupation | Male | Female |
| Production | 0 (0.0%) | 0 (0.0%) |
| Transportation | 1 (100.0%) | 0 (0.0%) |
| Material Moving | 0 (0.0%) | 0 (0.0%) |
| Total (Category) | 1 (100.0%) | 0 (0.0%) |
| Total (Overall) | 8 (57.1%) | 6 (42.9%) |
Employment Industries by Sex in Chignik Lagoon
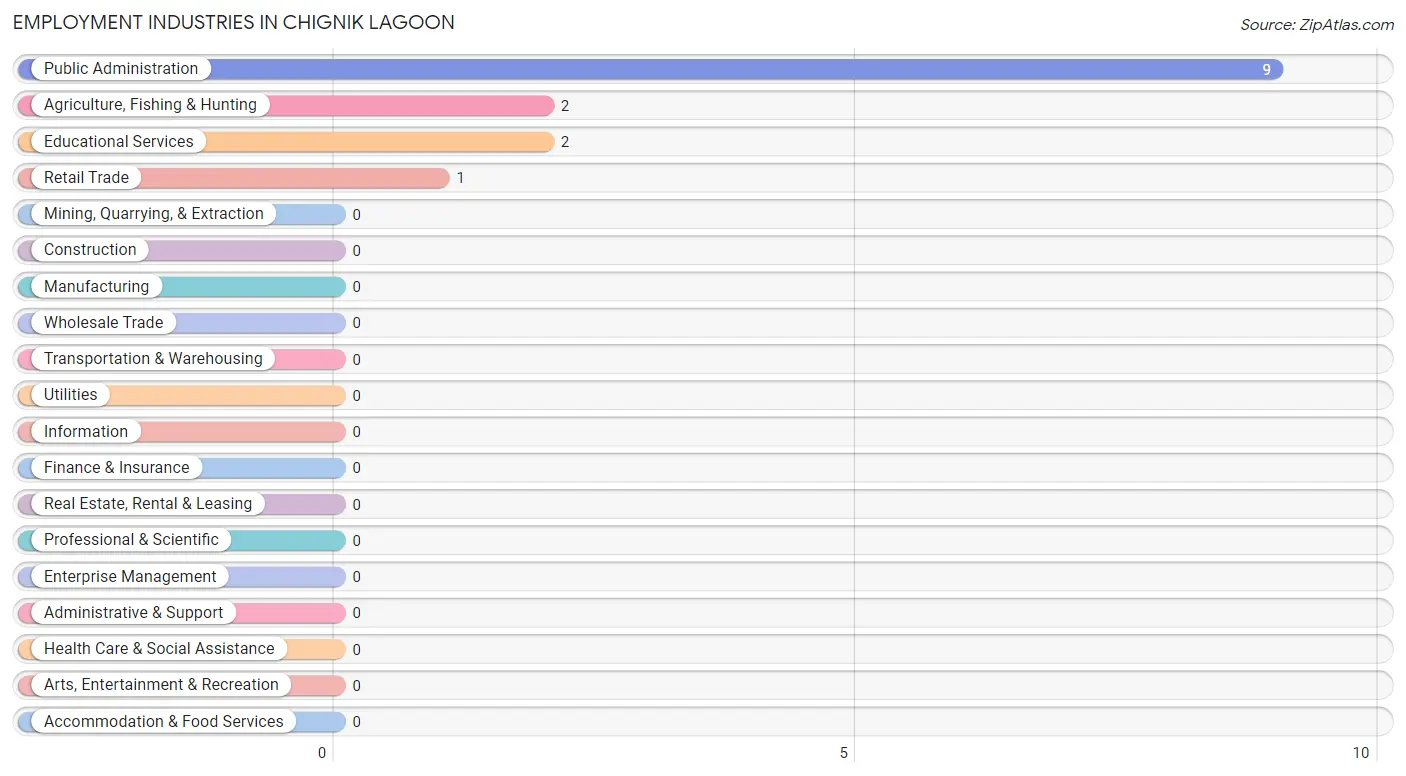
Employment Industries in Chignik Lagoon
The major employment industries in Chignik Lagoon include Public Administration (9 | 64.3%), Agriculture, Fishing & Hunting (2 | 14.3%), Educational Services (2 | 14.3%), and Retail Trade (1 | 7.1%).
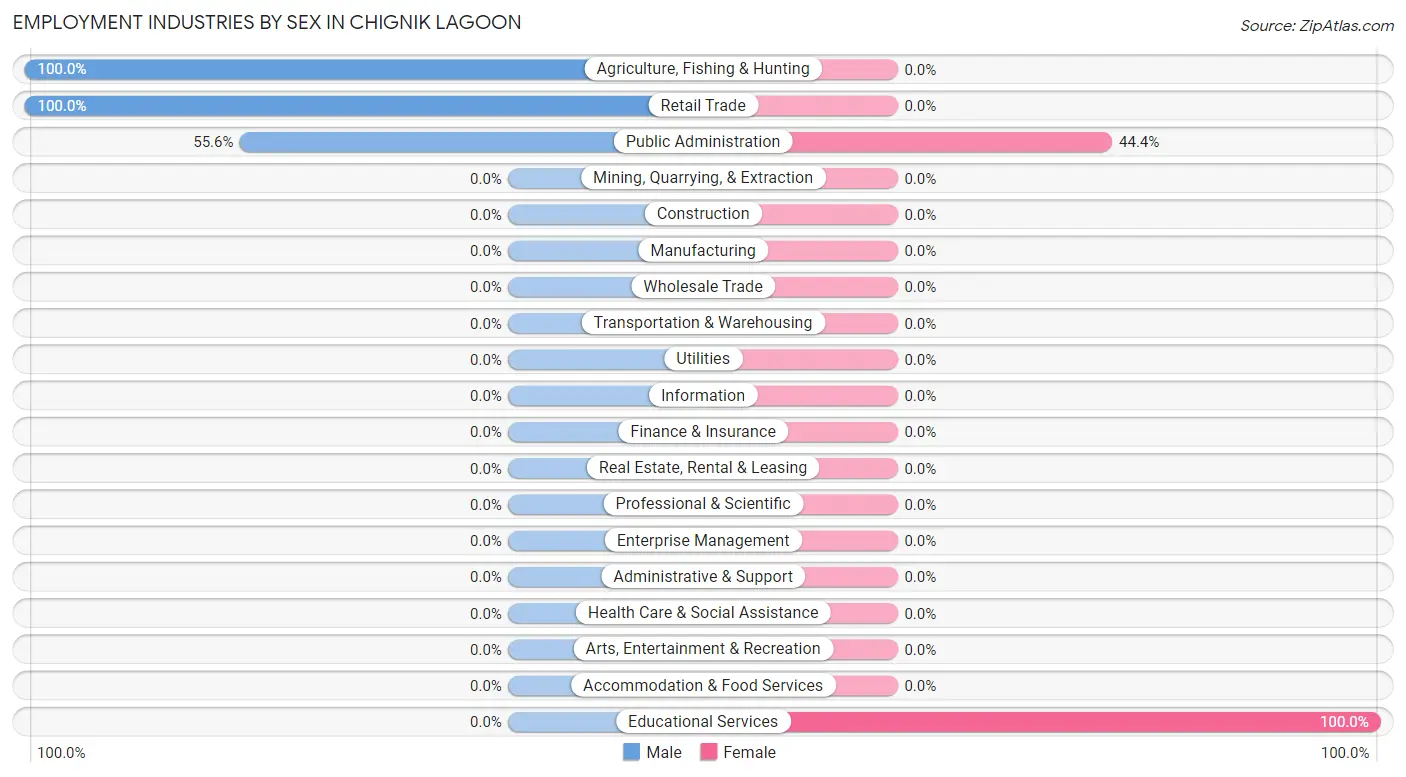
Employment Industries by Sex in Chignik Lagoon
The Chignik Lagoon industries that see more men than women are Agriculture, Fishing & Hunting (100.0%), Retail Trade (100.0%), and Public Administration (55.6%), whereas the industries that tend to have a higher number of women are Educational Services (100.0%), and Public Administration (44.4%).
| Industry | Male | Female |
| Agriculture, Fishing & Hunting | 2 (100.0%) | 0 (0.0%) |
| Mining, Quarrying, & Extraction | 0 (0.0%) | 0 (0.0%) |
| Construction | 0 (0.0%) | 0 (0.0%) |
| Manufacturing | 0 (0.0%) | 0 (0.0%) |
| Wholesale Trade | 0 (0.0%) | 0 (0.0%) |
| Retail Trade | 1 (100.0%) | 0 (0.0%) |
| Transportation & Warehousing | 0 (0.0%) | 0 (0.0%) |
| Utilities | 0 (0.0%) | 0 (0.0%) |
| Information | 0 (0.0%) | 0 (0.0%) |
| Finance & Insurance | 0 (0.0%) | 0 (0.0%) |
| Real Estate, Rental & Leasing | 0 (0.0%) | 0 (0.0%) |
| Professional & Scientific | 0 (0.0%) | 0 (0.0%) |
| Enterprise Management | 0 (0.0%) | 0 (0.0%) |
| Administrative & Support | 0 (0.0%) | 0 (0.0%) |
| Educational Services | 0 (0.0%) | 2 (100.0%) |
| Health Care & Social Assistance | 0 (0.0%) | 0 (0.0%) |
| Arts, Entertainment & Recreation | 0 (0.0%) | 0 (0.0%) |
| Accommodation & Food Services | 0 (0.0%) | 0 (0.0%) |
| Public Administration | 5 (55.6%) | 4 (44.4%) |
| Total | 8 (57.1%) | 6 (42.9%) |
Education in Chignik Lagoon
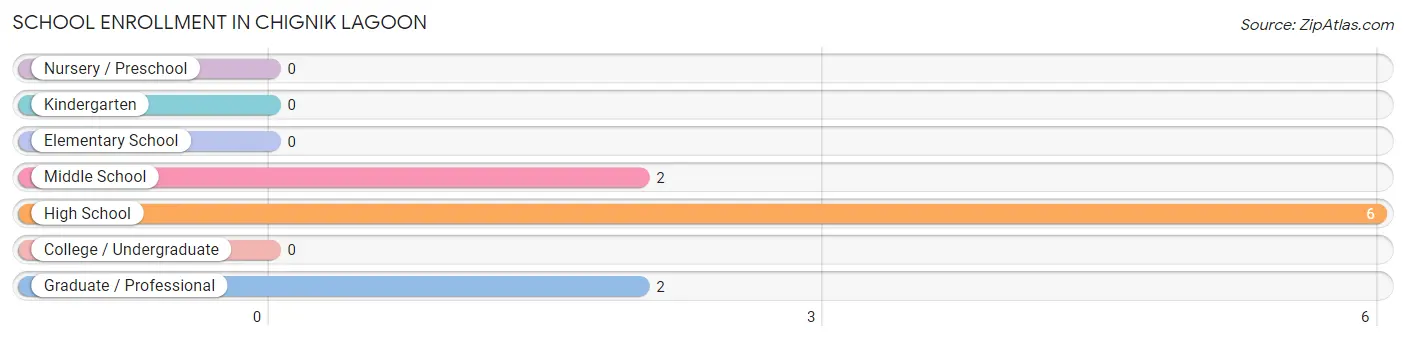
School Enrollment in Chignik Lagoon
The most common levels of schooling among the 10 students in Chignik Lagoon are high school (6 | 60.0%), middle school (2 | 20.0%), and graduate / professional (2 | 20.0%).
| School Level | # Students | % Students |
| Nursery / Preschool | 0 | 0.0% |
| Kindergarten | 0 | 0.0% |
| Elementary School | 0 | 0.0% |
| Middle School | 2 | 20.0% |
| High School | 6 | 60.0% |
| College / Undergraduate | 0 | 0.0% |
| Graduate / Professional | 2 | 20.0% |
| Total | 10 | 100.0% |
School Enrollment by Age by Funding Source in Chignik Lagoon
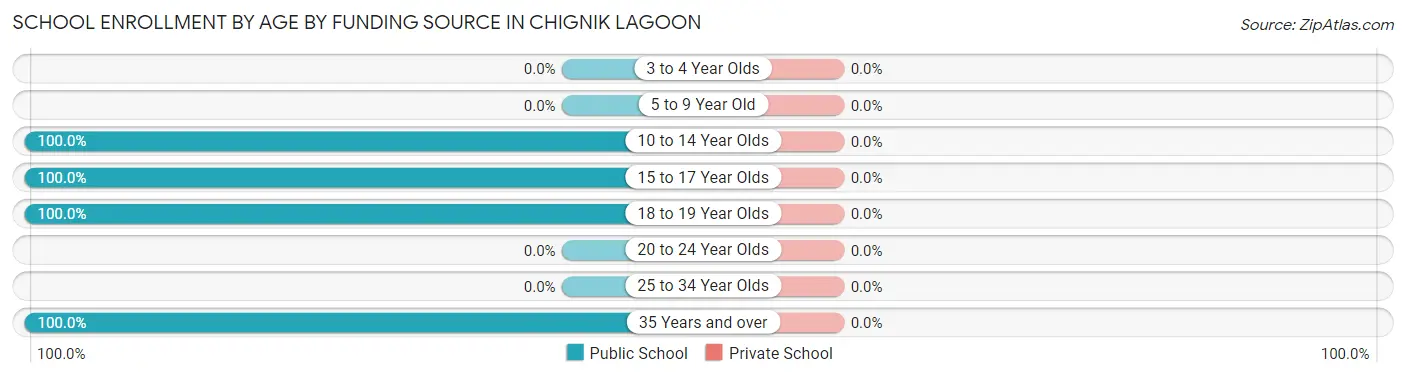
| Age Bracket | Public School | Private School |
| 3 to 4 Year Olds | 0 (0.0%) | 0 (0.0%) |
| 5 to 9 Year Old | 0 (0.0%) | 0 (0.0%) |
| 10 to 14 Year Olds | 2 (100.0%) | 0 (0.0%) |
| 15 to 17 Year Olds | 2 (100.0%) | 0 (0.0%) |
| 18 to 19 Year Olds | 4 (100.0%) | 0 (0.0%) |
| 20 to 24 Year Olds | 0 (0.0%) | 0 (0.0%) |
| 25 to 34 Year Olds | 0 (0.0%) | 0 (0.0%) |
| 35 Years and over | 2 (100.0%) | 0 (0.0%) |
| Total | 10 (100.0%) | 0 (0.0%) |
Educational Attainment by Field of Study in Chignik Lagoon
Education (2 | 66.7%), and liberal arts & history (1 | 33.3%) are the most common fields of study among 3 individuals in Chignik Lagoon who have obtained a bachelor's degree or higher.
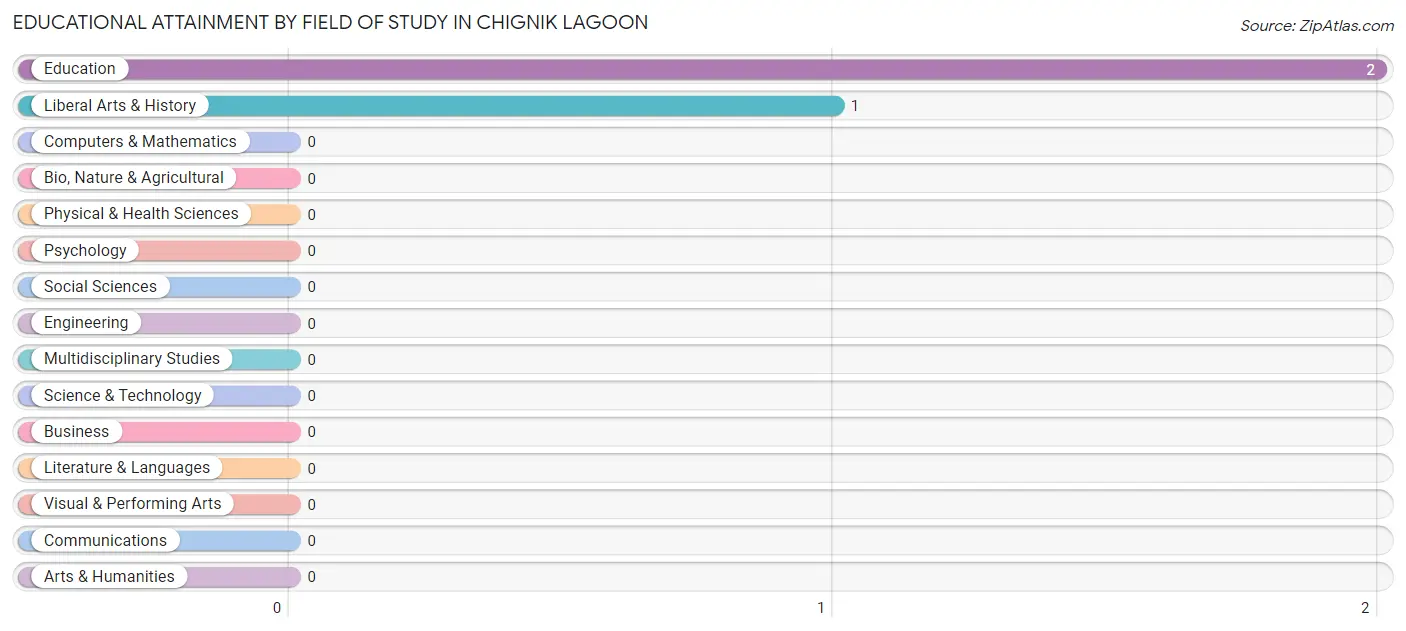
| Field of Study | # Graduates | % Graduates |
| Computers & Mathematics | 0 | 0.0% |
| Bio, Nature & Agricultural | 0 | 0.0% |
| Physical & Health Sciences | 0 | 0.0% |
| Psychology | 0 | 0.0% |
| Social Sciences | 0 | 0.0% |
| Engineering | 0 | 0.0% |
| Multidisciplinary Studies | 0 | 0.0% |
| Science & Technology | 0 | 0.0% |
| Business | 0 | 0.0% |
| Education | 2 | 66.7% |
| Literature & Languages | 0 | 0.0% |
| Liberal Arts & History | 1 | 33.3% |
| Visual & Performing Arts | 0 | 0.0% |
| Communications | 0 | 0.0% |
| Arts & Humanities | 0 | 0.0% |
| Total | 3 | 100.0% |
Transportation & Commute in Chignik Lagoon
Vehicle Availability by Sex in Chignik Lagoon
The most prevalent vehicle ownership categories in Chignik Lagoon are males with 2 vehicles (5, accounting for 62.5%) and females with 2 vehicles (3, making up 83.3%).
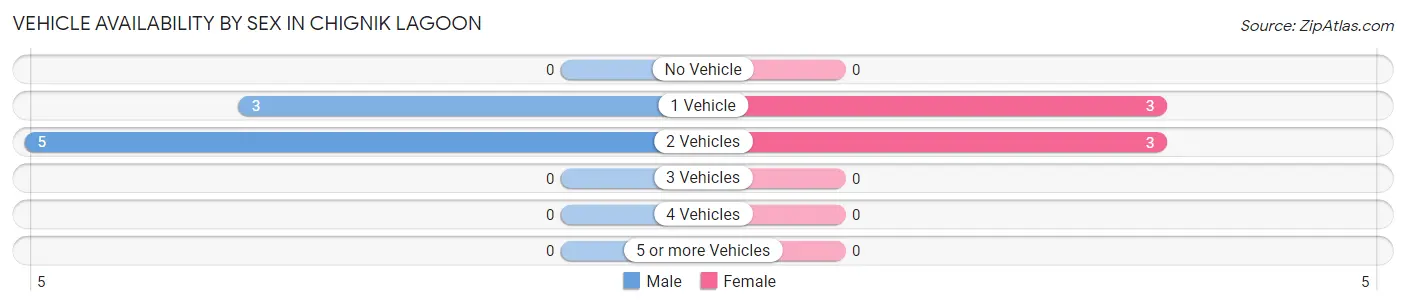
| Vehicles Available | Male | Female |
| No Vehicle | 0 (0.0%) | 0 (0.0%) |
| 1 Vehicle | 3 (37.5%) | 3 (50.0%) |
| 2 Vehicles | 5 (62.5%) | 3 (50.0%) |
| 3 Vehicles | 0 (0.0%) | 0 (0.0%) |
| 4 Vehicles | 0 (0.0%) | 0 (0.0%) |
| 5 or more Vehicles | 0 (0.0%) | 0 (0.0%) |
| Total | 8 (100.0%) | 6 (100.0%) |
Commute Time in Chignik Lagoon
The most frequently occuring commute durations in Chignik Lagoon are less than 5 minutes (8 commuters, 57.1%), 10 to 14 minutes (3 commuters, 21.4%), and 15 to 19 minutes (2 commuters, 14.3%).
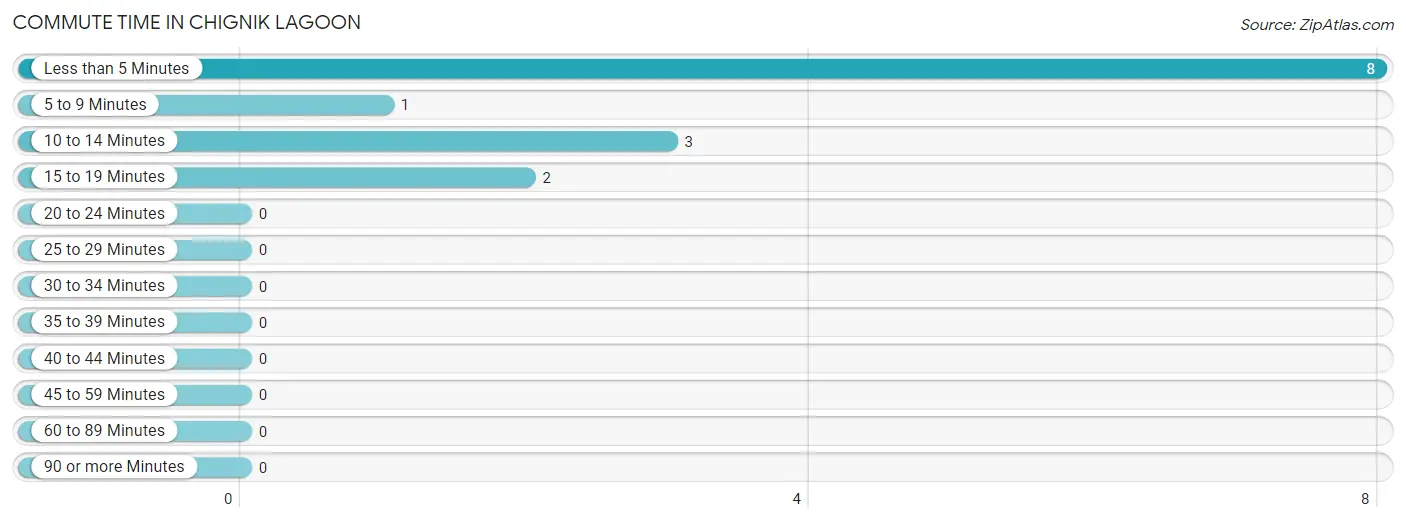
| Commute Time | # Commuters | % Commuters |
| Less than 5 Minutes | 8 | 57.1% |
| 5 to 9 Minutes | 1 | 7.1% |
| 10 to 14 Minutes | 3 | 21.4% |
| 15 to 19 Minutes | 2 | 14.3% |
| 20 to 24 Minutes | 0 | 0.0% |
| 25 to 29 Minutes | 0 | 0.0% |
| 30 to 34 Minutes | 0 | 0.0% |
| 35 to 39 Minutes | 0 | 0.0% |
| 40 to 44 Minutes | 0 | 0.0% |
| 45 to 59 Minutes | 0 | 0.0% |
| 60 to 89 Minutes | 0 | 0.0% |
| 90 or more Minutes | 0 | 0.0% |
Commute Time by Sex in Chignik Lagoon
The most common commute times in Chignik Lagoon are less than 5 minutes (5 commuters, 62.5%) for males and less than 5 minutes (3 commuters, 50.0%) for females.
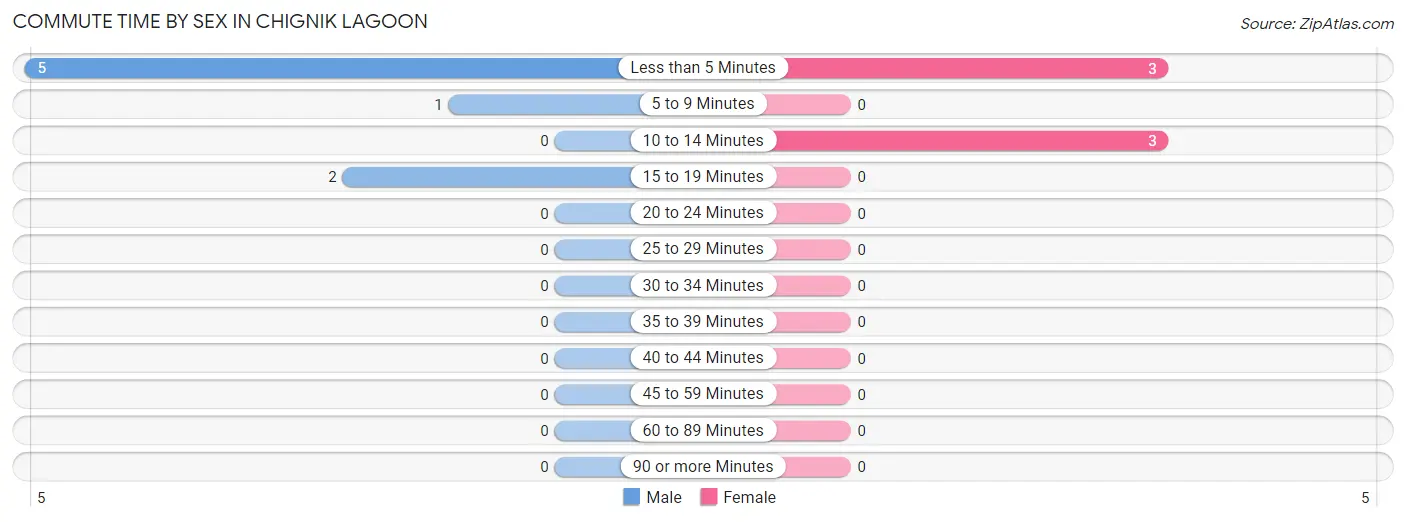
| Commute Time | Male | Female |
| Less than 5 Minutes | 5 (62.5%) | 3 (50.0%) |
| 5 to 9 Minutes | 1 (12.5%) | 0 (0.0%) |
| 10 to 14 Minutes | 0 (0.0%) | 3 (50.0%) |
| 15 to 19 Minutes | 2 (25.0%) | 0 (0.0%) |
| 20 to 24 Minutes | 0 (0.0%) | 0 (0.0%) |
| 25 to 29 Minutes | 0 (0.0%) | 0 (0.0%) |
| 30 to 34 Minutes | 0 (0.0%) | 0 (0.0%) |
| 35 to 39 Minutes | 0 (0.0%) | 0 (0.0%) |
| 40 to 44 Minutes | 0 (0.0%) | 0 (0.0%) |
| 45 to 59 Minutes | 0 (0.0%) | 0 (0.0%) |
| 60 to 89 Minutes | 0 (0.0%) | 0 (0.0%) |
| 90 or more Minutes | 0 (0.0%) | 0 (0.0%) |
Time of Departure to Work by Sex in Chignik Lagoon
The most frequent times of departure to work in Chignik Lagoon are 8:30 AM to 8:59 AM (6, 75.0%) for males and 8:00 AM to 8:29 AM (5, 83.3%) for females.
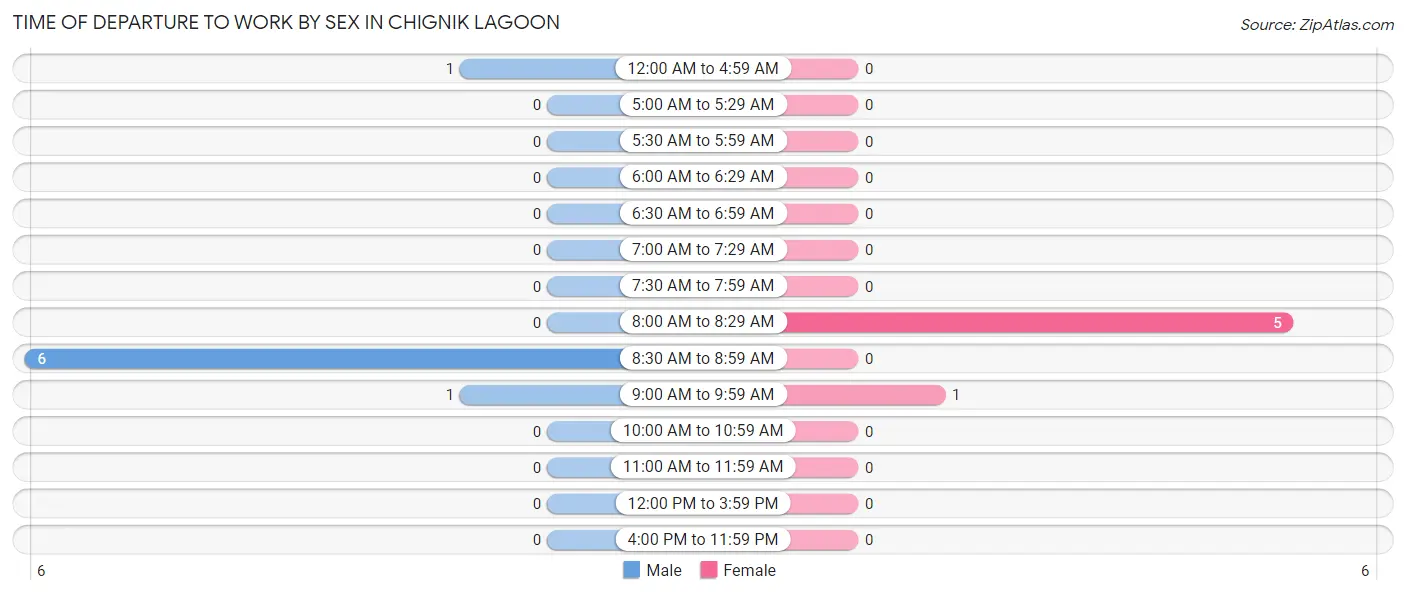
| Time of Departure | Male | Female |
| 12:00 AM to 4:59 AM | 1 (12.5%) | 0 (0.0%) |
| 5:00 AM to 5:29 AM | 0 (0.0%) | 0 (0.0%) |
| 5:30 AM to 5:59 AM | 0 (0.0%) | 0 (0.0%) |
| 6:00 AM to 6:29 AM | 0 (0.0%) | 0 (0.0%) |
| 6:30 AM to 6:59 AM | 0 (0.0%) | 0 (0.0%) |
| 7:00 AM to 7:29 AM | 0 (0.0%) | 0 (0.0%) |
| 7:30 AM to 7:59 AM | 0 (0.0%) | 0 (0.0%) |
| 8:00 AM to 8:29 AM | 0 (0.0%) | 5 (83.3%) |
| 8:30 AM to 8:59 AM | 6 (75.0%) | 0 (0.0%) |
| 9:00 AM to 9:59 AM | 1 (12.5%) | 1 (16.7%) |
| 10:00 AM to 10:59 AM | 0 (0.0%) | 0 (0.0%) |
| 11:00 AM to 11:59 AM | 0 (0.0%) | 0 (0.0%) |
| 12:00 PM to 3:59 PM | 0 (0.0%) | 0 (0.0%) |
| 4:00 PM to 11:59 PM | 0 (0.0%) | 0 (0.0%) |
| Total | 8 (100.0%) | 6 (100.0%) |
Housing Occupancy in Chignik Lagoon
Occupancy by Ownership in Chignik Lagoon
Of the total 14 dwellings in Chignik Lagoon, owner-occupied units account for 9 (64.3%), while renter-occupied units make up 5 (35.7%).
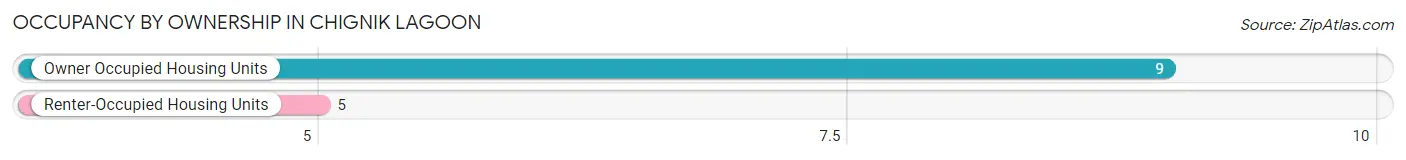
| Occupancy | # Housing Units | % Housing Units |
| Owner Occupied Housing Units | 9 | 64.3% |
| Renter-Occupied Housing Units | 5 | 35.7% |
| Total Occupied Housing Units | 14 | 100.0% |
Occupancy by Household Size in Chignik Lagoon
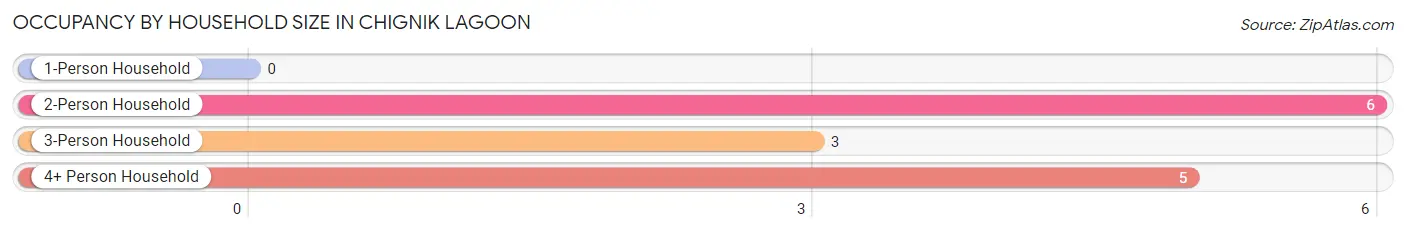
| Household Size | # Housing Units | % Housing Units |
| 1-Person Household | 0 | 0.0% |
| 2-Person Household | 6 | 42.9% |
| 3-Person Household | 3 | 21.4% |
| 4+ Person Household | 5 | 35.7% |
| Total Housing Units | 14 | 100.0% |
Occupancy by Ownership by Household Size in Chignik Lagoon
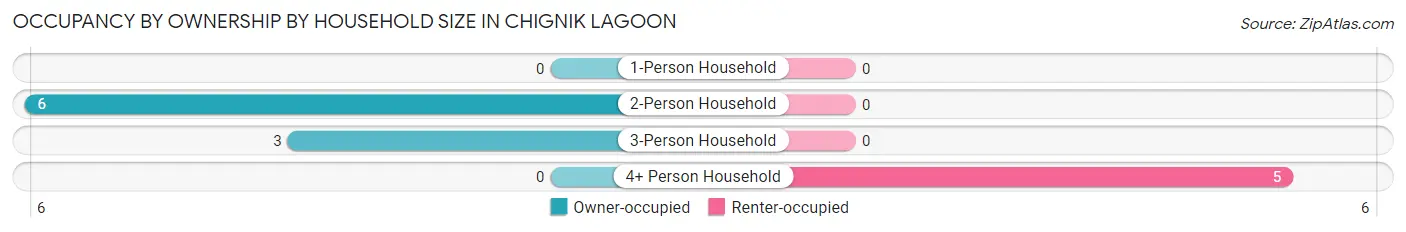
| Household Size | Owner-occupied | Renter-occupied |
| 1-Person Household | 0 (0.0%) | 0 (0.0%) |
| 2-Person Household | 6 (100.0%) | 0 (0.0%) |
| 3-Person Household | 3 (100.0%) | 0 (0.0%) |
| 4+ Person Household | 0 (0.0%) | 5 (100.0%) |
| Total Housing Units | 9 (64.3%) | 5 (35.7%) |
Occupancy by Educational Attainment in Chignik Lagoon
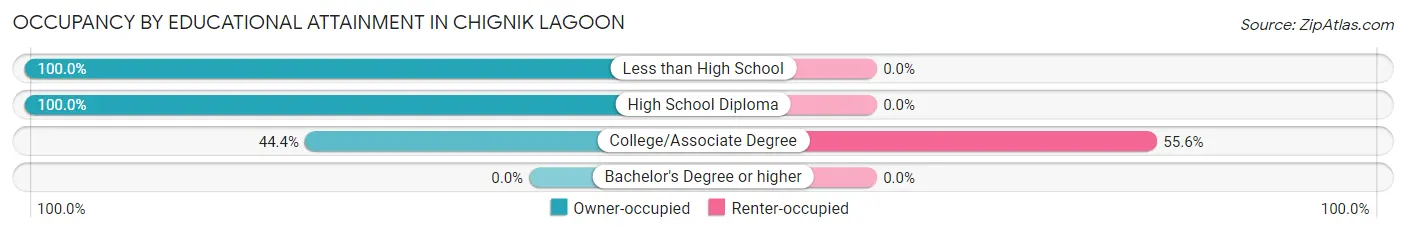
| Household Size | Owner-occupied | Renter-occupied |
| Less than High School | 2 (100.0%) | 0 (0.0%) |
| High School Diploma | 3 (100.0%) | 0 (0.0%) |
| College/Associate Degree | 4 (44.4%) | 5 (55.6%) |
| Bachelor's Degree or higher | 0 (0.0%) | 0 (0.0%) |
Occupancy by Age of Householder in Chignik Lagoon
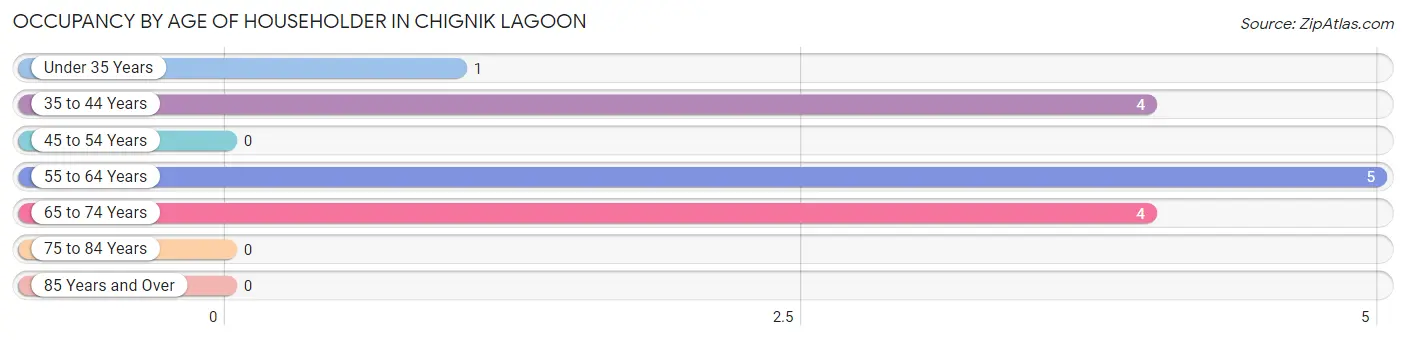
| Age Bracket | # Households | % Households |
| Under 35 Years | 1 | 7.1% |
| 35 to 44 Years | 4 | 28.6% |
| 45 to 54 Years | 0 | 0.0% |
| 55 to 64 Years | 5 | 35.7% |
| 65 to 74 Years | 4 | 28.6% |
| 75 to 84 Years | 0 | 0.0% |
| 85 Years and Over | 0 | 0.0% |
| Total | 14 | 100.0% |
Housing Finances in Chignik Lagoon
Median Income by Occupancy in Chignik Lagoon
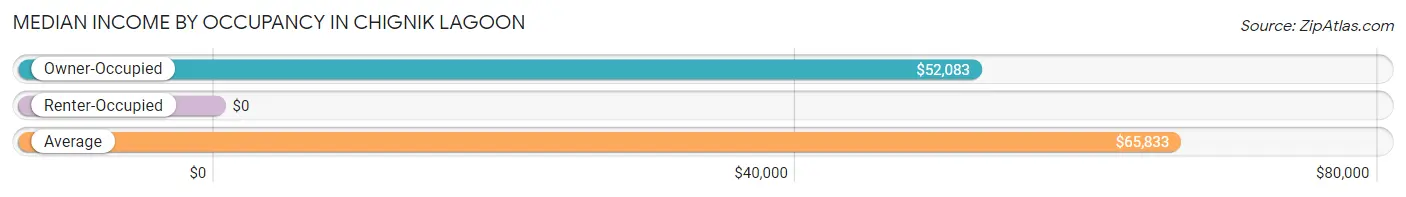
| Occupancy Type | # Households | Median Income |
| Owner-Occupied | 9 (64.3%) | $52,083 |
| Renter-Occupied | 5 (35.7%) | $0 |
| Average | 14 (100.0%) | $65,833 |
Occupancy by Householder Income Bracket in Chignik Lagoon
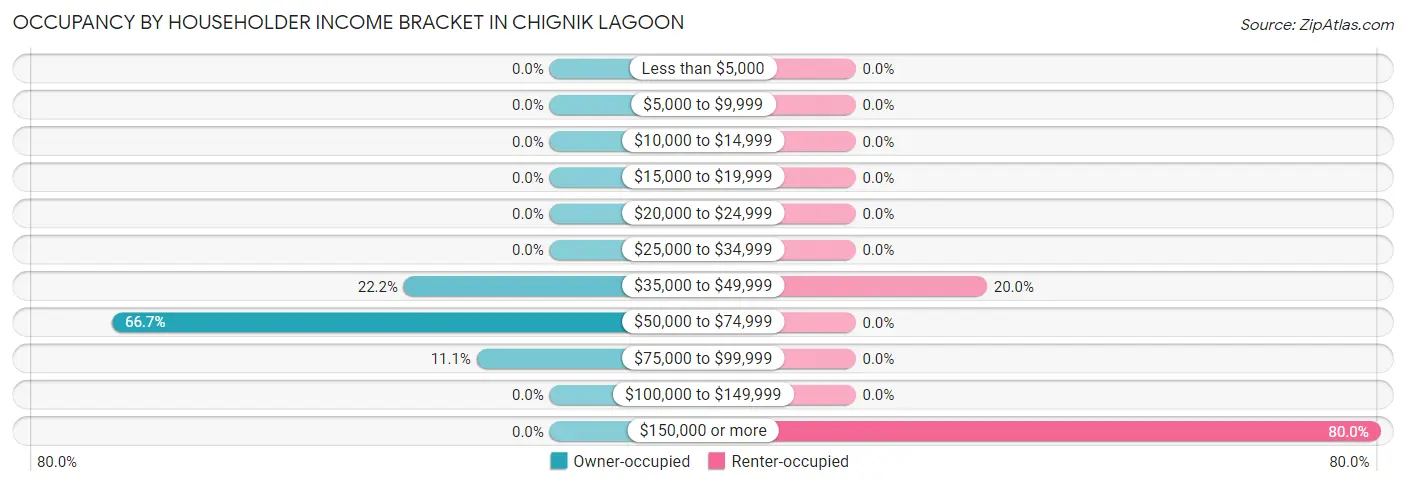
| Income Bracket | Owner-occupied | Renter-occupied |
| Less than $5,000 | 0 (0.0%) | 0 (0.0%) |
| $5,000 to $9,999 | 0 (0.0%) | 0 (0.0%) |
| $10,000 to $14,999 | 0 (0.0%) | 0 (0.0%) |
| $15,000 to $19,999 | 0 (0.0%) | 0 (0.0%) |
| $20,000 to $24,999 | 0 (0.0%) | 0 (0.0%) |
| $25,000 to $34,999 | 0 (0.0%) | 0 (0.0%) |
| $35,000 to $49,999 | 2 (22.2%) | 1 (20.0%) |
| $50,000 to $74,999 | 6 (66.7%) | 0 (0.0%) |
| $75,000 to $99,999 | 1 (11.1%) | 0 (0.0%) |
| $100,000 to $149,999 | 0 (0.0%) | 0 (0.0%) |
| $150,000 or more | 0 (0.0%) | 4 (80.0%) |
| Total | 9 (100.0%) | 5 (100.0%) |
Monthly Housing Cost Tiers in Chignik Lagoon
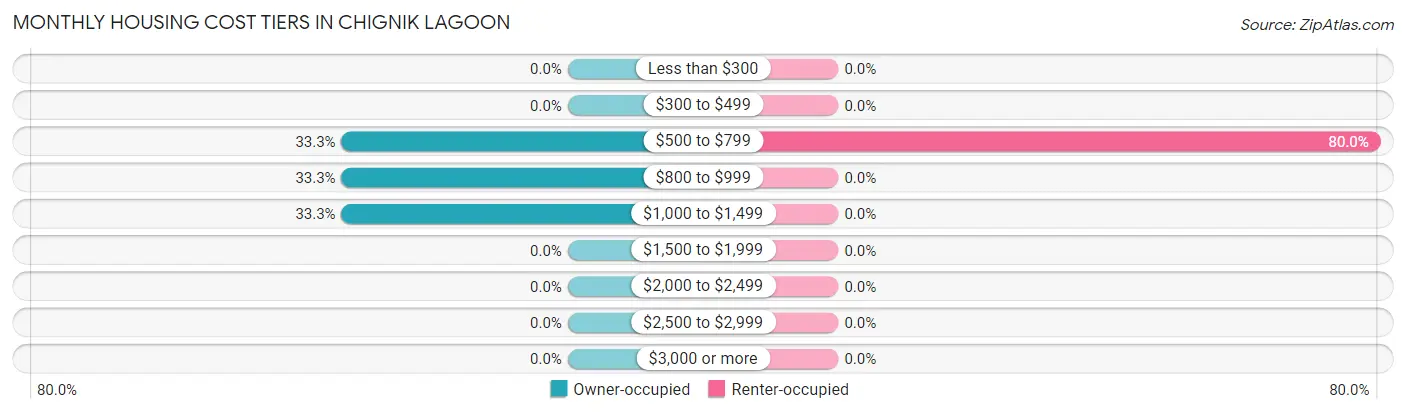
| Monthly Cost | Owner-occupied | Renter-occupied |
| Less than $300 | 0 (0.0%) | 0 (0.0%) |
| $300 to $499 | 0 (0.0%) | 0 (0.0%) |
| $500 to $799 | 3 (33.3%) | 4 (80.0%) |
| $800 to $999 | 3 (33.3%) | 0 (0.0%) |
| $1,000 to $1,499 | 3 (33.3%) | 0 (0.0%) |
| $1,500 to $1,999 | 0 (0.0%) | 0 (0.0%) |
| $2,000 to $2,499 | 0 (0.0%) | 0 (0.0%) |
| $2,500 to $2,999 | 0 (0.0%) | 0 (0.0%) |
| $3,000 or more | 0 (0.0%) | 0 (0.0%) |
| Total | 9 (100.0%) | 5 (100.0%) |
Physical Housing Characteristics in Chignik Lagoon
Housing Structures in Chignik Lagoon
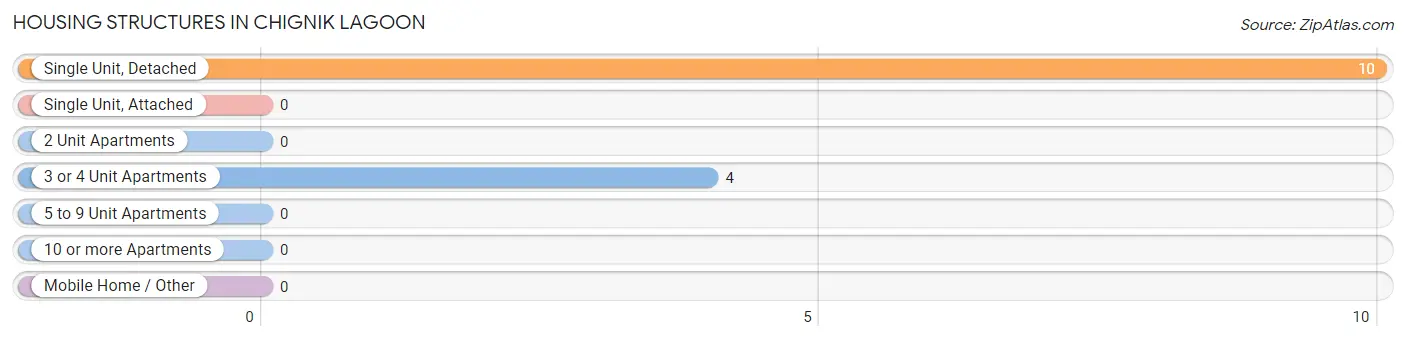
| Structure Type | # Housing Units | % Housing Units |
| Single Unit, Detached | 10 | 71.4% |
| Single Unit, Attached | 0 | 0.0% |
| 2 Unit Apartments | 0 | 0.0% |
| 3 or 4 Unit Apartments | 4 | 28.6% |
| 5 to 9 Unit Apartments | 0 | 0.0% |
| 10 or more Apartments | 0 | 0.0% |
| Mobile Home / Other | 0 | 0.0% |
| Total | 14 | 100.0% |
Housing Structures by Occupancy in Chignik Lagoon
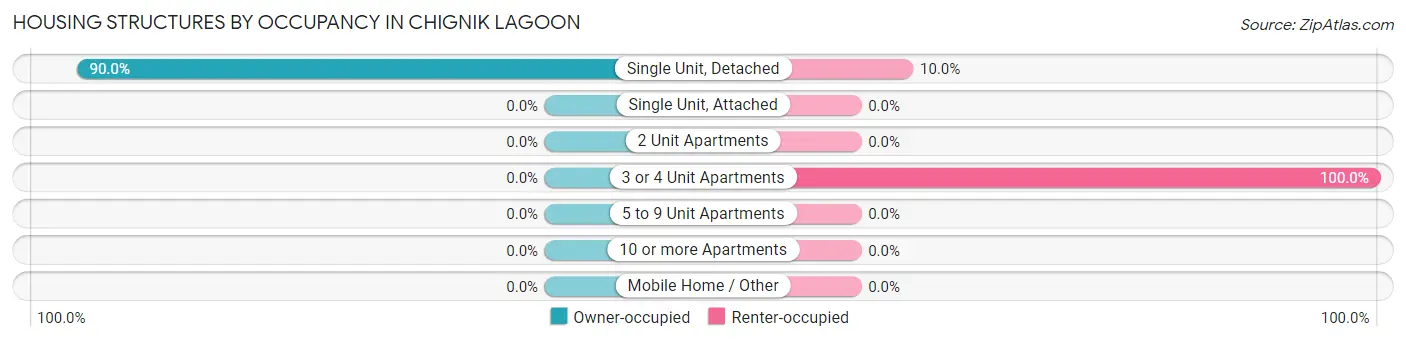
| Structure Type | Owner-occupied | Renter-occupied |
| Single Unit, Detached | 9 (90.0%) | 1 (10.0%) |
| Single Unit, Attached | 0 (0.0%) | 0 (0.0%) |
| 2 Unit Apartments | 0 (0.0%) | 0 (0.0%) |
| 3 or 4 Unit Apartments | 0 (0.0%) | 4 (100.0%) |
| 5 to 9 Unit Apartments | 0 (0.0%) | 0 (0.0%) |
| 10 or more Apartments | 0 (0.0%) | 0 (0.0%) |
| Mobile Home / Other | 0 (0.0%) | 0 (0.0%) |
| Total | 9 (64.3%) | 5 (35.7%) |
Housing Structures by Number of Rooms in Chignik Lagoon
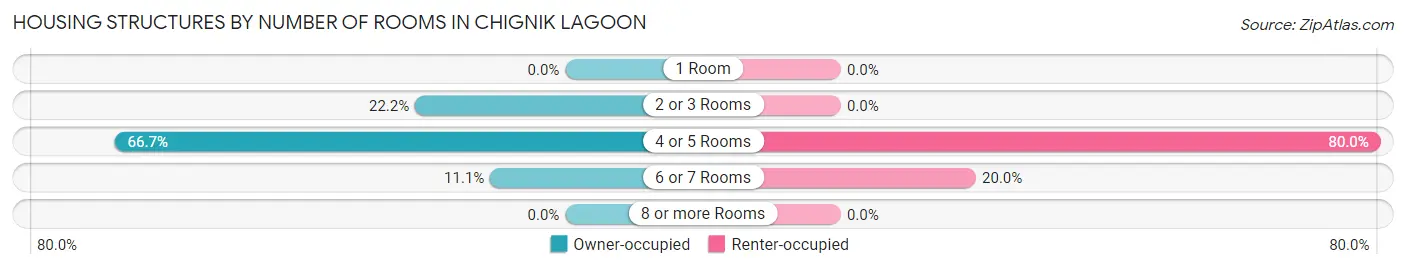
| Number of Rooms | Owner-occupied | Renter-occupied |
| 1 Room | 0 (0.0%) | 0 (0.0%) |
| 2 or 3 Rooms | 2 (22.2%) | 0 (0.0%) |
| 4 or 5 Rooms | 6 (66.7%) | 4 (80.0%) |
| 6 or 7 Rooms | 1 (11.1%) | 1 (20.0%) |
| 8 or more Rooms | 0 (0.0%) | 0 (0.0%) |
| Total | 9 (100.0%) | 5 (100.0%) |
Housing Structure by Heating Type in Chignik Lagoon
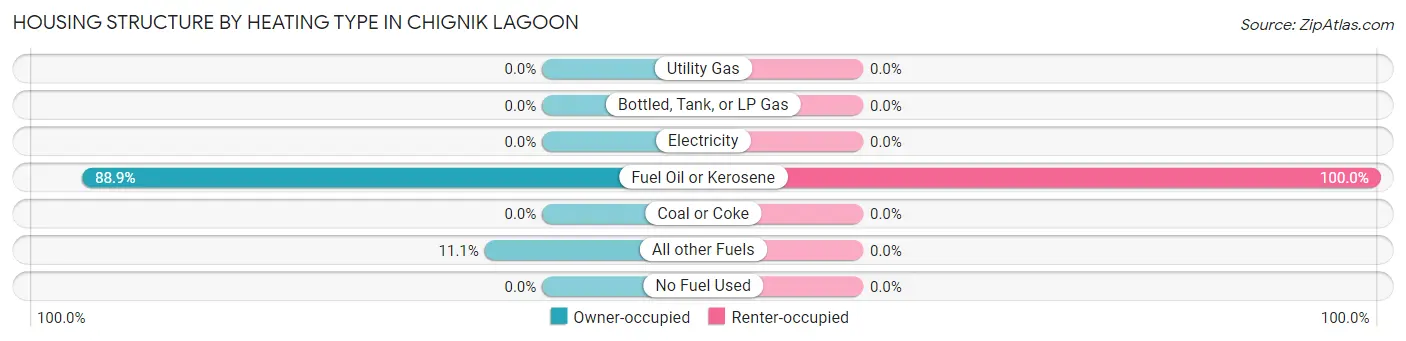
| Heating Type | Owner-occupied | Renter-occupied |
| Utility Gas | 0 (0.0%) | 0 (0.0%) |
| Bottled, Tank, or LP Gas | 0 (0.0%) | 0 (0.0%) |
| Electricity | 0 (0.0%) | 0 (0.0%) |
| Fuel Oil or Kerosene | 8 (88.9%) | 5 (100.0%) |
| Coal or Coke | 0 (0.0%) | 0 (0.0%) |
| All other Fuels | 1 (11.1%) | 0 (0.0%) |
| No Fuel Used | 0 (0.0%) | 0 (0.0%) |
| Total | 9 (100.0%) | 5 (100.0%) |
Household Vehicle Usage in Chignik Lagoon
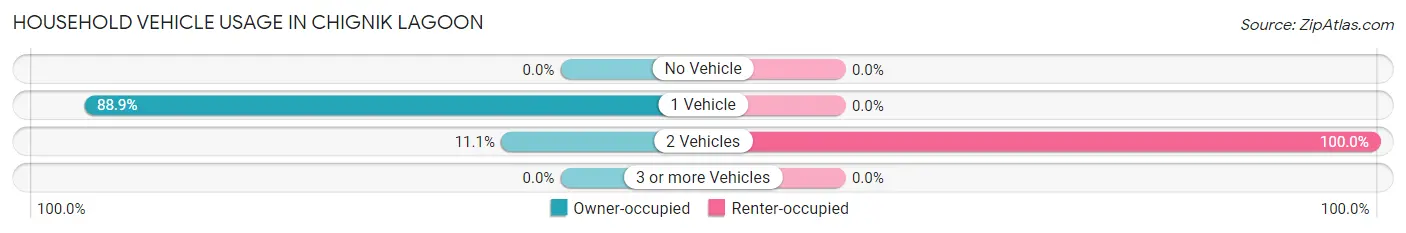
| Vehicles per Household | Owner-occupied | Renter-occupied |
| No Vehicle | 0 (0.0%) | 0 (0.0%) |
| 1 Vehicle | 8 (88.9%) | 0 (0.0%) |
| 2 Vehicles | 1 (11.1%) | 5 (100.0%) |
| 3 or more Vehicles | 0 (0.0%) | 0 (0.0%) |
| Total | 9 (100.0%) | 5 (100.0%) |
Real Estate & Mortgages in Chignik Lagoon
Real Estate and Mortgage Overview in Chignik Lagoon
| Characteristic | Without Mortgage | With Mortgage |
| Housing Units | 9 | 0 |
| Median Property Value | $154,200 | $0 |
| Median Household Income | $52,083 | $0 |
| Monthly Housing Costs | $950 | $0 |
| Real Estate Taxes | - | - |
Property Value by Mortgage Status in Chignik Lagoon
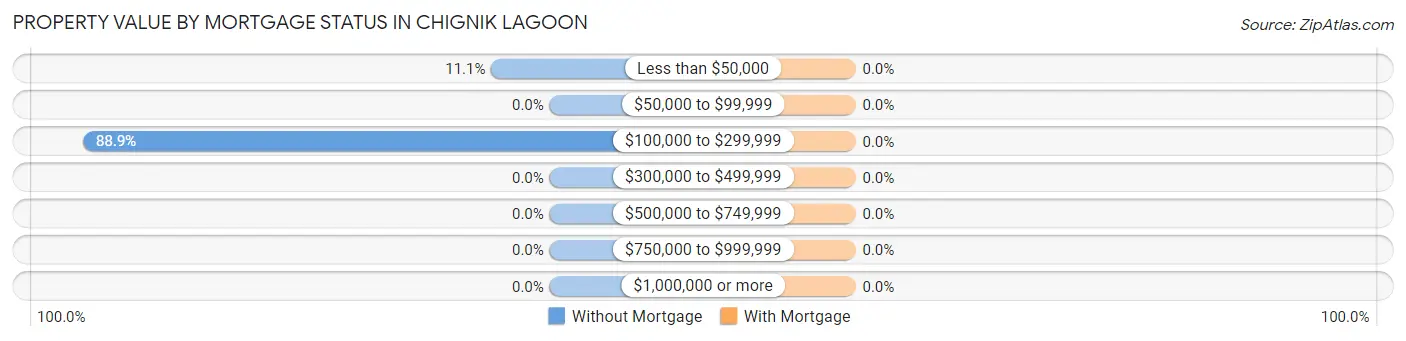
| Property Value | Without Mortgage | With Mortgage |
| Less than $50,000 | 1 (11.1%) | 0 (0.0%) |
| $50,000 to $99,999 | 0 (0.0%) | 0 (0.0%) |
| $100,000 to $299,999 | 8 (88.9%) | 0 (0.0%) |
| $300,000 to $499,999 | 0 (0.0%) | 0 (0.0%) |
| $500,000 to $749,999 | 0 (0.0%) | 0 (0.0%) |
| $750,000 to $999,999 | 0 (0.0%) | 0 (0.0%) |
| $1,000,000 or more | 0 (0.0%) | 0 (0.0%) |
| Total | 9 (100.0%) | 0 (0.0%) |
Household Income by Mortgage Status in Chignik Lagoon
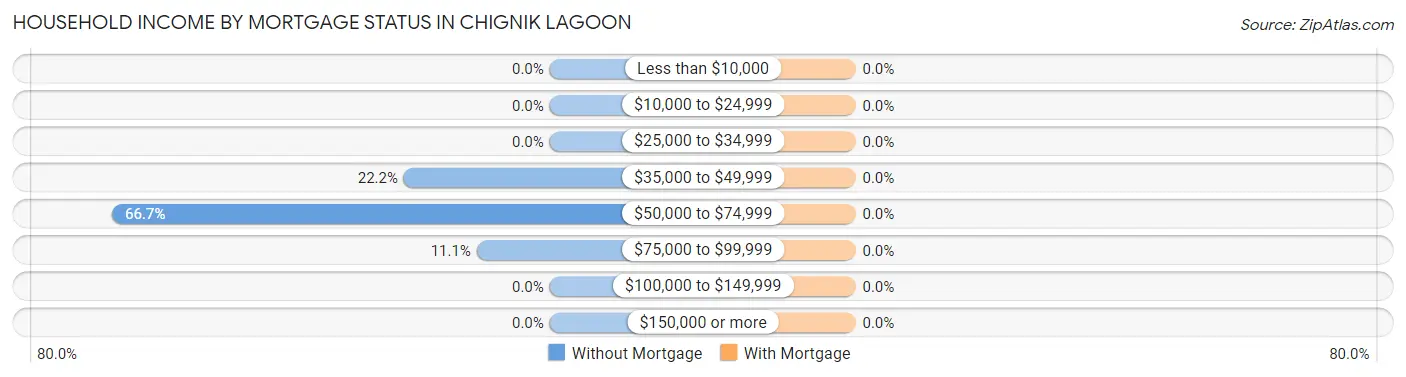
| Household Income | Without Mortgage | With Mortgage |
| Less than $10,000 | 0 (0.0%) | 0 (0.0%) |
| $10,000 to $24,999 | 0 (0.0%) | 0 (0.0%) |
| $25,000 to $34,999 | 0 (0.0%) | 0 (0.0%) |
| $35,000 to $49,999 | 2 (22.2%) | 0 (0.0%) |
| $50,000 to $74,999 | 6 (66.7%) | 0 (0.0%) |
| $75,000 to $99,999 | 1 (11.1%) | 0 (0.0%) |
| $100,000 to $149,999 | 0 (0.0%) | 0 (0.0%) |
| $150,000 or more | 0 (0.0%) | 0 (0.0%) |
| Total | 9 (100.0%) | 0 (0.0%) |
Property Value to Household Income Ratio in Chignik Lagoon
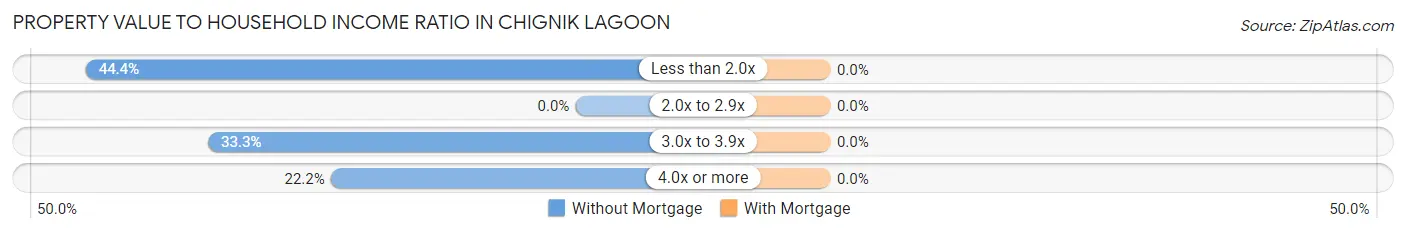
| Value-to-Income Ratio | Without Mortgage | With Mortgage |
| Less than 2.0x | 4 (44.4%) | 0 (0.0%) |
| 2.0x to 2.9x | 0 (0.0%) | 0 (0.0%) |
| 3.0x to 3.9x | 3 (33.3%) | 0 (0.0%) |
| 4.0x or more | 2 (22.2%) | 0 (0.0%) |
| Total | 9 (100.0%) | 0 (0.0%) |
Real Estate Taxes by Mortgage Status in Chignik Lagoon
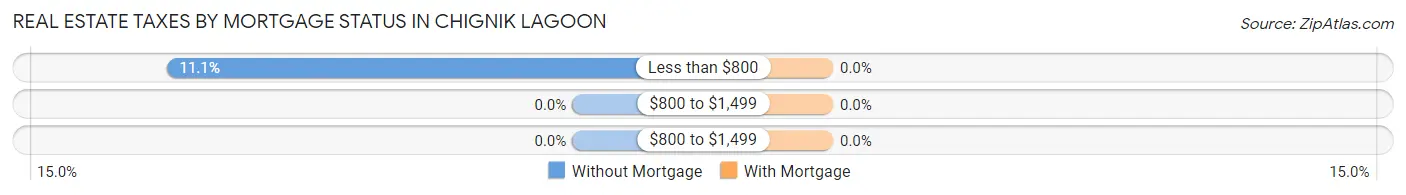
| Property Taxes | Without Mortgage | With Mortgage |
| Less than $800 | 1 (11.1%) | 0 (0.0%) |
| $800 to $1,499 | 0 (0.0%) | 0 (0.0%) |
| $800 to $1,499 | 0 (0.0%) | 0 (0.0%) |
| Total | 9 (100.0%) | 0 (0.0%) |
Health & Disability in Chignik Lagoon
Health Insurance Coverage by Age in Chignik Lagoon
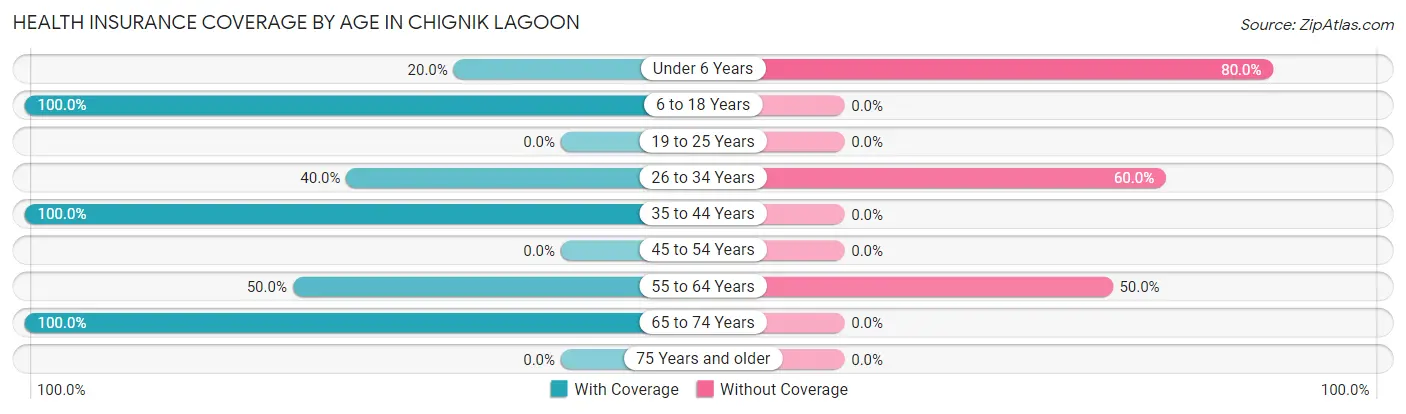
| Age Bracket | With Coverage | Without Coverage |
| Under 6 Years | 1 (20.0%) | 4 (80.0%) |
| 6 to 18 Years | 8 (100.0%) | 0 (0.0%) |
| 19 to 25 Years | 0 (0.0%) | 0 (0.0%) |
| 26 to 34 Years | 2 (40.0%) | 3 (60.0%) |
| 35 to 44 Years | 6 (100.0%) | 0 (0.0%) |
| 45 to 54 Years | 0 (0.0%) | 0 (0.0%) |
| 55 to 64 Years | 5 (50.0%) | 5 (50.0%) |
| 65 to 74 Years | 5 (100.0%) | 0 (0.0%) |
| 75 Years and older | 0 (0.0%) | 0 (0.0%) |
| Total | 27 (69.2%) | 12 (30.8%) |
Health Insurance Coverage by Citizenship Status in Chignik Lagoon
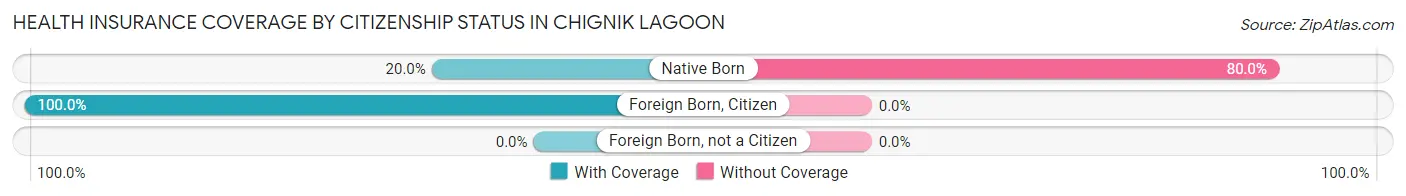
| Citizenship Status | With Coverage | Without Coverage |
| Native Born | 1 (20.0%) | 4 (80.0%) |
| Foreign Born, Citizen | 8 (100.0%) | 0 (0.0%) |
| Foreign Born, not a Citizen | 0 (0.0%) | 0 (0.0%) |
Health Insurance Coverage by Household Income in Chignik Lagoon
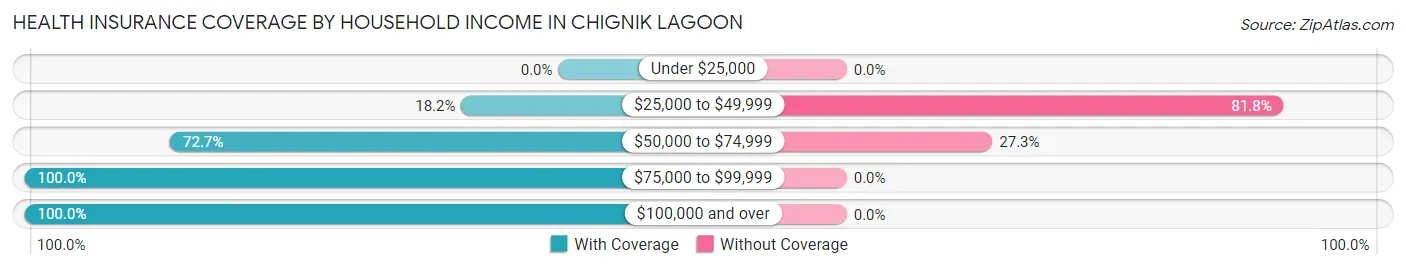
| Household Income | With Coverage | Without Coverage |
| Under $25,000 | 0 (0.0%) | 0 (0.0%) |
| $25,000 to $49,999 | 2 (18.2%) | 9 (81.8%) |
| $50,000 to $74,999 | 8 (72.7%) | 3 (27.3%) |
| $75,000 to $99,999 | 2 (100.0%) | 0 (0.0%) |
| $100,000 and over | 15 (100.0%) | 0 (0.0%) |
Public vs Private Health Insurance Coverage by Age in Chignik Lagoon
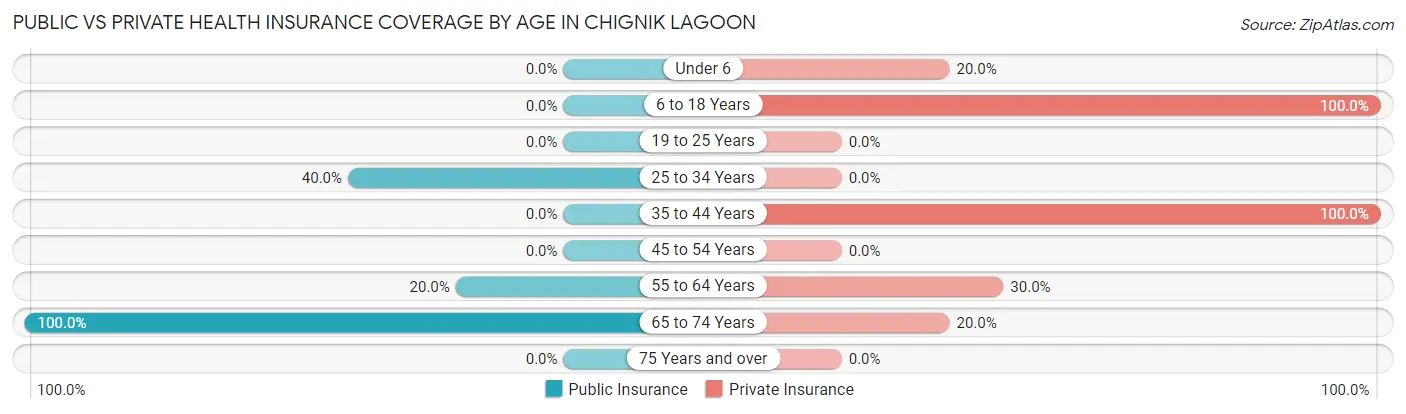
| Age Bracket | Public Insurance | Private Insurance |
| Under 6 | 0 (0.0%) | 1 (20.0%) |
| 6 to 18 Years | 0 (0.0%) | 8 (100.0%) |
| 19 to 25 Years | 0 (0.0%) | 0 (0.0%) |
| 25 to 34 Years | 2 (40.0%) | 0 (0.0%) |
| 35 to 44 Years | 0 (0.0%) | 6 (100.0%) |
| 45 to 54 Years | 0 (0.0%) | 0 (0.0%) |
| 55 to 64 Years | 2 (20.0%) | 3 (30.0%) |
| 65 to 74 Years | 5 (100.0%) | 1 (20.0%) |
| 75 Years and over | 0 (0.0%) | 0 (0.0%) |
| Total | 9 (23.1%) | 19 (48.7%) |
Disability Status by Sex by Age in Chignik Lagoon
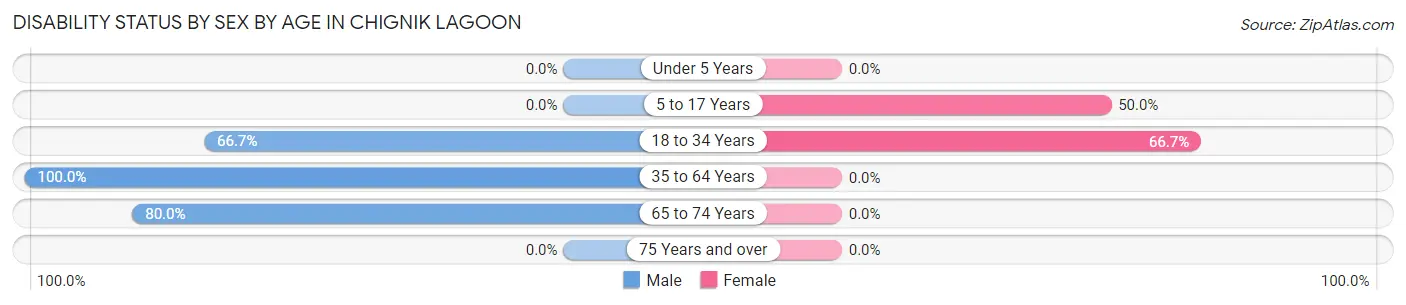
| Age Bracket | Male | Female |
| Under 5 Years | 0 (0.0%) | 0 (0.0%) |
| 5 to 17 Years | 0 (0.0%) | 2 (50.0%) |
| 18 to 34 Years | 2 (66.7%) | 4 (66.7%) |
| 35 to 64 Years | 6 (100.0%) | 0 (0.0%) |
| 65 to 74 Years | 4 (80.0%) | 0 (0.0%) |
| 75 Years and over | 0 (0.0%) | 0 (0.0%) |
Disability Class by Sex by Age in Chignik Lagoon
Disability Class: Hearing Difficulty
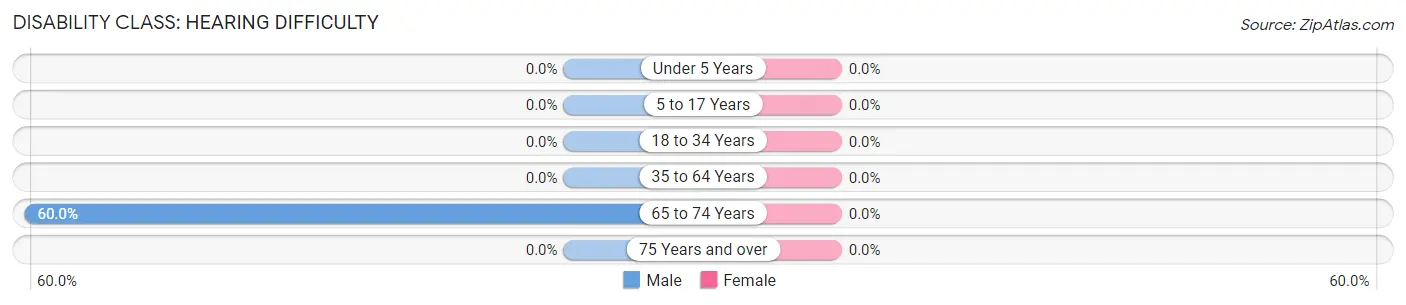
| Age Bracket | Male | Female |
| Under 5 Years | 0 (0.0%) | 0 (0.0%) |
| 5 to 17 Years | 0 (0.0%) | 0 (0.0%) |
| 18 to 34 Years | 0 (0.0%) | 0 (0.0%) |
| 35 to 64 Years | 0 (0.0%) | 0 (0.0%) |
| 65 to 74 Years | 3 (60.0%) | 0 (0.0%) |
| 75 Years and over | 0 (0.0%) | 0 (0.0%) |
Disability Class: Vision Difficulty
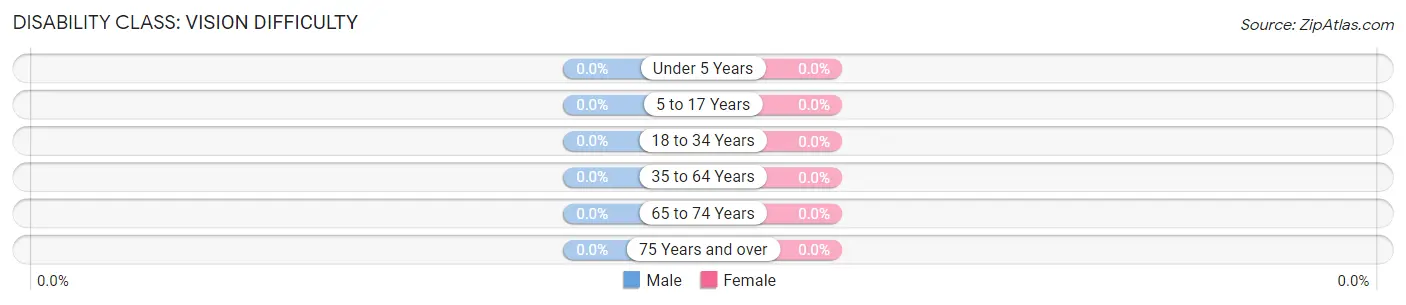
| Age Bracket | Male | Female |
| Under 5 Years | 0 (0.0%) | 0 (0.0%) |
| 5 to 17 Years | 0 (0.0%) | 0 (0.0%) |
| 18 to 34 Years | 0 (0.0%) | 0 (0.0%) |
| 35 to 64 Years | 0 (0.0%) | 0 (0.0%) |
| 65 to 74 Years | 0 (0.0%) | 0 (0.0%) |
| 75 Years and over | 0 (0.0%) | 0 (0.0%) |
Disability Class: Cognitive Difficulty
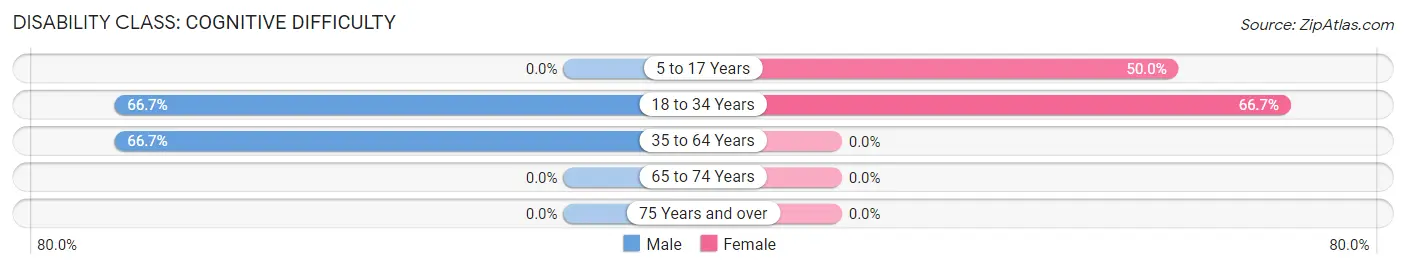
| Age Bracket | Male | Female |
| 5 to 17 Years | 0 (0.0%) | 2 (50.0%) |
| 18 to 34 Years | 2 (66.7%) | 4 (66.7%) |
| 35 to 64 Years | 4 (66.7%) | 0 (0.0%) |
| 65 to 74 Years | 0 (0.0%) | 0 (0.0%) |
| 75 Years and over | 0 (0.0%) | 0 (0.0%) |
Disability Class: Ambulatory Difficulty
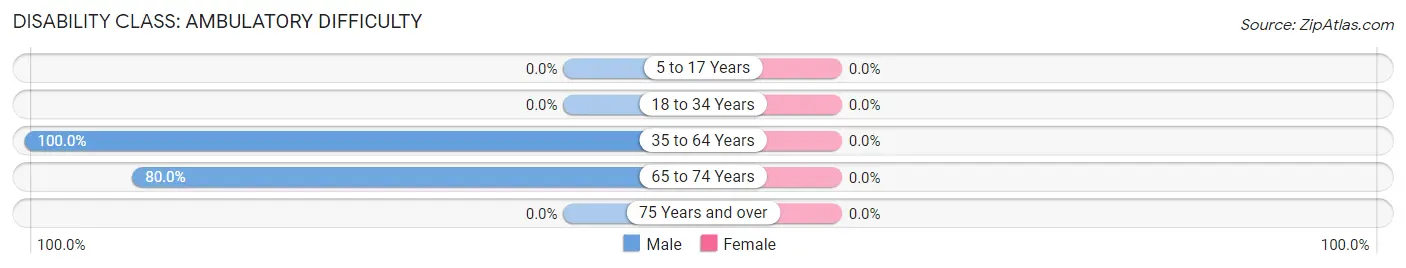
| Age Bracket | Male | Female |
| 5 to 17 Years | 0 (0.0%) | 0 (0.0%) |
| 18 to 34 Years | 0 (0.0%) | 0 (0.0%) |
| 35 to 64 Years | 6 (100.0%) | 0 (0.0%) |
| 65 to 74 Years | 4 (80.0%) | 0 (0.0%) |
| 75 Years and over | 0 (0.0%) | 0 (0.0%) |
Disability Class: Self-Care Difficulty
| Age Bracket | Male | Female |
| 5 to 17 Years | 0 (0.0%) | 0 (0.0%) |
| 18 to 34 Years | 0 (0.0%) | 0 (0.0%) |
| 35 to 64 Years | 0 (0.0%) | 0 (0.0%) |
| 65 to 74 Years | 0 (0.0%) | 0 (0.0%) |
| 75 Years and over | 0 (0.0%) | 0 (0.0%) |
Technology Access in Chignik Lagoon
Computing Device Access in Chignik Lagoon
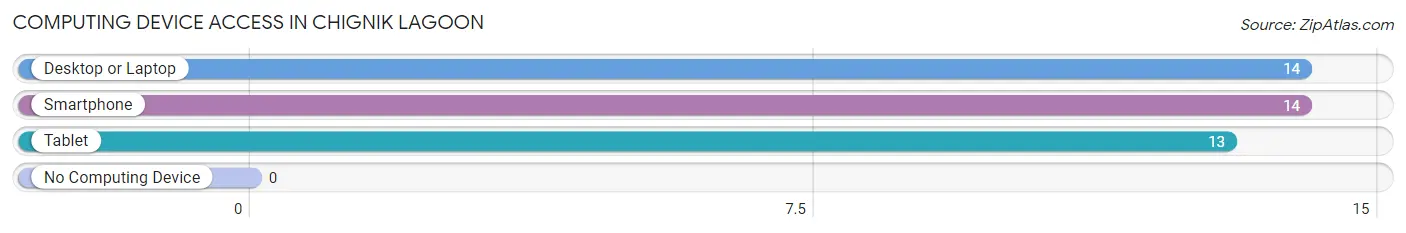
| Device Type | # Households | % Households |
| Desktop or Laptop | 14 | 100.0% |
| Smartphone | 14 | 100.0% |
| Tablet | 13 | 92.9% |
| No Computing Device | 0 | 0.0% |
| Total | 14 | 100.0% |
Internet Access in Chignik Lagoon
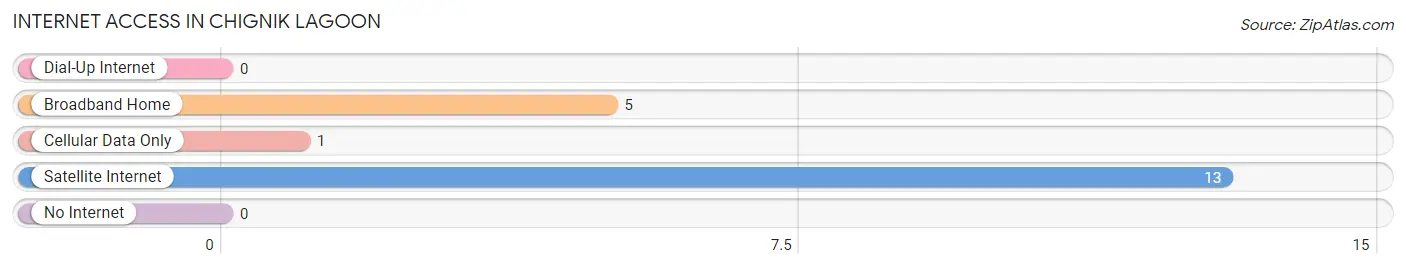
| Internet Type | # Households | % Households |
| Dial-Up Internet | 0 | 0.0% |
| Broadband Home | 5 | 35.7% |
| Cellular Data Only | 1 | 7.1% |
| Satellite Internet | 13 | 92.9% |
| No Internet | 0 | 0.0% |
| Total | 14 | 100.0% |
Chignik Lagoon Summary
Chignik Lagoon is a small community located on the Alaska Peninsula in the Aleutian Islands. It is located on the eastern shore of Chignik Bay, about 40 miles southwest of the city of King Salmon. The population of Chignik Lagoon was estimated to be around 100 people in 2020.
Geography
Chignik Lagoon is located on the eastern shore of Chignik Bay, which is part of the Alaska Peninsula. The bay is about 40 miles southwest of the city of King Salmon. The community is located on a small, flat, sandy beach, with a few small hills nearby. The area is surrounded by mountains and is home to a variety of wildlife, including brown bears, moose, and bald eagles. The climate in Chignik Lagoon is mild and wet, with temperatures ranging from the mid-30s to the mid-50s Fahrenheit.
Economy
The economy of Chignik Lagoon is largely based on fishing and subsistence activities. The community is home to a commercial fishing fleet, which harvests salmon, halibut, and other fish species. The fish are then processed and sold to markets in Alaska and beyond. The community also has a small cannery, which processes and cans salmon for sale. In addition to fishing, the community also relies on subsistence activities, such as hunting and gathering, to supplement their income.
Demographics
The population of Chignik Lagoon was estimated to be around 100 people in 2020. The majority of the population is Alaska Native, with the majority being of Aleut descent. The community is also home to a small number of non-Native residents. The median age of the population is around 40 years old.
Conclusion
Chignik Lagoon is a small community located on the Alaska Peninsula in the Aleutian Islands. It is home to a population of around 100 people, most of whom are Alaska Native and of Aleut descent. The economy of Chignik Lagoon is largely based on fishing and subsistence activities, with a commercial fishing fleet and a small cannery. The community is also home to a variety of wildlife, including brown bears, moose, and bald eagles.
Common Questions
What is Per Capita Income in Chignik Lagoon?
Per Capita income in Chignik Lagoon is $22,490.
What is the Median Family Income in Chignik Lagoon?
Median Family Income in Chignik Lagoon is $66,667.
What is the Median Household income in Chignik Lagoon?
Median Household Income in Chignik Lagoon is $65,833.
What is Inequality or Gini Index in Chignik Lagoon?
Inequality or Gini Index in Chignik Lagoon is 0.28.
What is the Total Population of Chignik Lagoon?
Total Population of Chignik Lagoon is 39.
What is the Total Male Population of Chignik Lagoon?
Total Male Population of Chignik Lagoon is 14.
What is the Total Female Population of Chignik Lagoon?
Total Female Population of Chignik Lagoon is 25.
What is the Ratio of Males per 100 Females in Chignik Lagoon?
There are 56.00 Males per 100 Females in Chignik Lagoon.
What is the Ratio of Females per 100 Males in Chignik Lagoon?
There are 178.57 Females per 100 Males in Chignik Lagoon.
What is the Median Population Age in Chignik Lagoon?
Median Population Age in Chignik Lagoon is 40.8 Years.
What is the Average Family Size in Chignik Lagoon
Average Family Size in Chignik Lagoon is 2.9 People.
What is the Average Household Size in Chignik Lagoon
Average Household Size in Chignik Lagoon is 2.8 People.
How Large is the Labor Force in Chignik Lagoon?
There are 14 People in the Labor Forcein in Chignik Lagoon.
What is the Percentage of People in the Labor Force in Chignik Lagoon?
46.7% of People are in the Labor Force in Chignik Lagoon.