Halibut Cove, AK Map & Demographics
Halibut Cove Map
Halibut Cove Overview
$37,536
PER CAPITA INCOME
$100,536
AVG FAMILY INCOME
$80,139
AVG HOUSEHOLD INCOME
20.4%
WAGE / INCOME GAP [ % ]
79.6¢/ $1
WAGE / INCOME GAP [ $ ]
0.27
INEQUALITY / GINI INDEX
211
TOTAL POPULATION
130
MALE POPULATION
81
FEMALE POPULATION
160.49
MALES / 100 FEMALES
62.31
FEMALES / 100 MALES
40.7
MEDIAN AGE
3.3
AVG FAMILY SIZE
2.7
AVG HOUSEHOLD SIZE
64
LABOR FORCE [ PEOPLE ]
40.8%
PERCENT IN LABOR FORCE
Halibut Cove Area Codes
Income in Halibut Cove
Income Overview in Halibut Cove
Per Capita Income in Halibut Cove is $37,536, while median incomes of families and households are $100,536 and $80,139 respectively.
| Characteristic | Number | Measure |
| Per Capita Income | 211 | $37,536 |
| Median Family Income | 54 | $100,536 |
| Mean Family Income | 54 | $111,020 |
| Median Household Income | 77 | $80,139 |
| Mean Household Income | 77 | $92,478 |
| Income Deficit | 54 | $0 |
| Wage / Income Gap (%) | 211 | 20.35% |
| Wage / Income Gap ($) | 211 | 79.65¢ per $1 |
| Gini / Inequality Index | 211 | 0.27 |
Earnings by Sex in Halibut Cove
Average Earnings in Halibut Cove are $53,958, $54,931 for men and $43,750 for women, a difference of 20.3%.
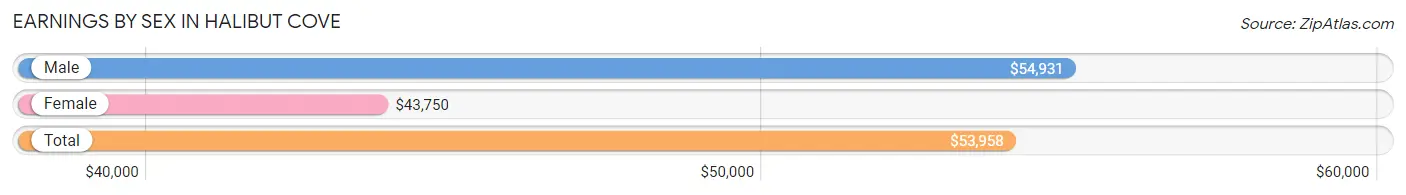
| Sex | Number | Average Earnings |
| Male | 53 (67.1%) | $54,931 |
| Female | 26 (32.9%) | $43,750 |
| Total | 79 (100.0%) | $53,958 |
Earnings by Sex by Income Bracket in Halibut Cove
The most common earnings brackets in Halibut Cove are $50,000 to $54,999 for men (18 | 34.0%) and $40,000 to $44,999 for women (14 | 53.8%).
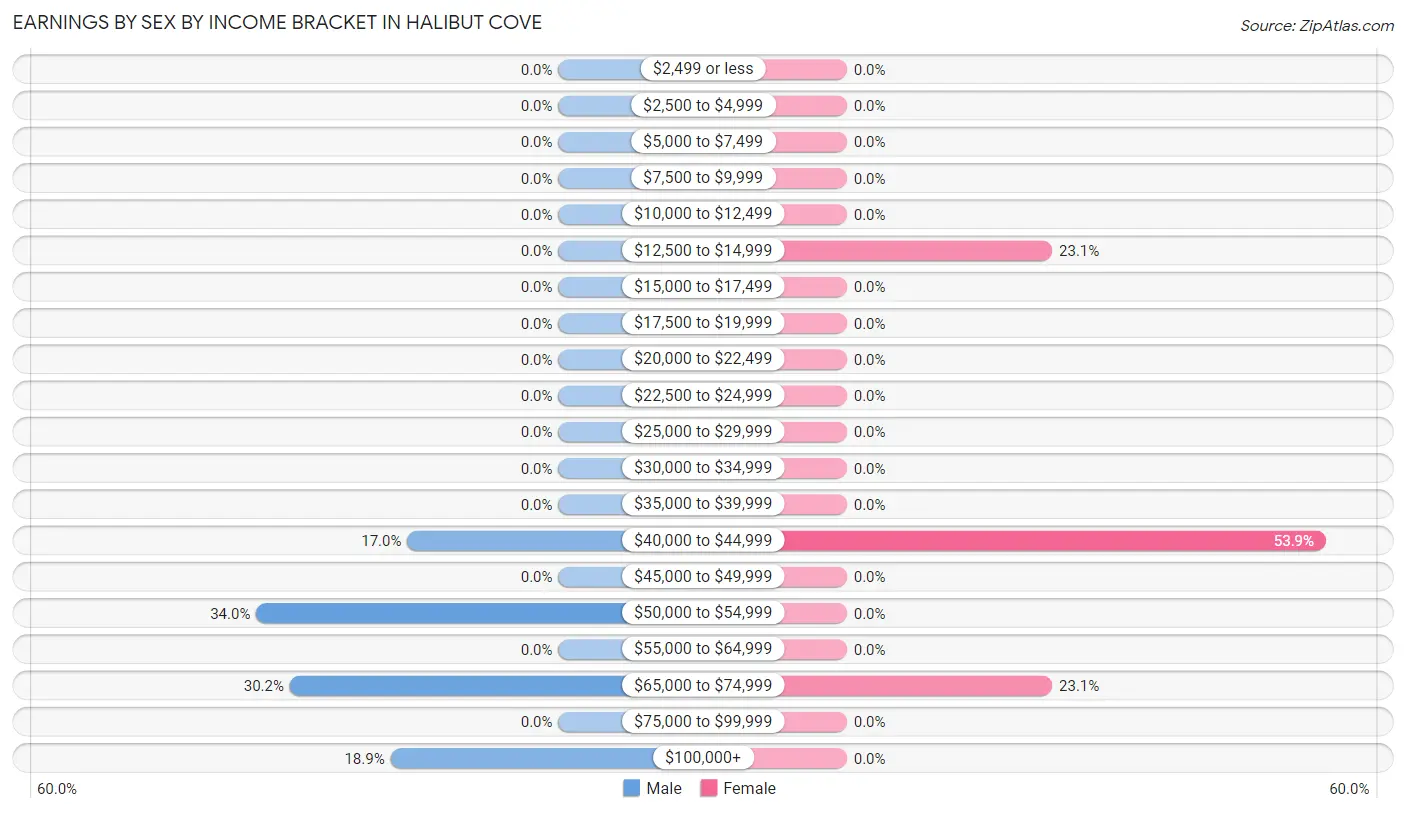
| Income | Male | Female |
| $2,499 or less | 0 (0.0%) | 0 (0.0%) |
| $2,500 to $4,999 | 0 (0.0%) | 0 (0.0%) |
| $5,000 to $7,499 | 0 (0.0%) | 0 (0.0%) |
| $7,500 to $9,999 | 0 (0.0%) | 0 (0.0%) |
| $10,000 to $12,499 | 0 (0.0%) | 0 (0.0%) |
| $12,500 to $14,999 | 0 (0.0%) | 6 (23.1%) |
| $15,000 to $17,499 | 0 (0.0%) | 0 (0.0%) |
| $17,500 to $19,999 | 0 (0.0%) | 0 (0.0%) |
| $20,000 to $22,499 | 0 (0.0%) | 0 (0.0%) |
| $22,500 to $24,999 | 0 (0.0%) | 0 (0.0%) |
| $25,000 to $29,999 | 0 (0.0%) | 0 (0.0%) |
| $30,000 to $34,999 | 0 (0.0%) | 0 (0.0%) |
| $35,000 to $39,999 | 0 (0.0%) | 0 (0.0%) |
| $40,000 to $44,999 | 9 (17.0%) | 14 (53.8%) |
| $45,000 to $49,999 | 0 (0.0%) | 0 (0.0%) |
| $50,000 to $54,999 | 18 (34.0%) | 0 (0.0%) |
| $55,000 to $64,999 | 0 (0.0%) | 0 (0.0%) |
| $65,000 to $74,999 | 16 (30.2%) | 6 (23.1%) |
| $75,000 to $99,999 | 0 (0.0%) | 0 (0.0%) |
| $100,000+ | 10 (18.9%) | 0 (0.0%) |
| Total | 53 (100.0%) | 26 (100.0%) |
Earnings by Sex by Educational Attainment in Halibut Cove
| Educational Attainment | Male Income | Female Income |
| Less than High School | - | - |
| High School Diploma | - | - |
| College or Associate's Degree | - | - |
| Bachelor's Degree | - | - |
| Graduate Degree | - | - |
| Total | $54,931 | $43,750 |
Family Income in Halibut Cove
Family Income Brackets in Halibut Cove
According to the Halibut Cove family income data, there are 20 families falling into the $100,000 to $149,999 income range, which is the most common income bracket and makes up 37.0% of all families.
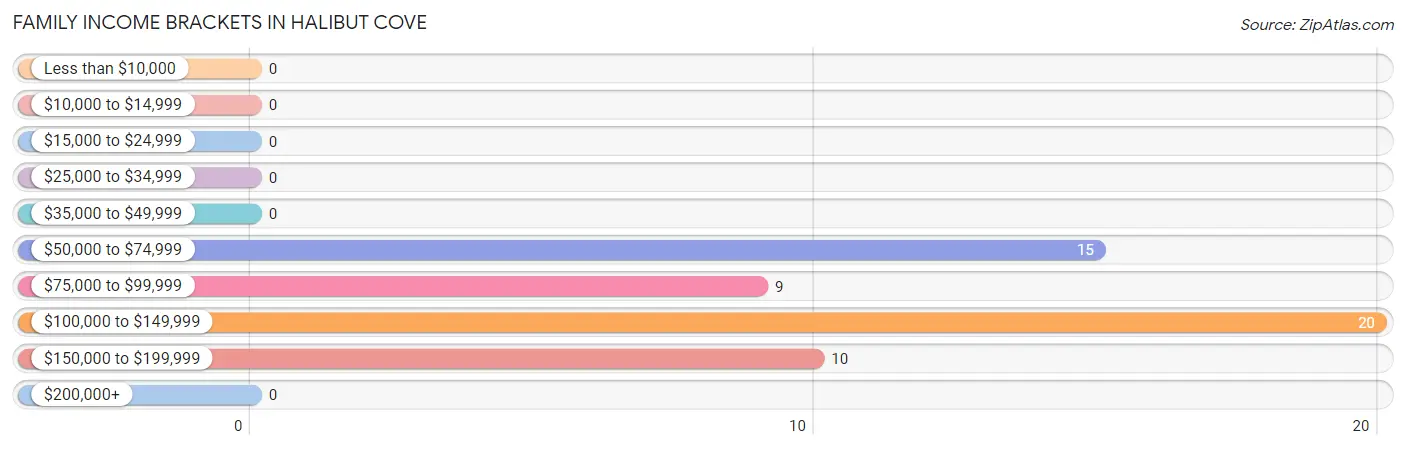
| Income Bracket | # Families | % Families |
| Less than $10,000 | 0 | 0.0% |
| $10,000 to $14,999 | 0 | 0.0% |
| $15,000 to $24,999 | 0 | 0.0% |
| $25,000 to $34,999 | 0 | 0.0% |
| $35,000 to $49,999 | 0 | 0.0% |
| $50,000 to $74,999 | 15 | 27.8% |
| $75,000 to $99,999 | 9 | 16.7% |
| $100,000 to $149,999 | 20 | 37.0% |
| $150,000 to $199,999 | 10 | 18.5% |
| $200,000+ | 0 | 0.0% |
Family Income by Famaliy Size in Halibut Cove
| Income Bracket | # Families | Median Income |
| 2-Person Families | 29 (53.7%) | $0 |
| 3-Person Families | 9 (16.7%) | $0 |
| 4-Person Families | 16 (29.6%) | $0 |
| 5-Person Families | 0 (0.0%) | $0 |
| 6-Person Families | 0 (0.0%) | $0 |
| 7+ Person Families | 0 (0.0%) | $0 |
| Total | 54 (100.0%) | $100,536 |
Family Income by Number of Earners in Halibut Cove
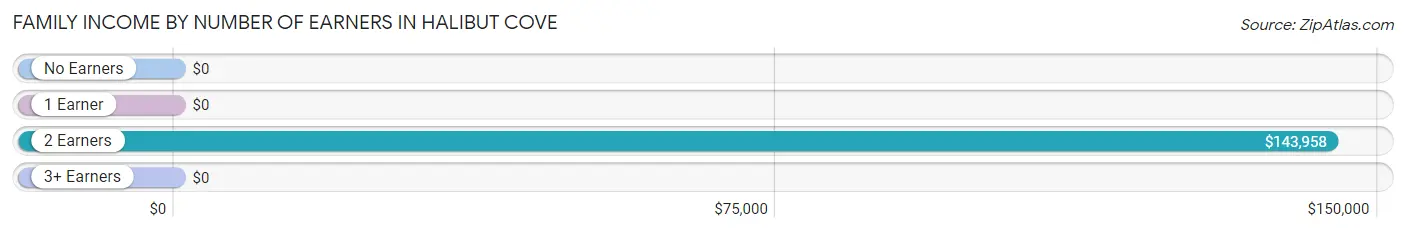
| Number of Earners | # Families | Median Income |
| No Earners | 29 (53.7%) | $0 |
| 1 Earner | 0 (0.0%) | $0 |
| 2 Earners | 25 (46.3%) | $143,958 |
| 3+ Earners | 0 (0.0%) | $0 |
| Total | 54 (100.0%) | $100,536 |
Household Income in Halibut Cove
Household Income Brackets in Halibut Cove
With 33 households falling in the category, the $50,000 to $74,999 income range is the most frequent in Halibut Cove, accounting for 42.9% of all households.
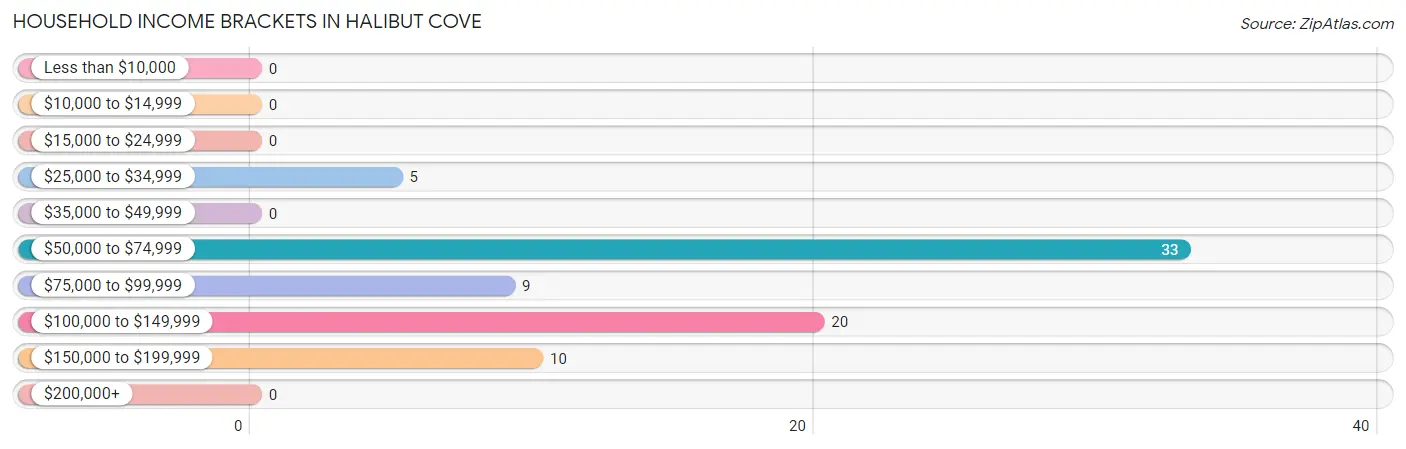
| Income Bracket | # Households | % Households |
| Less than $10,000 | 0 | 0.0% |
| $10,000 to $14,999 | 0 | 0.0% |
| $15,000 to $24,999 | 0 | 0.0% |
| $25,000 to $34,999 | 5 | 6.5% |
| $35,000 to $49,999 | 0 | 0.0% |
| $50,000 to $74,999 | 33 | 42.9% |
| $75,000 to $99,999 | 9 | 11.7% |
| $100,000 to $149,999 | 20 | 26.0% |
| $150,000 to $199,999 | 10 | 13.0% |
| $200,000+ | 0 | 0.0% |
Household Income by Householder Age in Halibut Cove
The median household income in Halibut Cove is $80,139, with the highest median household income of $80,417 found in the 65+ years age bracket for the primary householder. A total of 43 households (55.8%) fall into this category.
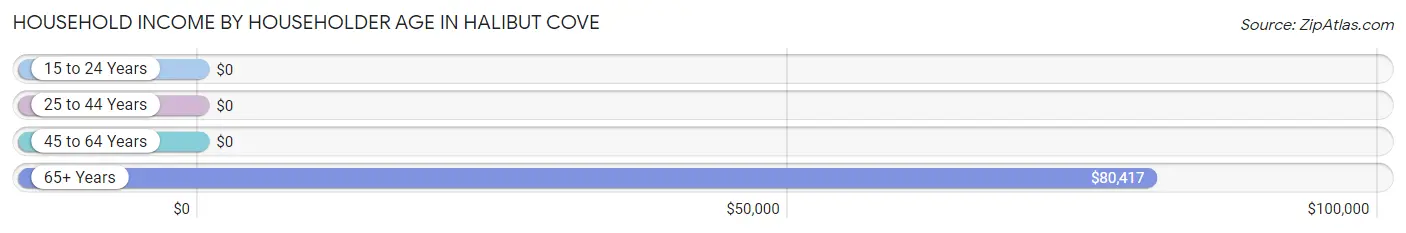
| Income Bracket | # Households | Median Income |
| 15 to 24 Years | 0 (0.0%) | $0 |
| 25 to 44 Years | 24 (31.2%) | $0 |
| 45 to 64 Years | 10 (13.0%) | $0 |
| 65+ Years | 43 (55.8%) | $80,417 |
| Total | 77 (100.0%) | $80,139 |
Poverty in Halibut Cove
Income Below Poverty by Sex and Age in Halibut Cove
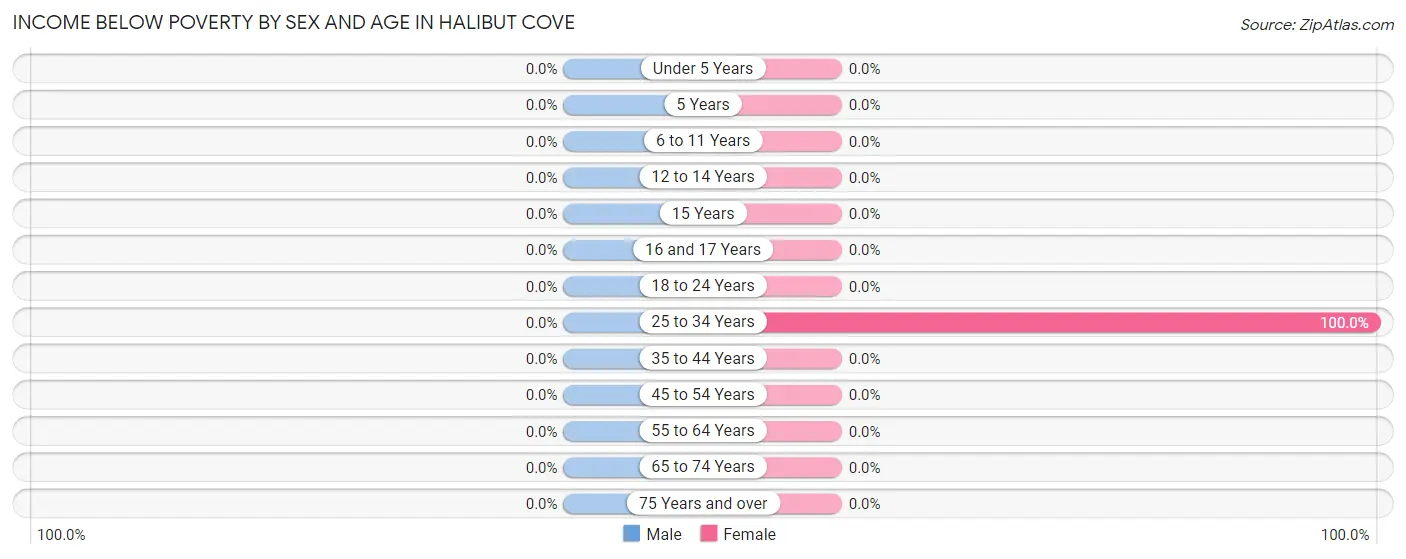
| Age Bracket | Male | Female |
| Under 5 Years | 0 (0.0%) | 0 (0.0%) |
| 5 Years | 0 (0.0%) | 0 (0.0%) |
| 6 to 11 Years | 0 (0.0%) | 0 (0.0%) |
| 12 to 14 Years | 0 (0.0%) | 0 (0.0%) |
| 15 Years | 0 (0.0%) | 0 (0.0%) |
| 16 and 17 Years | 0 (0.0%) | 0 (0.0%) |
| 18 to 24 Years | 0 (0.0%) | 0 (0.0%) |
| 25 to 34 Years | 0 (0.0%) | 12 (100.0%) |
| 35 to 44 Years | 0 (0.0%) | 0 (0.0%) |
| 45 to 54 Years | 0 (0.0%) | 0 (0.0%) |
| 55 to 64 Years | 0 (0.0%) | 0 (0.0%) |
| 65 to 74 Years | 0 (0.0%) | 0 (0.0%) |
| 75 Years and over | 0 (0.0%) | 0 (0.0%) |
| Total | 0 (0.0%) | 12 (14.8%) |
Income Above Poverty by Sex and Age in Halibut Cove
According to the poverty statistics in Halibut Cove, males aged 6 to 11 years and females aged 12 to 14 years are the age groups that are most secure financially, with 100.0% of males and 100.0% of females in these age groups living above the poverty line.
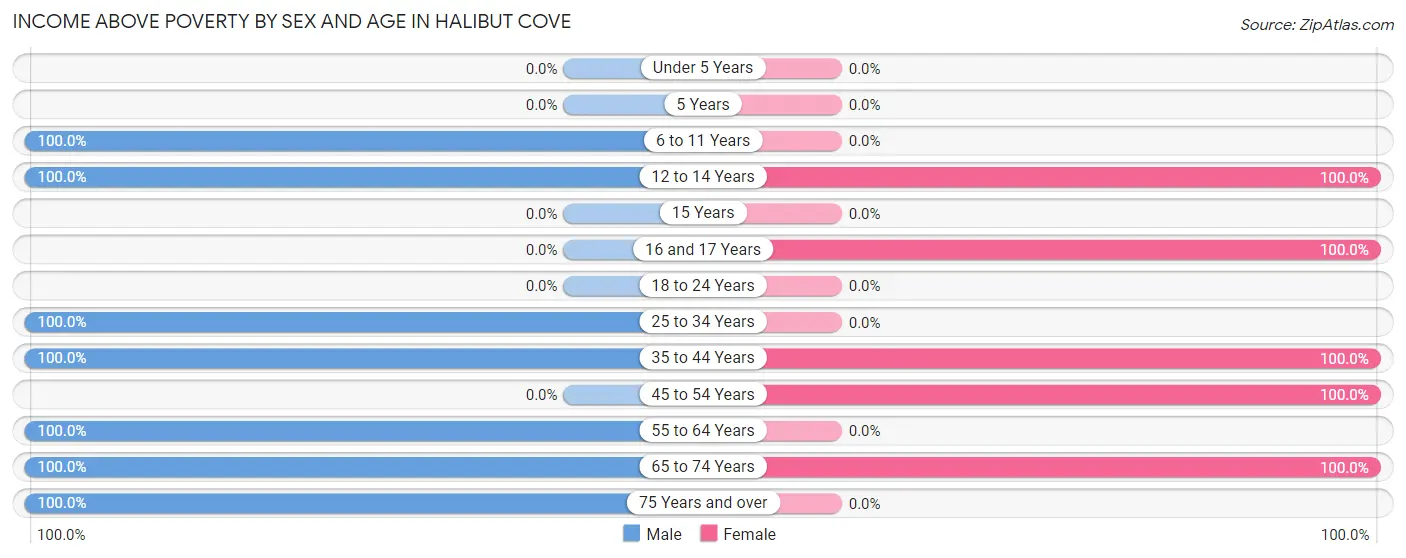
| Age Bracket | Male | Female |
| Under 5 Years | 0 (0.0%) | 0 (0.0%) |
| 5 Years | 0 (0.0%) | 0 (0.0%) |
| 6 to 11 Years | 31 (100.0%) | 0 (0.0%) |
| 12 to 14 Years | 12 (100.0%) | 11 (100.0%) |
| 15 Years | 0 (0.0%) | 0 (0.0%) |
| 16 and 17 Years | 0 (0.0%) | 4 (100.0%) |
| 18 to 24 Years | 0 (0.0%) | 0 (0.0%) |
| 25 to 34 Years | 18 (100.0%) | 0 (0.0%) |
| 35 to 44 Years | 16 (100.0%) | 6 (100.0%) |
| 45 to 54 Years | 0 (0.0%) | 14 (100.0%) |
| 55 to 64 Years | 10 (100.0%) | 0 (0.0%) |
| 65 to 74 Years | 38 (100.0%) | 34 (100.0%) |
| 75 Years and over | 5 (100.0%) | 0 (0.0%) |
| Total | 130 (100.0%) | 69 (85.2%) |
Income Below Poverty Among Married-Couple Families in Halibut Cove
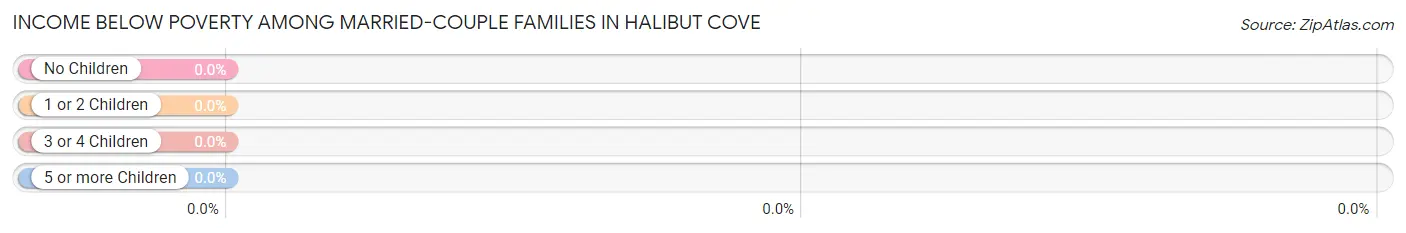
| Children | Above Poverty | Below Poverty |
| No Children | 29 (100.0%) | 0 (0.0%) |
| 1 or 2 Children | 25 (100.0%) | 0 (0.0%) |
| 3 or 4 Children | 0 (0.0%) | 0 (0.0%) |
| 5 or more Children | 0 (0.0%) | 0 (0.0%) |
| Total | 54 (100.0%) | 0 (0.0%) |
Income Below Poverty Among Single-Parent Households in Halibut Cove
| Children | Single Father | Single Mother |
| No Children | 0 (0.0%) | 0 (0.0%) |
| 1 or 2 Children | 0 (0.0%) | 0 (0.0%) |
| 3 or 4 Children | 0 (0.0%) | 0 (0.0%) |
| 5 or more Children | 0 (0.0%) | 0 (0.0%) |
| Total | 0 (0.0%) | 0 (0.0%) |
Income Below Poverty Among Married-Couple vs Single-Parent Households in Halibut Cove
| Children | Married-Couple Families | Single-Parent Households |
| No Children | 0 (0.0%) | 0 (0.0%) |
| 1 or 2 Children | 0 (0.0%) | 0 (0.0%) |
| 3 or 4 Children | 0 (0.0%) | 0 (0.0%) |
| 5 or more Children | 0 (0.0%) | 0 (0.0%) |
| Total | 0 (0.0%) | 0 (0.0%) |
Race in Halibut Cove
The most populous races in Halibut Cove are White / Caucasian (158 | 74.9%), Two or more Races (47 | 22.3%), and Native / Alaskan (6 | 2.8%).
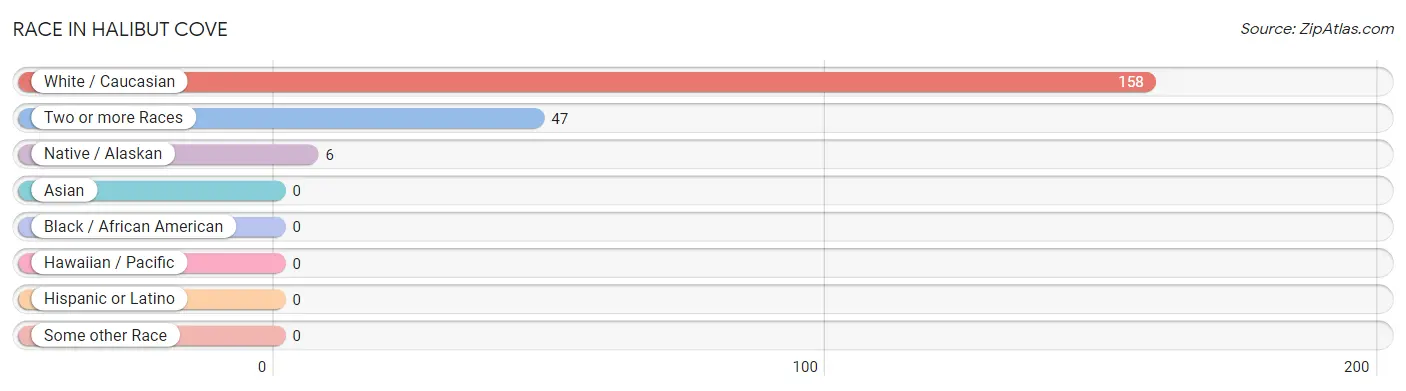
| Race | # Population | % Population |
| Asian | 0 | 0.0% |
| Black / African American | 0 | 0.0% |
| Hawaiian / Pacific | 0 | 0.0% |
| Hispanic or Latino | 0 | 0.0% |
| Native / Alaskan | 6 | 2.8% |
| White / Caucasian | 158 | 74.9% |
| Two or more Races | 47 | 22.3% |
| Some other Race | 0 | 0.0% |
| Total | 211 | 100.0% |
Ancestry in Halibut Cove
The most populous ancestries reported in Halibut Cove are English (58 | 27.5%), Cherokee (53 | 25.1%), German (49 | 23.2%), Scotch-Irish (29 | 13.7%), and Irish (18 | 8.5%), together accounting for 98.1% of all Halibut Cove residents.
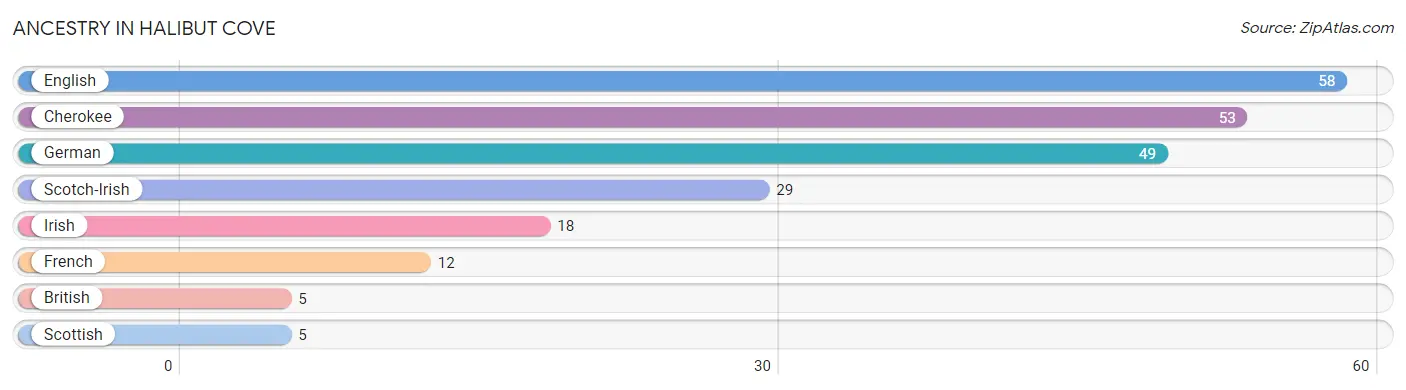
| Ancestry | # Population | % Population |
| British | 5 | 2.4% |
| Cherokee | 53 | 25.1% |
| English | 58 | 27.5% |
| French | 12 | 5.7% |
| German | 49 | 23.2% |
| Irish | 18 | 8.5% |
| Scotch-Irish | 29 | 13.7% |
| Scottish | 5 | 2.4% | View All 8 Rows |
Immigrants in Halibut Cove

| Immigration Origin | # Population | % Population | View All 0 Rows |
Sex and Age in Halibut Cove
Sex and Age in Halibut Cove
The most populous age groups in Halibut Cove are 70 to 74 Years (29 | 22.3%) for men and 65 to 69 Years (34 | 42.0%) for women.
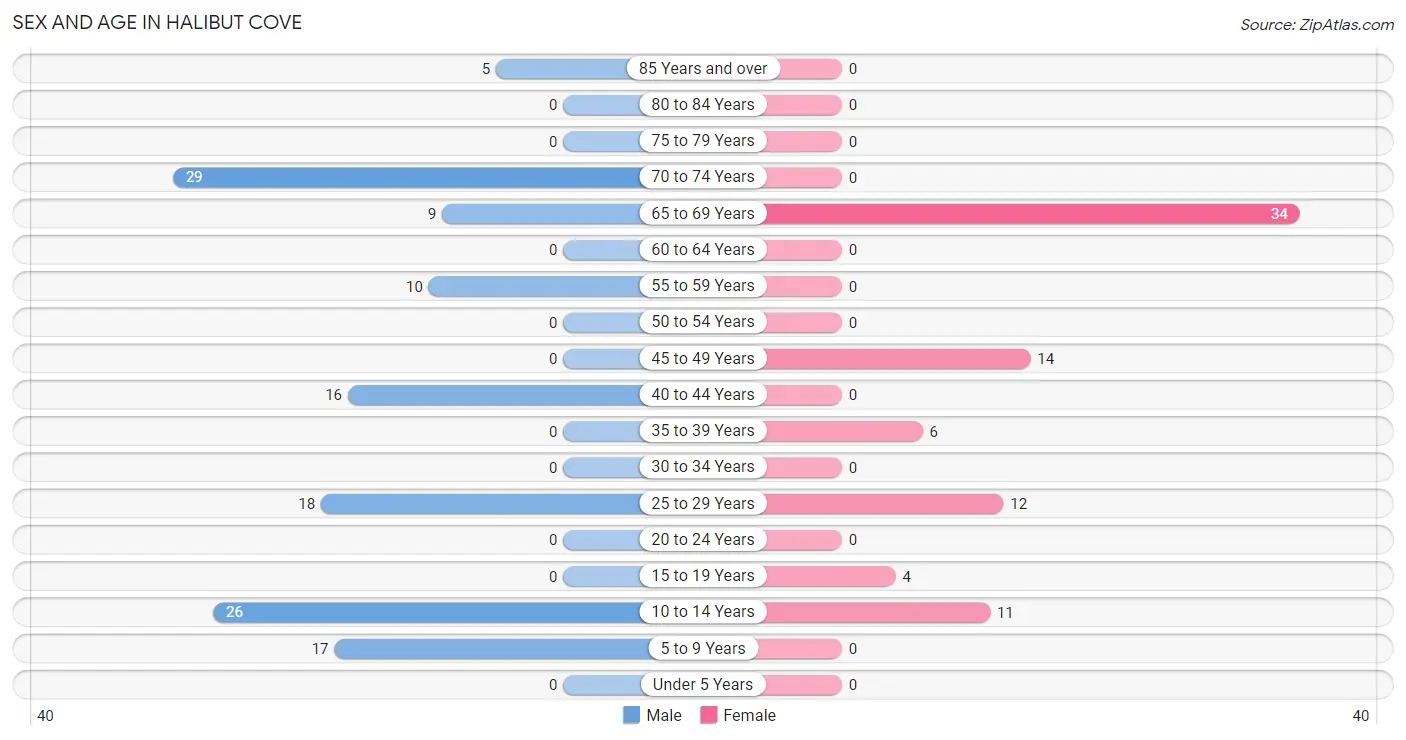
| Age Bracket | Male | Female |
| Under 5 Years | 0 (0.0%) | 0 (0.0%) |
| 5 to 9 Years | 17 (13.1%) | 0 (0.0%) |
| 10 to 14 Years | 26 (20.0%) | 11 (13.6%) |
| 15 to 19 Years | 0 (0.0%) | 4 (4.9%) |
| 20 to 24 Years | 0 (0.0%) | 0 (0.0%) |
| 25 to 29 Years | 18 (13.9%) | 12 (14.8%) |
| 30 to 34 Years | 0 (0.0%) | 0 (0.0%) |
| 35 to 39 Years | 0 (0.0%) | 6 (7.4%) |
| 40 to 44 Years | 16 (12.3%) | 0 (0.0%) |
| 45 to 49 Years | 0 (0.0%) | 14 (17.3%) |
| 50 to 54 Years | 0 (0.0%) | 0 (0.0%) |
| 55 to 59 Years | 10 (7.7%) | 0 (0.0%) |
| 60 to 64 Years | 0 (0.0%) | 0 (0.0%) |
| 65 to 69 Years | 9 (6.9%) | 34 (42.0%) |
| 70 to 74 Years | 29 (22.3%) | 0 (0.0%) |
| 75 to 79 Years | 0 (0.0%) | 0 (0.0%) |
| 80 to 84 Years | 0 (0.0%) | 0 (0.0%) |
| 85 Years and over | 5 (3.8%) | 0 (0.0%) |
| Total | 130 (100.0%) | 81 (100.0%) |
Families and Households in Halibut Cove
Median Family Size in Halibut Cove
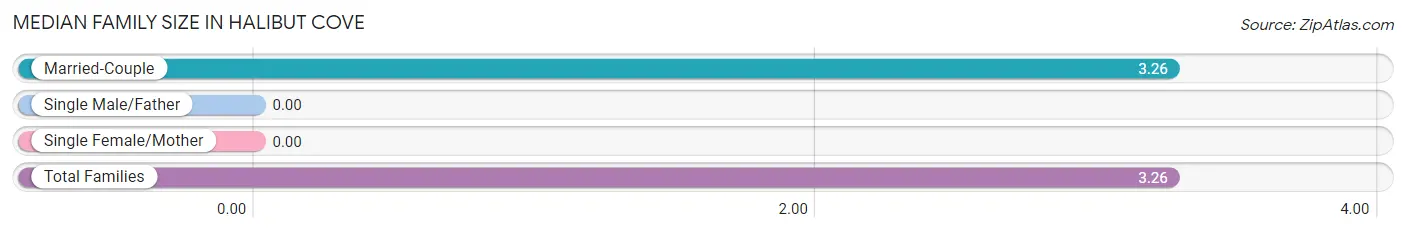
| Family Type | # Families | Family Size |
| Married-Couple | 54 (100.0%) | 3.26 |
| Single Male/Father | 0 (0.0%) | - |
| Single Female/Mother | 0 (0.0%) | - |
| Total Families | 54 (100.0%) | 3.26 |
Median Household Size in Halibut Cove
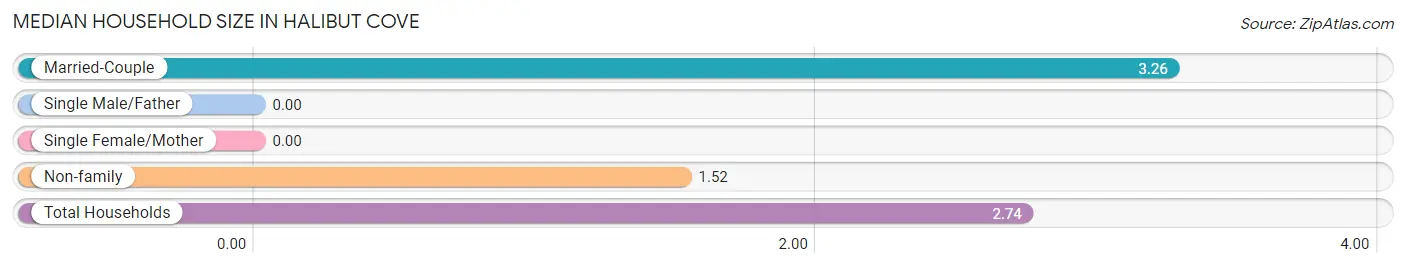
| Household Type | # Households | Household Size |
| Married-Couple | 54 (70.1%) | 3.26 |
| Single Male/Father | 0 (0.0%) | - |
| Single Female/Mother | 0 (0.0%) | - |
| Non-family | 23 (29.9%) | 1.52 |
| Total Households | 77 (100.0%) | 2.74 |
Household Size by Marriage Status in Halibut Cove
Out of a total of 77 households in Halibut Cove, 54 (70.1%) are family households, while 23 (29.9%) are nonfamily households. The most numerous type of family households are 2-person households, comprising 29, and the most common type of nonfamily households are 2-person households, comprising 18.
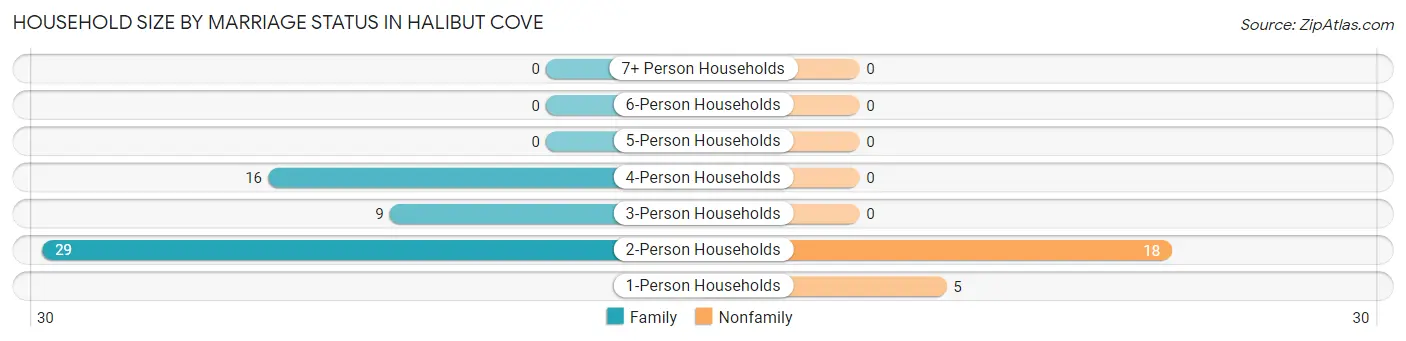
| Household Size | Family Households | Nonfamily Households |
| 1-Person Households | - | 5 (6.5%) |
| 2-Person Households | 29 (37.7%) | 18 (23.4%) |
| 3-Person Households | 9 (11.7%) | 0 (0.0%) |
| 4-Person Households | 16 (20.8%) | 0 (0.0%) |
| 5-Person Households | 0 (0.0%) | 0 (0.0%) |
| 6-Person Households | 0 (0.0%) | 0 (0.0%) |
| 7+ Person Households | 0 (0.0%) | 0 (0.0%) |
| Total | 54 (70.1%) | 23 (29.9%) |
Female Fertility in Halibut Cove
Fertility by Age in Halibut Cove
| Age Bracket | Women with Births | Births / 1,000 Women |
| 15 to 19 years | 0 (0.0%) | 0.0 |
| 20 to 34 years | 0 (0.0%) | 0.0 |
| 35 to 50 years | 0 (0.0%) | 0.0 |
| Total | 0 (0.0%) | 0.0 |
Fertility by Age by Marriage Status in Halibut Cove
| Age Bracket | Married | Unmarried |
| 15 to 19 years | 0 (0.0%) | 0 (0.0%) |
| 20 to 34 years | 0 (0.0%) | 0 (0.0%) |
| 35 to 50 years | 0 (0.0%) | 0 (0.0%) |
| Total | 0 (0.0%) | 0 (0.0%) |
Fertility by Education in Halibut Cove
| Educational Attainment | Women with Births | Births / 1,000 Women |
| Less than High School | 0 (0.0%) | 0.0 |
| High School Diploma | 0 (0.0%) | 0.0 |
| College or Associate's Degree | 0 (0.0%) | 0.0 |
| Bachelor's Degree | 0 (0.0%) | 0.0 |
| Graduate Degree | 0 (0.0%) | 0.0 |
| Total | 0 (0.0%) | 0.0 |
Fertility by Education by Marriage Status in Halibut Cove
| Educational Attainment | Married | Unmarried |
| Less than High School | 0 (0.0%) | 0 (0.0%) |
| High School Diploma | 0 (0.0%) | 0 (0.0%) |
| College or Associate's Degree | 0 (0.0%) | 0 (0.0%) |
| Bachelor's Degree | 0 (0.0%) | 0 (0.0%) |
| Graduate Degree | 0 (0.0%) | 0 (0.0%) |
| Total | 0 (0.0%) | 0 (0.0%) |
Employment Characteristics in Halibut Cove
Employment by Class of Employer in Halibut Cove
Among the 64 employed individuals in Halibut Cove, private company employees (22 | 34.4%), self-employed (not incorporated) (18 | 28.1%), and local government employees (14 | 21.9%) make up the most common classes of employment.
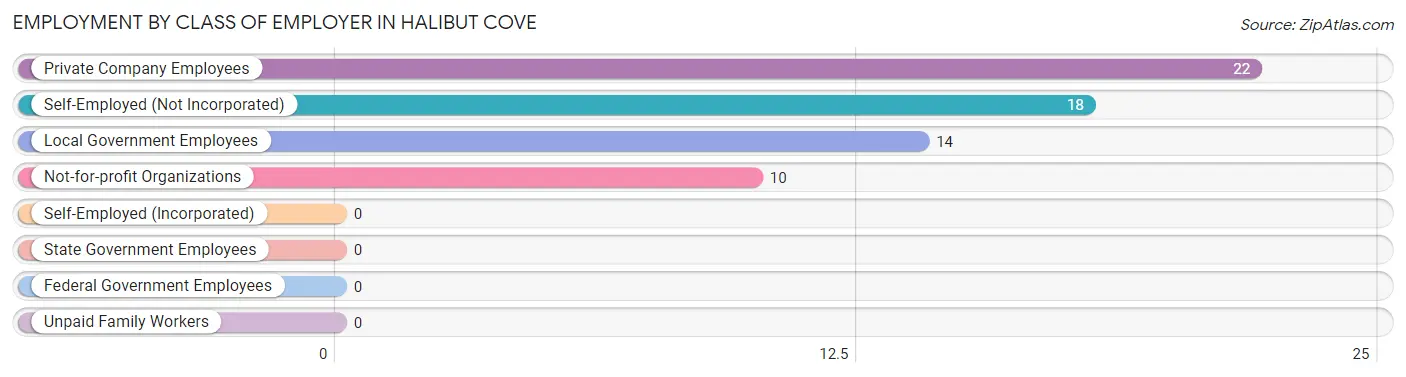
| Employer Class | # Employees | % Employees |
| Private Company Employees | 22 | 34.4% |
| Self-Employed (Incorporated) | 0 | 0.0% |
| Self-Employed (Not Incorporated) | 18 | 28.1% |
| Not-for-profit Organizations | 10 | 15.6% |
| Local Government Employees | 14 | 21.9% |
| State Government Employees | 0 | 0.0% |
| Federal Government Employees | 0 | 0.0% |
| Unpaid Family Workers | 0 | 0.0% |
| Total | 64 | 100.0% |
Employment Status by Age in Halibut Cove
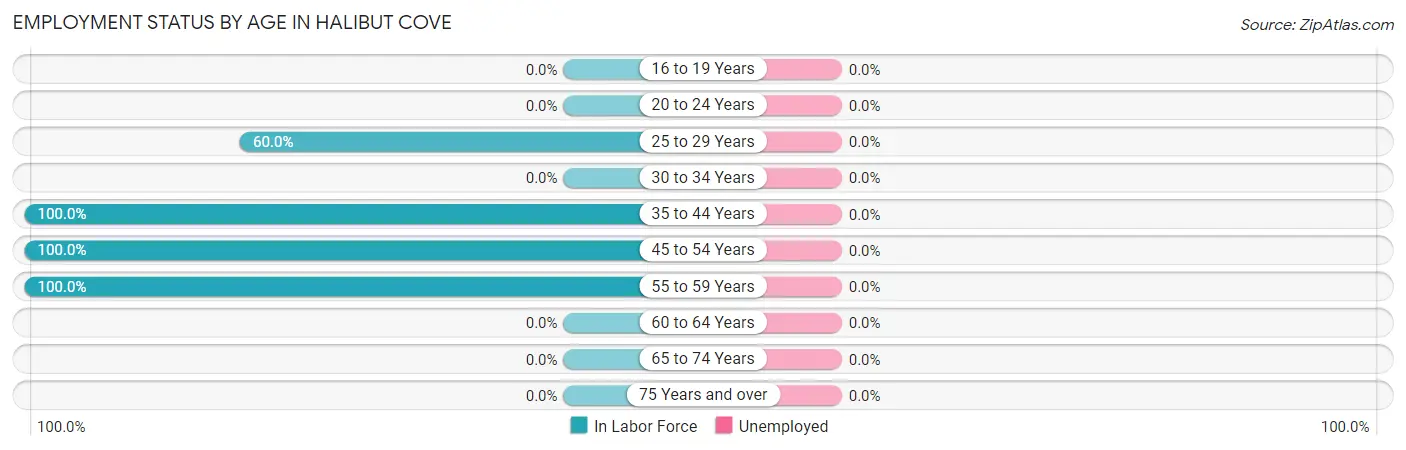
| Age Bracket | In Labor Force | Unemployed |
| 16 to 19 Years | 0 (0.0%) | 0 (0.0%) |
| 20 to 24 Years | 0 (0.0%) | 0 (0.0%) |
| 25 to 29 Years | 18 (60.0%) | 0 (0.0%) |
| 30 to 34 Years | 0 (0.0%) | 0 (0.0%) |
| 35 to 44 Years | 22 (100.0%) | 0 (0.0%) |
| 45 to 54 Years | 14 (100.0%) | 0 (0.0%) |
| 55 to 59 Years | 10 (100.0%) | 0 (0.0%) |
| 60 to 64 Years | 0 (0.0%) | 0 (0.0%) |
| 65 to 74 Years | 0 (0.0%) | 0 (0.0%) |
| 75 Years and over | 0 (0.0%) | 0 (0.0%) |
| Total | 64 (40.8%) | 0 (0.0%) |
Employment Status by Educational Attainment in Halibut Cove
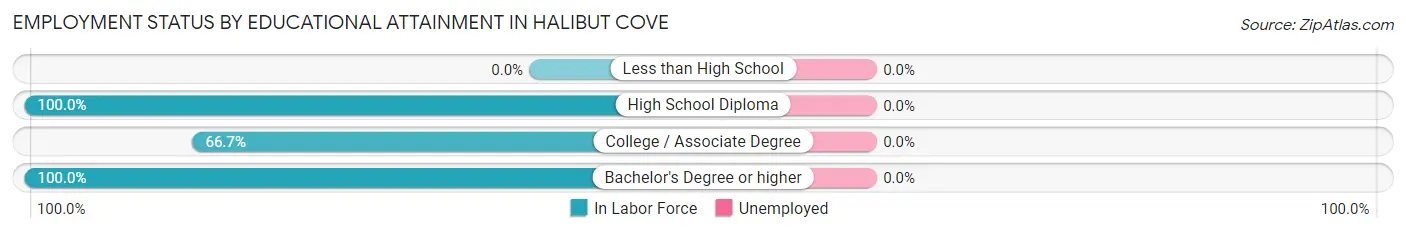
| Educational Attainment | In Labor Force | Unemployed |
| Less than High School | 0 (0.0%) | 0 (0.0%) |
| High School Diploma | 26 (100.0%) | 0 (0.0%) |
| College / Associate Degree | 24 (66.7%) | 0 (0.0%) |
| Bachelor's Degree or higher | 14 (100.0%) | 0 (0.0%) |
| Total | 64 (84.2%) | 0 (0.0%) |
Employment Occupations by Sex in Halibut Cove
Management, Business, Science and Arts Occupations
The most common Management, Business, Science and Arts occupations in Halibut Cove are Health Diagnosing & Treating (14 | 21.9%), Health Technologists (14 | 21.9%), Computers, Engineering & Science (10 | 15.6%), and Architecture & Engineering (10 | 15.6%).
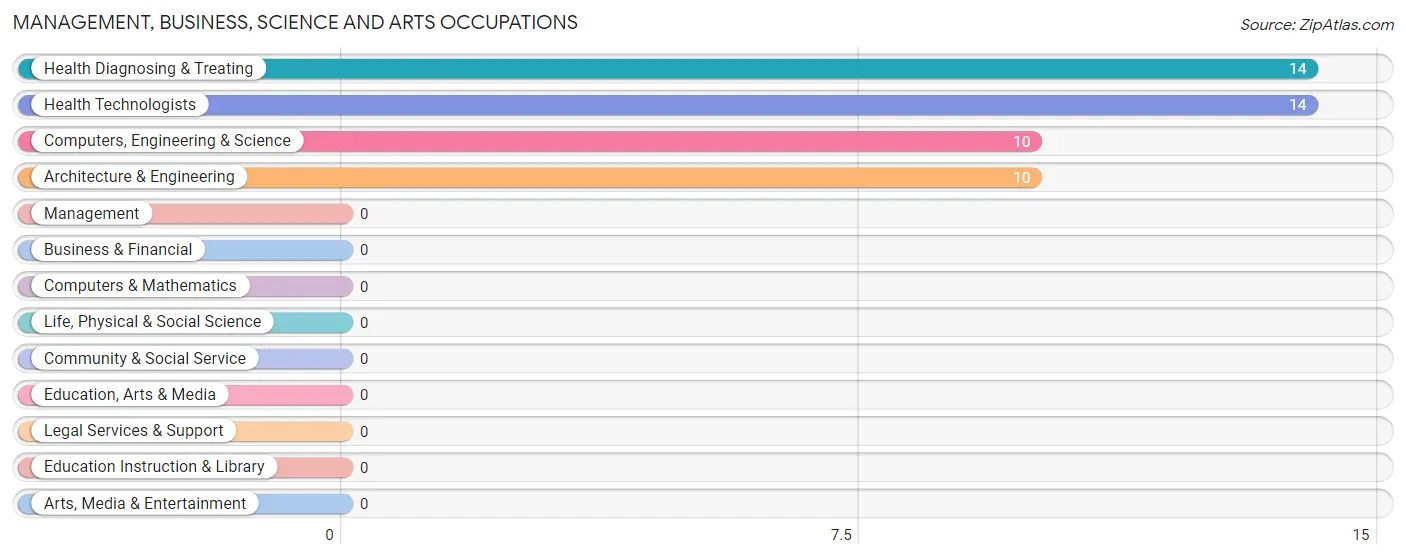
Management, Business, Science and Arts Occupations by Sex
Within the Management, Business, Science and Arts occupations in Halibut Cove, the most male-oriented occupations are Computers, Engineering & Science (100.0%), and Architecture & Engineering (100.0%), while the most female-oriented occupations are Health Diagnosing & Treating (100.0%), and Health Technologists (100.0%).
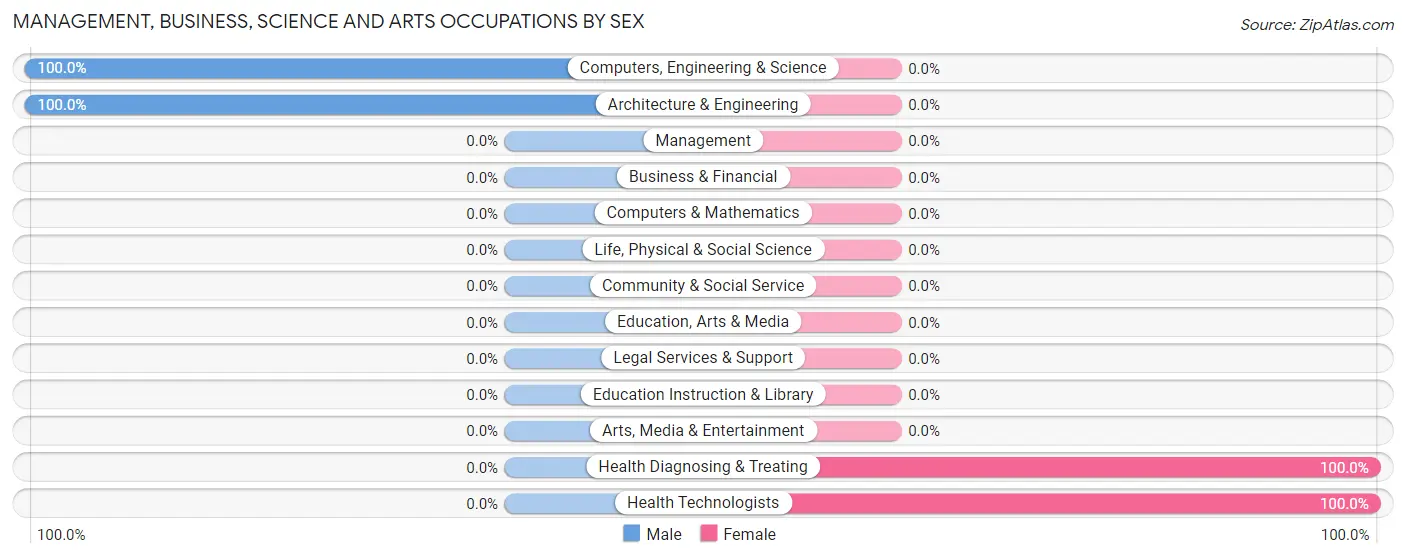
| Occupation | Male | Female |
| Management | 0 (0.0%) | 0 (0.0%) |
| Business & Financial | 0 (0.0%) | 0 (0.0%) |
| Computers, Engineering & Science | 10 (100.0%) | 0 (0.0%) |
| Computers & Mathematics | 0 (0.0%) | 0 (0.0%) |
| Architecture & Engineering | 10 (100.0%) | 0 (0.0%) |
| Life, Physical & Social Science | 0 (0.0%) | 0 (0.0%) |
| Community & Social Service | 0 (0.0%) | 0 (0.0%) |
| Education, Arts & Media | 0 (0.0%) | 0 (0.0%) |
| Legal Services & Support | 0 (0.0%) | 0 (0.0%) |
| Education Instruction & Library | 0 (0.0%) | 0 (0.0%) |
| Arts, Media & Entertainment | 0 (0.0%) | 0 (0.0%) |
| Health Diagnosing & Treating | 0 (0.0%) | 14 (100.0%) |
| Health Technologists | 0 (0.0%) | 14 (100.0%) |
| Total (Category) | 10 (41.7%) | 14 (58.3%) |
| Total (Overall) | 44 (68.8%) | 20 (31.2%) |
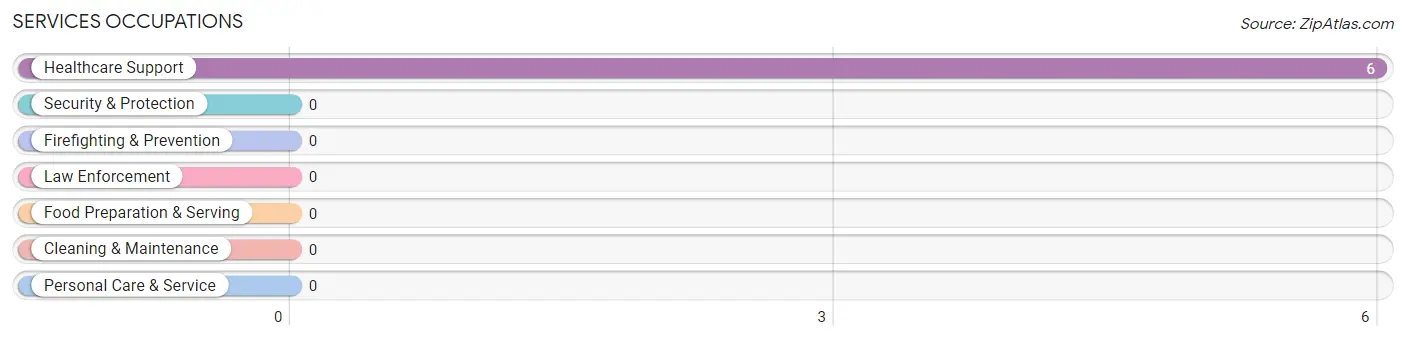
Services Occupations
The most common Services occupations in Halibut Cove are , and Healthcare Support (6 | 9.4%).
Services Occupations by Sex
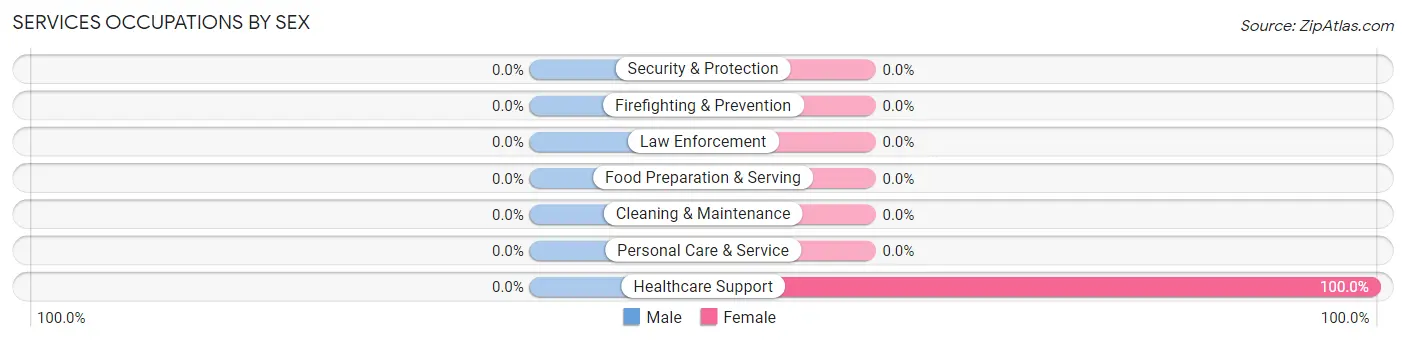
| Occupation | Male | Female |
| Healthcare Support | 0 (0.0%) | 6 (100.0%) |
| Security & Protection | 0 (0.0%) | 0 (0.0%) |
| Firefighting & Prevention | 0 (0.0%) | 0 (0.0%) |
| Law Enforcement | 0 (0.0%) | 0 (0.0%) |
| Food Preparation & Serving | 0 (0.0%) | 0 (0.0%) |
| Cleaning & Maintenance | 0 (0.0%) | 0 (0.0%) |
| Personal Care & Service | 0 (0.0%) | 0 (0.0%) |
| Total (Category) | 0 (0.0%) | 6 (100.0%) |
| Total (Overall) | 44 (68.8%) | 20 (31.2%) |
Sales and Office Occupations
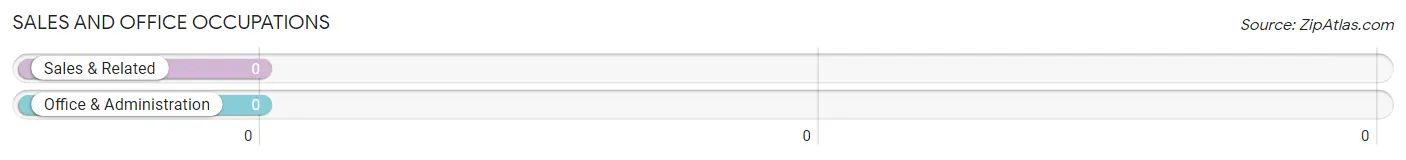
Sales and Office Occupations by Sex
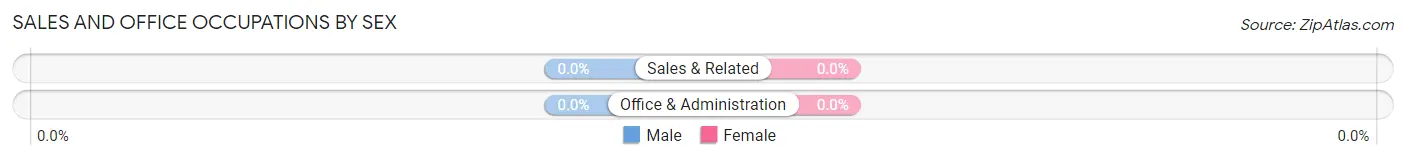
| Occupation | Male | Female |
| Sales & Related | 0 (0.0%) | 0 (0.0%) |
| Office & Administration | 0 (0.0%) | 0 (0.0%) |
| Total (Category) | 0 (0.0%) | 0 (0.0%) |
| Total (Overall) | 44 (68.8%) | 20 (31.2%) |
Natural Resources, Construction and Maintenance Occupations
The most common Natural Resources, Construction and Maintenance occupations in Halibut Cove are Farming, Fishing & Forestry (18 | 28.1%), and Installation, Maintenance & Repair (16 | 25.0%).
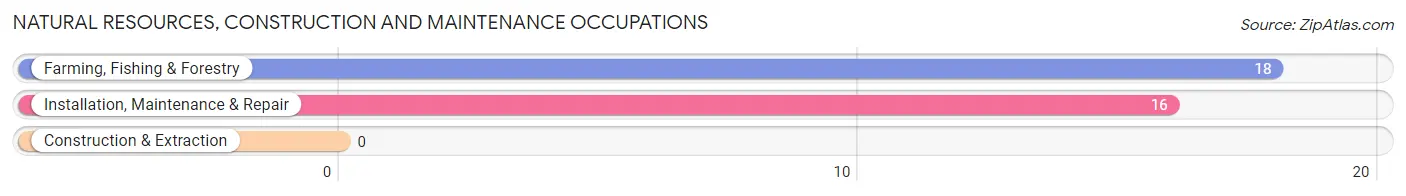
Natural Resources, Construction and Maintenance Occupations by Sex
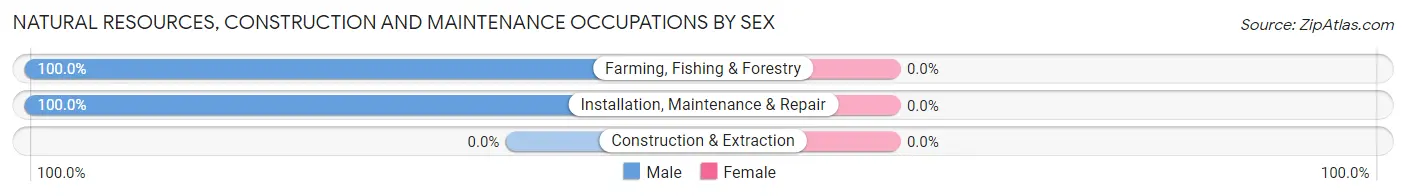
| Occupation | Male | Female |
| Farming, Fishing & Forestry | 18 (100.0%) | 0 (0.0%) |
| Construction & Extraction | 0 (0.0%) | 0 (0.0%) |
| Installation, Maintenance & Repair | 16 (100.0%) | 0 (0.0%) |
| Total (Category) | 34 (100.0%) | 0 (0.0%) |
| Total (Overall) | 44 (68.8%) | 20 (31.2%) |
Production, Transportation and Moving Occupations
Production, Transportation and Moving Occupations by Sex
| Occupation | Male | Female |
| Production | 0 (0.0%) | 0 (0.0%) |
| Transportation | 0 (0.0%) | 0 (0.0%) |
| Material Moving | 0 (0.0%) | 0 (0.0%) |
| Total (Category) | 0 (0.0%) | 0 (0.0%) |
| Total (Overall) | 44 (68.8%) | 20 (31.2%) |
Employment Industries by Sex in Halibut Cove
Employment Industries in Halibut Cove
The major employment industries in Halibut Cove include Agriculture, Fishing & Hunting (18 | 28.1%), Transportation & Warehousing (16 | 25.0%), Educational Services (14 | 21.9%), Professional & Scientific (10 | 15.6%), and Health Care & Social Assistance (6 | 9.4%).
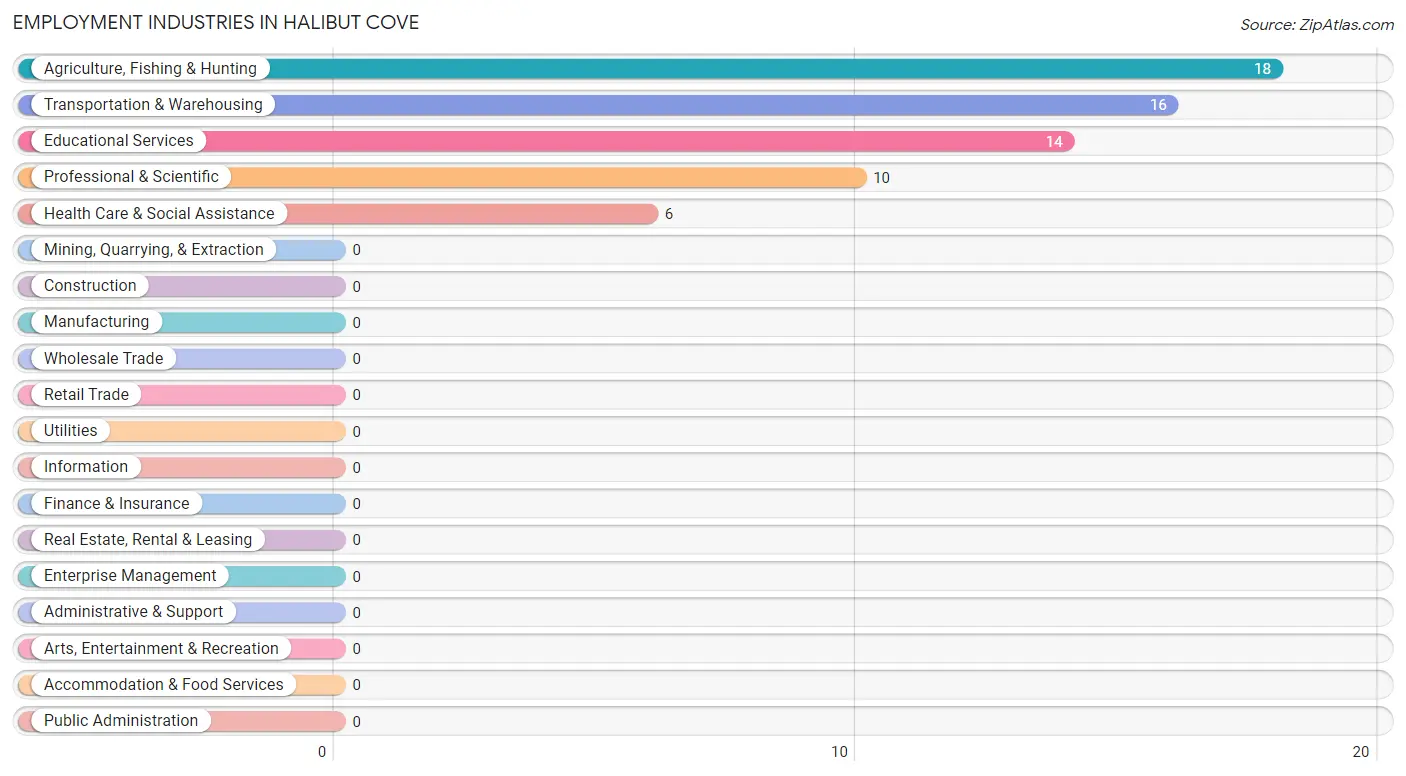
Employment Industries by Sex in Halibut Cove
The Halibut Cove industries that see more men than women are Agriculture, Fishing & Hunting (100.0%), Transportation & Warehousing (100.0%), and Professional & Scientific (100.0%), whereas the industries that tend to have a higher number of women are Educational Services (100.0%), and Health Care & Social Assistance (100.0%).
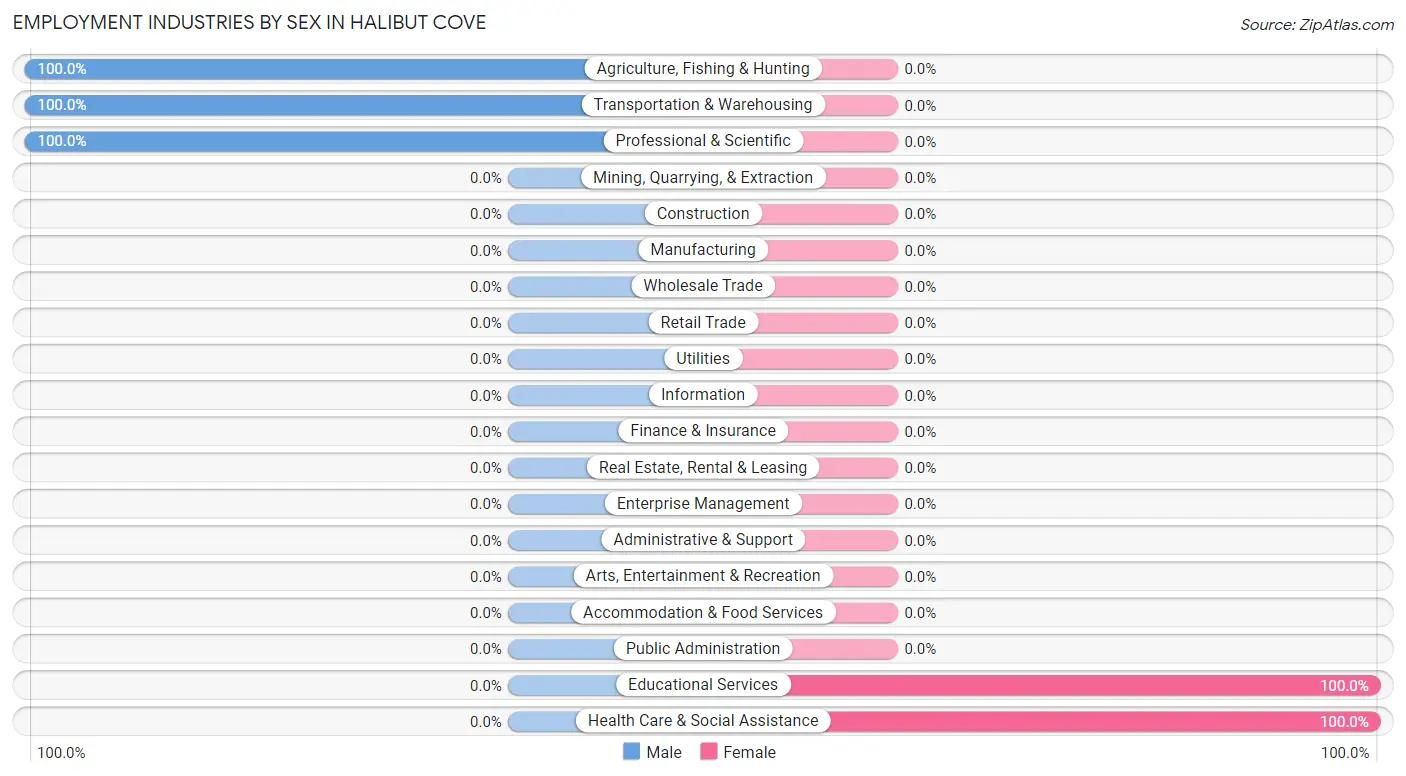
| Industry | Male | Female |
| Agriculture, Fishing & Hunting | 18 (100.0%) | 0 (0.0%) |
| Mining, Quarrying, & Extraction | 0 (0.0%) | 0 (0.0%) |
| Construction | 0 (0.0%) | 0 (0.0%) |
| Manufacturing | 0 (0.0%) | 0 (0.0%) |
| Wholesale Trade | 0 (0.0%) | 0 (0.0%) |
| Retail Trade | 0 (0.0%) | 0 (0.0%) |
| Transportation & Warehousing | 16 (100.0%) | 0 (0.0%) |
| Utilities | 0 (0.0%) | 0 (0.0%) |
| Information | 0 (0.0%) | 0 (0.0%) |
| Finance & Insurance | 0 (0.0%) | 0 (0.0%) |
| Real Estate, Rental & Leasing | 0 (0.0%) | 0 (0.0%) |
| Professional & Scientific | 10 (100.0%) | 0 (0.0%) |
| Enterprise Management | 0 (0.0%) | 0 (0.0%) |
| Administrative & Support | 0 (0.0%) | 0 (0.0%) |
| Educational Services | 0 (0.0%) | 14 (100.0%) |
| Health Care & Social Assistance | 0 (0.0%) | 6 (100.0%) |
| Arts, Entertainment & Recreation | 0 (0.0%) | 0 (0.0%) |
| Accommodation & Food Services | 0 (0.0%) | 0 (0.0%) |
| Public Administration | 0 (0.0%) | 0 (0.0%) |
| Total | 44 (68.8%) | 20 (31.2%) |
Education in Halibut Cove
School Enrollment in Halibut Cove
The most common levels of schooling among the 72 students in Halibut Cove are middle school (26 | 36.1%), elementary school (17 | 23.6%), and high school (15 | 20.8%).
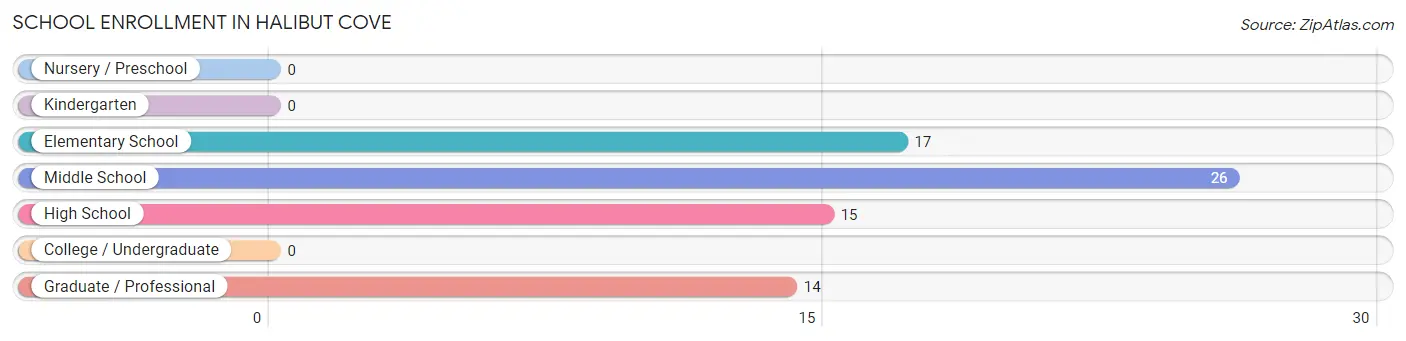
| School Level | # Students | % Students |
| Nursery / Preschool | 0 | 0.0% |
| Kindergarten | 0 | 0.0% |
| Elementary School | 17 | 23.6% |
| Middle School | 26 | 36.1% |
| High School | 15 | 20.8% |
| College / Undergraduate | 0 | 0.0% |
| Graduate / Professional | 14 | 19.4% |
| Total | 72 | 100.0% |
School Enrollment by Age by Funding Source in Halibut Cove
Out of a total of 72 students who are enrolled in schools in Halibut Cove, 57 (79.2%) attend a private institution, while the remaining 15 (20.8%) are enrolled in public schools. The age group of 5 to 9 year old has the highest likelihood of being enrolled in private schools, with 17 (100.0% in the age bracket) enrolled. Conversely, the age group of 15 to 17 year olds has the lowest likelihood of being enrolled in a private school, with 4 (100.0% in the age bracket) attending a public institution.
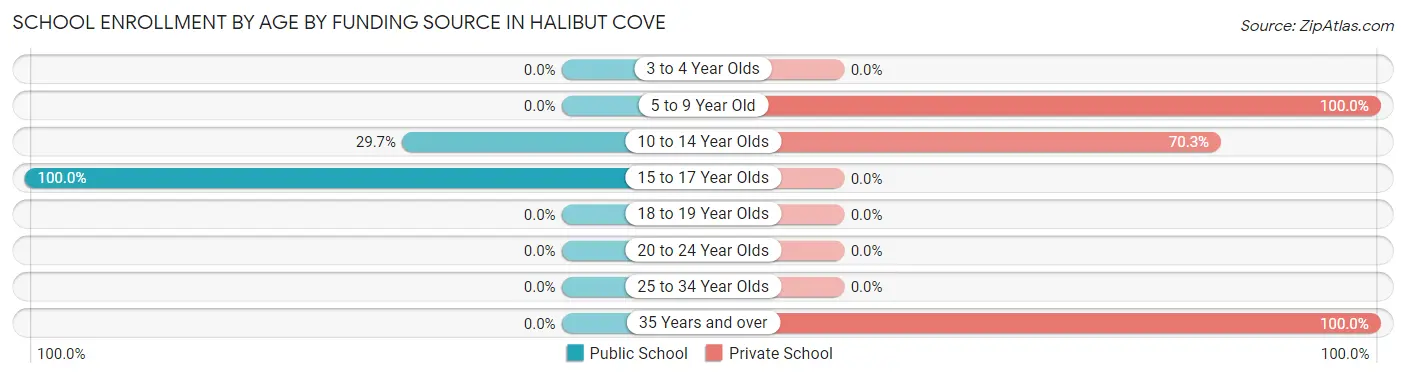
| Age Bracket | Public School | Private School |
| 3 to 4 Year Olds | 0 (0.0%) | 0 (0.0%) |
| 5 to 9 Year Old | 0 (0.0%) | 17 (100.0%) |
| 10 to 14 Year Olds | 11 (29.7%) | 26 (70.3%) |
| 15 to 17 Year Olds | 4 (100.0%) | 0 (0.0%) |
| 18 to 19 Year Olds | 0 (0.0%) | 0 (0.0%) |
| 20 to 24 Year Olds | 0 (0.0%) | 0 (0.0%) |
| 25 to 34 Year Olds | 0 (0.0%) | 0 (0.0%) |
| 35 Years and over | 0 (0.0%) | 14 (100.0%) |
| Total | 15 (20.8%) | 57 (79.2%) |
Educational Attainment by Field of Study in Halibut Cove
Education (57 | 80.3%), and science & technology (14 | 19.7%) are the most common fields of study among 71 individuals in Halibut Cove who have obtained a bachelor's degree or higher.
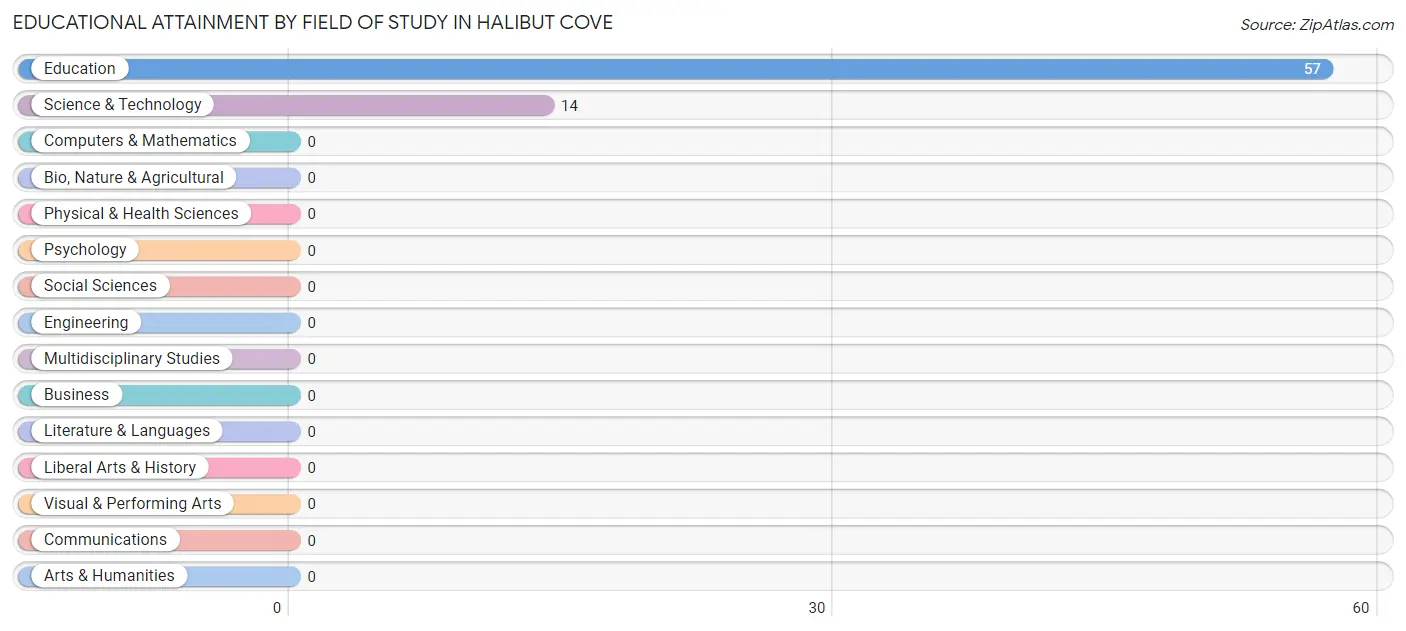
| Field of Study | # Graduates | % Graduates |
| Computers & Mathematics | 0 | 0.0% |
| Bio, Nature & Agricultural | 0 | 0.0% |
| Physical & Health Sciences | 0 | 0.0% |
| Psychology | 0 | 0.0% |
| Social Sciences | 0 | 0.0% |
| Engineering | 0 | 0.0% |
| Multidisciplinary Studies | 0 | 0.0% |
| Science & Technology | 14 | 19.7% |
| Business | 0 | 0.0% |
| Education | 57 | 80.3% |
| Literature & Languages | 0 | 0.0% |
| Liberal Arts & History | 0 | 0.0% |
| Visual & Performing Arts | 0 | 0.0% |
| Communications | 0 | 0.0% |
| Arts & Humanities | 0 | 0.0% |
| Total | 71 | 100.0% |
Transportation & Commute in Halibut Cove
Vehicle Availability by Sex in Halibut Cove
The most prevalent vehicle ownership categories in Halibut Cove are males with no vehicle (44, accounting for 100.0%) and females with no vehicle (20, making up 220.0%).
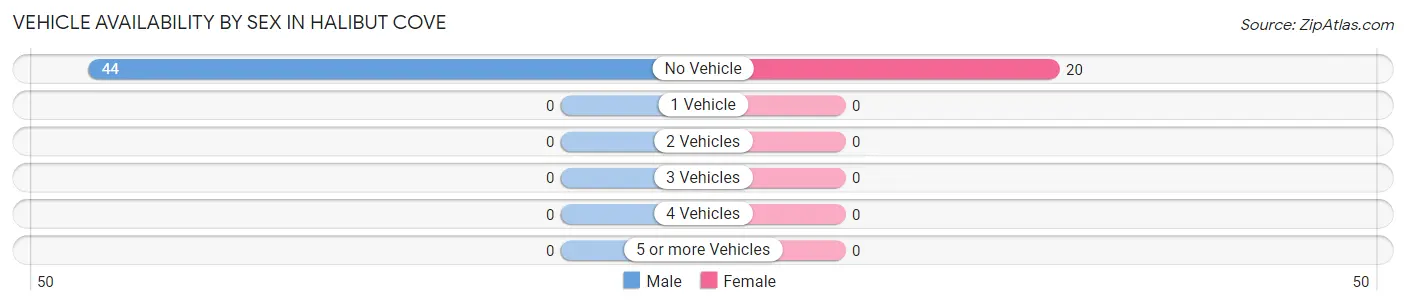
| Vehicles Available | Male | Female |
| No Vehicle | 44 (100.0%) | 20 (100.0%) |
| 1 Vehicle | 0 (0.0%) | 0 (0.0%) |
| 2 Vehicles | 0 (0.0%) | 0 (0.0%) |
| 3 Vehicles | 0 (0.0%) | 0 (0.0%) |
| 4 Vehicles | 0 (0.0%) | 0 (0.0%) |
| 5 or more Vehicles | 0 (0.0%) | 0 (0.0%) |
| Total | 44 (100.0%) | 20 (100.0%) |
Commute Time in Halibut Cove
The most frequently occuring commute durations in Halibut Cove are 10 to 14 minutes (48 commuters, 82.8%), less than 5 minutes (10 commuters, 17.2%), and 5 to 9 minutes (0 commuters, 0.0%).
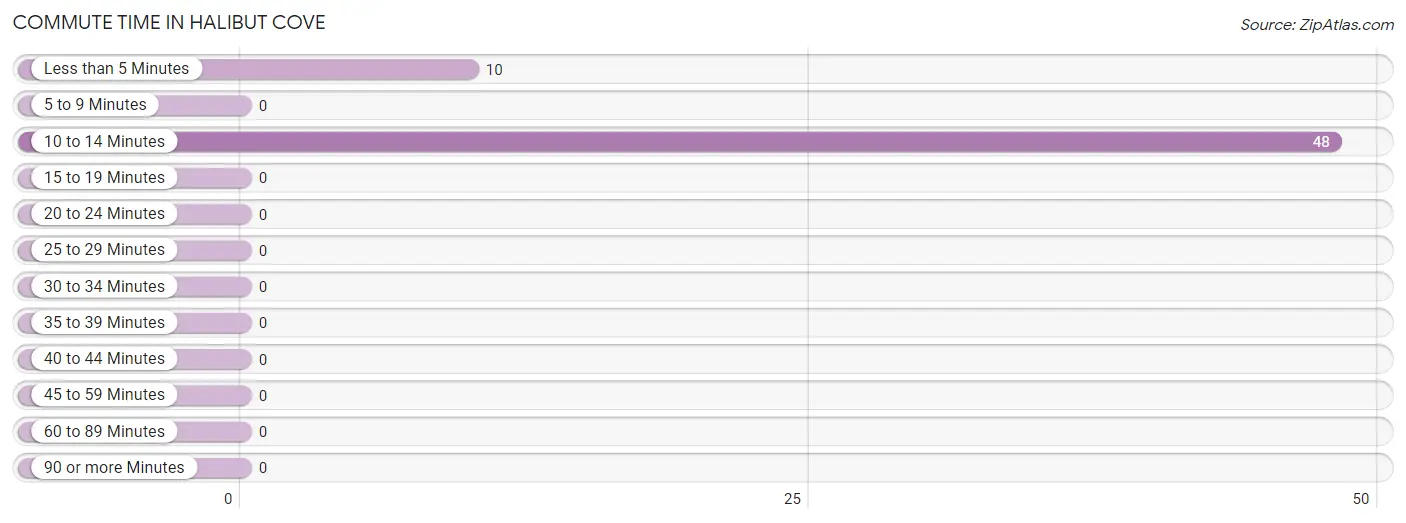
| Commute Time | # Commuters | % Commuters |
| Less than 5 Minutes | 10 | 17.2% |
| 5 to 9 Minutes | 0 | 0.0% |
| 10 to 14 Minutes | 48 | 82.8% |
| 15 to 19 Minutes | 0 | 0.0% |
| 20 to 24 Minutes | 0 | 0.0% |
| 25 to 29 Minutes | 0 | 0.0% |
| 30 to 34 Minutes | 0 | 0.0% |
| 35 to 39 Minutes | 0 | 0.0% |
| 40 to 44 Minutes | 0 | 0.0% |
| 45 to 59 Minutes | 0 | 0.0% |
| 60 to 89 Minutes | 0 | 0.0% |
| 90 or more Minutes | 0 | 0.0% |
Commute Time by Sex in Halibut Cove
The most common commute times in Halibut Cove are 10 to 14 minutes (34 commuters, 77.3%) for males and 10 to 14 minutes (14 commuters, 100.0%) for females.
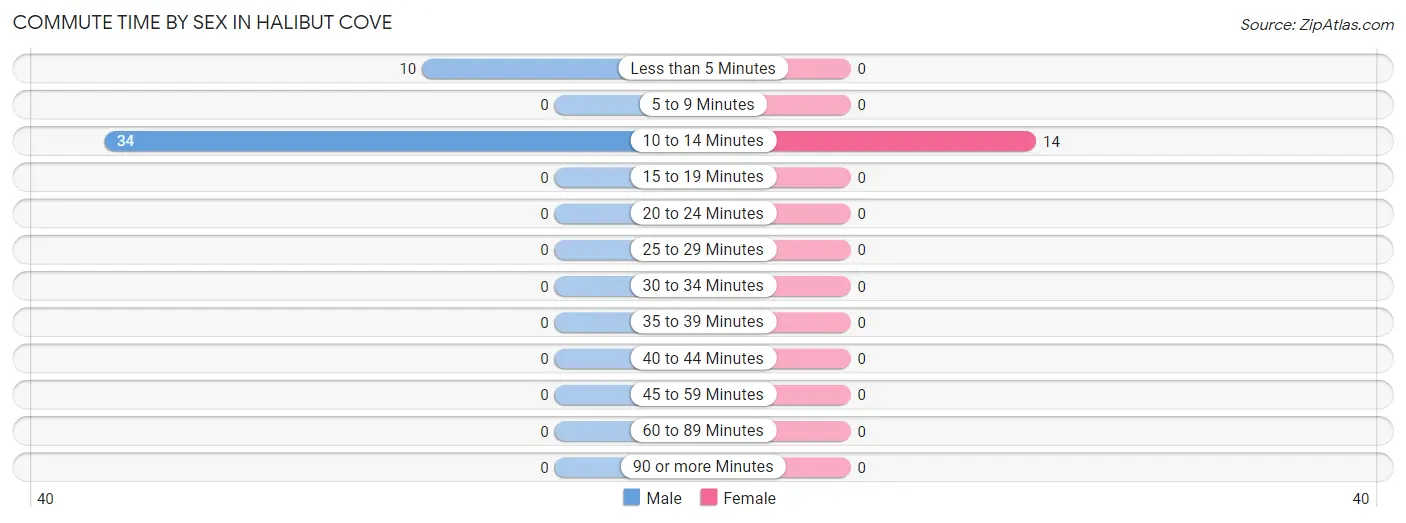
| Commute Time | Male | Female |
| Less than 5 Minutes | 10 (22.7%) | 0 (0.0%) |
| 5 to 9 Minutes | 0 (0.0%) | 0 (0.0%) |
| 10 to 14 Minutes | 34 (77.3%) | 14 (100.0%) |
| 15 to 19 Minutes | 0 (0.0%) | 0 (0.0%) |
| 20 to 24 Minutes | 0 (0.0%) | 0 (0.0%) |
| 25 to 29 Minutes | 0 (0.0%) | 0 (0.0%) |
| 30 to 34 Minutes | 0 (0.0%) | 0 (0.0%) |
| 35 to 39 Minutes | 0 (0.0%) | 0 (0.0%) |
| 40 to 44 Minutes | 0 (0.0%) | 0 (0.0%) |
| 45 to 59 Minutes | 0 (0.0%) | 0 (0.0%) |
| 60 to 89 Minutes | 0 (0.0%) | 0 (0.0%) |
| 90 or more Minutes | 0 (0.0%) | 0 (0.0%) |
Time of Departure to Work by Sex in Halibut Cove
The most frequent times of departure to work in Halibut Cove are 12:00 PM to 3:59 PM (18, 40.9%) for males and 6:00 AM to 6:29 AM (14, 100.0%) for females.
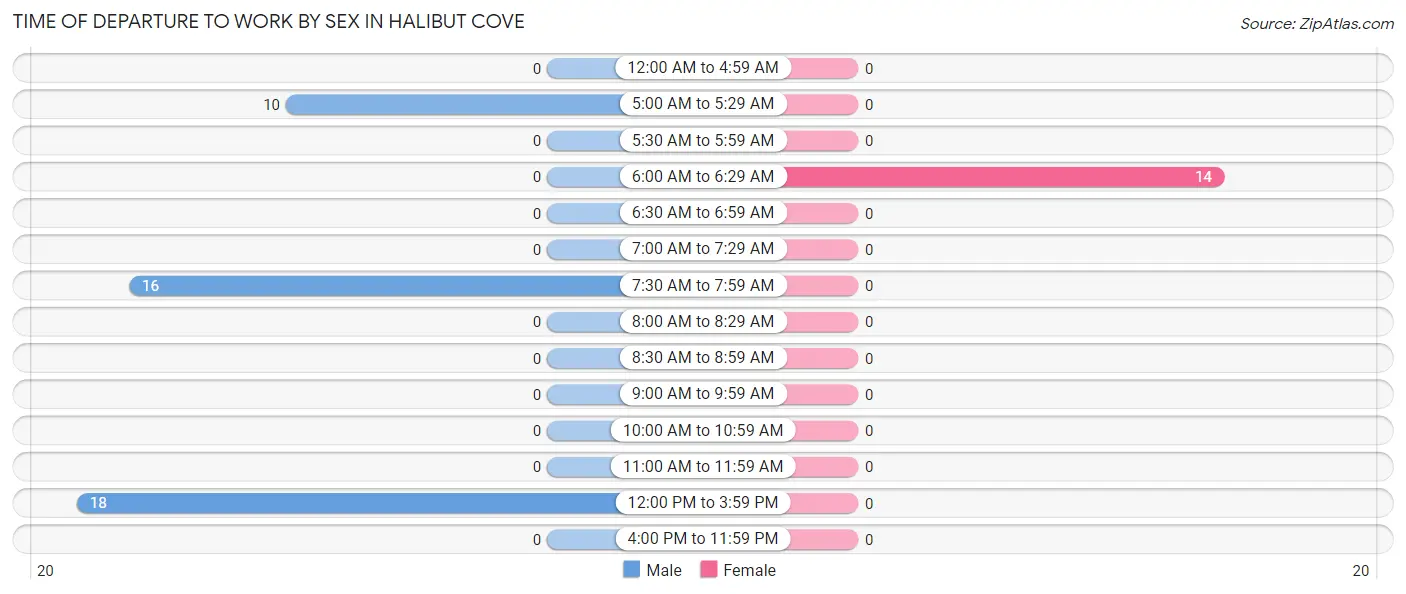
| Time of Departure | Male | Female |
| 12:00 AM to 4:59 AM | 0 (0.0%) | 0 (0.0%) |
| 5:00 AM to 5:29 AM | 10 (22.7%) | 0 (0.0%) |
| 5:30 AM to 5:59 AM | 0 (0.0%) | 0 (0.0%) |
| 6:00 AM to 6:29 AM | 0 (0.0%) | 14 (100.0%) |
| 6:30 AM to 6:59 AM | 0 (0.0%) | 0 (0.0%) |
| 7:00 AM to 7:29 AM | 0 (0.0%) | 0 (0.0%) |
| 7:30 AM to 7:59 AM | 16 (36.4%) | 0 (0.0%) |
| 8:00 AM to 8:29 AM | 0 (0.0%) | 0 (0.0%) |
| 8:30 AM to 8:59 AM | 0 (0.0%) | 0 (0.0%) |
| 9:00 AM to 9:59 AM | 0 (0.0%) | 0 (0.0%) |
| 10:00 AM to 10:59 AM | 0 (0.0%) | 0 (0.0%) |
| 11:00 AM to 11:59 AM | 0 (0.0%) | 0 (0.0%) |
| 12:00 PM to 3:59 PM | 18 (40.9%) | 0 (0.0%) |
| 4:00 PM to 11:59 PM | 0 (0.0%) | 0 (0.0%) |
| Total | 44 (100.0%) | 14 (100.0%) |
Housing Occupancy in Halibut Cove
Occupancy by Ownership in Halibut Cove
Of the total 77 dwellings in Halibut Cove, owner-occupied units account for 71 (92.2%), while renter-occupied units make up 6 (7.8%).
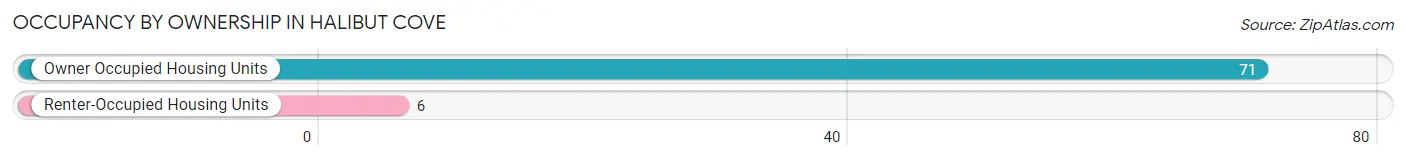
| Occupancy | # Housing Units | % Housing Units |
| Owner Occupied Housing Units | 71 | 92.2% |
| Renter-Occupied Housing Units | 6 | 7.8% |
| Total Occupied Housing Units | 77 | 100.0% |
Occupancy by Household Size in Halibut Cove
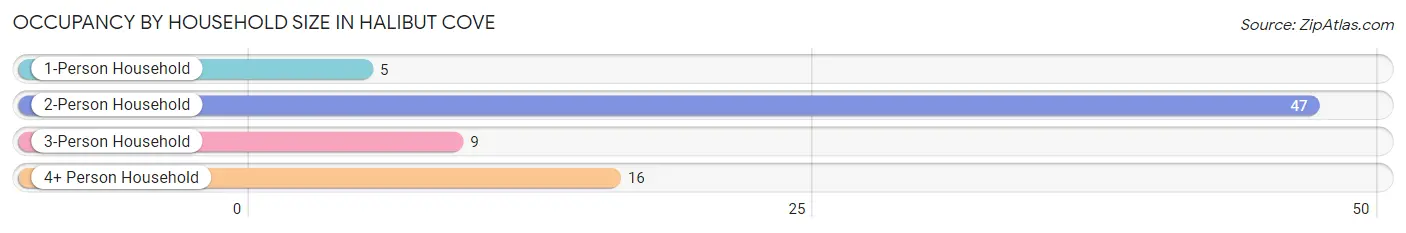
| Household Size | # Housing Units | % Housing Units |
| 1-Person Household | 5 | 6.5% |
| 2-Person Household | 47 | 61.0% |
| 3-Person Household | 9 | 11.7% |
| 4+ Person Household | 16 | 20.8% |
| Total Housing Units | 77 | 100.0% |
Occupancy by Ownership by Household Size in Halibut Cove
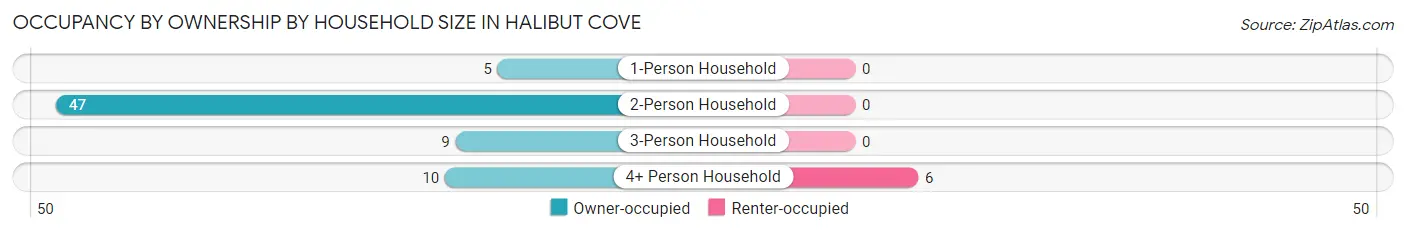
| Household Size | Owner-occupied | Renter-occupied |
| 1-Person Household | 5 (100.0%) | 0 (0.0%) |
| 2-Person Household | 47 (100.0%) | 0 (0.0%) |
| 3-Person Household | 9 (100.0%) | 0 (0.0%) |
| 4+ Person Household | 10 (62.5%) | 6 (37.5%) |
| Total Housing Units | 71 (92.2%) | 6 (7.8%) |
Occupancy by Educational Attainment in Halibut Cove
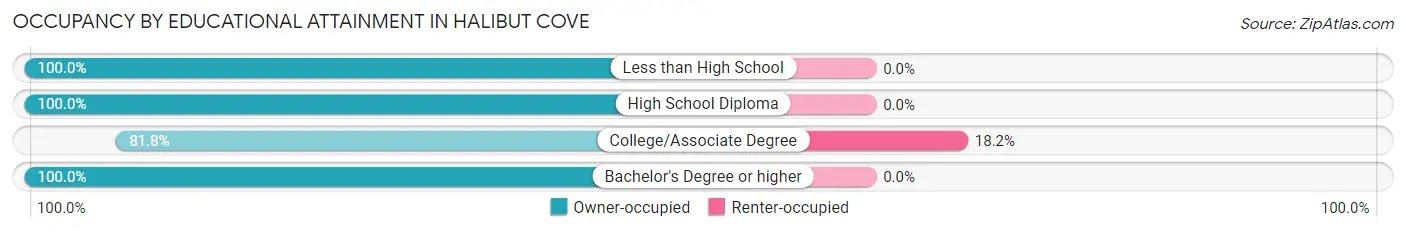
| Household Size | Owner-occupied | Renter-occupied |
| Less than High School | 5 (100.0%) | 0 (0.0%) |
| High School Diploma | 10 (100.0%) | 0 (0.0%) |
| College/Associate Degree | 27 (81.8%) | 6 (18.2%) |
| Bachelor's Degree or higher | 29 (100.0%) | 0 (0.0%) |
Occupancy by Age of Householder in Halibut Cove
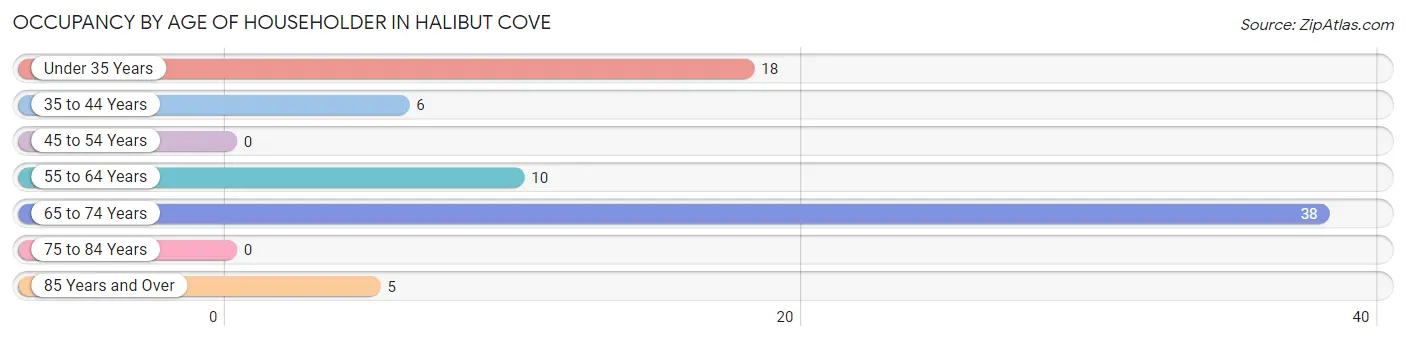
| Age Bracket | # Households | % Households |
| Under 35 Years | 18 | 23.4% |
| 35 to 44 Years | 6 | 7.8% |
| 45 to 54 Years | 0 | 0.0% |
| 55 to 64 Years | 10 | 13.0% |
| 65 to 74 Years | 38 | 49.3% |
| 75 to 84 Years | 0 | 0.0% |
| 85 Years and Over | 5 | 6.5% |
| Total | 77 | 100.0% |
Housing Finances in Halibut Cove
Median Income by Occupancy in Halibut Cove
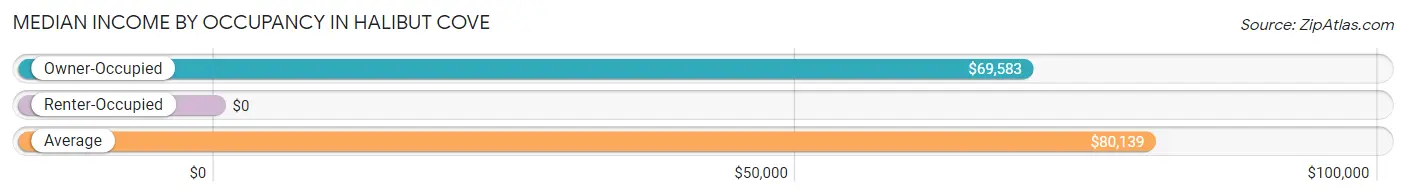
| Occupancy Type | # Households | Median Income |
| Owner-Occupied | 71 (92.2%) | $69,583 |
| Renter-Occupied | 6 (7.8%) | $0 |
| Average | 77 (100.0%) | $80,139 |
Occupancy by Householder Income Bracket in Halibut Cove
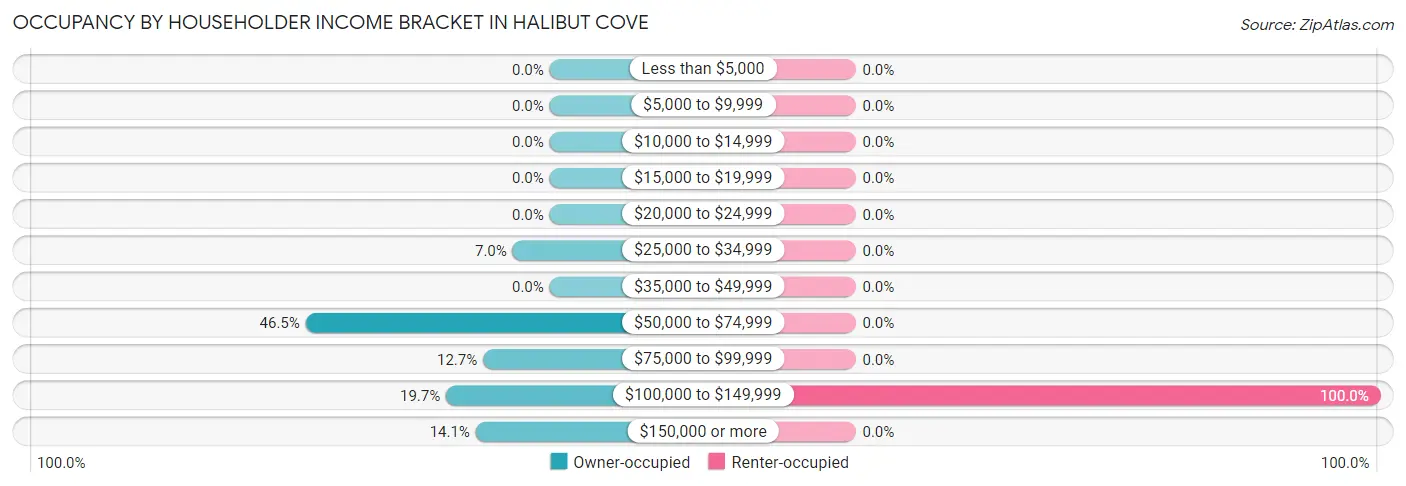
| Income Bracket | Owner-occupied | Renter-occupied |
| Less than $5,000 | 0 (0.0%) | 0 (0.0%) |
| $5,000 to $9,999 | 0 (0.0%) | 0 (0.0%) |
| $10,000 to $14,999 | 0 (0.0%) | 0 (0.0%) |
| $15,000 to $19,999 | 0 (0.0%) | 0 (0.0%) |
| $20,000 to $24,999 | 0 (0.0%) | 0 (0.0%) |
| $25,000 to $34,999 | 5 (7.0%) | 0 (0.0%) |
| $35,000 to $49,999 | 0 (0.0%) | 0 (0.0%) |
| $50,000 to $74,999 | 33 (46.5%) | 0 (0.0%) |
| $75,000 to $99,999 | 9 (12.7%) | 0 (0.0%) |
| $100,000 to $149,999 | 14 (19.7%) | 6 (100.0%) |
| $150,000 or more | 10 (14.1%) | 0 (0.0%) |
| Total | 71 (100.0%) | 6 (100.0%) |
Monthly Housing Cost Tiers in Halibut Cove
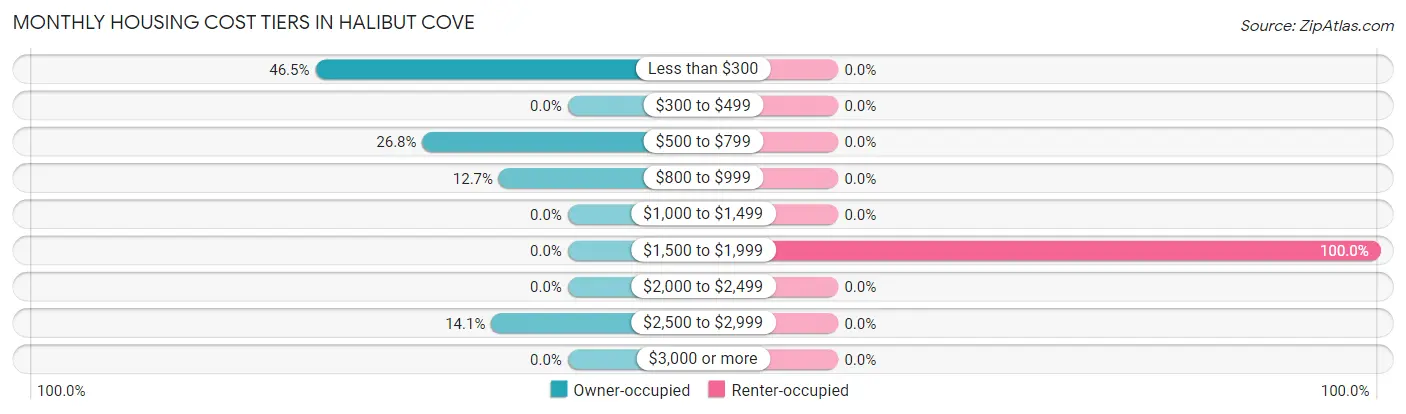
| Monthly Cost | Owner-occupied | Renter-occupied |
| Less than $300 | 33 (46.5%) | 0 (0.0%) |
| $300 to $499 | 0 (0.0%) | 0 (0.0%) |
| $500 to $799 | 19 (26.8%) | 0 (0.0%) |
| $800 to $999 | 9 (12.7%) | 0 (0.0%) |
| $1,000 to $1,499 | 0 (0.0%) | 0 (0.0%) |
| $1,500 to $1,999 | 0 (0.0%) | 6 (100.0%) |
| $2,000 to $2,499 | 0 (0.0%) | 0 (0.0%) |
| $2,500 to $2,999 | 10 (14.1%) | 0 (0.0%) |
| $3,000 or more | 0 (0.0%) | 0 (0.0%) |
| Total | 71 (100.0%) | 6 (100.0%) |
Physical Housing Characteristics in Halibut Cove
Housing Structures in Halibut Cove
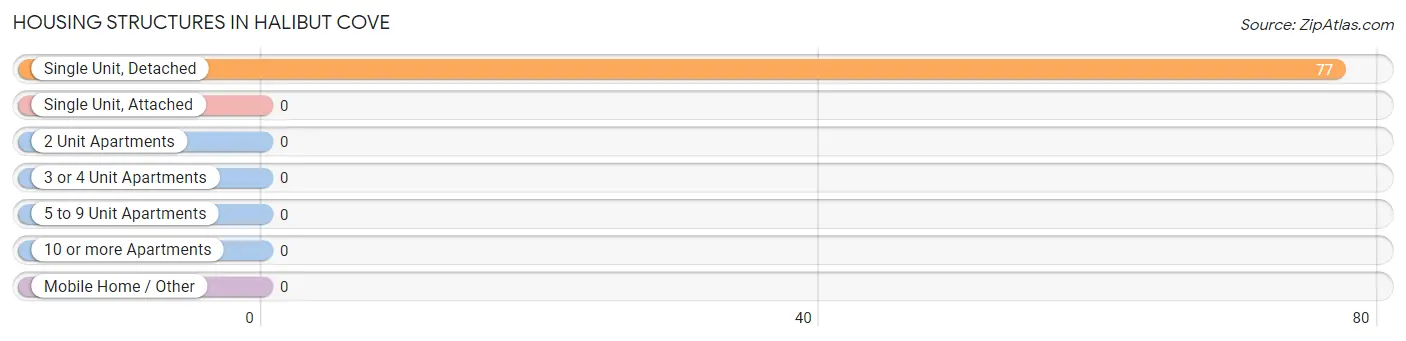
| Structure Type | # Housing Units | % Housing Units |
| Single Unit, Detached | 77 | 100.0% |
| Single Unit, Attached | 0 | 0.0% |
| 2 Unit Apartments | 0 | 0.0% |
| 3 or 4 Unit Apartments | 0 | 0.0% |
| 5 to 9 Unit Apartments | 0 | 0.0% |
| 10 or more Apartments | 0 | 0.0% |
| Mobile Home / Other | 0 | 0.0% |
| Total | 77 | 100.0% |
Housing Structures by Occupancy in Halibut Cove
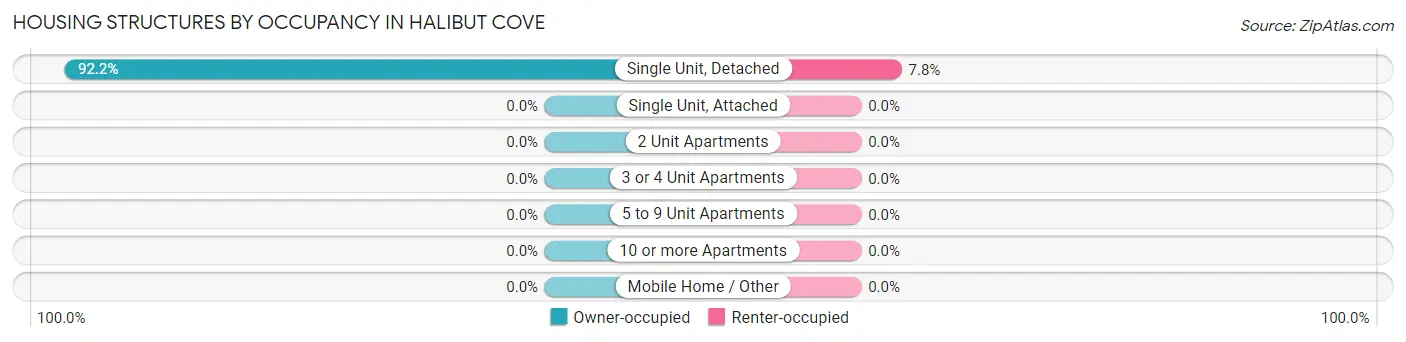
| Structure Type | Owner-occupied | Renter-occupied |
| Single Unit, Detached | 71 (92.2%) | 6 (7.8%) |
| Single Unit, Attached | 0 (0.0%) | 0 (0.0%) |
| 2 Unit Apartments | 0 (0.0%) | 0 (0.0%) |
| 3 or 4 Unit Apartments | 0 (0.0%) | 0 (0.0%) |
| 5 to 9 Unit Apartments | 0 (0.0%) | 0 (0.0%) |
| 10 or more Apartments | 0 (0.0%) | 0 (0.0%) |
| Mobile Home / Other | 0 (0.0%) | 0 (0.0%) |
| Total | 71 (92.2%) | 6 (7.8%) |
Housing Structures by Number of Rooms in Halibut Cove
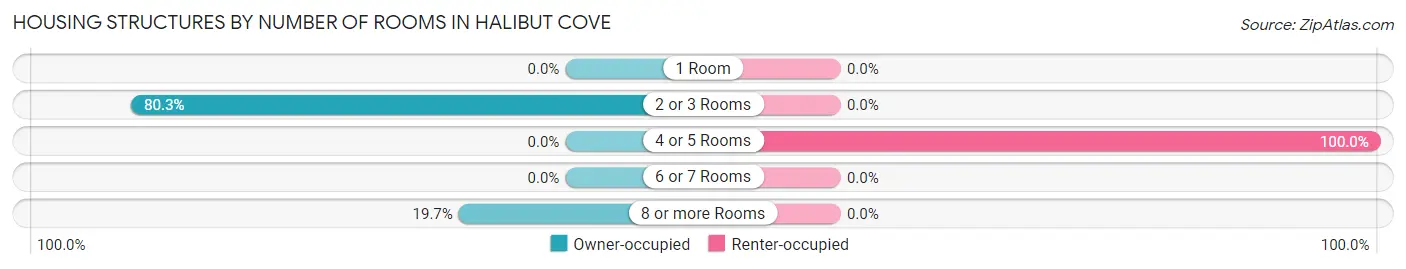
| Number of Rooms | Owner-occupied | Renter-occupied |
| 1 Room | 0 (0.0%) | 0 (0.0%) |
| 2 or 3 Rooms | 57 (80.3%) | 0 (0.0%) |
| 4 or 5 Rooms | 0 (0.0%) | 6 (100.0%) |
| 6 or 7 Rooms | 0 (0.0%) | 0 (0.0%) |
| 8 or more Rooms | 14 (19.7%) | 0 (0.0%) |
| Total | 71 (100.0%) | 6 (100.0%) |
Housing Structure by Heating Type in Halibut Cove
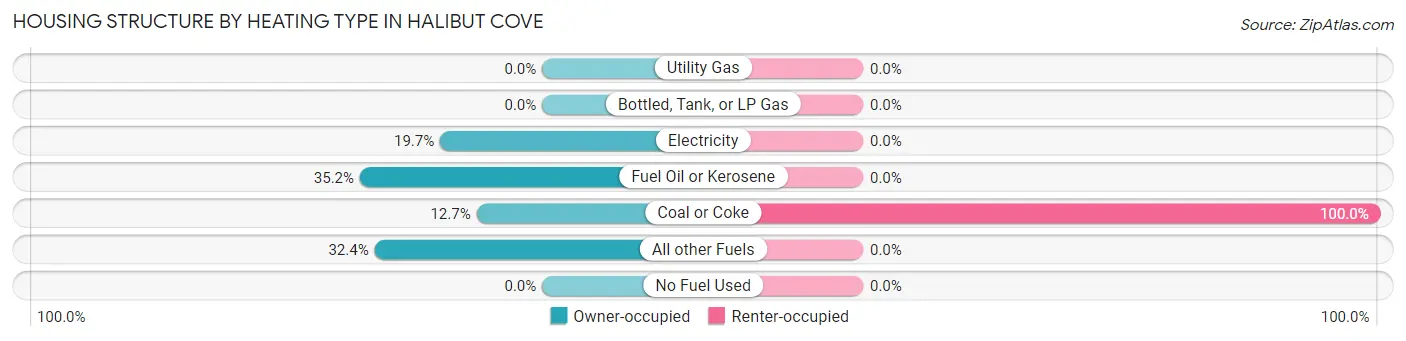
| Heating Type | Owner-occupied | Renter-occupied |
| Utility Gas | 0 (0.0%) | 0 (0.0%) |
| Bottled, Tank, or LP Gas | 0 (0.0%) | 0 (0.0%) |
| Electricity | 14 (19.7%) | 0 (0.0%) |
| Fuel Oil or Kerosene | 25 (35.2%) | 0 (0.0%) |
| Coal or Coke | 9 (12.7%) | 6 (100.0%) |
| All other Fuels | 23 (32.4%) | 0 (0.0%) |
| No Fuel Used | 0 (0.0%) | 0 (0.0%) |
| Total | 71 (100.0%) | 6 (100.0%) |
Household Vehicle Usage in Halibut Cove
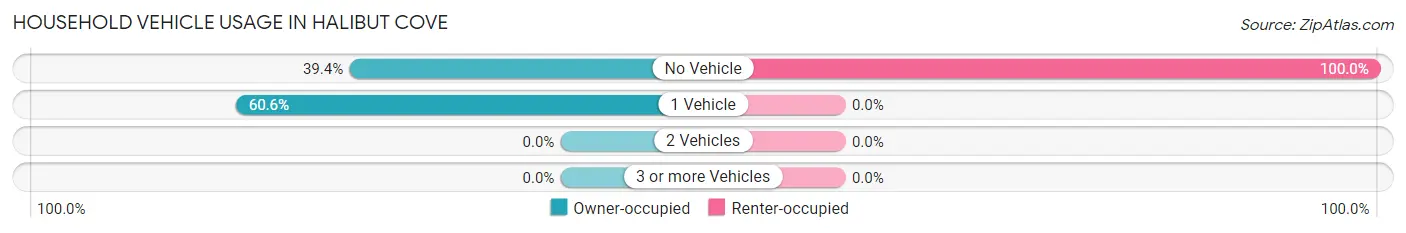
| Vehicles per Household | Owner-occupied | Renter-occupied |
| No Vehicle | 28 (39.4%) | 6 (100.0%) |
| 1 Vehicle | 43 (60.6%) | 0 (0.0%) |
| 2 Vehicles | 0 (0.0%) | 0 (0.0%) |
| 3 or more Vehicles | 0 (0.0%) | 0 (0.0%) |
| Total | 71 (100.0%) | 6 (100.0%) |
Real Estate & Mortgages in Halibut Cove
Real Estate and Mortgage Overview in Halibut Cove
| Characteristic | Without Mortgage | With Mortgage |
| Housing Units | 61 | 10 |
| Median Property Value | - | - |
| Median Household Income | $68,750 | $10 |
| Monthly Housing Costs | - | - |
| Real Estate Taxes | - | - |
Property Value by Mortgage Status in Halibut Cove
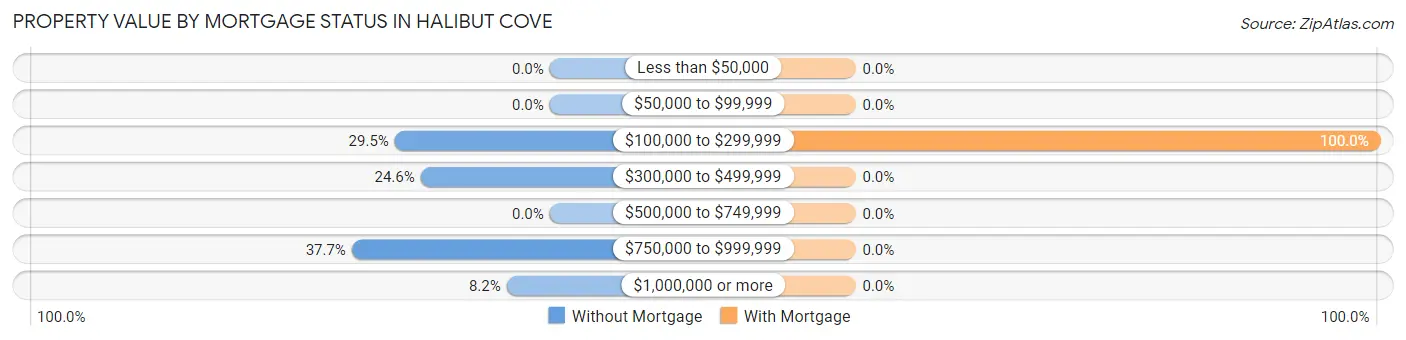
| Property Value | Without Mortgage | With Mortgage |
| Less than $50,000 | 0 (0.0%) | 0 (0.0%) |
| $50,000 to $99,999 | 0 (0.0%) | 0 (0.0%) |
| $100,000 to $299,999 | 18 (29.5%) | 10 (100.0%) |
| $300,000 to $499,999 | 15 (24.6%) | 0 (0.0%) |
| $500,000 to $749,999 | 0 (0.0%) | 0 (0.0%) |
| $750,000 to $999,999 | 23 (37.7%) | 0 (0.0%) |
| $1,000,000 or more | 5 (8.2%) | 0 (0.0%) |
| Total | 61 (100.0%) | 10 (100.0%) |
Household Income by Mortgage Status in Halibut Cove
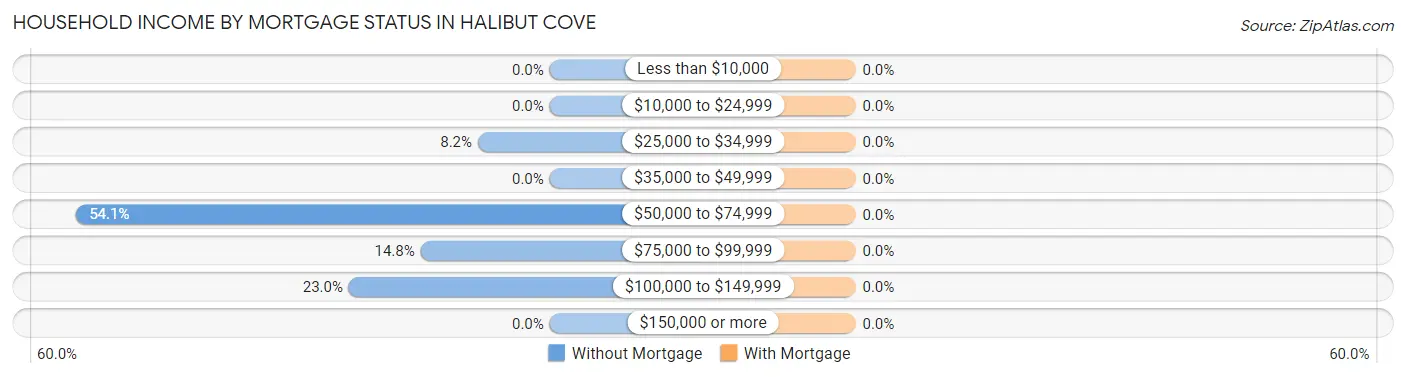
| Household Income | Without Mortgage | With Mortgage |
| Less than $10,000 | 0 (0.0%) | 0 (0.0%) |
| $10,000 to $24,999 | 0 (0.0%) | 0 (0.0%) |
| $25,000 to $34,999 | 5 (8.2%) | 0 (0.0%) |
| $35,000 to $49,999 | 0 (0.0%) | 0 (0.0%) |
| $50,000 to $74,999 | 33 (54.1%) | 0 (0.0%) |
| $75,000 to $99,999 | 9 (14.7%) | 0 (0.0%) |
| $100,000 to $149,999 | 14 (23.0%) | 0 (0.0%) |
| $150,000 or more | 0 (0.0%) | 0 (0.0%) |
| Total | 61 (100.0%) | 10 (100.0%) |
Property Value to Household Income Ratio in Halibut Cove
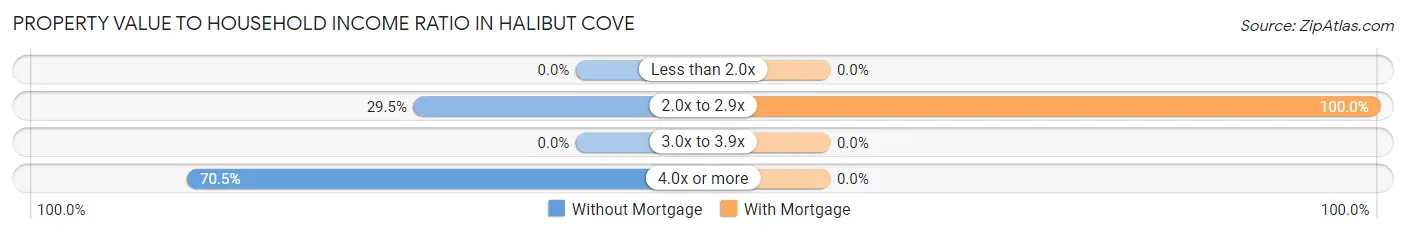
| Value-to-Income Ratio | Without Mortgage | With Mortgage |
| Less than 2.0x | 0 (0.0%) | 0 (0.0%) |
| 2.0x to 2.9x | 18 (29.5%) | 10 (100.0%) |
| 3.0x to 3.9x | 0 (0.0%) | 0 (0.0%) |
| 4.0x or more | 43 (70.5%) | 0 (0.0%) |
| Total | 61 (100.0%) | 10 (100.0%) |
Real Estate Taxes by Mortgage Status in Halibut Cove
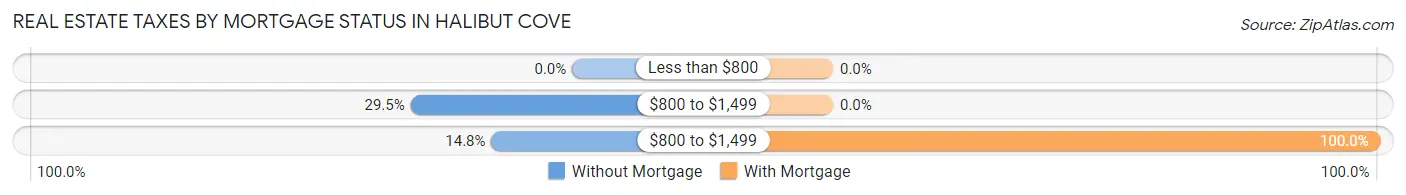
| Property Taxes | Without Mortgage | With Mortgage |
| Less than $800 | 0 (0.0%) | 0 (0.0%) |
| $800 to $1,499 | 18 (29.5%) | 0 (0.0%) |
| $800 to $1,499 | 9 (14.7%) | 10 (100.0%) |
| Total | 61 (100.0%) | 10 (100.0%) |
Health & Disability in Halibut Cove
Health Insurance Coverage by Age in Halibut Cove
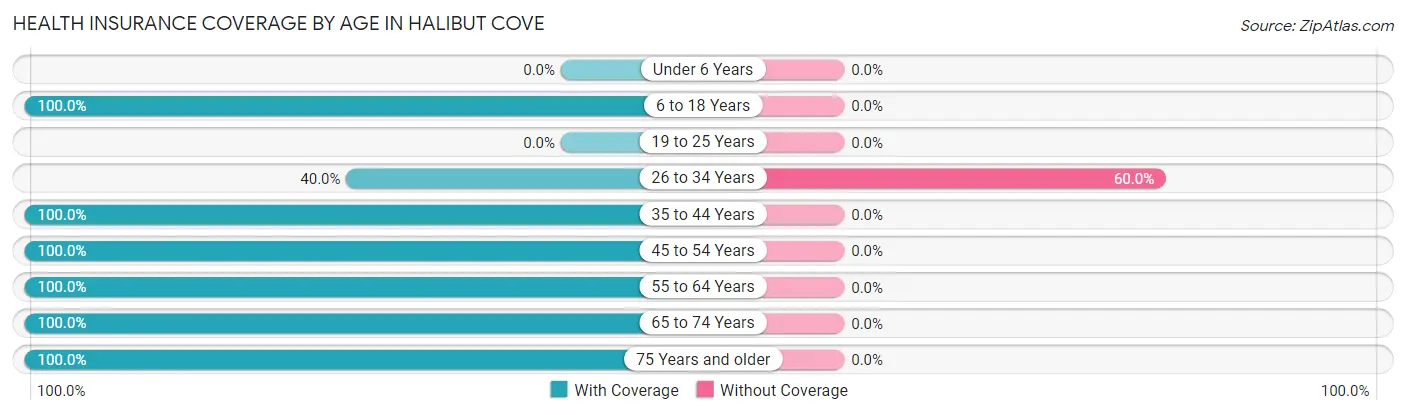
| Age Bracket | With Coverage | Without Coverage |
| Under 6 Years | 0 (0.0%) | 0 (0.0%) |
| 6 to 18 Years | 58 (100.0%) | 0 (0.0%) |
| 19 to 25 Years | 0 (0.0%) | 0 (0.0%) |
| 26 to 34 Years | 12 (40.0%) | 18 (60.0%) |
| 35 to 44 Years | 22 (100.0%) | 0 (0.0%) |
| 45 to 54 Years | 14 (100.0%) | 0 (0.0%) |
| 55 to 64 Years | 10 (100.0%) | 0 (0.0%) |
| 65 to 74 Years | 72 (100.0%) | 0 (0.0%) |
| 75 Years and older | 5 (100.0%) | 0 (0.0%) |
| Total | 193 (91.5%) | 18 (8.5%) |
Health Insurance Coverage by Citizenship Status in Halibut Cove
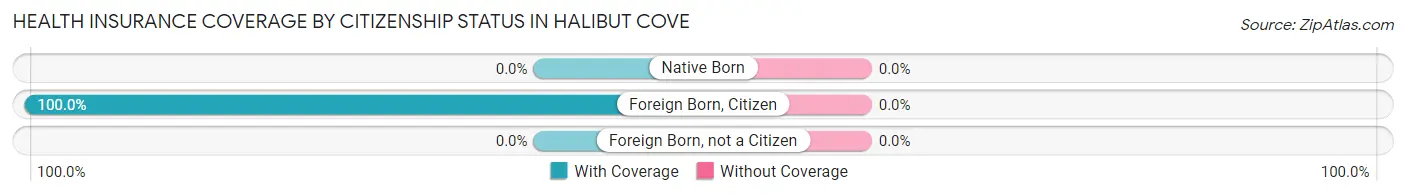
| Citizenship Status | With Coverage | Without Coverage |
| Native Born | 0 (0.0%) | 0 (0.0%) |
| Foreign Born, Citizen | 58 (100.0%) | 0 (0.0%) |
| Foreign Born, not a Citizen | 0 (0.0%) | 0 (0.0%) |
Health Insurance Coverage by Household Income in Halibut Cove
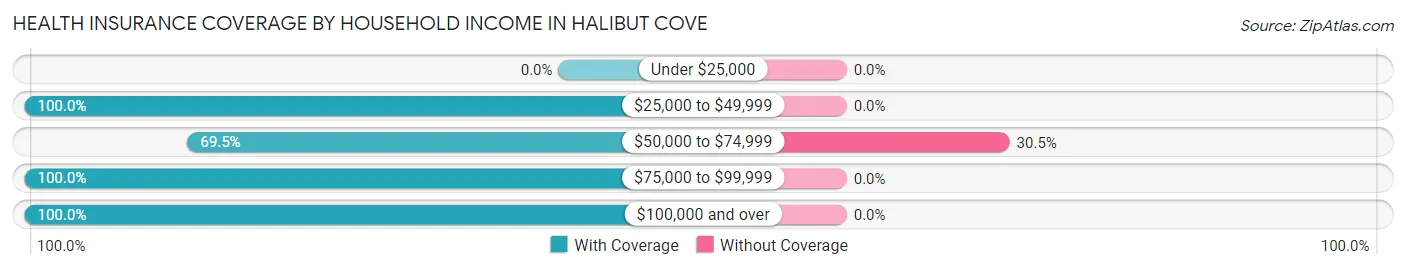
| Household Income | With Coverage | Without Coverage |
| Under $25,000 | 0 (0.0%) | 0 (0.0%) |
| $25,000 to $49,999 | 5 (100.0%) | 0 (0.0%) |
| $50,000 to $74,999 | 41 (69.5%) | 18 (30.5%) |
| $75,000 to $99,999 | 27 (100.0%) | 0 (0.0%) |
| $100,000 and over | 120 (100.0%) | 0 (0.0%) |
Public vs Private Health Insurance Coverage by Age in Halibut Cove
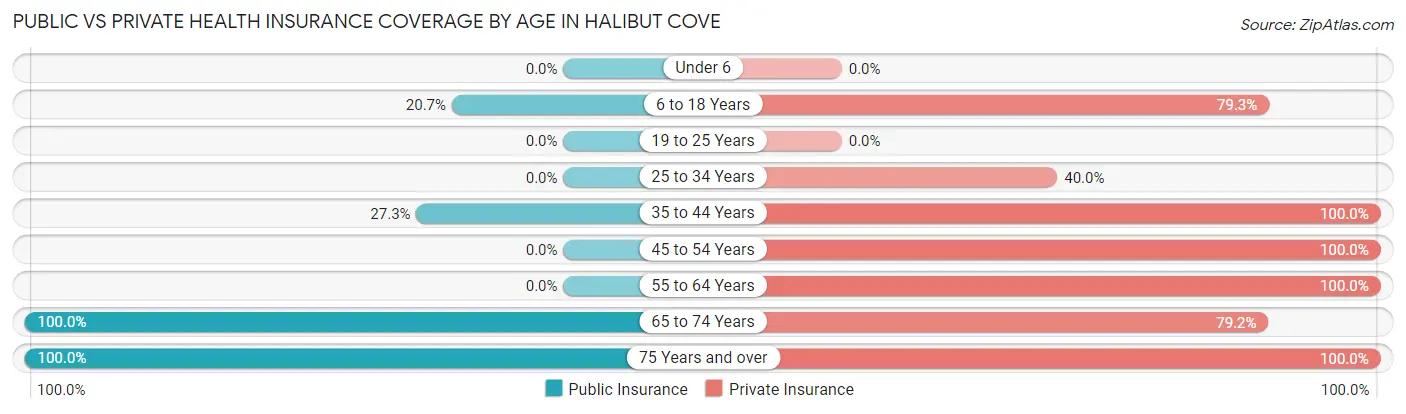
| Age Bracket | Public Insurance | Private Insurance |
| Under 6 | 0 (0.0%) | 0 (0.0%) |
| 6 to 18 Years | 12 (20.7%) | 46 (79.3%) |
| 19 to 25 Years | 0 (0.0%) | 0 (0.0%) |
| 25 to 34 Years | 0 (0.0%) | 12 (40.0%) |
| 35 to 44 Years | 6 (27.3%) | 22 (100.0%) |
| 45 to 54 Years | 0 (0.0%) | 14 (100.0%) |
| 55 to 64 Years | 0 (0.0%) | 10 (100.0%) |
| 65 to 74 Years | 72 (100.0%) | 57 (79.2%) |
| 75 Years and over | 5 (100.0%) | 5 (100.0%) |
| Total | 95 (45.0%) | 166 (78.7%) |
Disability Status by Sex by Age in Halibut Cove
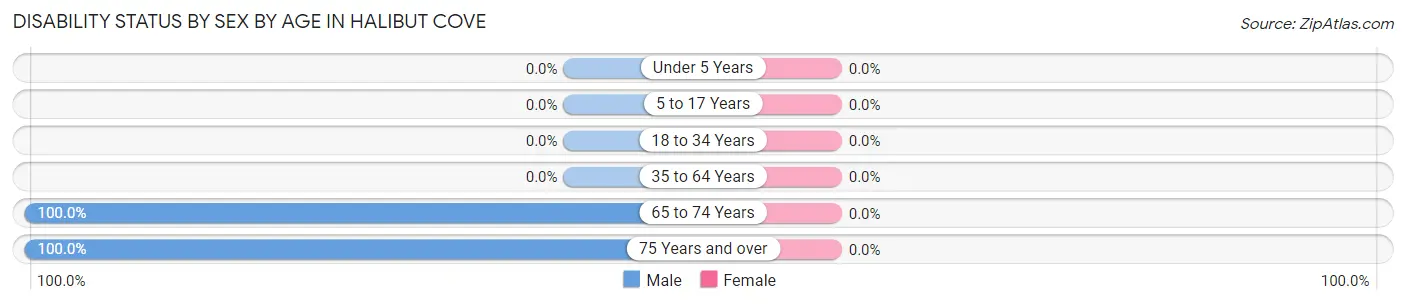
| Age Bracket | Male | Female |
| Under 5 Years | 0 (0.0%) | 0 (0.0%) |
| 5 to 17 Years | 0 (0.0%) | 0 (0.0%) |
| 18 to 34 Years | 0 (0.0%) | 0 (0.0%) |
| 35 to 64 Years | 0 (0.0%) | 0 (0.0%) |
| 65 to 74 Years | 38 (100.0%) | 0 (0.0%) |
| 75 Years and over | 5 (100.0%) | 0 (0.0%) |
Disability Class by Sex by Age in Halibut Cove
Disability Class: Hearing Difficulty
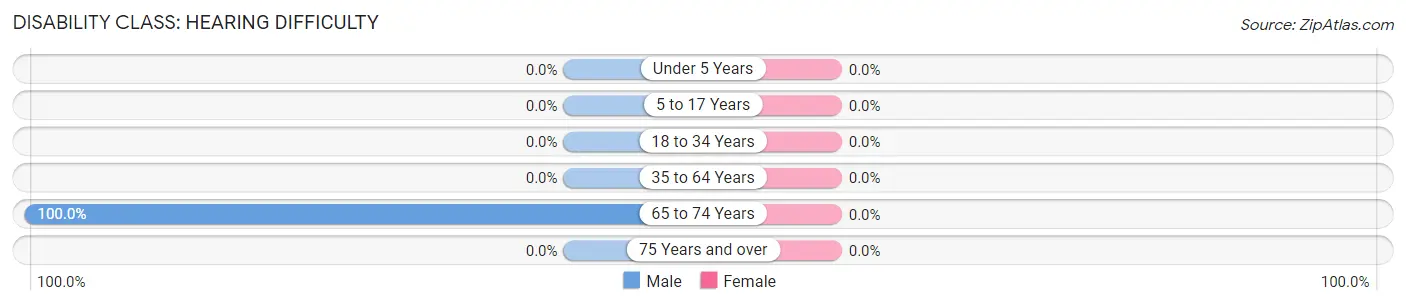
| Age Bracket | Male | Female |
| Under 5 Years | 0 (0.0%) | 0 (0.0%) |
| 5 to 17 Years | 0 (0.0%) | 0 (0.0%) |
| 18 to 34 Years | 0 (0.0%) | 0 (0.0%) |
| 35 to 64 Years | 0 (0.0%) | 0 (0.0%) |
| 65 to 74 Years | 38 (100.0%) | 0 (0.0%) |
| 75 Years and over | 0 (0.0%) | 0 (0.0%) |
Disability Class: Vision Difficulty
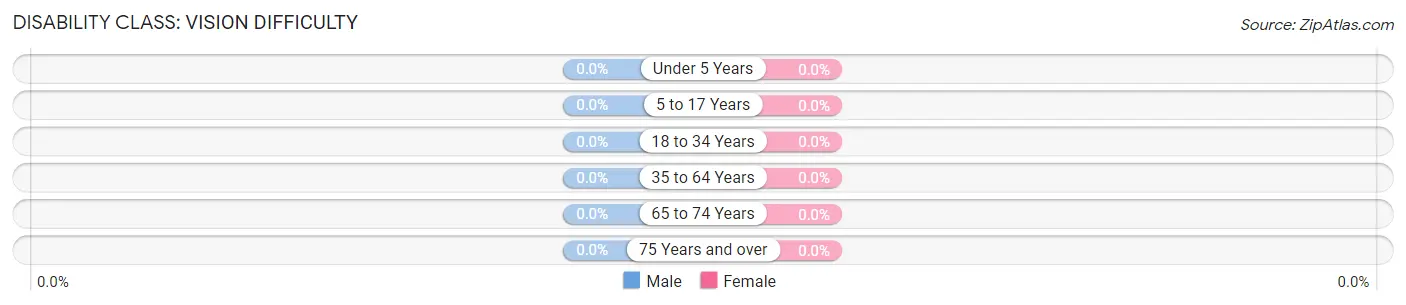
| Age Bracket | Male | Female |
| Under 5 Years | 0 (0.0%) | 0 (0.0%) |
| 5 to 17 Years | 0 (0.0%) | 0 (0.0%) |
| 18 to 34 Years | 0 (0.0%) | 0 (0.0%) |
| 35 to 64 Years | 0 (0.0%) | 0 (0.0%) |
| 65 to 74 Years | 0 (0.0%) | 0 (0.0%) |
| 75 Years and over | 0 (0.0%) | 0 (0.0%) |
Disability Class: Cognitive Difficulty
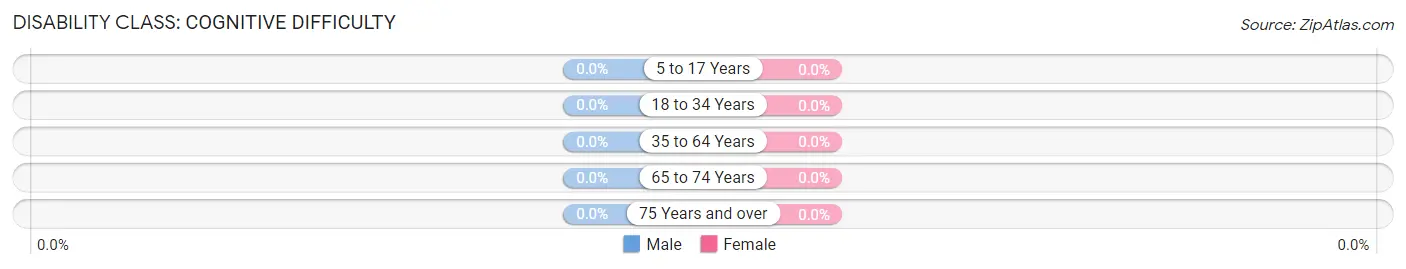
| Age Bracket | Male | Female |
| 5 to 17 Years | 0 (0.0%) | 0 (0.0%) |
| 18 to 34 Years | 0 (0.0%) | 0 (0.0%) |
| 35 to 64 Years | 0 (0.0%) | 0 (0.0%) |
| 65 to 74 Years | 0 (0.0%) | 0 (0.0%) |
| 75 Years and over | 0 (0.0%) | 0 (0.0%) |
Disability Class: Ambulatory Difficulty
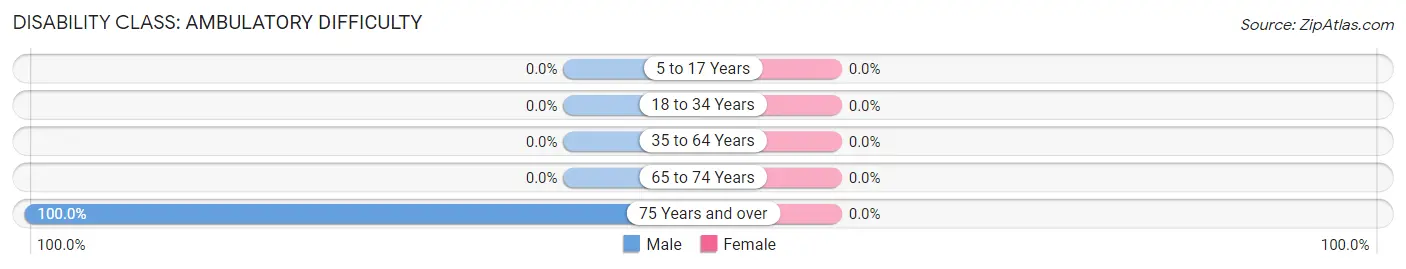
| Age Bracket | Male | Female |
| 5 to 17 Years | 0 (0.0%) | 0 (0.0%) |
| 18 to 34 Years | 0 (0.0%) | 0 (0.0%) |
| 35 to 64 Years | 0 (0.0%) | 0 (0.0%) |
| 65 to 74 Years | 0 (0.0%) | 0 (0.0%) |
| 75 Years and over | 5 (100.0%) | 0 (0.0%) |
Disability Class: Self-Care Difficulty

| Age Bracket | Male | Female |
| 5 to 17 Years | 0 (0.0%) | 0 (0.0%) |
| 18 to 34 Years | 0 (0.0%) | 0 (0.0%) |
| 35 to 64 Years | 0 (0.0%) | 0 (0.0%) |
| 65 to 74 Years | 0 (0.0%) | 0 (0.0%) |
| 75 Years and over | 0 (0.0%) | 0 (0.0%) |
Technology Access in Halibut Cove
Computing Device Access in Halibut Cove
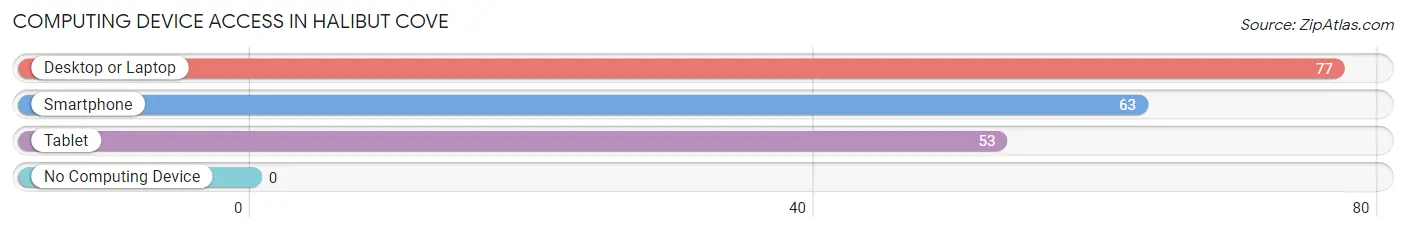
| Device Type | # Households | % Households |
| Desktop or Laptop | 77 | 100.0% |
| Smartphone | 63 | 81.8% |
| Tablet | 53 | 68.8% |
| No Computing Device | 0 | 0.0% |
| Total | 77 | 100.0% |
Internet Access in Halibut Cove
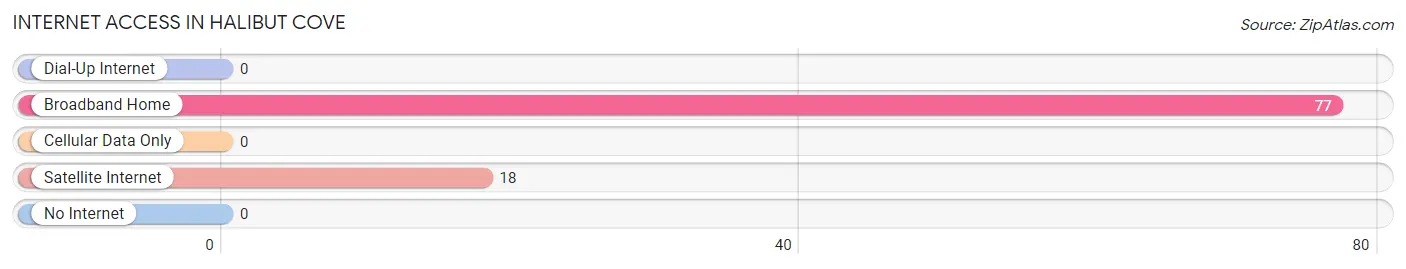
| Internet Type | # Households | % Households |
| Dial-Up Internet | 0 | 0.0% |
| Broadband Home | 77 | 100.0% |
| Cellular Data Only | 0 | 0.0% |
| Satellite Internet | 18 | 23.4% |
| No Internet | 0 | 0.0% |
| Total | 77 | 100.0% |
Halibut Cove Summary
Halibut Cove, Alaska is a small unincorporated community located on the east side of Kachemak Bay, in the Kenai Peninsula Borough of Alaska. It is located approximately 10 miles south of Homer, Alaska, and is accessible only by boat or floatplane. The community is home to approximately 100 year-round residents, and is a popular tourist destination in the summer months.
History
The area now known as Halibut Cove was first inhabited by the Dena’ina Athabascan people, who lived in the area for thousands of years before the arrival of European settlers. The first recorded European settlers in the area were Russian fur traders, who arrived in the late 1700s. The area was later settled by Norwegian fishermen, who established a fishing camp in the area in the late 1800s.
The community was officially established in the early 1900s, when the first post office was opened in the area. The community was named after the abundance of halibut in the area, which was a major source of income for the local fishermen.
Geography
Halibut Cove is located on the east side of Kachemak Bay, in the Kenai Peninsula Borough of Alaska. The community is located approximately 10 miles south of Homer, Alaska, and is accessible only by boat or floatplane. The area is surrounded by mountains and is home to numerous small islands, including Halibut Island, which is the largest island in the area.
The area is known for its stunning natural beauty, with numerous hiking trails, beaches, and wildlife viewing opportunities. The area is also home to numerous species of fish, including halibut, salmon, and cod.
Economy
The economy of Halibut Cove is largely based on fishing and tourism. The area is home to numerous commercial fishing operations, which provide employment for many of the local residents. The area is also a popular tourist destination in the summer months, with numerous charter fishing and sightseeing tours available.
The area is also home to numerous art galleries, restaurants, and other businesses, which provide additional employment opportunities for the local residents.
Demographics
As of the 2010 census, the population of Halibut Cove was approximately 100 people. The racial makeup of the community was 97.0% White, 0.0% African American, 0.0% Native American, 0.0% Asian, 0.0% Pacific Islander, 0.0% from other races, and 3.0% from two or more races.
The median household income in Halibut Cove was $45,000, and the median family income was $50,000. The per capita income in the area was $20,000. The unemployment rate in the area was 8.3%.
Conclusion
Halibut Cove, Alaska is a small unincorporated community located on the east side of Kachemak Bay, in the Kenai Peninsula Borough of Alaska. The area is home to approximately 100 year-round residents, and is a popular tourist destination in the summer months. The economy of Halibut Cove is largely based on fishing and tourism, and the area is known for its stunning natural beauty. The population of Halibut Cove is approximately 100 people, and the median household income in the area is $45,000.
Common Questions
What is Per Capita Income in Halibut Cove?
Per Capita income in Halibut Cove is $37,536.
What is the Median Family Income in Halibut Cove?
Median Family Income in Halibut Cove is $100,536.
What is the Median Household income in Halibut Cove?
Median Household Income in Halibut Cove is $80,139.
What is Income or Wage Gap in Halibut Cove?
Income or Wage Gap in Halibut Cove is 20.4%.
Women in Halibut Cove earn 79.6 cents for every dollar earned by a man.
What is Inequality or Gini Index in Halibut Cove?
Inequality or Gini Index in Halibut Cove is 0.27.
What is the Total Population of Halibut Cove?
Total Population of Halibut Cove is 211.
What is the Total Male Population of Halibut Cove?
Total Male Population of Halibut Cove is 130.
What is the Total Female Population of Halibut Cove?
Total Female Population of Halibut Cove is 81.
What is the Ratio of Males per 100 Females in Halibut Cove?
There are 160.49 Males per 100 Females in Halibut Cove.
What is the Ratio of Females per 100 Males in Halibut Cove?
There are 62.31 Females per 100 Males in Halibut Cove.
What is the Median Population Age in Halibut Cove?
Median Population Age in Halibut Cove is 40.7 Years.
What is the Average Family Size in Halibut Cove
Average Family Size in Halibut Cove is 3.3 People.
What is the Average Household Size in Halibut Cove
Average Household Size in Halibut Cove is 2.7 People.
How Large is the Labor Force in Halibut Cove?
There are 64 People in the Labor Forcein in Halibut Cove.
What is the Percentage of People in the Labor Force in Halibut Cove?
40.8% of People are in the Labor Force in Halibut Cove.