Zip Codes with the Highest Percentage of Population Employed in Arts, Entertainment & Recreation in Oklahoma
RELATED REPORTS & OPTIONS
Arts, Entertainment & Recreation
Oklahoma
Compare Zip Codes
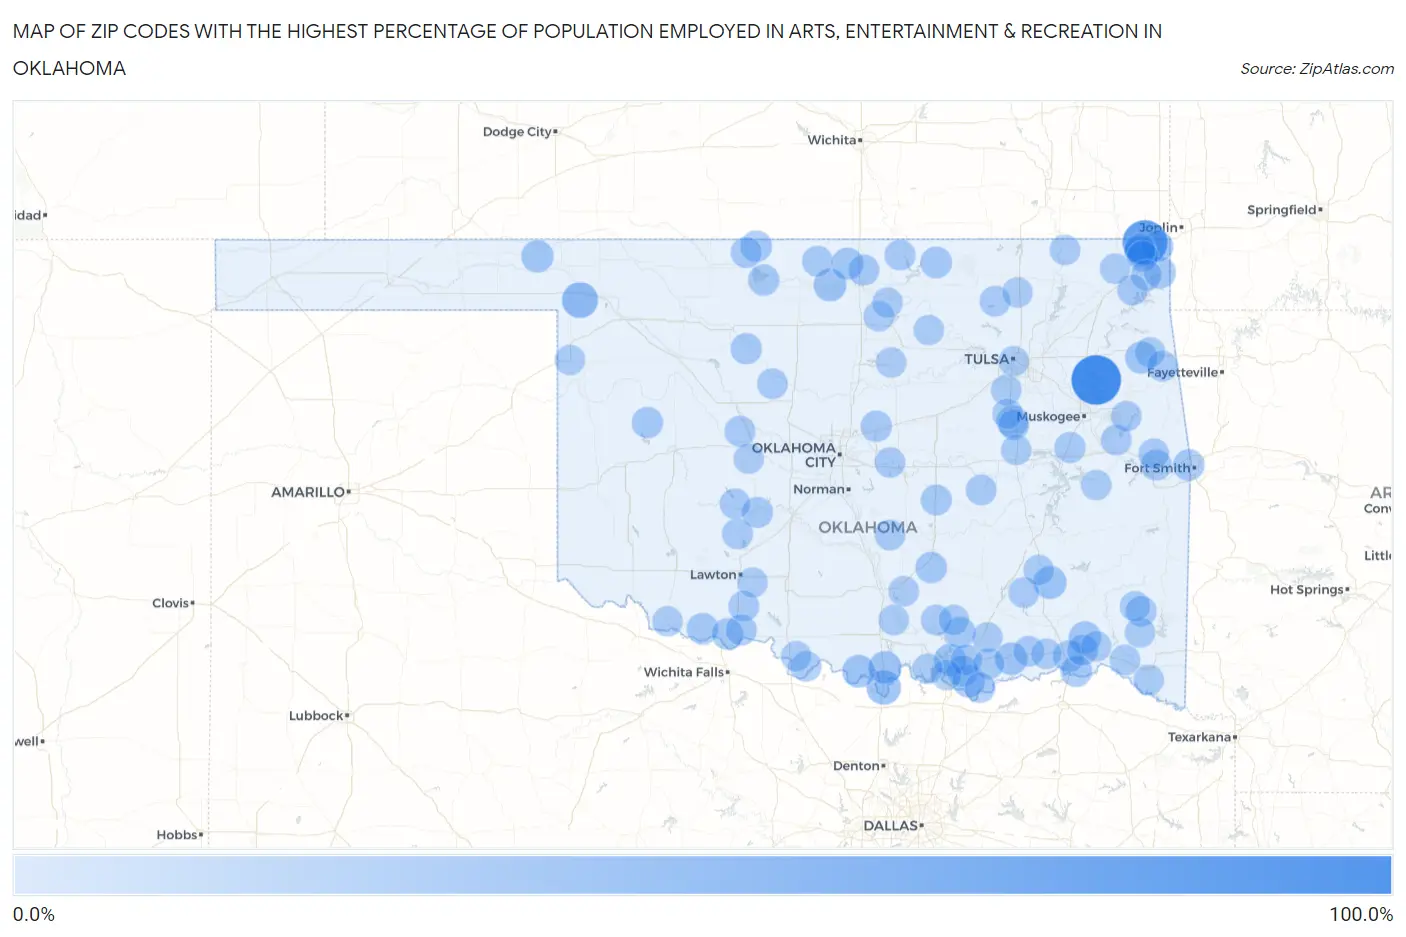
Map of Zip Codes with the Highest Percentage of Population Employed in Arts, Entertainment & Recreation in Oklahoma
0.0%
100.0%
Zip Codes with the Highest Percentage of Population Employed in Arts, Entertainment & Recreation in Oklahoma
| Zip Code | % Employed | vs State | vs National | |
| 1. | 74477 | 100.0% | 2.4%(+97.6)#1 | 2.1%(+97.9)#12 |
| 2. | 74360 | 75.0% | 2.4%(+72.6)#2 | 2.1%(+72.9)#17 |
| 3. | 73851 | 31.4% | 2.4%(+29.0)#3 | 2.1%(+29.3)#72 |
| 4. | 73459 | 23.8% | 2.4%(+21.4)#4 | 2.1%(+21.7)#126 |
| 5. | 74540 | 17.1% | 2.4%(+14.7)#5 | 2.1%(+15.0)#256 |
| 6. | 73448 | 16.2% | 2.4%(+13.8)#6 | 2.1%(+14.1)#285 |
| 7. | 73430 | 15.8% | 2.4%(+13.4)#7 | 2.1%(+13.7)#305 |
| 8. | 74643 | 15.7% | 2.4%(+13.3)#8 | 2.1%(+13.6)#308 |
| 9. | 74723 | 14.9% | 2.4%(+12.6)#9 | 2.1%(+12.9)#334 |
| 10. | 74760 | 14.5% | 2.4%(+12.2)#10 | 2.1%(+12.5)#360 |
| 11. | 74720 | 14.0% | 2.4%(+11.6)#11 | 2.1%(+11.9)#390 |
| 12. | 73449 | 13.7% | 2.4%(+11.3)#12 | 2.1%(+11.6)#407 |
| 13. | 74359 | 13.6% | 2.4%(+11.2)#13 | 2.1%(+11.6)#410 |
| 14. | 73844 | 13.5% | 2.4%(+11.1)#14 | 2.1%(+11.5)#414 |
| 15. | 74646 | 12.9% | 2.4%(+10.5)#15 | 2.1%(+10.8)#455 |
| 16. | 74456 | 11.6% | 2.4%(+9.24)#16 | 2.1%(+9.55)#544 |
| 17. | 74370 | 10.8% | 2.4%(+8.38)#17 | 2.1%(+8.69)#618 |
| 18. | 74652 | 10.7% | 2.4%(+8.26)#18 | 2.1%(+8.57)#629 |
| 19. | 74743 | 10.6% | 2.4%(+8.16)#19 | 2.1%(+8.47)#647 |
| 20. | 73546 | 10.5% | 2.4%(+8.09)#20 | 2.1%(+8.40)#651 |
| 21. | 74363 | 10.1% | 2.4%(+7.71)#21 | 2.1%(+8.01)#693 |
| 22. | 74738 | 10.1% | 2.4%(+7.67)#22 | 2.1%(+7.97)#696 |
| 23. | 74946 | 10.0% | 2.4%(+7.61)#23 | 2.1%(+7.92)#703 |
| 24. | 73719 | 9.8% | 2.4%(+7.45)#24 | 2.1%(+7.75)#726 |
| 25. | 74843 | 9.7% | 2.4%(+7.29)#25 | 2.1%(+7.59)#751 |
| 26. | 73531 | 9.6% | 2.4%(+7.16)#26 | 2.1%(+7.47)#771 |
| 27. | 73625 | 9.3% | 2.4%(+6.89)#27 | 2.1%(+7.20)#810 |
| 28. | 74748 | 9.2% | 2.4%(+6.85)#28 | 2.1%(+7.15)#816 |
| 29. | 73749 | 9.0% | 2.4%(+6.62)#29 | 2.1%(+6.93)#855 |
| 30. | 74730 | 8.9% | 2.4%(+6.46)#30 | 2.1%(+6.77)#876 |
| 31. | 73054 | 8.5% | 2.4%(+6.07)#31 | 2.1%(+6.38)#949 |
| 32. | 73747 | 8.3% | 2.4%(+5.94)#32 | 2.1%(+6.25)#980 |
| 33. | 74358 | 8.2% | 2.4%(+5.84)#33 | 2.1%(+6.15)#997 |
| 34. | 74339 | 8.1% | 2.4%(+5.74)#34 | 2.1%(+6.05)#1,021 |
| 35. | 74701 | 8.1% | 2.4%(+5.72)#35 | 2.1%(+6.03)#1,028 |
| 36. | 74459 | 8.0% | 2.4%(+5.61)#36 | 2.1%(+5.92)#1,059 |
| 37. | 74936 | 8.0% | 2.4%(+5.60)#37 | 2.1%(+5.91)#1,060 |
| 38. | 74631 | 7.8% | 2.4%(+5.39)#38 | 2.1%(+5.70)#1,112 |
| 39. | 74354 | 7.5% | 2.4%(+5.15)#39 | 2.1%(+5.46)#1,173 |
| 40. | 73005 | 7.5% | 2.4%(+5.13)#40 | 2.1%(+5.44)#1,175 |
| 41. | 74756 | 7.5% | 2.4%(+5.09)#41 | 2.1%(+5.40)#1,182 |
| 42. | 74726 | 7.3% | 2.4%(+4.88)#42 | 2.1%(+5.19)#1,243 |
| 43. | 74830 | 7.3% | 2.4%(+4.88)#43 | 2.1%(+5.19)#1,245 |
| 44. | 73562 | 7.2% | 2.4%(+4.82)#44 | 2.1%(+5.13)#1,264 |
| 45. | 73722 | 7.2% | 2.4%(+4.79)#45 | 2.1%(+5.10)#1,270 |
| 46. | 74647 | 6.9% | 2.4%(+4.49)#46 | 2.1%(+4.80)#1,369 |
| 47. | 73006 | 6.6% | 2.4%(+4.25)#47 | 2.1%(+4.56)#1,444 |
| 48. | 74435 | 6.5% | 2.4%(+4.12)#48 | 2.1%(+4.43)#1,485 |
| 49. | 73040 | 6.5% | 2.4%(+4.12)#49 | 2.1%(+4.43)#1,488 |
| 50. | 74343 | 6.5% | 2.4%(+4.07)#50 | 2.1%(+4.37)#1,519 |
| 51. | 74831 | 6.4% | 2.4%(+4.05)#51 | 2.1%(+4.36)#1,523 |
| 52. | 74724 | 6.3% | 2.4%(+3.96)#52 | 2.1%(+4.27)#1,564 |
| 53. | 73572 | 6.3% | 2.4%(+3.92)#53 | 2.1%(+4.22)#1,584 |
| 54. | 73756 | 6.3% | 2.4%(+3.90)#54 | 2.1%(+4.21)#1,590 |
| 55. | 73759 | 6.2% | 2.4%(+3.85)#55 | 2.1%(+4.16)#1,610 |
| 56. | 74964 | 6.1% | 2.4%(+3.74)#56 | 2.1%(+4.05)#1,643 |
| 57. | 74741 | 6.0% | 2.4%(+3.62)#57 | 2.1%(+3.93)#1,699 |
| 58. | 74331 | 6.0% | 2.4%(+3.59)#58 | 2.1%(+3.90)#1,710 |
| 59. | 74002 | 5.9% | 2.4%(+3.53)#59 | 2.1%(+3.83)#1,739 |
| 60. | 74955 | 5.9% | 2.4%(+3.48)#60 | 2.1%(+3.79)#1,771 |
| 61. | 74569 | 5.8% | 2.4%(+3.40)#61 | 2.1%(+3.71)#1,811 |
| 62. | 74451 | 5.7% | 2.4%(+3.32)#62 | 2.1%(+3.63)#1,845 |
| 63. | 74883 | 5.7% | 2.4%(+3.27)#63 | 2.1%(+3.57)#1,884 |
| 64. | 74727 | 5.5% | 2.4%(+3.13)#64 | 2.1%(+3.44)#1,953 |
| 65. | 74651 | 5.5% | 2.4%(+3.10)#65 | 2.1%(+3.41)#1,970 |
| 66. | 74041 | 5.5% | 2.4%(+3.09)#66 | 2.1%(+3.40)#1,976 |
| 67. | 73460 | 5.4% | 2.4%(+3.03)#67 | 2.1%(+3.34)#2,008 |
| 68. | 73569 | 5.4% | 2.4%(+2.99)#68 | 2.1%(+3.29)#2,036 |
| 69. | 74851 | 5.4% | 2.4%(+2.98)#69 | 2.1%(+3.28)#2,047 |
| 70. | 73038 | 5.4% | 2.4%(+2.97)#70 | 2.1%(+3.28)#2,049 |
| 71. | 73086 | 5.3% | 2.4%(+2.87)#71 | 2.1%(+3.18)#2,098 |
| 72. | 74072 | 5.2% | 2.4%(+2.84)#72 | 2.1%(+3.15)#2,134 |
| 73. | 74750 | 5.2% | 2.4%(+2.80)#73 | 2.1%(+3.11)#2,161 |
| 74. | 74644 | 5.1% | 2.4%(+2.71)#74 | 2.1%(+3.02)#2,212 |
| 75. | 74077 | 5.1% | 2.4%(+2.71)#75 | 2.1%(+3.02)#2,214 |
| 76. | 74560 | 5.0% | 2.4%(+2.64)#76 | 2.1%(+2.95)#2,265 |
| 77. | 73450 | 5.0% | 2.4%(+2.64)#77 | 2.1%(+2.95)#2,269 |
| 78. | 74729 | 5.0% | 2.4%(+2.64)#78 | 2.1%(+2.94)#2,270 |
| 79. | 73565 | 5.0% | 2.4%(+2.59)#79 | 2.1%(+2.90)#2,298 |
| 80. | 74347 | 5.0% | 2.4%(+2.57)#80 | 2.1%(+2.88)#2,317 |
| 81. | 74333 | 4.9% | 2.4%(+2.51)#81 | 2.1%(+2.81)#2,363 |
| 82. | 74759 | 4.9% | 2.4%(+2.49)#82 | 2.1%(+2.80)#2,374 |
| 83. | 74745 | 4.9% | 2.4%(+2.47)#83 | 2.1%(+2.78)#2,390 |
| 84. | 74051 | 4.8% | 2.4%(+2.44)#84 | 2.1%(+2.75)#2,410 |
| 85. | 74472 | 4.8% | 2.4%(+2.41)#85 | 2.1%(+2.72)#2,438 |
| 86. | 74735 | 4.7% | 2.4%(+2.36)#86 | 2.1%(+2.67)#2,485 |
| 87. | 73436 | 4.6% | 2.4%(+2.22)#87 | 2.1%(+2.53)#2,614 |
| 88. | 74119 | 4.6% | 2.4%(+2.22)#88 | 2.1%(+2.53)#2,619 |
| 89. | 73047 | 4.6% | 2.4%(+2.18)#89 | 2.1%(+2.49)#2,657 |
| 90. | 74731 | 4.6% | 2.4%(+2.17)#90 | 2.1%(+2.48)#2,669 |
| 91. | 73439 | 4.5% | 2.4%(+2.15)#91 | 2.1%(+2.45)#2,695 |
| 92. | 74728 | 4.5% | 2.4%(+2.14)#92 | 2.1%(+2.45)#2,698 |
| 93. | 74447 | 4.5% | 2.4%(+2.14)#93 | 2.1%(+2.45)#2,707 |
| 94. | 73858 | 4.4% | 2.4%(+2.06)#94 | 2.1%(+2.37)#2,800 |
| 95. | 74460 | 4.4% | 2.4%(+2.05)#95 | 2.1%(+2.36)#2,806 |
| 96. | 74421 | 4.4% | 2.4%(+2.03)#96 | 2.1%(+2.34)#2,822 |
| 97. | 74058 | 4.4% | 2.4%(+2.03)#97 | 2.1%(+2.34)#2,825 |
| 98. | 73530 | 4.4% | 2.4%(+1.98)#98 | 2.1%(+2.29)#2,877 |
| 99. | 73501 | 4.4% | 2.4%(+1.97)#99 | 2.1%(+2.28)#2,892 |
| 100. | 74722 | 4.3% | 2.4%(+1.96)#100 | 2.1%(+2.27)#2,905 |
Common Questions
What are the Top 10 Zip Codes with the Highest Percentage of Population Employed in Arts, Entertainment & Recreation in Oklahoma?
Top 10 Zip Codes with the Highest Percentage of Population Employed in Arts, Entertainment & Recreation in Oklahoma are:
What zip code has the Highest Percentage of Population Employed in Arts, Entertainment & Recreation in Oklahoma?
74477 has the Highest Percentage of Population Employed in Arts, Entertainment & Recreation in Oklahoma with 100.0%.
What is the Percentage of Population Employed in Arts, Entertainment & Recreation in the State of Oklahoma?
Percentage of Population Employed in Arts, Entertainment & Recreation in Oklahoma is 2.4%.
What is the Percentage of Population Employed in Arts, Entertainment & Recreation in the United States?
Percentage of Population Employed in Arts, Entertainment & Recreation in the United States is 2.1%.