Zip Codes with the Highest Percentage of Population Employed in Arts, Entertainment & Recreation in New Jersey
RELATED REPORTS & OPTIONS
Arts, Entertainment & Recreation
New Jersey
Compare Zip Codes
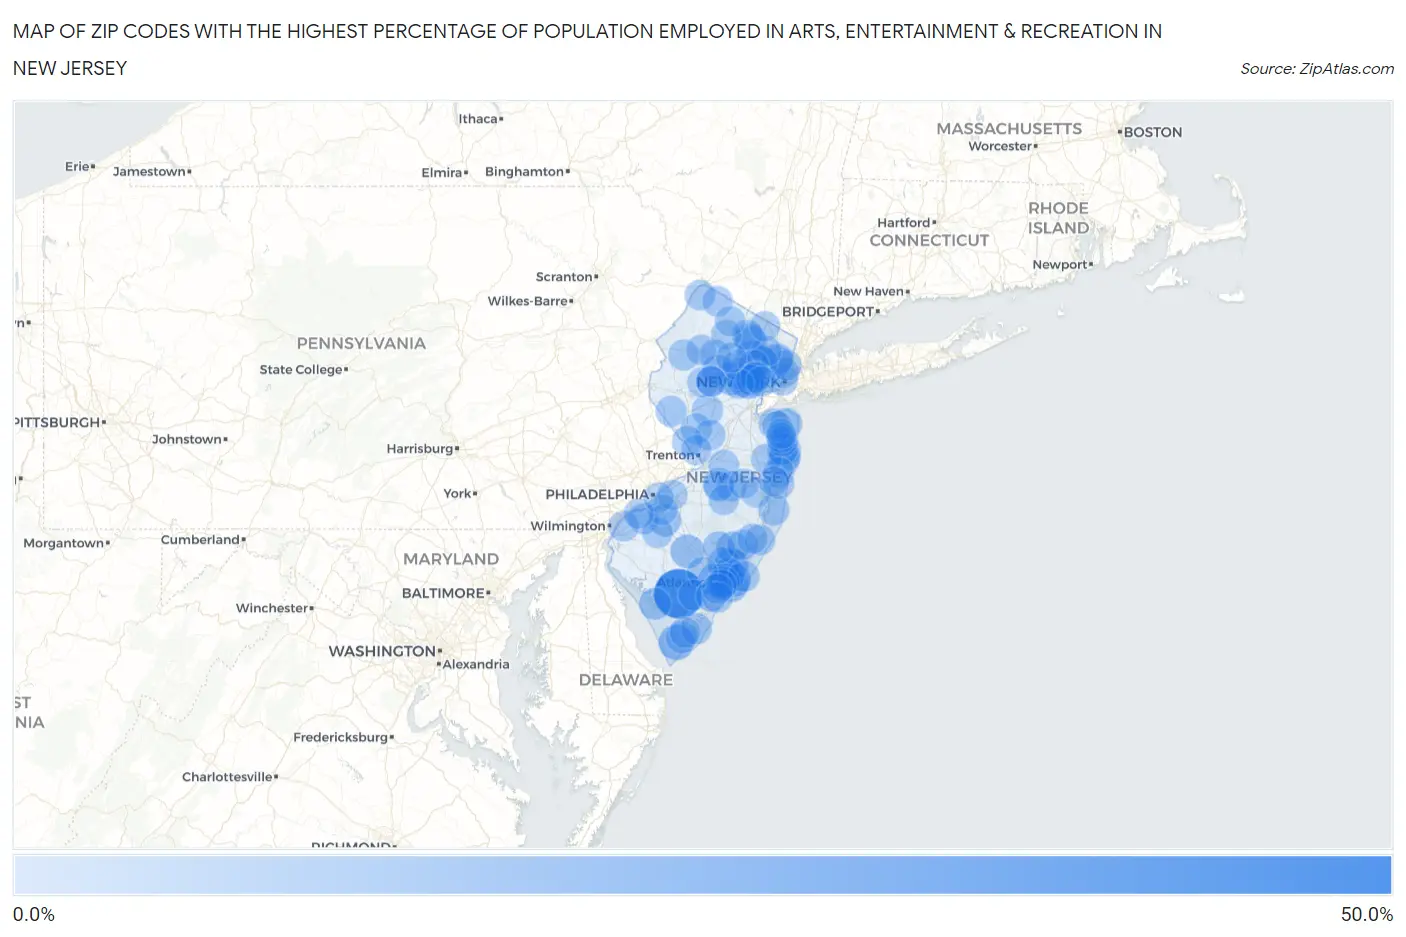
Map of Zip Codes with the Highest Percentage of Population Employed in Arts, Entertainment & Recreation in New Jersey
0.0%
50.0%
Zip Codes with the Highest Percentage of Population Employed in Arts, Entertainment & Recreation in New Jersey
| Zip Code | % Employed | vs State | vs National | |
| 1. | 08316 | 48.6% | 2.1%(+46.5)#1 | 2.1%(+46.5)#34 |
| 2. | 08212 | 15.2% | 2.1%(+13.1)#2 | 2.1%(+13.1)#326 |
| 3. | 08406 | 12.3% | 2.1%(+10.2)#3 | 2.1%(+10.2)#486 |
| 4. | 08232 | 12.1% | 2.1%(+10.0)#4 | 2.1%(+10.0)#499 |
| 5. | 08401 | 11.8% | 2.1%(+9.76)#5 | 2.1%(+9.75)#523 |
| 6. | 08346 | 11.7% | 2.1%(+9.63)#6 | 2.1%(+9.62)#539 |
| 7. | 08205 | 11.0% | 2.1%(+8.88)#7 | 2.1%(+8.87)#607 |
| 8. | 08234 | 10.2% | 2.1%(+8.16)#8 | 2.1%(+8.15)#673 |
| 9. | 07976 | 10.2% | 2.1%(+8.11)#9 | 2.1%(+8.10)#682 |
| 10. | 08240 | 8.4% | 2.1%(+6.32)#10 | 2.1%(+6.31)#969 |
| 11. | 08201 | 8.2% | 2.1%(+6.14)#11 | 2.1%(+6.13)#1,001 |
| 12. | 08032 | 8.1% | 2.1%(+5.98)#12 | 2.1%(+5.97)#1,044 |
| 13. | 08224 | 7.8% | 2.1%(+5.70)#13 | 2.1%(+5.68)#1,117 |
| 14. | 08321 | 7.7% | 2.1%(+5.62)#14 | 2.1%(+5.61)#1,138 |
| 15. | 08215 | 7.4% | 2.1%(+5.33)#15 | 2.1%(+5.32)#1,206 |
| 16. | 07732 | 7.0% | 2.1%(+4.92)#16 | 2.1%(+4.91)#1,334 |
| 17. | 07717 | 6.9% | 2.1%(+4.80)#17 | 2.1%(+4.78)#1,372 |
| 18. | 07723 | 6.8% | 2.1%(+4.74)#18 | 2.1%(+4.73)#1,389 |
| 19. | 08225 | 6.7% | 2.1%(+4.67)#19 | 2.1%(+4.66)#1,405 |
| 20. | 08641 | 6.6% | 2.1%(+4.56)#20 | 2.1%(+4.55)#1,447 |
| 21. | 07756 | 6.4% | 2.1%(+4.34)#21 | 2.1%(+4.32)#1,539 |
| 22. | 07444 | 6.4% | 2.1%(+4.33)#22 | 2.1%(+4.32)#1,540 |
| 23. | 08203 | 6.2% | 2.1%(+4.09)#23 | 2.1%(+4.07)#1,632 |
| 24. | 07755 | 6.1% | 2.1%(+4.05)#24 | 2.1%(+4.04)#1,649 |
| 25. | 08752 | 5.8% | 2.1%(+3.73)#25 | 2.1%(+3.71)#1,808 |
| 26. | 07901 | 5.7% | 2.1%(+3.68)#26 | 2.1%(+3.66)#1,826 |
| 27. | 08204 | 5.7% | 2.1%(+3.64)#27 | 2.1%(+3.63)#1,843 |
| 28. | 08247 | 5.7% | 2.1%(+3.64)#28 | 2.1%(+3.62)#1,853 |
| 29. | 07004 | 5.7% | 2.1%(+3.63)#29 | 2.1%(+3.62)#1,855 |
| 30. | 07088 | 5.6% | 2.1%(+3.55)#30 | 2.1%(+3.54)#1,896 |
| 31. | 08821 | 5.3% | 2.1%(+3.27)#31 | 2.1%(+3.26)#2,059 |
| 32. | 07311 | 5.2% | 2.1%(+3.17)#32 | 2.1%(+3.16)#2,128 |
| 33. | 08825 | 5.2% | 2.1%(+3.17)#33 | 2.1%(+3.15)#2,132 |
| 34. | 08330 | 5.2% | 2.1%(+3.13)#34 | 2.1%(+3.11)#2,160 |
| 35. | 08525 | 5.1% | 2.1%(+3.04)#35 | 2.1%(+3.03)#2,203 |
| 36. | 07606 | 5.0% | 2.1%(+2.95)#36 | 2.1%(+2.94)#2,274 |
| 37. | 08730 | 5.0% | 2.1%(+2.92)#37 | 2.1%(+2.90)#2,296 |
| 38. | 08270 | 4.9% | 2.1%(+2.88)#38 | 2.1%(+2.86)#2,325 |
| 39. | 08223 | 4.9% | 2.1%(+2.85)#39 | 2.1%(+2.84)#2,346 |
| 40. | 07086 | 4.9% | 2.1%(+2.84)#40 | 2.1%(+2.82)#2,355 |
| 41. | 07457 | 4.9% | 2.1%(+2.81)#41 | 2.1%(+2.80)#2,378 |
| 42. | 08056 | 4.8% | 2.1%(+2.78)#42 | 2.1%(+2.76)#2,402 |
| 43. | 08087 | 4.8% | 2.1%(+2.72)#43 | 2.1%(+2.70)#2,454 |
| 44. | 07847 | 4.8% | 2.1%(+2.70)#44 | 2.1%(+2.69)#2,465 |
| 45. | 07604 | 4.8% | 2.1%(+2.69)#45 | 2.1%(+2.67)#2,477 |
| 46. | 08542 | 4.7% | 2.1%(+2.63)#46 | 2.1%(+2.62)#2,529 |
| 47. | 07838 | 4.7% | 2.1%(+2.58)#47 | 2.1%(+2.57)#2,575 |
| 48. | 08221 | 4.6% | 2.1%(+2.49)#48 | 2.1%(+2.48)#2,668 |
| 49. | 07940 | 4.5% | 2.1%(+2.48)#49 | 2.1%(+2.47)#2,680 |
| 50. | 07010 | 4.5% | 2.1%(+2.46)#50 | 2.1%(+2.45)#2,702 |
| 51. | 08501 | 4.5% | 2.1%(+2.44)#51 | 2.1%(+2.42)#2,731 |
| 52. | 07009 | 4.4% | 2.1%(+2.34)#52 | 2.1%(+2.33)#2,830 |
| 53. | 08560 | 4.3% | 2.1%(+2.26)#53 | 2.1%(+2.25)#2,928 |
| 54. | 07945 | 4.3% | 2.1%(+2.22)#54 | 2.1%(+2.21)#2,977 |
| 55. | 08738 | 4.3% | 2.1%(+2.22)#55 | 2.1%(+2.20)#2,981 |
| 56. | 07979 | 4.3% | 2.1%(+2.21)#56 | 2.1%(+2.20)#2,990 |
| 57. | 08242 | 4.3% | 2.1%(+2.21)#57 | 2.1%(+2.19)#2,992 |
| 58. | 08008 | 4.2% | 2.1%(+2.17)#58 | 2.1%(+2.16)#3,033 |
| 59. | 08028 | 4.2% | 2.1%(+2.14)#59 | 2.1%(+2.13)#3,065 |
| 60. | 07043 | 4.1% | 2.1%(+2.06)#60 | 2.1%(+2.05)#3,169 |
| 61. | 08226 | 4.1% | 2.1%(+2.04)#61 | 2.1%(+2.03)#3,185 |
| 62. | 08244 | 4.1% | 2.1%(+2.03)#62 | 2.1%(+2.02)#3,200 |
| 63. | 07727 | 4.1% | 2.1%(+1.99)#63 | 2.1%(+1.98)#3,245 |
| 64. | 07874 | 4.0% | 2.1%(+1.96)#64 | 2.1%(+1.94)#3,298 |
| 65. | 07827 | 4.0% | 2.1%(+1.93)#65 | 2.1%(+1.92)#3,347 |
| 66. | 07981 | 4.0% | 2.1%(+1.92)#66 | 2.1%(+1.91)#3,361 |
| 67. | 08067 | 4.0% | 2.1%(+1.90)#67 | 2.1%(+1.88)#3,382 |
| 68. | 07977 | 3.9% | 2.1%(+1.87)#68 | 2.1%(+1.86)#3,418 |
| 69. | 07081 | 3.9% | 2.1%(+1.86)#69 | 2.1%(+1.85)#3,427 |
| 70. | 08533 | 3.9% | 2.1%(+1.85)#70 | 2.1%(+1.84)#3,447 |
| 71. | 07461 | 3.9% | 2.1%(+1.84)#71 | 2.1%(+1.83)#3,460 |
| 72. | 07505 | 3.8% | 2.1%(+1.74)#72 | 2.1%(+1.73)#3,610 |
| 73. | 07021 | 3.8% | 2.1%(+1.73)#73 | 2.1%(+1.72)#3,628 |
| 74. | 07403 | 3.8% | 2.1%(+1.69)#74 | 2.1%(+1.68)#3,686 |
| 75. | 07931 | 3.7% | 2.1%(+1.67)#75 | 2.1%(+1.66)#3,714 |
| 76. | 07758 | 3.7% | 2.1%(+1.63)#76 | 2.1%(+1.61)#3,782 |
| 77. | 07737 | 3.7% | 2.1%(+1.62)#77 | 2.1%(+1.61)#3,785 |
| 78. | 07757 | 3.6% | 2.1%(+1.53)#78 | 2.1%(+1.51)#3,960 |
| 79. | 07079 | 3.6% | 2.1%(+1.50)#79 | 2.1%(+1.49)#3,994 |
| 80. | 07041 | 3.6% | 2.1%(+1.49)#80 | 2.1%(+1.48)#4,021 |
| 81. | 08618 | 3.5% | 2.1%(+1.45)#81 | 2.1%(+1.44)#4,087 |
| 82. | 07040 | 3.5% | 2.1%(+1.42)#82 | 2.1%(+1.41)#4,151 |
| 83. | 08640 | 3.4% | 2.1%(+1.38)#83 | 2.1%(+1.37)#4,237 |
| 84. | 08078 | 3.4% | 2.1%(+1.38)#84 | 2.1%(+1.36)#4,248 |
| 85. | 08757 | 3.4% | 2.1%(+1.35)#85 | 2.1%(+1.34)#4,306 |
| 86. | 08015 | 3.4% | 2.1%(+1.32)#86 | 2.1%(+1.31)#4,374 |
| 87. | 07974 | 3.4% | 2.1%(+1.32)#87 | 2.1%(+1.30)#4,386 |
| 88. | 07438 | 3.4% | 2.1%(+1.31)#88 | 2.1%(+1.30)#4,397 |
| 89. | 07878 | 3.4% | 2.1%(+1.28)#89 | 2.1%(+1.27)#4,458 |
| 90. | 08092 | 3.3% | 2.1%(+1.27)#90 | 2.1%(+1.26)#4,483 |
| 91. | 08027 | 3.3% | 2.1%(+1.26)#91 | 2.1%(+1.25)#4,509 |
| 92. | 07739 | 3.3% | 2.1%(+1.24)#92 | 2.1%(+1.23)#4,544 |
| 93. | 07112 | 3.3% | 2.1%(+1.23)#93 | 2.1%(+1.21)#4,573 |
| 94. | 07704 | 3.3% | 2.1%(+1.23)#94 | 2.1%(+1.21)#4,574 |
| 95. | 08733 | 3.3% | 2.1%(+1.20)#95 | 2.1%(+1.18)#4,641 |
| 96. | 08052 | 3.3% | 2.1%(+1.18)#96 | 2.1%(+1.17)#4,670 |
| 97. | 08103 | 3.2% | 2.1%(+1.18)#97 | 2.1%(+1.16)#4,691 |
| 98. | 07430 | 3.2% | 2.1%(+1.16)#98 | 2.1%(+1.14)#4,739 |
| 99. | 08723 | 3.2% | 2.1%(+1.15)#99 | 2.1%(+1.14)#4,748 |
| 100. | 07460 | 3.2% | 2.1%(+1.14)#100 | 2.1%(+1.13)#4,773 |
Common Questions
What are the Top 10 Zip Codes with the Highest Percentage of Population Employed in Arts, Entertainment & Recreation in New Jersey?
Top 10 Zip Codes with the Highest Percentage of Population Employed in Arts, Entertainment & Recreation in New Jersey are:
What zip code has the Highest Percentage of Population Employed in Arts, Entertainment & Recreation in New Jersey?
08316 has the Highest Percentage of Population Employed in Arts, Entertainment & Recreation in New Jersey with 48.6%.
What is the Percentage of Population Employed in Arts, Entertainment & Recreation in the State of New Jersey?
Percentage of Population Employed in Arts, Entertainment & Recreation in New Jersey is 2.1%.
What is the Percentage of Population Employed in Arts, Entertainment & Recreation in the United States?
Percentage of Population Employed in Arts, Entertainment & Recreation in the United States is 2.1%.