Zip Codes with the Highest Percentage of Population Employed in Arts, Entertainment & Recreation in South Carolina
RELATED REPORTS & OPTIONS
Arts, Entertainment & Recreation
South Carolina
Compare Zip Codes
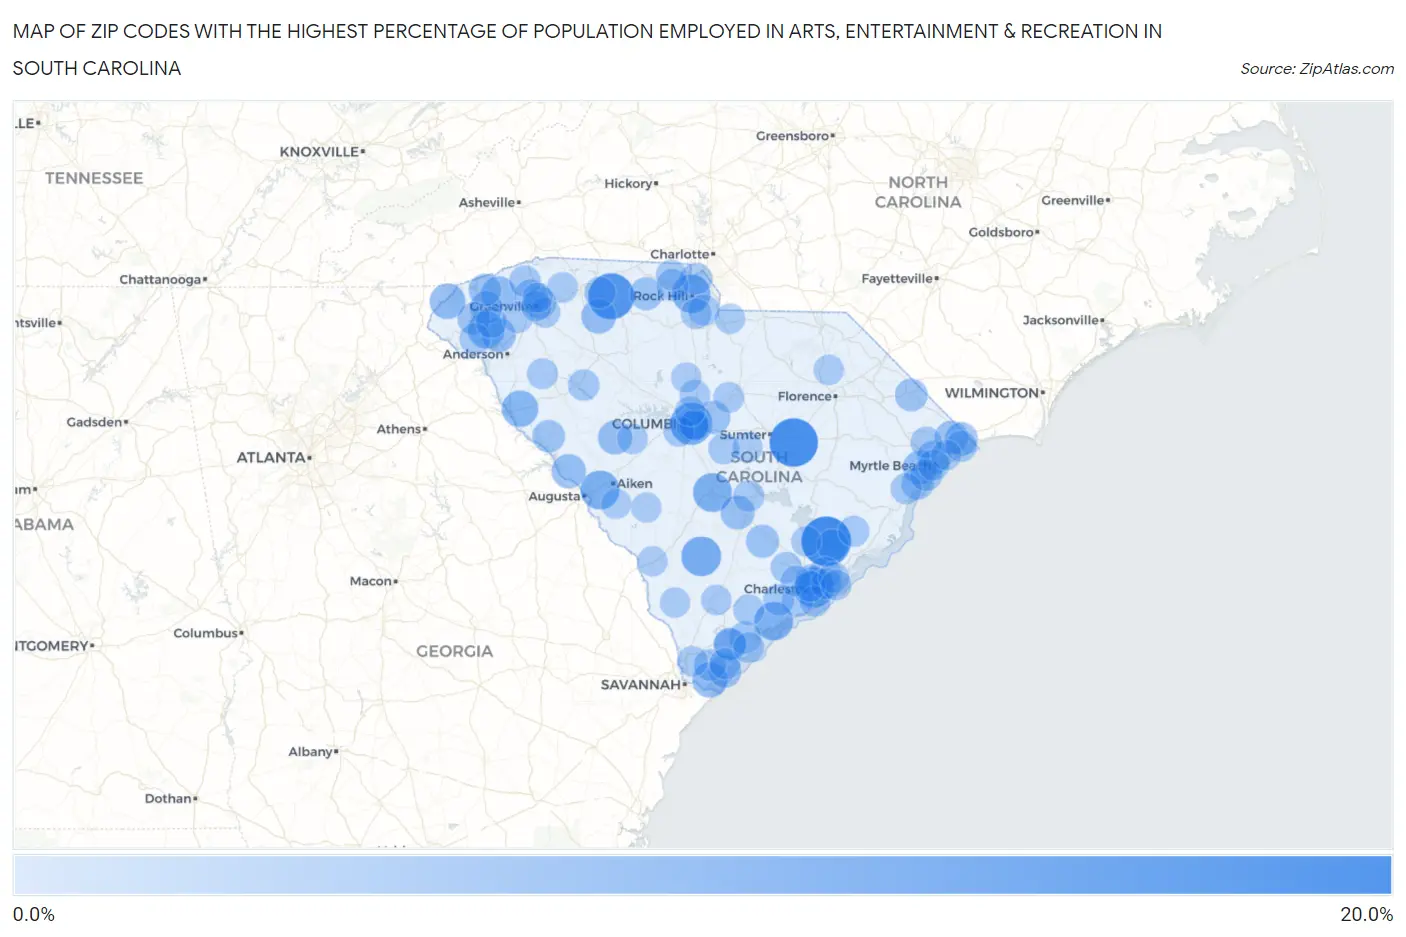
Map of Zip Codes with the Highest Percentage of Population Employed in Arts, Entertainment & Recreation in South Carolina
0.0%
20.0%
Zip Codes with the Highest Percentage of Population Employed in Arts, Entertainment & Recreation in South Carolina
| Zip Code | % Employed | vs State | vs National | |
| 1. | 29434 | 19.7% | 1.8%(+17.9)#1 | 2.1%(+17.6)#191 |
| 2. | 29051 | 18.7% | 1.8%(+16.9)#2 | 2.1%(+16.6)#218 |
| 3. | 29373 | 16.4% | 1.8%(+14.6)#3 | 2.1%(+14.3)#275 |
| 4. | 29225 | 12.7% | 1.8%(+10.9)#4 | 2.1%(+10.6)#473 |
| 5. | 29409 | 11.2% | 1.8%(+9.40)#5 | 2.1%(+9.07)#585 |
| 6. | 29082 | 10.6% | 1.8%(+8.88)#6 | 2.1%(+8.56)#631 |
| 7. | 29834 | 9.9% | 1.8%(+8.18)#7 | 2.1%(+7.85)#710 |
| 8. | 29117 | 9.8% | 1.8%(+8.04)#8 | 2.1%(+7.72)#733 |
| 9. | 29438 | 9.5% | 1.8%(+7.79)#9 | 2.1%(+7.46)#773 |
| 10. | 29733 | 9.4% | 1.8%(+7.68)#10 | 2.1%(+7.36)#784 |
| 11. | 29634 | 7.8% | 1.8%(+6.07)#11 | 2.1%(+5.74)#1,100 |
| 12. | 29628 | 7.6% | 1.8%(+5.84)#12 | 2.1%(+5.52)#1,153 |
| 13. | 29664 | 6.8% | 1.8%(+5.04)#13 | 2.1%(+4.72)#1,394 |
| 14. | 29915 | 6.5% | 1.8%(+4.71)#14 | 2.1%(+4.39)#1,513 |
| 15. | 29671 | 6.3% | 1.8%(+4.56)#15 | 2.1%(+4.23)#1,576 |
| 16. | 29374 | 6.1% | 1.8%(+4.31)#16 | 2.1%(+3.98)#1,669 |
| 17. | 29821 | 5.7% | 1.8%(+3.94)#17 | 2.1%(+3.62)#1,857 |
| 18. | 29670 | 5.5% | 1.8%(+3.74)#18 | 2.1%(+3.42)#1,960 |
| 19. | 29588 | 5.4% | 1.8%(+3.68)#19 | 2.1%(+3.36)#1,998 |
| 20. | 29166 | 5.4% | 1.8%(+3.67)#20 | 2.1%(+3.35)#2,005 |
| 21. | 29018 | 5.3% | 1.8%(+3.57)#21 | 2.1%(+3.24)#2,066 |
| 22. | 29579 | 5.2% | 1.8%(+3.41)#22 | 2.1%(+3.08)#2,177 |
| 23. | 29613 | 5.0% | 1.8%(+3.22)#23 | 2.1%(+2.90)#2,300 |
| 24. | 29568 | 4.7% | 1.8%(+2.98)#24 | 2.1%(+2.66)#2,491 |
| 25. | 29207 | 4.7% | 1.8%(+2.90)#25 | 2.1%(+2.58)#2,565 |
| 26. | 29437 | 4.6% | 1.8%(+2.82)#26 | 2.1%(+2.50)#2,648 |
| 27. | 29717 | 4.5% | 1.8%(+2.77)#27 | 2.1%(+2.45)#2,703 |
| 28. | 29566 | 4.5% | 1.8%(+2.77)#28 | 2.1%(+2.45)#2,708 |
| 29. | 29928 | 4.4% | 1.8%(+2.65)#29 | 2.1%(+2.32)#2,841 |
| 30. | 29581 | 4.3% | 1.8%(+2.50)#30 | 2.1%(+2.18)#3,007 |
| 31. | 29682 | 4.2% | 1.8%(+2.46)#31 | 2.1%(+2.14)#3,057 |
| 32. | 29685 | 4.1% | 1.8%(+2.35)#32 | 2.1%(+2.02)#3,194 |
| 33. | 29672 | 4.1% | 1.8%(+2.30)#33 | 2.1%(+1.98)#3,255 |
| 34. | 29835 | 4.0% | 1.8%(+2.28)#34 | 2.1%(+1.95)#3,282 |
| 35. | 29902 | 4.0% | 1.8%(+2.23)#35 | 2.1%(+1.91)#3,359 |
| 36. | 29907 | 3.8% | 1.8%(+2.05)#36 | 2.1%(+1.73)#3,612 |
| 37. | 29614 | 3.8% | 1.8%(+2.04)#37 | 2.1%(+1.72)#3,623 |
| 38. | 29576 | 3.7% | 1.8%(+1.95)#38 | 2.1%(+1.63)#3,749 |
| 39. | 29910 | 3.6% | 1.8%(+1.85)#39 | 2.1%(+1.52)#3,939 |
| 40. | 29935 | 3.6% | 1.8%(+1.84)#40 | 2.1%(+1.52)#3,946 |
| 41. | 29208 | 3.5% | 1.8%(+1.77)#41 | 2.1%(+1.45)#4,057 |
| 42. | 29403 | 3.5% | 1.8%(+1.76)#42 | 2.1%(+1.44)#4,082 |
| 43. | 29575 | 3.5% | 1.8%(+1.76)#43 | 2.1%(+1.44)#4,089 |
| 44. | 29201 | 3.5% | 1.8%(+1.70)#44 | 2.1%(+1.38)#4,219 |
| 45. | 29450 | 3.4% | 1.8%(+1.67)#45 | 2.1%(+1.35)#4,289 |
| 46. | 29708 | 3.4% | 1.8%(+1.64)#46 | 2.1%(+1.32)#4,355 |
| 47. | 29745 | 3.4% | 1.8%(+1.64)#47 | 2.1%(+1.31)#4,365 |
| 48. | 29683 | 3.2% | 1.8%(+1.48)#48 | 2.1%(+1.16)#4,696 |
| 49. | 29492 | 3.2% | 1.8%(+1.45)#49 | 2.1%(+1.12)#4,789 |
| 50. | 29526 | 3.1% | 1.8%(+1.37)#50 | 2.1%(+1.04)#4,991 |
| 51. | 29455 | 3.1% | 1.8%(+1.32)#51 | 2.1%(+0.997)#5,128 |
| 52. | 29346 | 3.1% | 1.8%(+1.31)#52 | 2.1%(+0.985)#5,170 |
| 53. | 29332 | 3.1% | 1.8%(+1.30)#53 | 2.1%(+0.975)#5,199 |
| 54. | 29577 | 3.0% | 1.8%(+1.22)#54 | 2.1%(+0.899)#5,410 |
| 55. | 29449 | 3.0% | 1.8%(+1.22)#55 | 2.1%(+0.899)#5,413 |
| 56. | 29704 | 2.9% | 1.8%(+1.18)#56 | 2.1%(+0.859)#5,528 |
| 57. | 29485 | 2.9% | 1.8%(+1.15)#57 | 2.1%(+0.830)#5,612 |
| 58. | 29405 | 2.9% | 1.8%(+1.12)#58 | 2.1%(+0.797)#5,713 |
| 59. | 29582 | 2.9% | 1.8%(+1.11)#59 | 2.1%(+0.785)#5,755 |
| 60. | 29142 | 2.9% | 1.8%(+1.10)#60 | 2.1%(+0.775)#5,782 |
| 61. | 29678 | 2.8% | 1.8%(+1.09)#61 | 2.1%(+0.764)#5,833 |
| 62. | 29585 | 2.8% | 1.8%(+1.02)#62 | 2.1%(+0.696)#6,070 |
| 63. | 29414 | 2.8% | 1.8%(+1.01)#63 | 2.1%(+0.687)#6,102 |
| 64. | 29453 | 2.8% | 1.8%(+1.01)#64 | 2.1%(+0.684)#6,112 |
| 65. | 29052 | 2.7% | 1.8%(+0.957)#65 | 2.1%(+0.634)#6,297 |
| 66. | 29630 | 2.7% | 1.8%(+0.935)#66 | 2.1%(+0.612)#6,384 |
| 67. | 29926 | 2.7% | 1.8%(+0.917)#67 | 2.1%(+0.595)#6,454 |
| 68. | 29642 | 2.7% | 1.8%(+0.907)#68 | 2.1%(+0.584)#6,495 |
| 69. | 29446 | 2.7% | 1.8%(+0.895)#69 | 2.1%(+0.572)#6,542 |
| 70. | 29412 | 2.6% | 1.8%(+0.873)#70 | 2.1%(+0.550)#6,628 |
| 71. | 29920 | 2.6% | 1.8%(+0.855)#71 | 2.1%(+0.532)#6,691 |
| 72. | 29464 | 2.6% | 1.8%(+0.823)#72 | 2.1%(+0.501)#6,829 |
| 73. | 29407 | 2.6% | 1.8%(+0.818)#73 | 2.1%(+0.495)#6,842 |
| 74. | 29170 | 2.6% | 1.8%(+0.794)#74 | 2.1%(+0.472)#6,936 |
| 75. | 29078 | 2.5% | 1.8%(+0.770)#75 | 2.1%(+0.448)#7,048 |
| 76. | 29638 | 2.5% | 1.8%(+0.743)#76 | 2.1%(+0.421)#7,157 |
| 77. | 29712 | 2.5% | 1.8%(+0.740)#77 | 2.1%(+0.417)#7,176 |
| 78. | 29365 | 2.5% | 1.8%(+0.739)#78 | 2.1%(+0.416)#7,184 |
| 79. | 29466 | 2.4% | 1.8%(+0.667)#79 | 2.1%(+0.344)#7,524 |
| 80. | 29006 | 2.4% | 1.8%(+0.652)#80 | 2.1%(+0.329)#7,586 |
| 81. | 29205 | 2.4% | 1.8%(+0.646)#81 | 2.1%(+0.323)#7,620 |
| 82. | 29927 | 2.3% | 1.8%(+0.514)#82 | 2.1%(+0.192)#8,251 |
| 83. | 29607 | 2.2% | 1.8%(+0.490)#83 | 2.1%(+0.167)#8,382 |
| 84. | 29016 | 2.2% | 1.8%(+0.490)#84 | 2.1%(+0.167)#8,383 |
| 85. | 29945 | 2.2% | 1.8%(+0.467)#85 | 2.1%(+0.145)#8,479 |
| 86. | 29451 | 2.2% | 1.8%(+0.465)#86 | 2.1%(+0.142)#8,495 |
| 87. | 29601 | 2.2% | 1.8%(+0.455)#87 | 2.1%(+0.132)#8,545 |
| 88. | 29710 | 2.2% | 1.8%(+0.438)#88 | 2.1%(+0.115)#8,652 |
| 89. | 29168 | 2.1% | 1.8%(+0.369)#89 | 2.1%(+0.046)#9,051 |
| 90. | 29810 | 2.1% | 1.8%(+0.343)#90 | 2.1%(+0.020)#9,196 |
| 91. | 29609 | 2.1% | 1.8%(+0.333)#91 | 2.1%(+0.010)#9,257 |
| 92. | 29572 | 2.1% | 1.8%(+0.316)#92 | 2.1%(-0.006)#9,338 |
| 93. | 29180 | 2.1% | 1.8%(+0.298)#93 | 2.1%(-0.025)#9,442 |
| 94. | 29853 | 2.1% | 1.8%(+0.297)#94 | 2.1%(-0.026)#9,451 |
| 95. | 29540 | 2.1% | 1.8%(+0.296)#95 | 2.1%(-0.026)#9,459 |
| 96. | 29809 | 2.0% | 1.8%(+0.288)#96 | 2.1%(-0.035)#9,510 |
| 97. | 29720 | 2.0% | 1.8%(+0.281)#97 | 2.1%(-0.042)#9,548 |
| 98. | 29203 | 2.0% | 1.8%(+0.276)#98 | 2.1%(-0.047)#9,575 |
| 99. | 29461 | 2.0% | 1.8%(+0.266)#99 | 2.1%(-0.057)#9,624 |
| 100. | 29921 | 2.0% | 1.8%(+0.260)#100 | 2.1%(-0.062)#9,649 |
Common Questions
What are the Top 10 Zip Codes with the Highest Percentage of Population Employed in Arts, Entertainment & Recreation in South Carolina?
Top 10 Zip Codes with the Highest Percentage of Population Employed in Arts, Entertainment & Recreation in South Carolina are:
What zip code has the Highest Percentage of Population Employed in Arts, Entertainment & Recreation in South Carolina?
29434 has the Highest Percentage of Population Employed in Arts, Entertainment & Recreation in South Carolina with 19.7%.
What is the Percentage of Population Employed in Arts, Entertainment & Recreation in the State of South Carolina?
Percentage of Population Employed in Arts, Entertainment & Recreation in South Carolina is 1.8%.
What is the Percentage of Population Employed in Arts, Entertainment & Recreation in the United States?
Percentage of Population Employed in Arts, Entertainment & Recreation in the United States is 2.1%.