Zip Codes with the Highest Percentage of Population Employed in Arts, Entertainment & Recreation in Mississippi
RELATED REPORTS & OPTIONS
Arts, Entertainment & Recreation
Mississippi
Compare Zip Codes
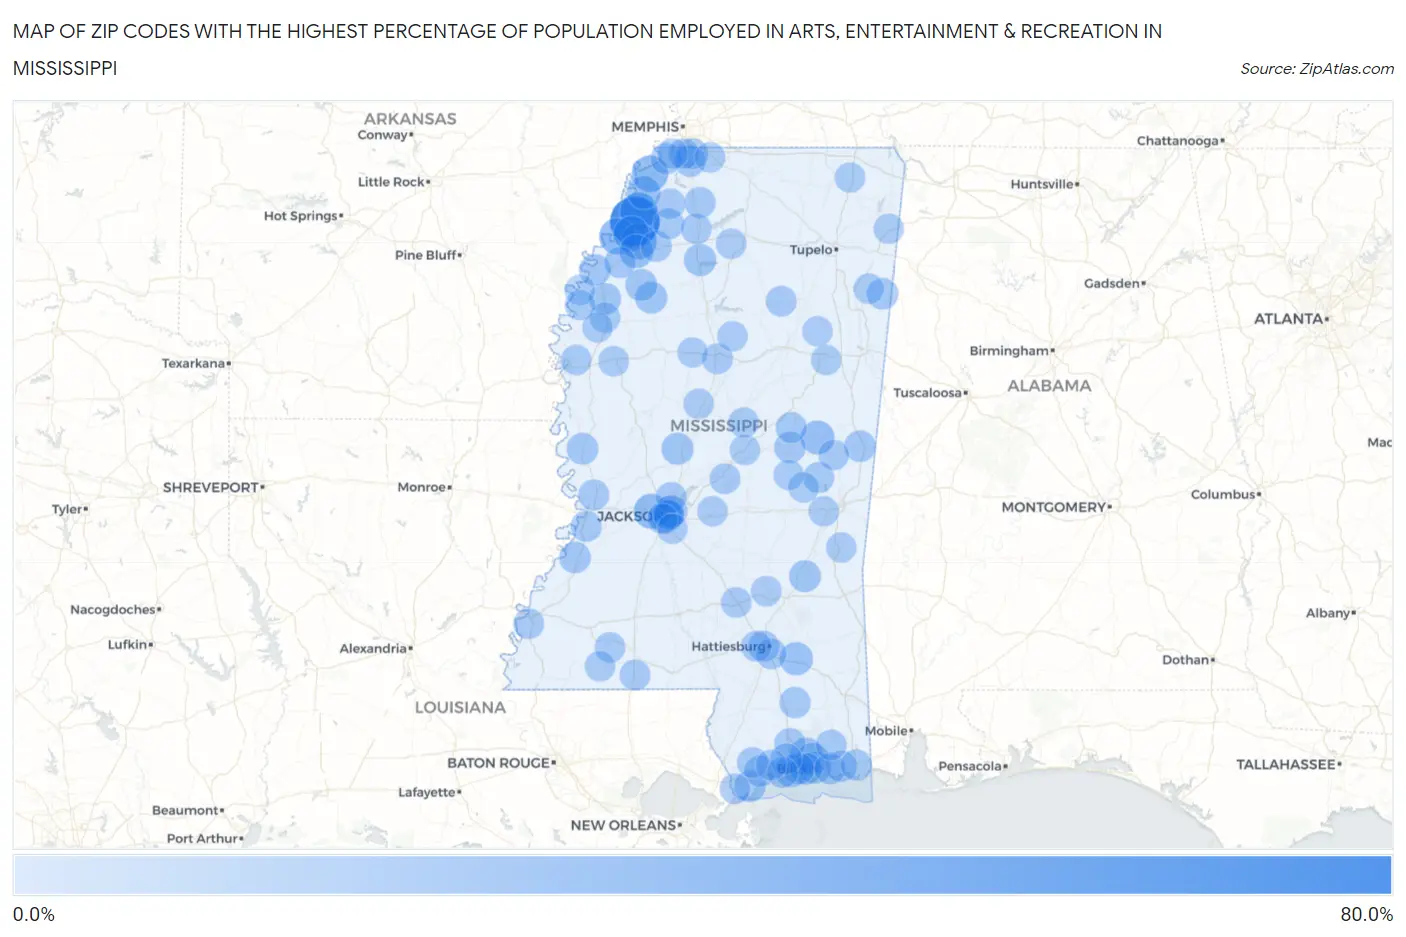
Map of Zip Codes with the Highest Percentage of Population Employed in Arts, Entertainment & Recreation in Mississippi
0.0%
80.0%
Zip Codes with the Highest Percentage of Population Employed in Arts, Entertainment & Recreation in Mississippi
| Zip Code | % Employed | vs State | vs National | |
| 1. | 38644 | 75.0% | 2.1%(+72.9)#1 | 2.1%(+72.9)#16 |
| 2. | 38626 | 28.7% | 2.1%(+26.6)#2 | 2.1%(+26.6)#83 |
| 3. | 38631 | 24.5% | 2.1%(+22.4)#3 | 2.1%(+22.4)#117 |
| 4. | 38664 | 24.4% | 2.1%(+22.3)#4 | 2.1%(+22.3)#118 |
| 5. | 38639 | 22.8% | 2.1%(+20.7)#5 | 2.1%(+20.7)#138 |
| 6. | 38617 | 21.7% | 2.1%(+19.6)#6 | 2.1%(+19.6)#154 |
| 7. | 39058 | 19.1% | 2.1%(+16.9)#7 | 2.1%(+17.0)#206 |
| 8. | 39354 | 14.7% | 2.1%(+12.6)#8 | 2.1%(+12.7)#349 |
| 9. | 38645 | 14.7% | 2.1%(+12.5)#9 | 2.1%(+12.6)#353 |
| 10. | 38676 | 13.2% | 2.1%(+11.1)#10 | 2.1%(+11.1)#439 |
| 11. | 39462 | 12.9% | 2.1%(+10.7)#11 | 2.1%(+10.8)#460 |
| 12. | 39217 | 12.1% | 2.1%(+9.99)#12 | 2.1%(+10.0)#497 |
| 13. | 39532 | 9.8% | 2.1%(+7.68)#13 | 2.1%(+7.73)#731 |
| 14. | 38658 | 9.2% | 2.1%(+7.04)#14 | 2.1%(+7.09)#826 |
| 15. | 39501 | 9.0% | 2.1%(+6.82)#15 | 2.1%(+6.87)#861 |
| 16. | 39216 | 8.9% | 2.1%(+6.81)#16 | 2.1%(+6.86)#863 |
| 17. | 39530 | 8.9% | 2.1%(+6.81)#17 | 2.1%(+6.86)#865 |
| 18. | 38966 | 8.6% | 2.1%(+6.44)#18 | 2.1%(+6.49)#922 |
| 19. | 39540 | 8.5% | 2.1%(+6.34)#19 | 2.1%(+6.39)#945 |
| 20. | 39179 | 8.4% | 2.1%(+6.28)#20 | 2.1%(+6.34)#964 |
| 21. | 38963 | 7.8% | 2.1%(+5.67)#21 | 2.1%(+5.72)#1,105 |
| 22. | 38762 | 7.7% | 2.1%(+5.61)#22 | 2.1%(+5.67)#1,120 |
| 23. | 39531 | 7.6% | 2.1%(+5.46)#23 | 2.1%(+5.51)#1,155 |
| 24. | 39210 | 7.4% | 2.1%(+5.30)#24 | 2.1%(+5.36)#1,191 |
| 25. | 39439 | 7.4% | 2.1%(+5.29)#25 | 2.1%(+5.34)#1,195 |
| 26. | 39054 | 7.0% | 2.1%(+4.85)#26 | 2.1%(+4.91)#1,335 |
| 27. | 39520 | 6.7% | 2.1%(+4.53)#27 | 2.1%(+4.58)#1,438 |
| 28. | 39358 | 6.6% | 2.1%(+4.48)#28 | 2.1%(+4.54)#1,452 |
| 29. | 38720 | 6.4% | 2.1%(+4.28)#29 | 2.1%(+4.34)#1,534 |
| 30. | 39150 | 6.3% | 2.1%(+4.18)#30 | 2.1%(+4.23)#1,574 |
| 31. | 39350 | 6.0% | 2.1%(+3.85)#31 | 2.1%(+3.90)#1,711 |
| 32. | 38848 | 5.9% | 2.1%(+3.76)#32 | 2.1%(+3.81)#1,749 |
| 33. | 38651 | 5.7% | 2.1%(+3.58)#33 | 2.1%(+3.63)#1,844 |
| 34. | 38614 | 5.7% | 2.1%(+3.54)#34 | 2.1%(+3.60)#1,869 |
| 35. | 39507 | 5.6% | 2.1%(+3.48)#35 | 2.1%(+3.53)#1,901 |
| 36. | 39553 | 5.4% | 2.1%(+3.23)#36 | 2.1%(+3.29)#2,044 |
| 37. | 39564 | 5.4% | 2.1%(+3.22)#37 | 2.1%(+3.27)#2,052 |
| 38. | 38646 | 5.3% | 2.1%(+3.17)#38 | 2.1%(+3.23)#2,076 |
| 39. | 39563 | 5.2% | 2.1%(+3.11)#39 | 2.1%(+3.17)#2,118 |
| 40. | 39574 | 5.2% | 2.1%(+3.07)#40 | 2.1%(+3.12)#2,149 |
| 41. | 39577 | 5.2% | 2.1%(+3.04)#41 | 2.1%(+3.09)#2,170 |
| 42. | 38668 | 5.1% | 2.1%(+2.94)#42 | 2.1%(+2.99)#2,235 |
| 43. | 38672 | 5.1% | 2.1%(+2.93)#43 | 2.1%(+2.98)#2,243 |
| 44. | 39525 | 5.0% | 2.1%(+2.83)#44 | 2.1%(+2.88)#2,315 |
| 45. | 39503 | 4.9% | 2.1%(+2.78)#45 | 2.1%(+2.83)#2,348 |
| 46. | 38641 | 4.6% | 2.1%(+2.51)#46 | 2.1%(+2.57)#2,581 |
| 47. | 39180 | 4.5% | 2.1%(+2.38)#47 | 2.1%(+2.43)#2,727 |
| 48. | 38621 | 4.4% | 2.1%(+2.27)#48 | 2.1%(+2.32)#2,848 |
| 49. | 39406 | 4.3% | 2.1%(+2.16)#49 | 2.1%(+2.21)#2,976 |
| 50. | 39325 | 4.3% | 2.1%(+2.12)#50 | 2.1%(+2.17)#3,014 |
| 51. | 39560 | 4.2% | 2.1%(+2.04)#51 | 2.1%(+2.09)#3,112 |
| 52. | 39346 | 4.2% | 2.1%(+2.02)#52 | 2.1%(+2.07)#3,142 |
| 53. | 39556 | 4.1% | 2.1%(+1.98)#53 | 2.1%(+2.03)#3,184 |
| 54. | 38967 | 4.0% | 2.1%(+1.90)#54 | 2.1%(+1.95)#3,290 |
| 55. | 39183 | 4.0% | 2.1%(+1.88)#55 | 2.1%(+1.94)#3,311 |
| 56. | 39571 | 3.7% | 2.1%(+1.58)#56 | 2.1%(+1.63)#3,760 |
| 57. | 38878 | 3.7% | 2.1%(+1.52)#57 | 2.1%(+1.58)#3,834 |
| 58. | 39094 | 3.6% | 2.1%(+1.50)#58 | 2.1%(+1.55)#3,888 |
| 59. | 39157 | 3.6% | 2.1%(+1.44)#59 | 2.1%(+1.49)#3,988 |
| 60. | 38637 | 3.4% | 2.1%(+1.25)#60 | 2.1%(+1.30)#4,390 |
| 61. | 39652 | 3.3% | 2.1%(+1.13)#61 | 2.1%(+1.18)#4,649 |
| 62. | 38666 | 3.3% | 2.1%(+1.13)#62 | 2.1%(+1.18)#4,656 |
| 63. | 39401 | 3.3% | 2.1%(+1.12)#63 | 2.1%(+1.17)#4,669 |
| 64. | 39120 | 3.1% | 2.1%(+0.961)#64 | 2.1%(+1.01)#5,081 |
| 65. | 39428 | 2.9% | 2.1%(+0.812)#65 | 2.1%(+0.864)#5,513 |
| 66. | 39402 | 2.9% | 2.1%(+0.800)#66 | 2.1%(+0.852)#5,554 |
| 67. | 39202 | 2.9% | 2.1%(+0.757)#67 | 2.1%(+0.809)#5,675 |
| 68. | 39337 | 2.8% | 2.1%(+0.713)#68 | 2.1%(+0.765)#5,827 |
| 69. | 39565 | 2.8% | 2.1%(+0.672)#69 | 2.1%(+0.724)#5,966 |
| 70. | 39572 | 2.8% | 2.1%(+0.631)#70 | 2.1%(+0.683)#6,118 |
| 71. | 38751 | 2.8% | 2.1%(+0.631)#71 | 2.1%(+0.683)#6,120 |
| 72. | 38665 | 2.8% | 2.1%(+0.616)#72 | 2.1%(+0.668)#6,183 |
| 73. | 39664 | 2.7% | 2.1%(+0.571)#73 | 2.1%(+0.624)#6,333 |
| 74. | 39328 | 2.7% | 2.1%(+0.546)#74 | 2.1%(+0.598)#6,434 |
| 75. | 38732 | 2.6% | 2.1%(+0.462)#75 | 2.1%(+0.514)#6,775 |
| 76. | 38673 | 2.6% | 2.1%(+0.455)#76 | 2.1%(+0.507)#6,797 |
| 77. | 38821 | 2.6% | 2.1%(+0.455)#77 | 2.1%(+0.507)#6,798 |
| 78. | 39480 | 2.6% | 2.1%(+0.419)#78 | 2.1%(+0.471)#6,939 |
| 79. | 39645 | 2.5% | 2.1%(+0.384)#79 | 2.1%(+0.437)#7,094 |
| 80. | 38760 | 2.5% | 2.1%(+0.358)#80 | 2.1%(+0.411)#7,208 |
| 81. | 38654 | 2.5% | 2.1%(+0.322)#81 | 2.1%(+0.375)#7,375 |
| 82. | 39307 | 2.5% | 2.1%(+0.318)#82 | 2.1%(+0.370)#7,398 |
| 83. | 39051 | 2.4% | 2.1%(+0.295)#83 | 2.1%(+0.348)#7,506 |
| 84. | 39090 | 2.4% | 2.1%(+0.263)#84 | 2.1%(+0.316)#7,654 |
| 85. | 39741 | 2.3% | 2.1%(+0.157)#85 | 2.1%(+0.209)#8,167 |
| 86. | 38746 | 2.3% | 2.1%(+0.138)#86 | 2.1%(+0.190)#8,262 |
| 87. | 39762 | 2.2% | 2.1%(+0.096)#87 | 2.1%(+0.149)#8,457 |
| 88. | 38769 | 2.2% | 2.1%(+0.048)#88 | 2.1%(+0.101)#8,731 |
| 89. | 38730 | 2.2% | 2.1%(+0.045)#89 | 2.1%(+0.098)#8,757 |
| 90. | 38925 | 2.2% | 2.1%(+0.033)#90 | 2.1%(+0.085)#8,814 |
| 91. | 39063 | 2.1% | 2.1%(-0.032)#91 | 2.1%(+0.020)#9,197 |
| 92. | 38680 | 2.1% | 2.1%(-0.045)#92 | 2.1%(+0.008)#9,272 |
| 93. | 39145 | 2.1% | 2.1%(-0.049)#93 | 2.1%(+0.004)#9,294 |
| 94. | 39365 | 2.1% | 2.1%(-0.054)#94 | 2.1%(-0.002)#9,319 |
| 95. | 38865 | 2.1% | 2.1%(-0.058)#95 | 2.1%(-0.006)#9,336 |
| 96. | 39355 | 2.1% | 2.1%(-0.074)#96 | 2.1%(-0.022)#9,427 |
| 97. | 38847 | 2.0% | 2.1%(-0.175)#97 | 2.1%(-0.123)#10,012 |
| 98. | 39204 | 1.9% | 2.1%(-0.187)#98 | 2.1%(-0.135)#10,095 |
| 99. | 39218 | 1.9% | 2.1%(-0.194)#99 | 2.1%(-0.141)#10,127 |
| 100. | 38917 | 1.9% | 2.1%(-0.232)#100 | 2.1%(-0.179)#10,360 |
Common Questions
What are the Top 10 Zip Codes with the Highest Percentage of Population Employed in Arts, Entertainment & Recreation in Mississippi?
Top 10 Zip Codes with the Highest Percentage of Population Employed in Arts, Entertainment & Recreation in Mississippi are:
What zip code has the Highest Percentage of Population Employed in Arts, Entertainment & Recreation in Mississippi?
38644 has the Highest Percentage of Population Employed in Arts, Entertainment & Recreation in Mississippi with 75.0%.
What is the Percentage of Population Employed in Arts, Entertainment & Recreation in the State of Mississippi?
Percentage of Population Employed in Arts, Entertainment & Recreation in Mississippi is 2.1%.
What is the Percentage of Population Employed in Arts, Entertainment & Recreation in the United States?
Percentage of Population Employed in Arts, Entertainment & Recreation in the United States is 2.1%.