Zip Codes with the Highest Percentage of Population Employed in Arts, Entertainment & Recreation in Maine
RELATED REPORTS & OPTIONS
Arts, Entertainment & Recreation
Maine
Compare Zip Codes
Map of Zip Codes with the Highest Percentage of Population Employed in Arts, Entertainment & Recreation in Maine
0.0%
40.0%
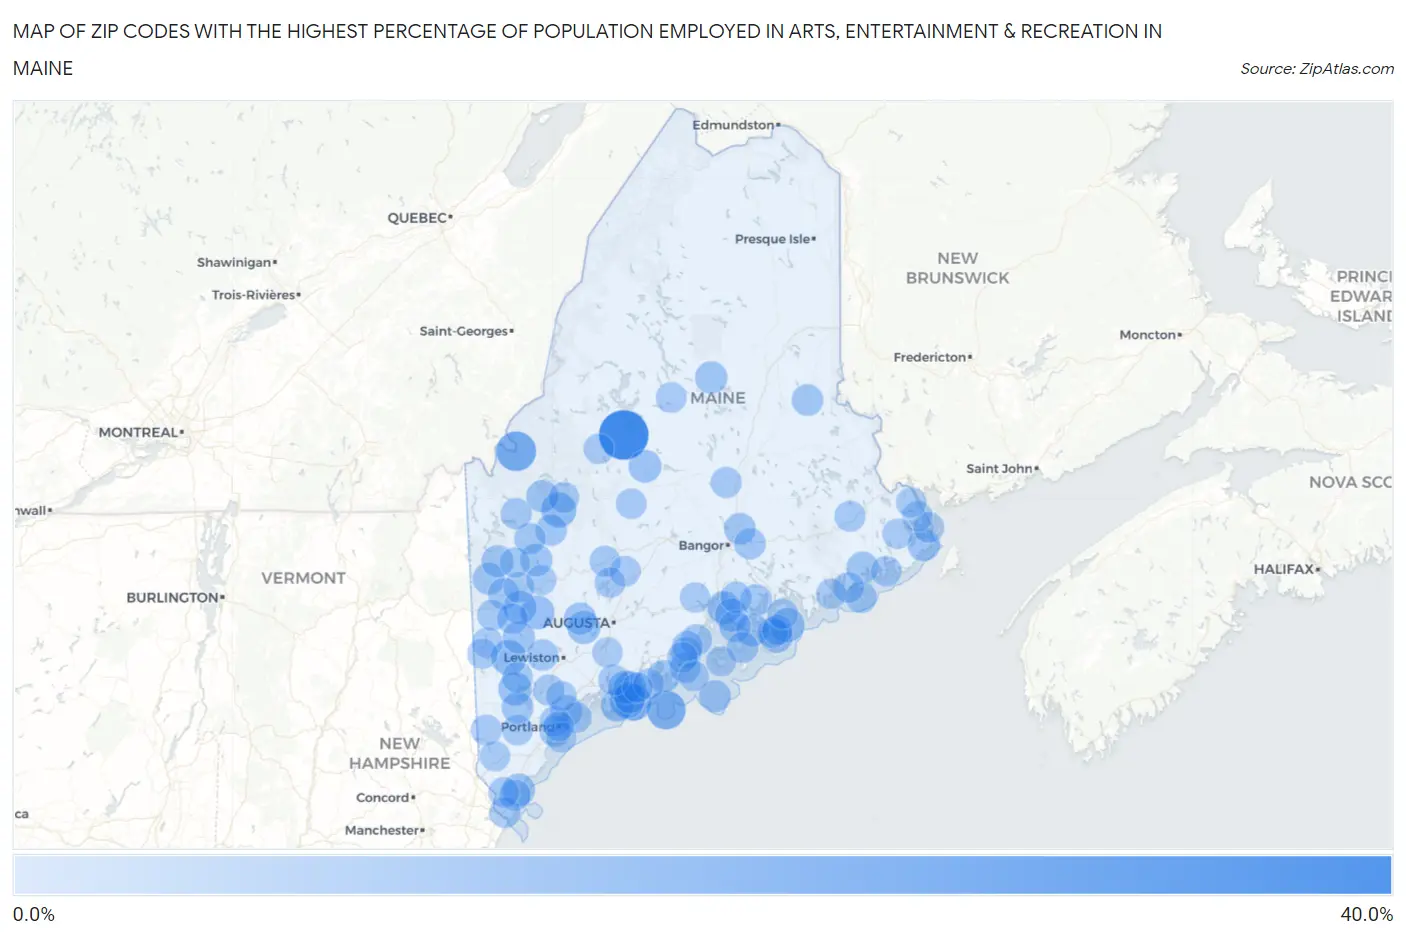
Zip Codes with the Highest Percentage of Population Employed in Arts, Entertainment & Recreation in Maine
| Zip Code | % Employed | vs State | vs National | |
| 1. | 04442 | 38.8% | 1.7%(+37.0)#1 | 2.1%(+36.7)#54 |
| 2. | 04936 | 20.0% | 1.7%(+18.3)#2 | 2.1%(+17.9)#185 |
| 3. | 04852 | 18.1% | 1.7%(+16.3)#3 | 2.1%(+16.0)#229 |
| 4. | 04544 | 12.8% | 1.7%(+11.0)#4 | 2.1%(+10.7)#466 |
| 5. | 04057 | 11.3% | 1.7%(+9.58)#5 | 2.1%(+9.24)#571 |
| 6. | 04947 | 11.2% | 1.7%(+9.49)#6 | 2.1%(+9.15)#577 |
| 7. | 04675 | 9.6% | 1.7%(+7.87)#7 | 2.1%(+7.53)#764 |
| 8. | 04576 | 9.4% | 1.7%(+7.70)#8 | 2.1%(+7.36)#783 |
| 9. | 04292 | 9.1% | 1.7%(+7.37)#9 | 2.1%(+7.03)#833 |
| 10. | 04653 | 8.2% | 1.7%(+6.45)#10 | 2.1%(+6.11)#1,003 |
| 11. | 04548 | 8.1% | 1.7%(+6.38)#11 | 2.1%(+6.04)#1,022 |
| 12. | 04029 | 8.1% | 1.7%(+6.36)#12 | 2.1%(+6.03)#1,029 |
| 13. | 04571 | 7.9% | 1.7%(+6.13)#13 | 2.1%(+5.79)#1,092 |
| 14. | 04219 | 7.7% | 1.7%(+5.96)#14 | 2.1%(+5.63)#1,129 |
| 15. | 04265 | 7.7% | 1.7%(+5.95)#15 | 2.1%(+5.61)#1,135 |
| 16. | 04421 | 7.6% | 1.7%(+5.82)#16 | 2.1%(+5.49)#1,164 |
| 17. | 04464 | 7.3% | 1.7%(+5.55)#17 | 2.1%(+5.21)#1,234 |
| 18. | 03907 | 7.2% | 1.7%(+5.47)#18 | 2.1%(+5.13)#1,265 |
| 19. | 04537 | 6.9% | 1.7%(+5.17)#19 | 2.1%(+4.84)#1,358 |
| 20. | 04617 | 6.8% | 1.7%(+5.09)#20 | 2.1%(+4.75)#1,382 |
| 21. | 04616 | 6.6% | 1.7%(+4.85)#21 | 2.1%(+4.51)#1,458 |
| 22. | 04547 | 6.5% | 1.7%(+4.76)#22 | 2.1%(+4.42)#1,495 |
| 23. | 04110 | 6.4% | 1.7%(+4.69)#23 | 2.1%(+4.35)#1,526 |
| 24. | 04268 | 6.4% | 1.7%(+4.65)#24 | 2.1%(+4.31)#1,544 |
| 25. | 04462 | 6.4% | 1.7%(+4.62)#25 | 2.1%(+4.29)#1,551 |
| 26. | 04284 | 6.3% | 1.7%(+4.60)#26 | 2.1%(+4.26)#1,565 |
| 27. | 04652 | 6.3% | 1.7%(+4.55)#27 | 2.1%(+4.22)#1,587 |
| 28. | 04982 | 6.2% | 1.7%(+4.50)#28 | 2.1%(+4.17)#1,606 |
| 29. | 04285 | 6.1% | 1.7%(+4.36)#29 | 2.1%(+4.02)#1,653 |
| 30. | 04261 | 6.1% | 1.7%(+4.31)#30 | 2.1%(+3.98)#1,670 |
| 31. | 04216 | 5.7% | 1.7%(+3.94)#31 | 2.1%(+3.60)#1,864 |
| 32. | 04851 | 5.6% | 1.7%(+3.81)#32 | 2.1%(+3.47)#1,939 |
| 33. | 04648 | 5.5% | 1.7%(+3.79)#33 | 2.1%(+3.45)#1,947 |
| 34. | 04085 | 5.2% | 1.7%(+3.45)#34 | 2.1%(+3.11)#2,163 |
| 35. | 04538 | 5.2% | 1.7%(+3.43)#35 | 2.1%(+3.09)#2,171 |
| 36. | 04469 | 5.1% | 1.7%(+3.36)#36 | 2.1%(+3.02)#2,208 |
| 37. | 04497 | 5.1% | 1.7%(+3.32)#37 | 2.1%(+2.98)#2,242 |
| 38. | 04650 | 5.0% | 1.7%(+3.20)#38 | 2.1%(+2.87)#2,322 |
| 39. | 04684 | 4.8% | 1.7%(+3.01)#39 | 2.1%(+2.67)#2,478 |
| 40. | 04428 | 4.7% | 1.7%(+2.92)#40 | 2.1%(+2.59)#2,557 |
| 41. | 04256 | 4.5% | 1.7%(+2.80)#41 | 2.1%(+2.46)#2,689 |
| 42. | 04681 | 4.5% | 1.7%(+2.79)#42 | 2.1%(+2.45)#2,700 |
| 43. | 04843 | 4.5% | 1.7%(+2.72)#43 | 2.1%(+2.38)#2,779 |
| 44. | 04476 | 4.5% | 1.7%(+2.71)#44 | 2.1%(+2.37)#2,793 |
| 45. | 04237 | 4.4% | 1.7%(+2.70)#45 | 2.1%(+2.36)#2,807 |
| 46. | 04983 | 4.4% | 1.7%(+2.67)#46 | 2.1%(+2.33)#2,831 |
| 47. | 04966 | 4.4% | 1.7%(+2.62)#47 | 2.1%(+2.28)#2,891 |
| 48. | 04611 | 4.2% | 1.7%(+2.42)#48 | 2.1%(+2.08)#3,124 |
| 49. | 04841 | 4.1% | 1.7%(+2.33)#49 | 2.1%(+2.00)#3,224 |
| 50. | 04970 | 4.0% | 1.7%(+2.29)#50 | 2.1%(+1.96)#3,274 |
| 51. | 03902 | 4.0% | 1.7%(+2.27)#51 | 2.1%(+1.93)#3,314 |
| 52. | 04579 | 4.0% | 1.7%(+2.23)#52 | 2.1%(+1.89)#3,378 |
| 53. | 03904 | 3.9% | 1.7%(+2.16)#53 | 2.1%(+1.82)#3,480 |
| 54. | 04017 | 3.8% | 1.7%(+2.09)#54 | 2.1%(+1.75)#3,583 |
| 55. | 04039 | 3.8% | 1.7%(+2.05)#55 | 2.1%(+1.71)#3,633 |
| 56. | 04106 | 3.8% | 1.7%(+2.01)#56 | 2.1%(+1.67)#3,695 |
| 57. | 04858 | 3.7% | 1.7%(+1.95)#57 | 2.1%(+1.61)#3,789 |
| 58. | 04217 | 3.7% | 1.7%(+1.94)#58 | 2.1%(+1.60)#3,796 |
| 59. | 04606 | 3.6% | 1.7%(+1.90)#59 | 2.1%(+1.56)#3,860 |
| 60. | 04957 | 3.6% | 1.7%(+1.90)#60 | 2.1%(+1.56)#3,870 |
| 61. | 04255 | 3.6% | 1.7%(+1.89)#61 | 2.1%(+1.55)#3,881 |
| 62. | 04453 | 3.6% | 1.7%(+1.88)#62 | 2.1%(+1.54)#3,912 |
| 63. | 04686 | 3.6% | 1.7%(+1.87)#63 | 2.1%(+1.53)#3,924 |
| 64. | 04937 | 3.5% | 1.7%(+1.77)#64 | 2.1%(+1.43)#4,093 |
| 65. | 04095 | 3.5% | 1.7%(+1.76)#65 | 2.1%(+1.43)#4,111 |
| 66. | 04564 | 3.5% | 1.7%(+1.76)#66 | 2.1%(+1.42)#4,128 |
| 67. | 04631 | 3.5% | 1.7%(+1.76)#67 | 2.1%(+1.42)#4,131 |
| 68. | 04042 | 3.5% | 1.7%(+1.74)#68 | 2.1%(+1.40)#4,167 |
| 69. | 04055 | 3.5% | 1.7%(+1.72)#69 | 2.1%(+1.39)#4,207 |
| 70. | 03908 | 3.4% | 1.7%(+1.69)#70 | 2.1%(+1.35)#4,267 |
| 71. | 04961 | 3.4% | 1.7%(+1.67)#71 | 2.1%(+1.33)#4,328 |
| 72. | 04856 | 3.4% | 1.7%(+1.63)#72 | 2.1%(+1.29)#4,424 |
| 73. | 04441 | 3.3% | 1.7%(+1.53)#73 | 2.1%(+1.19)#4,622 |
| 74. | 04861 | 3.3% | 1.7%(+1.51)#74 | 2.1%(+1.17)#4,680 |
| 75. | 04612 | 3.2% | 1.7%(+1.48)#75 | 2.1%(+1.14)#4,732 |
| 76. | 04276 | 3.2% | 1.7%(+1.47)#76 | 2.1%(+1.13)#4,770 |
| 77. | 04942 | 3.2% | 1.7%(+1.44)#77 | 2.1%(+1.10)#4,837 |
| 78. | 04655 | 3.2% | 1.7%(+1.44)#78 | 2.1%(+1.10)#4,847 |
| 79. | 04963 | 3.1% | 1.7%(+1.40)#79 | 2.1%(+1.06)#4,943 |
| 80. | 04679 | 3.0% | 1.7%(+1.30)#80 | 2.1%(+0.960)#5,237 |
| 81. | 04985 | 3.0% | 1.7%(+1.28)#81 | 2.1%(+0.948)#5,271 |
| 82. | 04103 | 3.0% | 1.7%(+1.26)#82 | 2.1%(+0.918)#5,352 |
| 83. | 04051 | 2.9% | 1.7%(+1.20)#83 | 2.1%(+0.867)#5,507 |
| 84. | 04667 | 2.9% | 1.7%(+1.17)#84 | 2.1%(+0.837)#5,594 |
| 85. | 04097 | 2.9% | 1.7%(+1.13)#85 | 2.1%(+0.797)#5,715 |
| 86. | 04609 | 2.8% | 1.7%(+1.08)#86 | 2.1%(+0.747)#5,890 |
| 87. | 04628 | 2.8% | 1.7%(+1.02)#87 | 2.1%(+0.682)#6,123 |
| 88. | 04357 | 2.7% | 1.7%(+1.00)#88 | 2.1%(+0.667)#6,187 |
| 89. | 04671 | 2.7% | 1.7%(+1.00)#89 | 2.1%(+0.667)#6,190 |
| 90. | 04107 | 2.7% | 1.7%(+0.947)#90 | 2.1%(+0.610)#6,392 |
| 91. | 04275 | 2.7% | 1.7%(+0.921)#91 | 2.1%(+0.584)#6,496 |
| 92. | 04915 | 2.6% | 1.7%(+0.894)#92 | 2.1%(+0.557)#6,609 |
| 93. | 04101 | 2.6% | 1.7%(+0.864)#93 | 2.1%(+0.527)#6,717 |
| 94. | 04083 | 2.6% | 1.7%(+0.855)#94 | 2.1%(+0.518)#6,752 |
| 95. | 04658 | 2.6% | 1.7%(+0.846)#95 | 2.1%(+0.509)#6,789 |
| 96. | 04224 | 2.6% | 1.7%(+0.822)#96 | 2.1%(+0.485)#6,883 |
| 97. | 04863 | 2.6% | 1.7%(+0.807)#97 | 2.1%(+0.470)#6,947 |
| 98. | 04037 | 2.5% | 1.7%(+0.792)#98 | 2.1%(+0.455)#7,010 |
| 99. | 04568 | 2.5% | 1.7%(+0.786)#99 | 2.1%(+0.449)#7,039 |
| 100. | 04854 | 2.5% | 1.7%(+0.775)#100 | 2.1%(+0.438)#7,081 |
Common Questions
What are the Top 10 Zip Codes with the Highest Percentage of Population Employed in Arts, Entertainment & Recreation in Maine?
Top 10 Zip Codes with the Highest Percentage of Population Employed in Arts, Entertainment & Recreation in Maine are:
What zip code has the Highest Percentage of Population Employed in Arts, Entertainment & Recreation in Maine?
04442 has the Highest Percentage of Population Employed in Arts, Entertainment & Recreation in Maine with 38.8%.
What is the Percentage of Population Employed in Arts, Entertainment & Recreation in the State of Maine?
Percentage of Population Employed in Arts, Entertainment & Recreation in Maine is 1.7%.
What is the Percentage of Population Employed in Arts, Entertainment & Recreation in the United States?
Percentage of Population Employed in Arts, Entertainment & Recreation in the United States is 2.1%.