Zip Codes with the Highest Percentage of Population Employed in Arts, Entertainment & Recreation in Puerto Rico
RELATED REPORTS & OPTIONS
Arts, Entertainment & Recreation
Puerto Rico
Compare Zip Codes
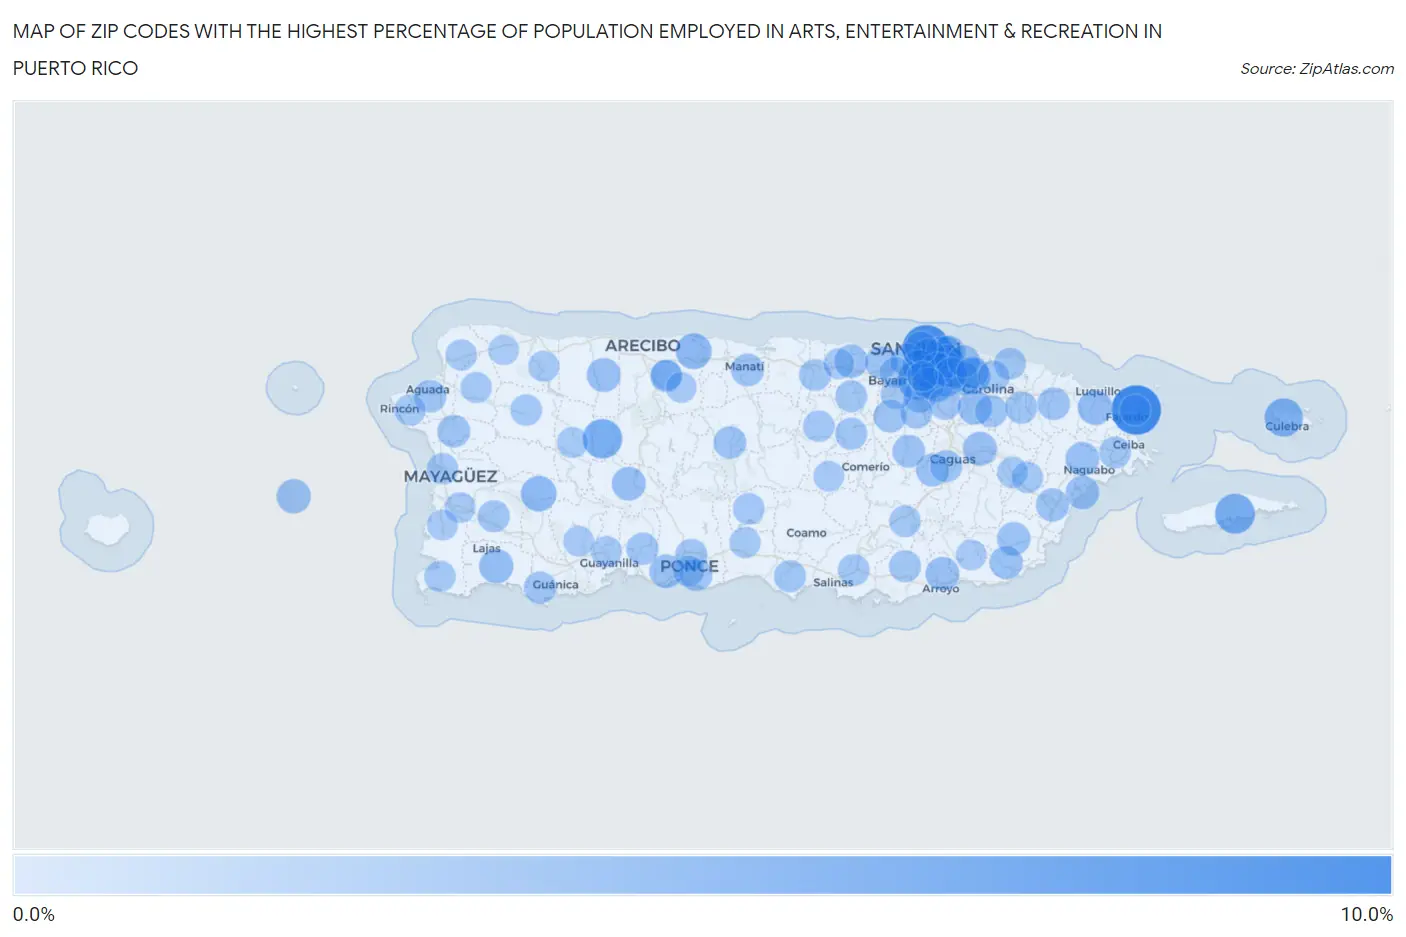
Map of Zip Codes with the Highest Percentage of Population Employed in Arts, Entertainment & Recreation in Puerto Rico
0.0%
10.0%
Zip Codes with the Highest Percentage of Population Employed in Arts, Entertainment & Recreation in Puerto Rico
| Zip Code | % Employed | vs State | vs National | |
| 1. | 00740 | 9.1% | 1.2%(+7.82)#1 | 2.1%(+6.98)#845 |
| 2. | 00906 | 8.2% | 1.2%(+6.92)#2 | 2.1%(+6.08)#1,014 |
| 3. | 00765 | 4.7% | 1.2%(+3.43)#3 | 2.1%(+2.59)#2,553 |
| 4. | 00966 | 4.6% | 1.2%(+3.34)#4 | 2.1%(+2.50)#2,649 |
| 5. | 00611 | 4.5% | 1.2%(+3.24)#5 | 2.1%(+2.40)#2,758 |
| 6. | 00775 | 4.0% | 1.2%(+2.76)#6 | 2.1%(+1.92)#3,326 |
| 7. | 00911 | 3.1% | 1.2%(+1.86)#7 | 2.1%(+1.02)#5,048 |
| 8. | 00917 | 2.9% | 1.2%(+1.64)#8 | 2.1%(+0.803)#5,691 |
| 9. | 00652 | 2.9% | 1.2%(+1.64)#9 | 2.1%(+0.798)#5,707 |
| 10. | 00982 | 2.9% | 1.2%(+1.61)#10 | 2.1%(+0.773)#5,795 |
| 11. | 00925 | 2.8% | 1.2%(+1.54)#11 | 2.1%(+0.704)#6,052 |
| 12. | 00606 | 2.8% | 1.2%(+1.54)#12 | 2.1%(+0.699)#6,060 |
| 13. | 00773 | 2.3% | 1.2%(+1.09)#13 | 2.1%(+0.253)#7,956 |
| 14. | 00667 | 2.3% | 1.2%(+1.01)#14 | 2.1%(+0.173)#8,358 |
| 15. | 00680 | 2.2% | 1.2%(+0.995)#15 | 2.1%(+0.157)#8,423 |
| 16. | 00976 | 2.2% | 1.2%(+0.993)#16 | 2.1%(+0.155)#8,432 |
| 17. | 00927 | 2.1% | 1.2%(+0.887)#17 | 2.1%(+0.049)#9,039 |
| 18. | 00659 | 2.1% | 1.2%(+0.835)#18 | 2.1%(-0.004)#9,325 |
| 19. | 00778 | 2.1% | 1.2%(+0.814)#19 | 2.1%(-0.024)#9,437 |
| 20. | 00714 | 2.0% | 1.2%(+0.768)#20 | 2.1%(-0.071)#9,702 |
| 21. | 00601 | 2.0% | 1.2%(+0.756)#21 | 2.1%(-0.083)#9,771 |
| 22. | 00728 | 1.9% | 1.2%(+0.696)#22 | 2.1%(-0.142)#10,134 |
| 23. | 00718 | 1.9% | 1.2%(+0.683)#23 | 2.1%(-0.155)#10,208 |
| 24. | 00913 | 1.9% | 1.2%(+0.671)#24 | 2.1%(-0.167)#10,293 |
| 25. | 00741 | 1.9% | 1.2%(+0.665)#25 | 2.1%(-0.173)#10,335 |
| 26. | 00951 | 1.9% | 1.2%(+0.643)#26 | 2.1%(-0.196)#10,462 |
| 27. | 00962 | 1.8% | 1.2%(+0.580)#27 | 2.1%(-0.258)#10,849 |
| 28. | 00924 | 1.8% | 1.2%(+0.568)#28 | 2.1%(-0.271)#10,934 |
| 29. | 00920 | 1.8% | 1.2%(+0.514)#29 | 2.1%(-0.325)#11,315 |
| 30. | 00767 | 1.8% | 1.2%(+0.507)#30 | 2.1%(-0.331)#11,361 |
| 31. | 00791 | 1.7% | 1.2%(+0.496)#31 | 2.1%(-0.342)#11,440 |
| 32. | 00915 | 1.7% | 1.2%(+0.483)#32 | 2.1%(-0.356)#11,543 |
| 33. | 00907 | 1.7% | 1.2%(+0.478)#33 | 2.1%(-0.360)#11,571 |
| 34. | 00707 | 1.7% | 1.2%(+0.432)#34 | 2.1%(-0.407)#11,905 |
| 35. | 00727 | 1.6% | 1.2%(+0.382)#35 | 2.1%(-0.456)#12,236 |
| 36. | 00965 | 1.6% | 1.2%(+0.371)#36 | 2.1%(-0.467)#12,336 |
| 37. | 00918 | 1.6% | 1.2%(+0.358)#37 | 2.1%(-0.480)#12,451 |
| 38. | 00674 | 1.6% | 1.2%(+0.347)#38 | 2.1%(-0.492)#12,535 |
| 39. | 00969 | 1.6% | 1.2%(+0.333)#39 | 2.1%(-0.505)#12,627 |
| 40. | 00703 | 1.5% | 1.2%(+0.300)#40 | 2.1%(-0.538)#12,921 |
| 41. | 00949 | 1.5% | 1.2%(+0.290)#41 | 2.1%(-0.549)#13,006 |
| 42. | 00956 | 1.5% | 1.2%(+0.287)#42 | 2.1%(-0.551)#13,023 |
| 43. | 00745 | 1.5% | 1.2%(+0.284)#43 | 2.1%(-0.554)#13,043 |
| 44. | 00610 | 1.5% | 1.2%(+0.264)#44 | 2.1%(-0.574)#13,188 |
| 45. | 00638 | 1.5% | 1.2%(+0.234)#45 | 2.1%(-0.604)#13,386 |
| 46. | 00602 | 1.5% | 1.2%(+0.214)#46 | 2.1%(-0.624)#13,533 |
| 47. | 00987 | 1.4% | 1.2%(+0.180)#47 | 2.1%(-0.659)#13,788 |
| 48. | 00923 | 1.4% | 1.2%(+0.163)#48 | 2.1%(-0.676)#13,934 |
| 49. | 00729 | 1.4% | 1.2%(+0.144)#49 | 2.1%(-0.694)#14,084 |
| 50. | 00921 | 1.4% | 1.2%(+0.132)#50 | 2.1%(-0.707)#14,167 |
| 51. | 00624 | 1.4% | 1.2%(+0.120)#51 | 2.1%(-0.718)#14,263 |
| 52. | 00979 | 1.4% | 1.2%(+0.106)#52 | 2.1%(-0.732)#14,365 |
| 53. | 00901 | 1.3% | 1.2%(+0.098)#53 | 2.1%(-0.740)#14,427 |
| 54. | 00725 | 1.3% | 1.2%(+0.096)#54 | 2.1%(-0.742)#14,441 |
| 55. | 00926 | 1.3% | 1.2%(+0.086)#55 | 2.1%(-0.752)#14,508 |
| 56. | 00716 | 1.3% | 1.2%(+0.080)#56 | 2.1%(-0.758)#14,541 |
| 57. | 00971 | 1.3% | 1.2%(+0.059)#57 | 2.1%(-0.779)#14,698 |
| 58. | 00647 | 1.3% | 1.2%(+0.042)#58 | 2.1%(-0.796)#14,812 |
| 59. | 00983 | 1.3% | 1.2%(+0.035)#59 | 2.1%(-0.803)#14,866 |
| 60. | 00730 | 1.3% | 1.2%(+0.025)#60 | 2.1%(-0.813)#14,941 |
| 61. | 00719 | 1.3% | 1.2%(+0.023)#61 | 2.1%(-0.815)#14,965 |
| 62. | 00683 | 1.3% | 1.2%(+0.010)#62 | 2.1%(-0.828)#15,068 |
| 63. | 00757 | 1.2% | 1.2%(-0.011)#63 | 2.1%(-0.849)#15,234 |
| 64. | 00784 | 1.2% | 1.2%(-0.038)#64 | 2.1%(-0.876)#15,426 |
| 65. | 00612 | 1.2% | 1.2%(-0.048)#65 | 2.1%(-0.886)#15,504 |
| 66. | 00953 | 1.2% | 1.2%(-0.082)#66 | 2.1%(-0.920)#15,774 |
| 67. | 00692 | 1.2% | 1.2%(-0.091)#67 | 2.1%(-0.929)#15,849 |
| 68. | 00772 | 1.1% | 1.2%(-0.116)#68 | 2.1%(-0.955)#16,020 |
| 69. | 00735 | 1.1% | 1.2%(-0.127)#69 | 2.1%(-0.965)#16,114 |
| 70. | 00751 | 1.1% | 1.2%(-0.176)#70 | 2.1%(-1.01)#16,478 |
| 71. | 00766 | 1.0% | 1.2%(-0.214)#71 | 2.1%(-1.05)#16,733 |
| 72. | 00985 | 1.0% | 1.2%(-0.222)#72 | 2.1%(-1.06)#16,797 |
| 73. | 00736 | 1.0% | 1.2%(-0.232)#73 | 2.1%(-1.07)#16,858 |
| 74. | 00685 | 1.00% | 1.2%(-0.246)#74 | 2.1%(-1.08)#16,969 |
| 75. | 00771 | 0.97% | 1.2%(-0.271)#75 | 2.1%(-1.11)#17,169 |
| 76. | 00717 | 0.96% | 1.2%(-0.284)#76 | 2.1%(-1.12)#17,259 |
| 77. | 00682 | 0.96% | 1.2%(-0.284)#77 | 2.1%(-1.12)#17,265 |
| 78. | 00783 | 0.95% | 1.2%(-0.289)#78 | 2.1%(-1.13)#17,300 |
| 79. | 00603 | 0.91% | 1.2%(-0.332)#79 | 2.1%(-1.17)#17,605 |
| 80. | 00622 | 0.90% | 1.2%(-0.342)#80 | 2.1%(-1.18)#17,661 |
| 81. | 00676 | 0.89% | 1.2%(-0.354)#81 | 2.1%(-1.19)#17,753 |
| 82. | 00677 | 0.88% | 1.2%(-0.368)#82 | 2.1%(-1.21)#17,874 |
| 83. | 00959 | 0.86% | 1.2%(-0.384)#83 | 2.1%(-1.22)#17,992 |
| 84. | 00656 | 0.84% | 1.2%(-0.400)#84 | 2.1%(-1.24)#18,093 |
| 85. | 00795 | 0.83% | 1.2%(-0.415)#85 | 2.1%(-1.25)#18,205 |
| 86. | 00669 | 0.80% | 1.2%(-0.441)#86 | 2.1%(-1.28)#18,379 |
| 87. | 00777 | 0.78% | 1.2%(-0.466)#87 | 2.1%(-1.30)#18,558 |
| 88. | 00678 | 0.77% | 1.2%(-0.479)#88 | 2.1%(-1.32)#18,649 |
| 89. | 00616 | 0.73% | 1.2%(-0.510)#89 | 2.1%(-1.35)#18,887 |
| 90. | 00660 | 0.72% | 1.2%(-0.523)#90 | 2.1%(-1.36)#18,983 |
| 91. | 00623 | 0.68% | 1.2%(-0.563)#91 | 2.1%(-1.40)#19,290 |
| 92. | 00646 | 0.68% | 1.2%(-0.564)#92 | 2.1%(-1.40)#19,292 |
| 93. | 00794 | 0.67% | 1.2%(-0.569)#93 | 2.1%(-1.41)#19,326 |
| 94. | 00698 | 0.67% | 1.2%(-0.576)#94 | 2.1%(-1.41)#19,376 |
| 95. | 00961 | 0.66% | 1.2%(-0.583)#95 | 2.1%(-1.42)#19,415 |
| 96. | 00738 | 0.63% | 1.2%(-0.611)#96 | 2.1%(-1.45)#19,597 |
| 97. | 00688 | 0.60% | 1.2%(-0.649)#97 | 2.1%(-1.49)#19,870 |
| 98. | 00723 | 0.58% | 1.2%(-0.663)#98 | 2.1%(-1.50)#19,959 |
| 99. | 00968 | 0.53% | 1.2%(-0.717)#99 | 2.1%(-1.56)#20,322 |
| 100. | 00662 | 0.49% | 1.2%(-0.752)#100 | 2.1%(-1.59)#20,550 |
1
2Common Questions
What are the Top 10 Zip Codes with the Highest Percentage of Population Employed in Arts, Entertainment & Recreation in Puerto Rico?
Top 10 Zip Codes with the Highest Percentage of Population Employed in Arts, Entertainment & Recreation in Puerto Rico are:
What zip code has the Highest Percentage of Population Employed in Arts, Entertainment & Recreation in Puerto Rico?
00740 has the Highest Percentage of Population Employed in Arts, Entertainment & Recreation in Puerto Rico with 9.1%.
What is the Percentage of Population Employed in Arts, Entertainment & Recreation in the State of Puerto Rico?
Percentage of Population Employed in Arts, Entertainment & Recreation in Puerto Rico is 1.2%.
What is the Percentage of Population Employed in Arts, Entertainment & Recreation in the United States?
Percentage of Population Employed in Arts, Entertainment & Recreation in the United States is 2.1%.