Zip Codes with the Highest Percentage of Population Employed in Arts, Entertainment & Recreation in Florida
RELATED REPORTS & OPTIONS
Arts, Entertainment & Recreation
Florida
Compare Zip Codes
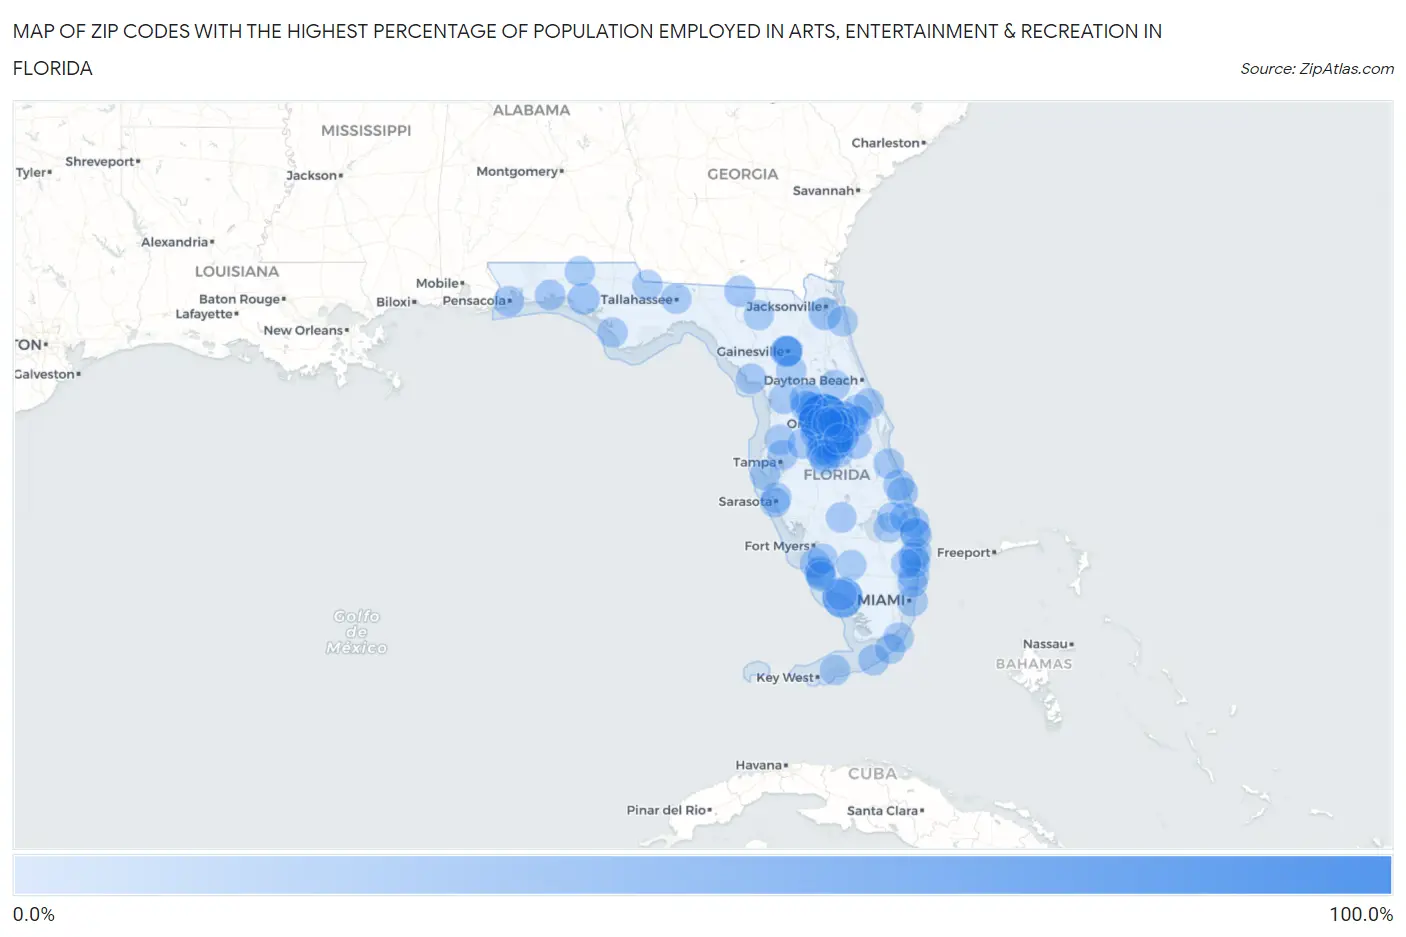
Map of Zip Codes with the Highest Percentage of Population Employed in Arts, Entertainment & Recreation in Florida
0.0%
100.0%
Zip Codes with the Highest Percentage of Population Employed in Arts, Entertainment & Recreation in Florida
| Zip Code | % Employed | vs State | vs National | |
| 1. | 34729 | 100.0% | 2.9%(+97.1)#1 | 2.1%(+97.9)#9 |
| 2. | 34138 | 54.6% | 2.9%(+51.7)#2 | 2.1%(+52.5)#26 |
| 3. | 34714 | 23.3% | 2.9%(+20.4)#3 | 2.1%(+21.2)#130 |
| 4. | 33848 | 19.3% | 2.9%(+16.4)#4 | 2.1%(+17.3)#197 |
| 5. | 32821 | 19.3% | 2.9%(+16.4)#5 | 2.1%(+17.2)#202 |
| 6. | 34762 | 18.7% | 2.9%(+15.8)#6 | 2.1%(+16.6)#216 |
| 7. | 34747 | 17.8% | 2.9%(+14.9)#7 | 2.1%(+15.7)#233 |
| 8. | 33897 | 17.7% | 2.9%(+14.8)#8 | 2.1%(+15.7)#234 |
| 9. | 32162 | 17.7% | 2.9%(+14.8)#9 | 2.1%(+15.6)#235 |
| 10. | 32212 | 17.2% | 2.9%(+14.3)#10 | 2.1%(+15.2)#247 |
| 11. | 32819 | 14.6% | 2.9%(+11.7)#11 | 2.1%(+12.5)#355 |
| 12. | 34756 | 14.1% | 2.9%(+11.2)#12 | 2.1%(+12.0)#378 |
| 13. | 32437 | 13.9% | 2.9%(+11.0)#13 | 2.1%(+11.8)#397 |
| 14. | 34786 | 13.7% | 2.9%(+10.8)#14 | 2.1%(+11.6)#404 |
| 15. | 32836 | 13.0% | 2.9%(+10.1)#15 | 2.1%(+11.0)#447 |
| 16. | 33896 | 13.0% | 2.9%(+10.1)#16 | 2.1%(+10.9)#450 |
| 17. | 33837 | 11.6% | 2.9%(+8.69)#17 | 2.1%(+9.50)#549 |
| 18. | 32612 | 11.4% | 2.9%(+8.54)#18 | 2.1%(+9.35)#555 |
| 19. | 33844 | 11.3% | 2.9%(+8.42)#19 | 2.1%(+9.24)#570 |
| 20. | 34787 | 11.2% | 2.9%(+8.32)#20 | 2.1%(+9.14)#581 |
| 21. | 32053 | 11.1% | 2.9%(+8.23)#21 | 2.1%(+9.05)#589 |
| 22. | 32163 | 10.9% | 2.9%(+8.02)#22 | 2.1%(+8.84)#608 |
| 23. | 34139 | 10.5% | 2.9%(+7.63)#23 | 2.1%(+8.44)#648 |
| 24. | 32816 | 9.7% | 2.9%(+6.79)#24 | 2.1%(+7.61)#747 |
| 25. | 32732 | 9.7% | 2.9%(+6.75)#25 | 2.1%(+7.57)#755 |
| 26. | 33403 | 9.6% | 2.9%(+6.72)#26 | 2.1%(+7.54)#761 |
| 27. | 34711 | 9.4% | 2.9%(+6.47)#27 | 2.1%(+7.29)#795 |
| 28. | 32811 | 9.3% | 2.9%(+6.41)#28 | 2.1%(+7.23)#805 |
| 29. | 34746 | 9.3% | 2.9%(+6.40)#29 | 2.1%(+7.22)#806 |
| 30. | 32962 | 8.6% | 2.9%(+5.66)#30 | 2.1%(+6.47)#932 |
| 31. | 32801 | 8.5% | 2.9%(+5.56)#31 | 2.1%(+6.37)#950 |
| 32. | 32603 | 8.4% | 2.9%(+5.55)#32 | 2.1%(+6.36)#956 |
| 33. | 33306 | 8.4% | 2.9%(+5.51)#33 | 2.1%(+6.33)#967 |
| 34. | 33001 | 8.1% | 2.9%(+5.21)#34 | 2.1%(+6.03)#1,033 |
| 35. | 32837 | 8.0% | 2.9%(+5.14)#35 | 2.1%(+5.96)#1,051 |
| 36. | 34949 | 7.9% | 2.9%(+5.01)#36 | 2.1%(+5.83)#1,083 |
| 37. | 32824 | 7.9% | 2.9%(+4.99)#37 | 2.1%(+5.80)#1,089 |
| 38. | 33850 | 7.8% | 2.9%(+4.92)#38 | 2.1%(+5.74)#1,101 |
| 39. | 32625 | 7.6% | 2.9%(+4.69)#39 | 2.1%(+5.50)#1,159 |
| 40. | 32830 | 7.5% | 2.9%(+4.60)#40 | 2.1%(+5.42)#1,178 |
| 41. | 34759 | 7.5% | 2.9%(+4.56)#41 | 2.1%(+5.38)#1,187 |
| 42. | 33109 | 7.4% | 2.9%(+4.52)#42 | 2.1%(+5.34)#1,198 |
| 43. | 33960 | 7.3% | 2.9%(+4.45)#43 | 2.1%(+5.26)#1,217 |
| 44. | 34956 | 7.2% | 2.9%(+4.30)#44 | 2.1%(+5.11)#1,267 |
| 45. | 34758 | 7.2% | 2.9%(+4.27)#45 | 2.1%(+5.09)#1,278 |
| 46. | 34637 | 7.1% | 2.9%(+4.18)#46 | 2.1%(+5.00)#1,308 |
| 47. | 32818 | 7.1% | 2.9%(+4.16)#47 | 2.1%(+4.98)#1,313 |
| 48. | 32502 | 7.0% | 2.9%(+4.13)#48 | 2.1%(+4.94)#1,319 |
| 49. | 34442 | 7.0% | 2.9%(+4.08)#49 | 2.1%(+4.89)#1,344 |
| 50. | 34771 | 6.9% | 2.9%(+3.96)#50 | 2.1%(+4.77)#1,376 |
| 51. | 32759 | 6.7% | 2.9%(+3.82)#51 | 2.1%(+4.63)#1,410 |
| 52. | 32949 | 6.7% | 2.9%(+3.77)#52 | 2.1%(+4.58)#1,430 |
| 53. | 34105 | 6.6% | 2.9%(+3.73)#53 | 2.1%(+4.54)#1,448 |
| 54. | 33620 | 6.6% | 2.9%(+3.67)#54 | 2.1%(+4.49)#1,466 |
| 55. | 32835 | 6.5% | 2.9%(+3.61)#55 | 2.1%(+4.42)#1,491 |
| 56. | 34134 | 6.5% | 2.9%(+3.57)#56 | 2.1%(+4.39)#1,510 |
| 57. | 32580 | 6.5% | 2.9%(+3.56)#57 | 2.1%(+4.38)#1,517 |
| 58. | 33435 | 6.4% | 2.9%(+3.46)#58 | 2.1%(+4.28)#1,554 |
| 59. | 32803 | 6.3% | 2.9%(+3.44)#59 | 2.1%(+4.26)#1,566 |
| 60. | 32730 | 6.3% | 2.9%(+3.43)#60 | 2.1%(+4.25)#1,567 |
| 61. | 32798 | 6.3% | 2.9%(+3.41)#61 | 2.1%(+4.23)#1,579 |
| 62. | 34736 | 6.2% | 2.9%(+3.31)#62 | 2.1%(+4.13)#1,625 |
| 63. | 32820 | 6.2% | 2.9%(+3.28)#63 | 2.1%(+4.10)#1,628 |
| 64. | 32306 | 6.1% | 2.9%(+3.24)#64 | 2.1%(+4.06)#1,636 |
| 65. | 32808 | 6.1% | 2.9%(+3.23)#65 | 2.1%(+4.05)#1,641 |
| 66. | 33469 | 6.1% | 2.9%(+3.23)#66 | 2.1%(+4.05)#1,644 |
| 67. | 34743 | 6.1% | 2.9%(+3.21)#67 | 2.1%(+4.03)#1,651 |
| 68. | 32082 | 5.9% | 2.9%(+3.02)#68 | 2.1%(+3.84)#1,738 |
| 69. | 32839 | 5.9% | 2.9%(+2.99)#69 | 2.1%(+3.81)#1,754 |
| 70. | 34109 | 5.9% | 2.9%(+2.99)#70 | 2.1%(+3.81)#1,755 |
| 71. | 33438 | 5.9% | 2.9%(+2.98)#71 | 2.1%(+3.80)#1,764 |
| 72. | 33881 | 5.9% | 2.9%(+2.97)#72 | 2.1%(+3.78)#1,774 |
| 73. | 34734 | 5.8% | 2.9%(+2.94)#73 | 2.1%(+3.76)#1,782 |
| 74. | 34997 | 5.8% | 2.9%(+2.93)#74 | 2.1%(+3.74)#1,787 |
| 75. | 32324 | 5.8% | 2.9%(+2.93)#75 | 2.1%(+3.74)#1,789 |
| 76. | 34243 | 5.8% | 2.9%(+2.92)#76 | 2.1%(+3.73)#1,797 |
| 77. | 33849 | 5.8% | 2.9%(+2.91)#77 | 2.1%(+3.73)#1,803 |
| 78. | 33445 | 5.8% | 2.9%(+2.90)#78 | 2.1%(+3.71)#1,807 |
| 79. | 33431 | 5.8% | 2.9%(+2.87)#79 | 2.1%(+3.69)#1,823 |
| 80. | 34761 | 5.7% | 2.9%(+2.83)#80 | 2.1%(+3.65)#1,834 |
| 81. | 33928 | 5.7% | 2.9%(+2.83)#81 | 2.1%(+3.65)#1,835 |
| 82. | 32686 | 5.7% | 2.9%(+2.76)#82 | 2.1%(+3.58)#1,878 |
| 83. | 33410 | 5.6% | 2.9%(+2.75)#83 | 2.1%(+3.57)#1,886 |
| 84. | 33070 | 5.5% | 2.9%(+2.65)#84 | 2.1%(+3.46)#1,940 |
| 85. | 33042 | 5.5% | 2.9%(+2.59)#85 | 2.1%(+3.40)#1,975 |
| 86. | 33884 | 5.4% | 2.9%(+2.54)#86 | 2.1%(+3.36)#1,997 |
| 87. | 32410 | 5.4% | 2.9%(+2.52)#87 | 2.1%(+3.34)#2,010 |
| 88. | 34142 | 5.4% | 2.9%(+2.49)#88 | 2.1%(+3.31)#2,027 |
| 89. | 33037 | 5.3% | 2.9%(+2.44)#89 | 2.1%(+3.26)#2,055 |
| 90. | 33004 | 5.3% | 2.9%(+2.40)#90 | 2.1%(+3.22)#2,080 |
| 91. | 33707 | 5.3% | 2.9%(+2.37)#91 | 2.1%(+3.19)#2,095 |
| 92. | 34760 | 5.3% | 2.9%(+2.35)#92 | 2.1%(+3.17)#2,114 |
| 93. | 32102 | 5.2% | 2.9%(+2.32)#93 | 2.1%(+3.14)#2,138 |
| 94. | 34741 | 5.2% | 2.9%(+2.32)#94 | 2.1%(+3.14)#2,142 |
| 95. | 32464 | 5.2% | 2.9%(+2.28)#95 | 2.1%(+3.10)#2,167 |
| 96. | 33428 | 5.2% | 2.9%(+2.28)#96 | 2.1%(+3.10)#2,168 |
| 97. | 34104 | 5.1% | 2.9%(+2.24)#97 | 2.1%(+3.06)#2,185 |
| 98. | 34236 | 5.1% | 2.9%(+2.24)#98 | 2.1%(+3.06)#2,186 |
| 99. | 32601 | 5.1% | 2.9%(+2.21)#99 | 2.1%(+3.03)#2,204 |
| 100. | 32094 | 5.0% | 2.9%(+2.14)#100 | 2.1%(+2.96)#2,255 |
Common Questions
What are the Top 10 Zip Codes with the Highest Percentage of Population Employed in Arts, Entertainment & Recreation in Florida?
Top 10 Zip Codes with the Highest Percentage of Population Employed in Arts, Entertainment & Recreation in Florida are:
What zip code has the Highest Percentage of Population Employed in Arts, Entertainment & Recreation in Florida?
34729 has the Highest Percentage of Population Employed in Arts, Entertainment & Recreation in Florida with 100.0%.
What is the Percentage of Population Employed in Arts, Entertainment & Recreation in the State of Florida?
Percentage of Population Employed in Arts, Entertainment & Recreation in Florida is 2.9%.
What is the Percentage of Population Employed in Arts, Entertainment & Recreation in the United States?
Percentage of Population Employed in Arts, Entertainment & Recreation in the United States is 2.1%.