Zip Codes with the Highest Percentage of Population Employed in Arts, Entertainment & Recreation in Georgia
RELATED REPORTS & OPTIONS
Arts, Entertainment & Recreation
Georgia
Compare Zip Codes
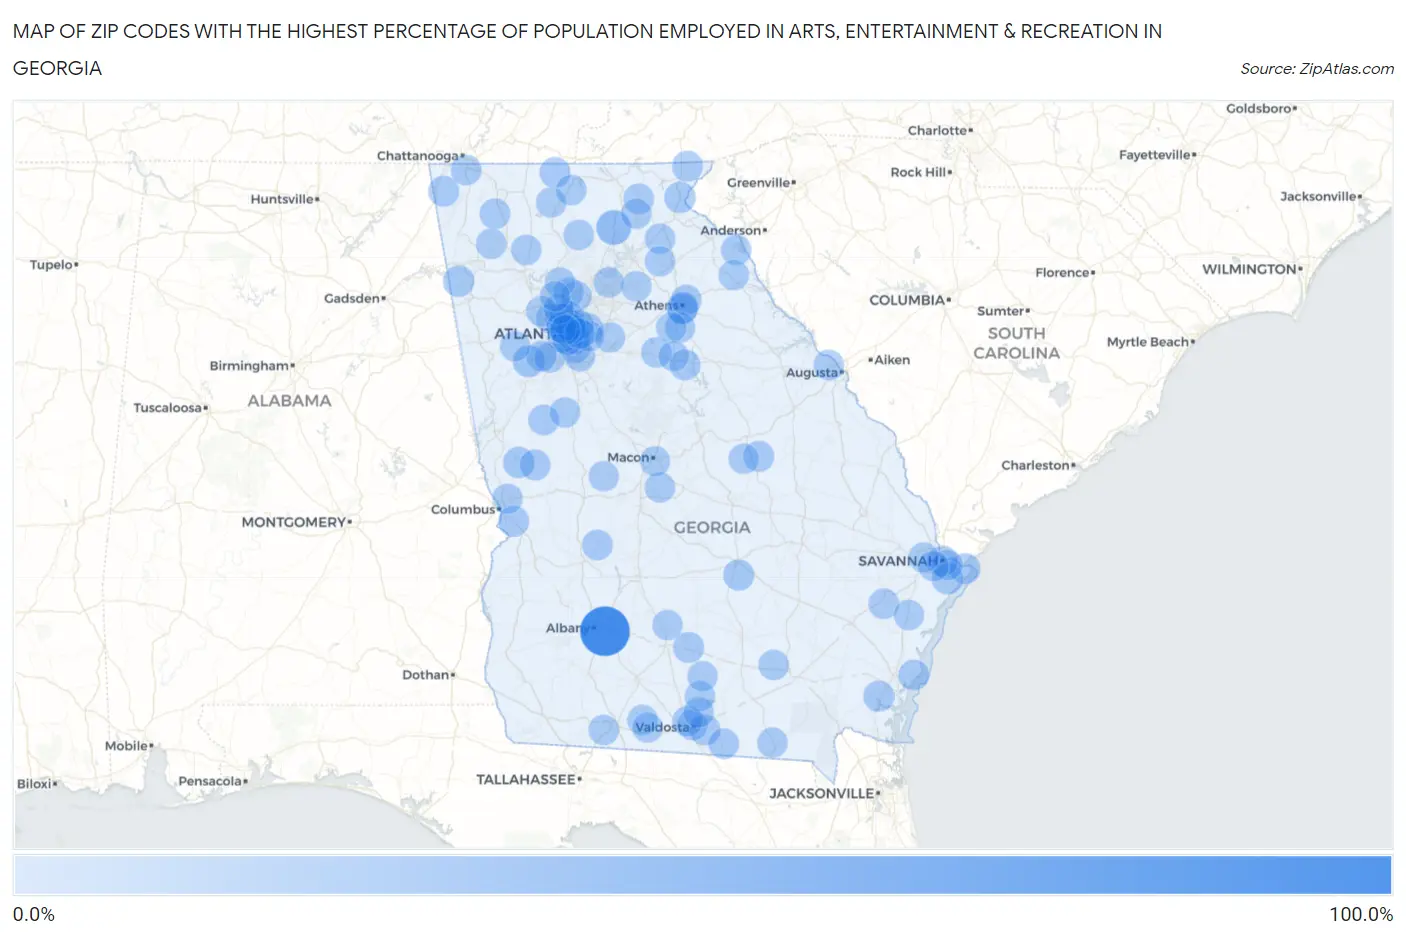
Map of Zip Codes with the Highest Percentage of Population Employed in Arts, Entertainment & Recreation in Georgia
0.0%
100.0%
Zip Codes with the Highest Percentage of Population Employed in Arts, Entertainment & Recreation in Georgia
| Zip Code | % Employed | vs State | vs National | |
| 1. | 31704 | 100.0% | 1.6%(+98.4)#1 | 2.1%(+97.9)#3 |
| 2. | 30597 | 23.9% | 1.6%(+22.2)#2 | 2.1%(+21.8)#125 |
| 3. | 30268 | 9.9% | 1.6%(+8.31)#3 | 2.1%(+7.84)#712 |
| 4. | 30303 | 9.0% | 1.6%(+7.41)#4 | 2.1%(+6.95)#852 |
| 5. | 30072 | 8.9% | 1.6%(+7.26)#5 | 2.1%(+6.80)#869 |
| 6. | 30602 | 7.3% | 1.6%(+5.66)#6 | 2.1%(+5.20)#1,238 |
| 7. | 30573 | 7.3% | 1.6%(+5.65)#7 | 2.1%(+5.19)#1,246 |
| 8. | 30124 | 7.2% | 1.6%(+5.57)#8 | 2.1%(+5.10)#1,269 |
| 9. | 31823 | 6.9% | 1.6%(+5.32)#9 | 2.1%(+4.85)#1,353 |
| 10. | 31411 | 6.3% | 1.6%(+4.67)#10 | 2.1%(+4.21)#1,591 |
| 11. | 31328 | 5.8% | 1.6%(+4.18)#11 | 2.1%(+3.72)#1,805 |
| 12. | 31055 | 5.7% | 1.6%(+4.04)#12 | 2.1%(+3.57)#1,883 |
| 13. | 31565 | 5.3% | 1.6%(+3.70)#13 | 2.1%(+3.23)#2,073 |
| 14. | 31606 | 5.3% | 1.6%(+3.65)#14 | 2.1%(+3.19)#2,097 |
| 15. | 31035 | 5.1% | 1.6%(+3.49)#15 | 2.1%(+3.02)#2,210 |
| 16. | 31826 | 5.0% | 1.6%(+3.43)#16 | 2.1%(+2.96)#2,252 |
| 17. | 31749 | 5.0% | 1.6%(+3.41)#17 | 2.1%(+2.95)#2,262 |
| 18. | 30738 | 5.0% | 1.6%(+3.41)#18 | 2.1%(+2.95)#2,266 |
| 19. | 30537 | 4.9% | 1.6%(+3.29)#19 | 2.1%(+2.83)#2,352 |
| 20. | 30609 | 4.7% | 1.6%(+3.12)#20 | 2.1%(+2.66)#2,489 |
| 21. | 30541 | 4.7% | 1.6%(+3.07)#21 | 2.1%(+2.61)#2,540 |
| 22. | 31401 | 4.2% | 1.6%(+2.62)#22 | 2.1%(+2.16)#3,029 |
| 23. | 30076 | 4.2% | 1.6%(+2.60)#23 | 2.1%(+2.14)#3,051 |
| 24. | 30288 | 4.2% | 1.6%(+2.60)#24 | 2.1%(+2.14)#3,055 |
| 25. | 31905 | 4.1% | 1.6%(+2.45)#25 | 2.1%(+1.99)#3,229 |
| 26. | 30218 | 4.1% | 1.6%(+2.45)#26 | 2.1%(+1.99)#3,232 |
| 27. | 31522 | 4.1% | 1.6%(+2.45)#27 | 2.1%(+1.99)#3,239 |
| 28. | 30746 | 4.1% | 1.6%(+2.45)#28 | 2.1%(+1.98)#3,242 |
| 29. | 30322 | 4.0% | 1.6%(+2.43)#29 | 2.1%(+1.96)#3,268 |
| 30. | 31698 | 4.0% | 1.6%(+2.42)#30 | 2.1%(+1.96)#3,275 |
| 31. | 31404 | 4.0% | 1.6%(+2.40)#31 | 2.1%(+1.93)#3,312 |
| 32. | 31711 | 4.0% | 1.6%(+2.39)#32 | 2.1%(+1.93)#3,317 |
| 33. | 30601 | 4.0% | 1.6%(+2.39)#33 | 2.1%(+1.92)#3,329 |
| 34. | 30316 | 4.0% | 1.6%(+2.34)#34 | 2.1%(+1.88)#3,388 |
| 35. | 30625 | 3.9% | 1.6%(+2.31)#35 | 2.1%(+1.85)#3,436 |
| 36. | 30273 | 3.9% | 1.6%(+2.29)#36 | 2.1%(+1.82)#3,471 |
| 37. | 31648 | 3.8% | 1.6%(+2.23)#37 | 2.1%(+1.76)#3,557 |
| 38. | 30741 | 3.7% | 1.6%(+2.09)#38 | 2.1%(+1.63)#3,756 |
| 39. | 30291 | 3.7% | 1.6%(+2.03)#39 | 2.1%(+1.57)#3,848 |
| 40. | 30310 | 3.5% | 1.6%(+1.89)#40 | 2.1%(+1.43)#4,099 |
| 41. | 30213 | 3.5% | 1.6%(+1.88)#41 | 2.1%(+1.42)#4,120 |
| 42. | 30663 | 3.4% | 1.6%(+1.82)#42 | 2.1%(+1.36)#4,255 |
| 43. | 30307 | 3.4% | 1.6%(+1.81)#43 | 2.1%(+1.35)#4,285 |
| 44. | 30035 | 3.4% | 1.6%(+1.79)#44 | 2.1%(+1.32)#4,341 |
| 45. | 31301 | 3.4% | 1.6%(+1.78)#45 | 2.1%(+1.32)#4,357 |
| 46. | 30545 | 3.4% | 1.6%(+1.74)#46 | 2.1%(+1.28)#4,440 |
| 47. | 30733 | 3.3% | 1.6%(+1.72)#47 | 2.1%(+1.26)#4,484 |
| 48. | 31602 | 3.3% | 1.6%(+1.65)#48 | 2.1%(+1.19)#4,631 |
| 49. | 30313 | 3.3% | 1.6%(+1.63)#49 | 2.1%(+1.17)#4,678 |
| 50. | 31605 | 3.2% | 1.6%(+1.59)#50 | 2.1%(+1.13)#4,764 |
| 51. | 30315 | 3.2% | 1.6%(+1.57)#51 | 2.1%(+1.11)#4,826 |
| 52. | 30528 | 3.2% | 1.6%(+1.55)#52 | 2.1%(+1.09)#4,885 |
| 53. | 31323 | 3.1% | 1.6%(+1.52)#53 | 2.1%(+1.06)#4,948 |
| 54. | 30324 | 3.1% | 1.6%(+1.47)#54 | 2.1%(+1.01)#5,090 |
| 55. | 30677 | 3.1% | 1.6%(+1.45)#55 | 2.1%(+0.989)#5,154 |
| 56. | 31552 | 3.0% | 1.6%(+1.43)#56 | 2.1%(+0.966)#5,217 |
| 57. | 31720 | 3.0% | 1.6%(+1.41)#57 | 2.1%(+0.948)#5,269 |
| 58. | 30082 | 3.0% | 1.6%(+1.40)#58 | 2.1%(+0.939)#5,298 |
| 59. | 30548 | 2.9% | 1.6%(+1.32)#59 | 2.1%(+0.856)#5,543 |
| 60. | 30075 | 2.9% | 1.6%(+1.31)#60 | 2.1%(+0.847)#5,568 |
| 61. | 30510 | 2.9% | 1.6%(+1.30)#61 | 2.1%(+0.838)#5,590 |
| 62. | 30513 | 2.9% | 1.6%(+1.27)#62 | 2.1%(+0.807)#5,681 |
| 63. | 31098 | 2.9% | 1.6%(+1.26)#63 | 2.1%(+0.794)#5,722 |
| 64. | 30188 | 2.9% | 1.6%(+1.25)#64 | 2.1%(+0.792)#5,730 |
| 65. | 31792 | 2.9% | 1.6%(+1.25)#65 | 2.1%(+0.788)#5,742 |
| 66. | 30643 | 2.9% | 1.6%(+1.25)#66 | 2.1%(+0.786)#5,748 |
| 67. | 30339 | 2.9% | 1.6%(+1.23)#67 | 2.1%(+0.771)#5,801 |
| 68. | 30518 | 2.8% | 1.6%(+1.20)#68 | 2.1%(+0.739)#5,913 |
| 69. | 30171 | 2.8% | 1.6%(+1.20)#69 | 2.1%(+0.738)#5,914 |
| 70. | 30342 | 2.8% | 1.6%(+1.20)#70 | 2.1%(+0.735)#5,925 |
| 71. | 30064 | 2.8% | 1.6%(+1.20)#71 | 2.1%(+0.733)#5,935 |
| 72. | 31645 | 2.8% | 1.6%(+1.17)#72 | 2.1%(+0.707)#6,042 |
| 73. | 30621 | 2.8% | 1.6%(+1.16)#73 | 2.1%(+0.697)#6,064 |
| 74. | 30327 | 2.8% | 1.6%(+1.14)#74 | 2.1%(+0.680)#6,132 |
| 75. | 31089 | 2.8% | 1.6%(+1.14)#75 | 2.1%(+0.677)#6,140 |
| 76. | 30012 | 2.7% | 1.6%(+1.09)#76 | 2.1%(+0.628)#6,319 |
| 77. | 30540 | 2.7% | 1.6%(+1.08)#77 | 2.1%(+0.617)#6,364 |
| 78. | 30033 | 2.7% | 1.6%(+1.08)#78 | 2.1%(+0.614)#6,371 |
| 79. | 31629 | 2.7% | 1.6%(+1.06)#79 | 2.1%(+0.596)#6,444 |
| 80. | 30187 | 2.7% | 1.6%(+1.04)#80 | 2.1%(+0.580)#6,515 |
| 81. | 30148 | 2.7% | 1.6%(+1.04)#81 | 2.1%(+0.578)#6,521 |
| 82. | 30306 | 2.7% | 1.6%(+1.03)#82 | 2.1%(+0.572)#6,539 |
| 83. | 30318 | 2.6% | 1.6%(+1.02)#83 | 2.1%(+0.562)#6,586 |
| 84. | 31078 | 2.6% | 1.6%(+1.00)#84 | 2.1%(+0.539)#6,665 |
| 85. | 31201 | 2.6% | 1.6%(+0.993)#85 | 2.1%(+0.531)#6,703 |
| 86. | 30634 | 2.6% | 1.6%(+0.979)#86 | 2.1%(+0.516)#6,764 |
| 87. | 30032 | 2.6% | 1.6%(+0.972)#87 | 2.1%(+0.510)#6,787 |
| 88. | 30292 | 2.6% | 1.6%(+0.971)#88 | 2.1%(+0.508)#6,794 |
| 89. | 30907 | 2.6% | 1.6%(+0.935)#89 | 2.1%(+0.473)#6,932 |
| 90. | 31405 | 2.5% | 1.6%(+0.927)#90 | 2.1%(+0.465)#6,966 |
| 91. | 30067 | 2.5% | 1.6%(+0.922)#91 | 2.1%(+0.460)#6,983 |
| 92. | 31733 | 2.5% | 1.6%(+0.922)#92 | 2.1%(+0.460)#6,986 |
| 93. | 30650 | 2.5% | 1.6%(+0.922)#93 | 2.1%(+0.460)#6,989 |
| 94. | 30066 | 2.5% | 1.6%(+0.900)#94 | 2.1%(+0.438)#7,085 |
| 95. | 31909 | 2.5% | 1.6%(+0.876)#95 | 2.1%(+0.413)#7,192 |
| 96. | 31639 | 2.5% | 1.6%(+0.875)#96 | 2.1%(+0.413)#7,197 |
| 97. | 31631 | 2.4% | 1.6%(+0.829)#97 | 2.1%(+0.366)#7,415 |
| 98. | 30332 | 2.4% | 1.6%(+0.824)#98 | 2.1%(+0.361)#7,447 |
| 99. | 31322 | 2.4% | 1.6%(+0.822)#99 | 2.1%(+0.360)#7,453 |
| 100. | 30558 | 2.4% | 1.6%(+0.809)#100 | 2.1%(+0.347)#7,511 |
Common Questions
What are the Top 10 Zip Codes with the Highest Percentage of Population Employed in Arts, Entertainment & Recreation in Georgia?
Top 10 Zip Codes with the Highest Percentage of Population Employed in Arts, Entertainment & Recreation in Georgia are:
What zip code has the Highest Percentage of Population Employed in Arts, Entertainment & Recreation in Georgia?
31704 has the Highest Percentage of Population Employed in Arts, Entertainment & Recreation in Georgia with 100.0%.
What is the Percentage of Population Employed in Arts, Entertainment & Recreation in the State of Georgia?
Percentage of Population Employed in Arts, Entertainment & Recreation in Georgia is 1.6%.
What is the Percentage of Population Employed in Arts, Entertainment & Recreation in the United States?
Percentage of Population Employed in Arts, Entertainment & Recreation in the United States is 2.1%.