Zip Codes with the Highest Percentage of Population Employed in Arts, Entertainment & Recreation in Rhode Island
RELATED REPORTS & OPTIONS
Arts, Entertainment & Recreation
Rhode Island
Compare Zip Codes
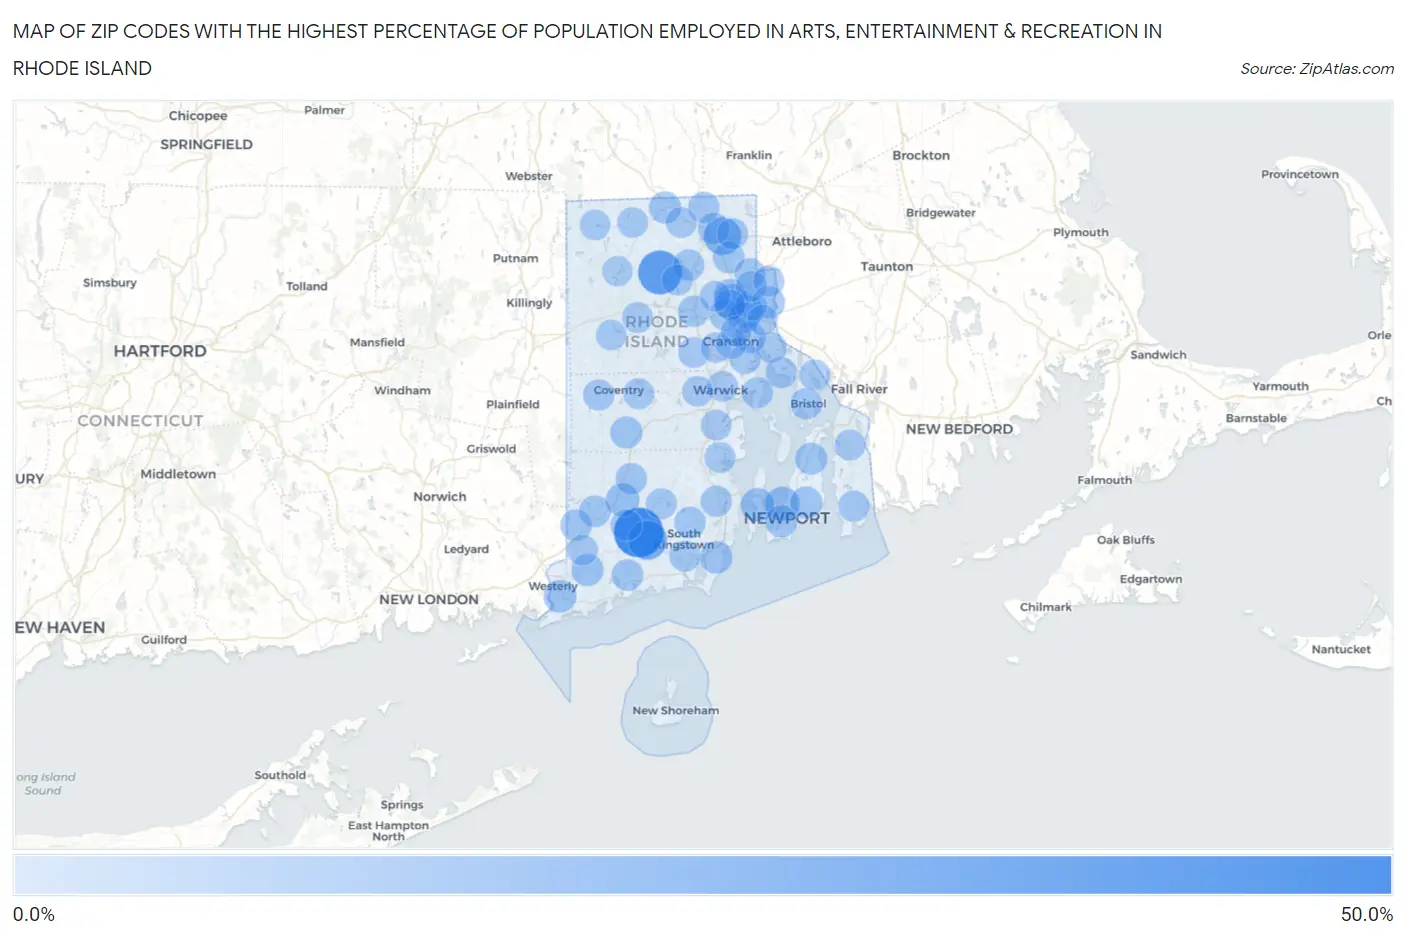
Map of Zip Codes with the Highest Percentage of Population Employed in Arts, Entertainment & Recreation in Rhode Island
0.0%
50.0%
Zip Codes with the Highest Percentage of Population Employed in Arts, Entertainment & Recreation in Rhode Island
| Zip Code | % Employed | vs State | vs National | |
| 1. | 02875 | 50.0% | 2.4%(+47.6)#1 | 2.1%(+47.9)#32 |
| 2. | 02829 | 35.0% | 2.4%(+32.6)#2 | 2.1%(+32.9)#64 |
| 3. | 02836 | 22.9% | 2.4%(+20.5)#3 | 2.1%(+20.8)#134 |
| 4. | 02802 | 18.7% | 2.4%(+16.3)#4 | 2.1%(+16.6)#219 |
| 5. | 02918 | 10.4% | 2.4%(+8.03)#5 | 2.1%(+8.35)#656 |
| 6. | 02841 | 9.9% | 2.4%(+7.54)#6 | 2.1%(+7.86)#709 |
| 7. | 02835 | 8.7% | 2.4%(+6.30)#7 | 2.1%(+6.61)#914 |
| 8. | 02898 | 7.8% | 2.4%(+5.40)#8 | 2.1%(+5.71)#1,108 |
| 9. | 02891 | 6.4% | 2.4%(+3.95)#9 | 2.1%(+4.27)#1,561 |
| 10. | 02882 | 5.5% | 2.4%(+3.10)#10 | 2.1%(+3.42)#1,962 |
| 11. | 02916 | 5.1% | 2.4%(+2.66)#11 | 2.1%(+2.97)#2,246 |
| 12. | 02808 | 4.9% | 2.4%(+2.48)#12 | 2.1%(+2.79)#2,381 |
| 13. | 02842 | 4.8% | 2.4%(+2.38)#13 | 2.1%(+2.69)#2,459 |
| 14. | 02817 | 4.7% | 2.4%(+2.35)#14 | 2.1%(+2.66)#2,487 |
| 15. | 02912 | 4.7% | 2.4%(+2.34)#15 | 2.1%(+2.65)#2,498 |
| 16. | 02871 | 4.7% | 2.4%(+2.34)#16 | 2.1%(+2.65)#2,500 |
| 17. | 02840 | 4.5% | 2.4%(+2.15)#17 | 2.1%(+2.46)#2,688 |
| 18. | 02876 | 4.5% | 2.4%(+2.12)#18 | 2.1%(+2.43)#2,720 |
| 19. | 02904 | 4.4% | 2.4%(+1.97)#19 | 2.1%(+2.28)#2,886 |
| 20. | 02832 | 3.6% | 2.4%(+1.25)#20 | 2.1%(+1.56)#3,868 |
| 21. | 02813 | 3.4% | 2.4%(+1.03)#21 | 2.1%(+1.34)#4,308 |
| 22. | 02838 | 3.4% | 2.4%(+1.01)#22 | 2.1%(+1.32)#4,346 |
| 23. | 02917 | 3.4% | 2.4%(+0.955)#23 | 2.1%(+1.27)#4,462 |
| 24. | 02833 | 3.3% | 2.4%(+0.882)#24 | 2.1%(+1.20)#4,618 |
| 25. | 02881 | 3.1% | 2.4%(+0.744)#25 | 2.1%(+1.06)#4,956 |
| 26. | 02865 | 3.1% | 2.4%(+0.668)#26 | 2.1%(+0.982)#5,179 |
| 27. | 02809 | 3.0% | 2.4%(+0.645)#27 | 2.1%(+0.959)#5,239 |
| 28. | 02822 | 3.0% | 2.4%(+0.589)#28 | 2.1%(+0.903)#5,396 |
| 29. | 02909 | 3.0% | 2.4%(+0.555)#29 | 2.1%(+0.869)#5,500 |
| 30. | 02903 | 2.9% | 2.4%(+0.479)#30 | 2.1%(+0.793)#5,727 |
| 31. | 02919 | 2.8% | 2.4%(+0.439)#31 | 2.1%(+0.753)#5,870 |
| 32. | 02906 | 2.8% | 2.4%(+0.422)#32 | 2.1%(+0.736)#5,924 |
| 33. | 02837 | 2.8% | 2.4%(+0.409)#33 | 2.1%(+0.723)#5,968 |
| 34. | 02905 | 2.8% | 2.4%(+0.401)#34 | 2.1%(+0.715)#6,005 |
| 35. | 02812 | 2.7% | 2.4%(+0.306)#35 | 2.1%(+0.620)#6,346 |
| 36. | 02895 | 2.5% | 2.4%(+0.069)#36 | 2.1%(+0.383)#7,326 |
| 37. | 02806 | 2.4% | 2.4%(-0.027)#37 | 2.1%(+0.287)#7,789 |
| 38. | 02874 | 2.3% | 2.4%(-0.096)#38 | 2.1%(+0.218)#8,119 |
| 39. | 02827 | 2.3% | 2.4%(-0.102)#39 | 2.1%(+0.212)#8,155 |
| 40. | 02863 | 2.2% | 2.4%(-0.214)#40 | 2.1%(+0.100)#8,735 |
| 41. | 02879 | 2.0% | 2.4%(-0.399)#41 | 2.1%(-0.085)#9,796 |
| 42. | 02864 | 2.0% | 2.4%(-0.444)#42 | 2.1%(-0.130)#10,058 |
| 43. | 02889 | 1.9% | 2.4%(-0.455)#43 | 2.1%(-0.141)#10,128 |
| 44. | 02860 | 1.9% | 2.4%(-0.507)#44 | 2.1%(-0.193)#10,428 |
| 45. | 02828 | 1.9% | 2.4%(-0.518)#45 | 2.1%(-0.204)#10,502 |
| 46. | 02816 | 1.8% | 2.4%(-0.600)#46 | 2.1%(-0.286)#11,037 |
| 47. | 02886 | 1.8% | 2.4%(-0.638)#47 | 2.1%(-0.324)#11,312 |
| 48. | 02908 | 1.7% | 2.4%(-0.651)#48 | 2.1%(-0.337)#11,406 |
| 49. | 02892 | 1.7% | 2.4%(-0.657)#49 | 2.1%(-0.343)#11,452 |
| 50. | 02861 | 1.7% | 2.4%(-0.699)#50 | 2.1%(-0.385)#11,748 |
| 51. | 02888 | 1.6% | 2.4%(-0.748)#51 | 2.1%(-0.434)#12,096 |
| 52. | 02852 | 1.6% | 2.4%(-0.778)#52 | 2.1%(-0.464)#12,311 |
| 53. | 02921 | 1.6% | 2.4%(-0.778)#53 | 2.1%(-0.464)#12,313 |
| 54. | 02878 | 1.6% | 2.4%(-0.799)#54 | 2.1%(-0.485)#12,477 |
| 55. | 02857 | 1.5% | 2.4%(-0.868)#55 | 2.1%(-0.554)#13,042 |
| 56. | 02830 | 1.4% | 2.4%(-0.994)#56 | 2.1%(-0.680)#13,962 |
| 57. | 02910 | 1.4% | 2.4%(-0.996)#57 | 2.1%(-0.682)#13,978 |
| 58. | 02920 | 1.4% | 2.4%(-1.00)#58 | 2.1%(-0.687)#14,029 |
| 59. | 02885 | 1.4% | 2.4%(-1.04)#59 | 2.1%(-0.731)#14,345 |
| 60. | 02896 | 1.3% | 2.4%(-1.05)#60 | 2.1%(-0.737)#14,399 |
| 61. | 02804 | 1.3% | 2.4%(-1.13)#61 | 2.1%(-0.821)#15,007 |
| 62. | 02818 | 1.2% | 2.4%(-1.20)#62 | 2.1%(-0.883)#15,485 |
| 63. | 02893 | 1.1% | 2.4%(-1.28)#63 | 2.1%(-0.969)#16,130 |
| 64. | 02907 | 0.93% | 2.4%(-1.47)#64 | 2.1%(-1.15)#17,483 |
| 65. | 02915 | 0.91% | 2.4%(-1.49)#65 | 2.1%(-1.17)#17,613 |
| 66. | 02911 | 0.88% | 2.4%(-1.51)#66 | 2.1%(-1.20)#17,821 |
| 67. | 02859 | 0.81% | 2.4%(-1.59)#67 | 2.1%(-1.27)#18,322 |
| 68. | 02825 | 0.81% | 2.4%(-1.59)#68 | 2.1%(-1.28)#18,365 |
| 69. | 02914 | 0.40% | 2.4%(-2.00)#69 | 2.1%(-1.68)#21,108 |
| 70. | 02814 | 0.35% | 2.4%(-2.05)#70 | 2.1%(-1.74)#21,446 |
1
Common Questions
What are the Top 10 Zip Codes with the Highest Percentage of Population Employed in Arts, Entertainment & Recreation in Rhode Island?
Top 10 Zip Codes with the Highest Percentage of Population Employed in Arts, Entertainment & Recreation in Rhode Island are:
What zip code has the Highest Percentage of Population Employed in Arts, Entertainment & Recreation in Rhode Island?
02875 has the Highest Percentage of Population Employed in Arts, Entertainment & Recreation in Rhode Island with 50.0%.
What is the Percentage of Population Employed in Arts, Entertainment & Recreation in the State of Rhode Island?
Percentage of Population Employed in Arts, Entertainment & Recreation in Rhode Island is 2.4%.
What is the Percentage of Population Employed in Arts, Entertainment & Recreation in the United States?
Percentage of Population Employed in Arts, Entertainment & Recreation in the United States is 2.1%.