Zip Codes with the Highest Percentage of Population Employed in Arts, Entertainment & Recreation in Vermont
RELATED REPORTS & OPTIONS
Arts, Entertainment & Recreation
Vermont
Compare Zip Codes
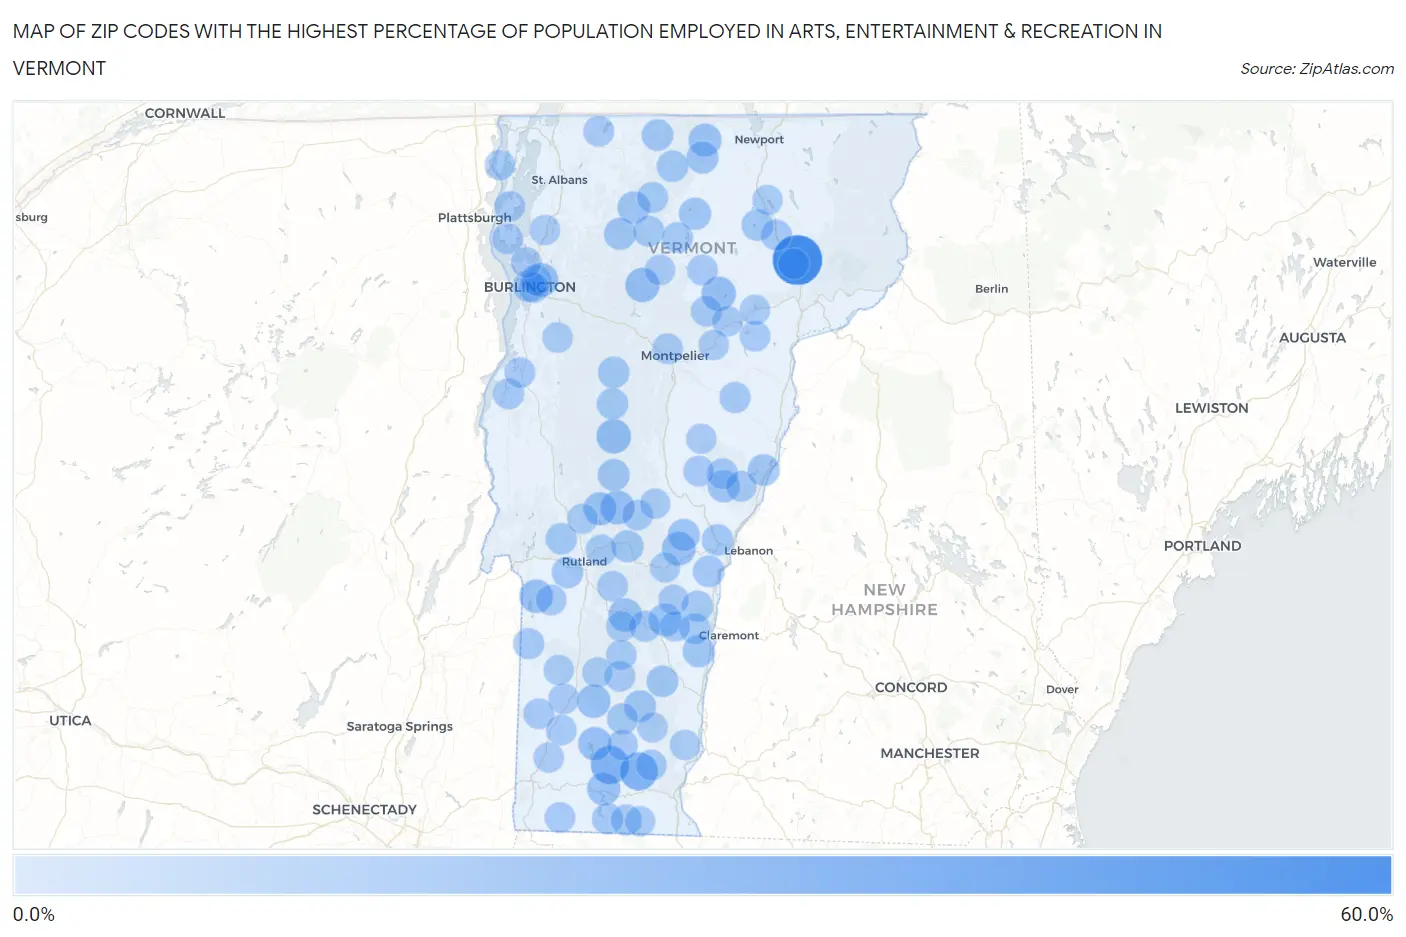
Map of Zip Codes with the Highest Percentage of Population Employed in Arts, Entertainment & Recreation in Vermont
0.0%
60.0%
Zip Codes with the Highest Percentage of Population Employed in Arts, Entertainment & Recreation in Vermont
| Zip Code | % Employed | vs State | vs National | |
| 1. | 05850 | 52.6% | 2.8%(+49.8)#1 | 2.1%(+50.5)#29 |
| 2. | 05356 | 22.6% | 2.8%(+19.8)#2 | 2.1%(+20.5)#141 |
| 3. | 05351 | 22.0% | 2.8%(+19.2)#3 | 2.1%(+19.9)#149 |
| 4. | 05747 | 13.3% | 2.8%(+10.5)#4 | 2.1%(+11.3)#429 |
| 5. | 05681 | 12.9% | 2.8%(+10.2)#5 | 2.1%(+10.9)#454 |
| 6. | 05672 | 12.6% | 2.8%(+9.83)#6 | 2.1%(+10.5)#475 |
| 7. | 05439 | 11.9% | 2.8%(+9.14)#7 | 2.1%(+9.85)#515 |
| 8. | 05762 | 11.9% | 2.8%(+9.08)#8 | 2.1%(+9.78)#522 |
| 9. | 05091 | 11.0% | 2.8%(+8.23)#9 | 2.1%(+8.93)#603 |
| 10. | 05764 | 10.7% | 2.8%(+7.89)#10 | 2.1%(+8.59)#626 |
| 11. | 05360 | 10.6% | 2.8%(+7.86)#11 | 2.1%(+8.56)#630 |
| 12. | 05340 | 10.3% | 2.8%(+7.50)#12 | 2.1%(+8.20)#667 |
| 13. | 05758 | 10.1% | 2.8%(+7.33)#13 | 2.1%(+8.04)#690 |
| 14. | 05737 | 9.8% | 2.8%(+6.99)#14 | 2.1%(+7.69)#738 |
| 15. | 05153 | 9.4% | 2.8%(+6.62)#15 | 2.1%(+7.32)#792 |
| 16. | 05363 | 9.4% | 2.8%(+6.57)#16 | 2.1%(+7.27)#798 |
| 17. | 05859 | 9.2% | 2.8%(+6.44)#17 | 2.1%(+7.14)#818 |
| 18. | 05492 | 7.5% | 2.8%(+4.76)#18 | 2.1%(+5.46)#1,171 |
| 19. | 05874 | 7.5% | 2.8%(+4.69)#19 | 2.1%(+5.39)#1,183 |
| 20. | 05070 | 7.3% | 2.8%(+4.51)#20 | 2.1%(+5.21)#1,232 |
| 21. | 05464 | 7.3% | 2.8%(+4.49)#21 | 2.1%(+5.19)#1,241 |
| 22. | 05653 | 7.2% | 2.8%(+4.38)#22 | 2.1%(+5.08)#1,281 |
| 23. | 05067 | 7.1% | 2.8%(+4.36)#23 | 2.1%(+5.06)#1,291 |
| 24. | 05156 | 6.8% | 2.8%(+4.02)#24 | 2.1%(+4.72)#1,393 |
| 25. | 05751 | 6.8% | 2.8%(+3.99)#25 | 2.1%(+4.70)#1,398 |
| 26. | 05359 | 6.6% | 2.8%(+3.82)#26 | 2.1%(+4.52)#1,456 |
| 27. | 05767 | 6.5% | 2.8%(+3.71)#27 | 2.1%(+4.41)#1,503 |
| 28. | 05045 | 6.5% | 2.8%(+3.69)#28 | 2.1%(+4.39)#1,511 |
| 29. | 05143 | 6.1% | 2.8%(+3.33)#29 | 2.1%(+4.04)#1,647 |
| 30. | 05476 | 6.1% | 2.8%(+3.30)#30 | 2.1%(+4.01)#1,657 |
| 31. | 05401 | 6.1% | 2.8%(+3.30)#31 | 2.1%(+4.00)#1,659 |
| 32. | 05839 | 6.0% | 2.8%(+3.23)#32 | 2.1%(+3.94)#1,695 |
| 33. | 05673 | 5.9% | 2.8%(+3.07)#33 | 2.1%(+3.77)#1,776 |
| 34. | 05471 | 5.8% | 2.8%(+2.99)#34 | 2.1%(+3.69)#1,820 |
| 35. | 05048 | 5.8% | 2.8%(+2.99)#35 | 2.1%(+3.69)#1,821 |
| 36. | 05674 | 5.6% | 2.8%(+2.79)#36 | 2.1%(+3.49)#1,921 |
| 37. | 05001 | 5.5% | 2.8%(+2.74)#37 | 2.1%(+3.44)#1,952 |
| 38. | 05744 | 5.3% | 2.8%(+2.50)#38 | 2.1%(+3.20)#2,087 |
| 39. | 05777 | 5.2% | 2.8%(+2.37)#39 | 2.1%(+3.07)#2,183 |
| 40. | 05149 | 4.9% | 2.8%(+2.15)#40 | 2.1%(+2.85)#2,337 |
| 41. | 05775 | 4.7% | 2.8%(+1.94)#41 | 2.1%(+2.65)#2,506 |
| 42. | 05037 | 4.7% | 2.8%(+1.92)#42 | 2.1%(+2.62)#2,528 |
| 43. | 05656 | 4.6% | 2.8%(+1.83)#43 | 2.1%(+2.53)#2,610 |
| 44. | 05361 | 4.6% | 2.8%(+1.79)#44 | 2.1%(+2.50)#2,652 |
| 45. | 05701 | 4.6% | 2.8%(+1.77)#45 | 2.1%(+2.48)#2,675 |
| 46. | 05151 | 4.5% | 2.8%(+1.68)#46 | 2.1%(+2.38)#2,782 |
| 47. | 05086 | 4.4% | 2.8%(+1.65)#47 | 2.1%(+2.35)#2,812 |
| 48. | 05442 | 4.4% | 2.8%(+1.62)#48 | 2.1%(+2.32)#2,844 |
| 49. | 05866 | 4.4% | 2.8%(+1.60)#49 | 2.1%(+2.30)#2,860 |
| 50. | 05404 | 4.4% | 2.8%(+1.59)#50 | 2.1%(+2.29)#2,872 |
| 51. | 05491 | 4.2% | 2.8%(+1.46)#51 | 2.1%(+2.17)#3,018 |
| 52. | 05342 | 4.2% | 2.8%(+1.43)#52 | 2.1%(+2.14)#3,059 |
| 53. | 05343 | 4.2% | 2.8%(+1.37)#53 | 2.1%(+2.08)#3,131 |
| 54. | 05655 | 4.0% | 2.8%(+1.25)#54 | 2.1%(+1.95)#3,284 |
| 55. | 05072 | 4.0% | 2.8%(+1.21)#55 | 2.1%(+1.92)#3,336 |
| 56. | 05362 | 4.0% | 2.8%(+1.21)#56 | 2.1%(+1.92)#3,341 |
| 57. | 05851 | 4.0% | 2.8%(+1.21)#57 | 2.1%(+1.92)#3,349 |
| 58. | 05255 | 3.9% | 2.8%(+1.16)#58 | 2.1%(+1.87)#3,400 |
| 59. | 05486 | 3.9% | 2.8%(+1.15)#59 | 2.1%(+1.85)#3,433 |
| 60. | 05457 | 3.9% | 2.8%(+1.08)#60 | 2.1%(+1.78)#3,535 |
| 61. | 05075 | 3.7% | 2.8%(+0.963)#61 | 2.1%(+1.67)#3,707 |
| 62. | 05077 | 3.7% | 2.8%(+0.951)#62 | 2.1%(+1.65)#3,727 |
| 63. | 05456 | 3.6% | 2.8%(+0.857)#63 | 2.1%(+1.56)#3,867 |
| 64. | 05862 | 3.6% | 2.8%(+0.851)#64 | 2.1%(+1.55)#3,883 |
| 65. | 05602 | 3.6% | 2.8%(+0.846)#65 | 2.1%(+1.55)#3,891 |
| 66. | 05738 | 3.6% | 2.8%(+0.827)#66 | 2.1%(+1.53)#3,928 |
| 67. | 05650 | 3.6% | 2.8%(+0.800)#67 | 2.1%(+1.50)#3,977 |
| 68. | 05148 | 3.5% | 2.8%(+0.698)#68 | 2.1%(+1.40)#4,169 |
| 69. | 05250 | 3.5% | 2.8%(+0.673)#69 | 2.1%(+1.38)#4,225 |
| 70. | 05680 | 3.4% | 2.8%(+0.656)#70 | 2.1%(+1.36)#4,258 |
| 71. | 05658 | 3.4% | 2.8%(+0.654)#71 | 2.1%(+1.36)#4,264 |
| 72. | 05772 | 3.3% | 2.8%(+0.539)#72 | 2.1%(+1.24)#4,519 |
| 73. | 05352 | 3.3% | 2.8%(+0.533)#73 | 2.1%(+1.24)#4,531 |
| 74. | 05355 | 3.3% | 2.8%(+0.531)#74 | 2.1%(+1.23)#4,537 |
| 75. | 05252 | 3.2% | 2.8%(+0.429)#75 | 2.1%(+1.13)#4,765 |
| 76. | 05757 | 3.2% | 2.8%(+0.415)#76 | 2.1%(+1.12)#4,803 |
| 77. | 05405 | 3.2% | 2.8%(+0.372)#77 | 2.1%(+1.08)#4,908 |
| 78. | 05461 | 3.1% | 2.8%(+0.345)#78 | 2.1%(+1.05)#4,983 |
| 79. | 05661 | 3.1% | 2.8%(+0.308)#79 | 2.1%(+1.01)#5,085 |
| 80. | 05446 | 3.1% | 2.8%(+0.278)#80 | 2.1%(+0.981)#5,181 |
| 81. | 05062 | 3.0% | 2.8%(+0.245)#81 | 2.1%(+0.948)#5,268 |
| 82. | 05032 | 2.9% | 2.8%(+0.131)#82 | 2.1%(+0.834)#5,605 |
| 83. | 05262 | 2.8% | 2.8%(+0.043)#83 | 2.1%(+0.746)#5,892 |
| 84. | 05152 | 2.8% | 2.8%(+0.002)#84 | 2.1%(+0.705)#6,049 |
| 85. | 05873 | 2.7% | 2.8%(-0.049)#85 | 2.1%(+0.654)#6,231 |
| 86. | 05667 | 2.7% | 2.8%(-0.055)#86 | 2.1%(+0.648)#6,251 |
| 87. | 05353 | 2.7% | 2.8%(-0.058)#87 | 2.1%(+0.645)#6,263 |
| 88. | 05346 | 2.7% | 2.8%(-0.092)#88 | 2.1%(+0.611)#6,389 |
| 89. | 05142 | 2.7% | 2.8%(-0.107)#89 | 2.1%(+0.596)#6,445 |
| 90. | 05730 | 2.7% | 2.8%(-0.112)#90 | 2.1%(+0.591)#6,469 |
| 91. | 05468 | 2.7% | 2.8%(-0.130)#91 | 2.1%(+0.573)#6,535 |
| 92. | 05763 | 2.7% | 2.8%(-0.131)#92 | 2.1%(+0.572)#6,540 |
| 93. | 05458 | 2.6% | 2.8%(-0.165)#93 | 2.1%(+0.538)#6,669 |
| 94. | 05251 | 2.6% | 2.8%(-0.226)#94 | 2.1%(+0.477)#6,916 |
| 95. | 05358 | 2.5% | 2.8%(-0.238)#95 | 2.1%(+0.465)#6,964 |
| 96. | 05463 | 2.5% | 2.8%(-0.294)#96 | 2.1%(+0.409)#7,217 |
| 97. | 05161 | 2.5% | 2.8%(-0.306)#97 | 2.1%(+0.397)#7,268 |
| 98. | 05822 | 2.5% | 2.8%(-0.316)#98 | 2.1%(+0.387)#7,313 |
| 99. | 05034 | 2.5% | 2.8%(-0.316)#99 | 2.1%(+0.387)#7,314 |
| 100. | 05038 | 2.5% | 2.8%(-0.331)#100 | 2.1%(+0.372)#7,382 |
Common Questions
What are the Top 10 Zip Codes with the Highest Percentage of Population Employed in Arts, Entertainment & Recreation in Vermont?
Top 10 Zip Codes with the Highest Percentage of Population Employed in Arts, Entertainment & Recreation in Vermont are:
What zip code has the Highest Percentage of Population Employed in Arts, Entertainment & Recreation in Vermont?
05850 has the Highest Percentage of Population Employed in Arts, Entertainment & Recreation in Vermont with 52.6%.
What is the Percentage of Population Employed in Arts, Entertainment & Recreation in the State of Vermont?
Percentage of Population Employed in Arts, Entertainment & Recreation in Vermont is 2.8%.
What is the Percentage of Population Employed in Arts, Entertainment & Recreation in the United States?
Percentage of Population Employed in Arts, Entertainment & Recreation in the United States is 2.1%.