Immigrants from Zimbabwe vs Blackfeet 2 or more Vehicles in Household
COMPARE
Immigrants from Zimbabwe
Blackfeet
2 or more Vehicles in Household
2 or more Vehicles in Household Comparison
Immigrants from Zimbabwe
Blackfeet
55.6%
2 OR MORE VEHICLES IN HOUSEHOLD
60.2/ 100
METRIC RATING
163rd/ 347
METRIC RANK
56.4%
2 OR MORE VEHICLES IN HOUSEHOLD
86.5/ 100
METRIC RATING
135th/ 347
METRIC RANK
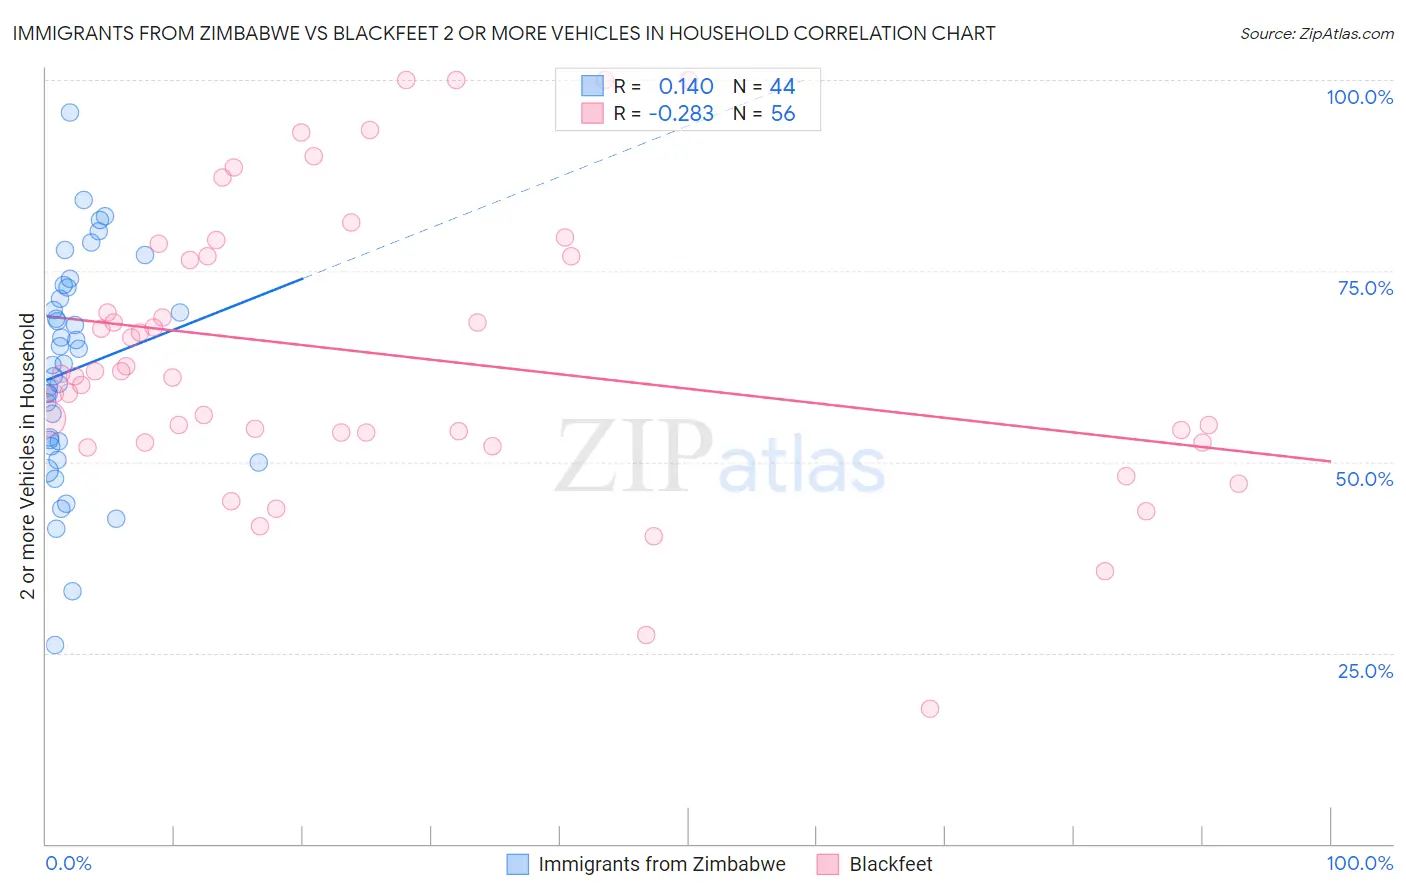
Immigrants from Zimbabwe vs Blackfeet 2 or more Vehicles in Household Correlation Chart
The statistical analysis conducted on geographies consisting of 117,791,116 people shows a poor positive correlation between the proportion of Immigrants from Zimbabwe and percentage of households with 2 or more vehicles available in the United States with a correlation coefficient (R) of 0.140 and weighted average of 55.6%. Similarly, the statistical analysis conducted on geographies consisting of 309,483,449 people shows a weak negative correlation between the proportion of Blackfeet and percentage of households with 2 or more vehicles available in the United States with a correlation coefficient (R) of -0.283 and weighted average of 56.4%, a difference of 1.4%.
2 or more Vehicles in Household Correlation Summary
| Measurement | Immigrants from Zimbabwe | Blackfeet |
| Minimum | 26.1% | 17.6% |
| Maximum | 95.8% | 100.0% |
| Range | 69.7% | 82.4% |
| Mean | 62.1% | 64.0% |
| Median | 62.8% | 61.3% |
| Interquartile 25% (IQ1) | 52.4% | 53.2% |
| Interquartile 75% (IQ3) | 72.1% | 76.8% |
| Interquartile Range (IQR) | 19.7% | 23.7% |
| Standard Deviation (Sample) | 14.4% | 18.5% |
| Standard Deviation (Population) | 14.2% | 18.3% |
Similar Demographics by 2 or more Vehicles in Household
Demographics Similar to Immigrants from Zimbabwe by 2 or more Vehicles in Household
In terms of 2 or more vehicles in household, the demographic groups most similar to Immigrants from Zimbabwe are Dutch West Indian (55.6%, a difference of 0.010%), German Russian (55.6%, a difference of 0.030%), Immigrants from El Salvador (55.6%, a difference of 0.030%), Colville (55.6%, a difference of 0.040%), and Immigrants from Sri Lanka (55.5%, a difference of 0.080%).
| Demographics | Rating | Rank | 2 or more Vehicles in Household |
| Immigrants | Lithuania | 70.4 /100 | #156 | Good 55.8% |
| Immigrants | Kuwait | 70.2 /100 | #157 | Good 55.8% |
| Tlingit-Haida | 68.5 /100 | #158 | Good 55.8% |
| Paiute | 68.0 /100 | #159 | Good 55.8% |
| Crow | 67.0 /100 | #160 | Good 55.7% |
| Colville | 61.1 /100 | #161 | Good 55.6% |
| German Russians | 60.9 /100 | #162 | Good 55.6% |
| Immigrants | Zimbabwe | 60.2 /100 | #163 | Good 55.6% |
| Dutch West Indians | 59.8 /100 | #164 | Average 55.6% |
| Immigrants | El Salvador | 59.4 /100 | #165 | Average 55.6% |
| Immigrants | Sri Lanka | 58.3 /100 | #166 | Average 55.5% |
| Kenyans | 58.1 /100 | #167 | Average 55.5% |
| French American Indians | 56.7 /100 | #168 | Average 55.5% |
| Immigrants | Austria | 56.3 /100 | #169 | Average 55.5% |
| Romanians | 55.8 /100 | #170 | Average 55.5% |
Demographics Similar to Blackfeet by 2 or more Vehicles in Household
In terms of 2 or more vehicles in household, the demographic groups most similar to Blackfeet are Immigrants from the Azores (56.4%, a difference of 0.010%), Immigrants from Asia (56.3%, a difference of 0.040%), Cuban (56.3%, a difference of 0.13%), Salvadoran (56.3%, a difference of 0.14%), and Comanche (56.5%, a difference of 0.16%).
| Demographics | Rating | Rank | 2 or more Vehicles in Household |
| Immigrants | South Central Asia | 90.5 /100 | #128 | Exceptional 56.6% |
| Ute | 90.4 /100 | #129 | Exceptional 56.6% |
| Yugoslavians | 90.0 /100 | #130 | Exceptional 56.6% |
| Bulgarians | 89.7 /100 | #131 | Excellent 56.5% |
| Hungarians | 89.1 /100 | #132 | Excellent 56.5% |
| Comanche | 88.4 /100 | #133 | Excellent 56.5% |
| Immigrants | Azores | 86.6 /100 | #134 | Excellent 56.4% |
| Blackfeet | 86.5 /100 | #135 | Excellent 56.4% |
| Immigrants | Asia | 86.0 /100 | #136 | Excellent 56.3% |
| Cubans | 84.8 /100 | #137 | Excellent 56.3% |
| Salvadorans | 84.7 /100 | #138 | Excellent 56.3% |
| Armenians | 84.3 /100 | #139 | Excellent 56.3% |
| Latvians | 83.6 /100 | #140 | Excellent 56.2% |
| Immigrants | Cambodia | 83.6 /100 | #141 | Excellent 56.2% |
| South Africans | 83.1 /100 | #142 | Excellent 56.2% |