Immigrants from Zimbabwe vs Nonimmigrants 2 or more Vehicles in Household
COMPARE
Immigrants from Zimbabwe
Nonimmigrants
2 or more Vehicles in Household
2 or more Vehicles in Household Comparison
Immigrants from Zimbabwe
Nonimmigrants
55.6%
2 OR MORE VEHICLES IN HOUSEHOLD
60.2/ 100
METRIC RATING
163rd/ 347
METRIC RANK
58.8%
2 OR MORE VEHICLES IN HOUSEHOLD
99.8/ 100
METRIC RATING
62nd/ 347
METRIC RANK
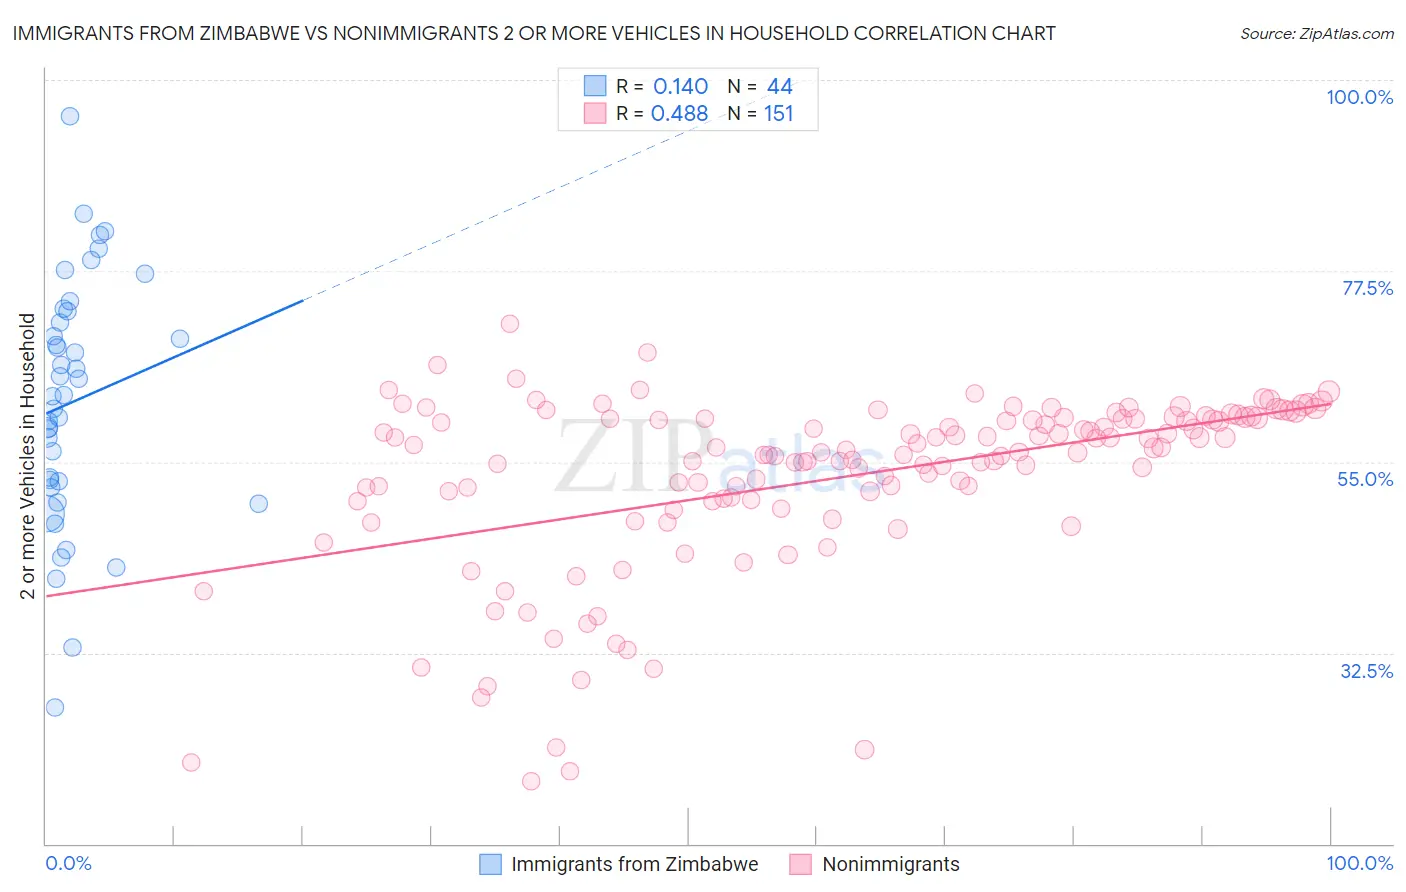
Immigrants from Zimbabwe vs Nonimmigrants 2 or more Vehicles in Household Correlation Chart
The statistical analysis conducted on geographies consisting of 117,791,116 people shows a poor positive correlation between the proportion of Immigrants from Zimbabwe and percentage of households with 2 or more vehicles available in the United States with a correlation coefficient (R) of 0.140 and weighted average of 55.6%. Similarly, the statistical analysis conducted on geographies consisting of 584,662,841 people shows a moderate positive correlation between the proportion of Nonimmigrants and percentage of households with 2 or more vehicles available in the United States with a correlation coefficient (R) of 0.488 and weighted average of 58.8%, a difference of 5.7%.
2 or more Vehicles in Household Correlation Summary
| Measurement | Immigrants from Zimbabwe | Nonimmigrants |
| Minimum | 26.1% | 17.3% |
| Maximum | 95.8% | 71.2% |
| Range | 69.7% | 53.9% |
| Mean | 62.1% | 53.2% |
| Median | 62.8% | 56.1% |
| Interquartile 25% (IQ1) | 52.4% | 50.6% |
| Interquartile 75% (IQ3) | 72.1% | 60.1% |
| Interquartile Range (IQR) | 19.7% | 9.6% |
| Standard Deviation (Sample) | 14.4% | 10.5% |
| Standard Deviation (Population) | 14.2% | 10.5% |
Similar Demographics by 2 or more Vehicles in Household
Demographics Similar to Immigrants from Zimbabwe by 2 or more Vehicles in Household
In terms of 2 or more vehicles in household, the demographic groups most similar to Immigrants from Zimbabwe are Dutch West Indian (55.6%, a difference of 0.010%), German Russian (55.6%, a difference of 0.030%), Immigrants from El Salvador (55.6%, a difference of 0.030%), Colville (55.6%, a difference of 0.040%), and Immigrants from Sri Lanka (55.5%, a difference of 0.080%).
| Demographics | Rating | Rank | 2 or more Vehicles in Household |
| Immigrants | Lithuania | 70.4 /100 | #156 | Good 55.8% |
| Immigrants | Kuwait | 70.2 /100 | #157 | Good 55.8% |
| Tlingit-Haida | 68.5 /100 | #158 | Good 55.8% |
| Paiute | 68.0 /100 | #159 | Good 55.8% |
| Crow | 67.0 /100 | #160 | Good 55.7% |
| Colville | 61.1 /100 | #161 | Good 55.6% |
| German Russians | 60.9 /100 | #162 | Good 55.6% |
| Immigrants | Zimbabwe | 60.2 /100 | #163 | Good 55.6% |
| Dutch West Indians | 59.8 /100 | #164 | Average 55.6% |
| Immigrants | El Salvador | 59.4 /100 | #165 | Average 55.6% |
| Immigrants | Sri Lanka | 58.3 /100 | #166 | Average 55.5% |
| Kenyans | 58.1 /100 | #167 | Average 55.5% |
| French American Indians | 56.7 /100 | #168 | Average 55.5% |
| Immigrants | Austria | 56.3 /100 | #169 | Average 55.5% |
| Romanians | 55.8 /100 | #170 | Average 55.5% |
Demographics Similar to Nonimmigrants by 2 or more Vehicles in Household
In terms of 2 or more vehicles in household, the demographic groups most similar to Nonimmigrants are Osage (58.8%, a difference of 0.040%), Mexican American Indian (58.7%, a difference of 0.070%), French Canadian (58.9%, a difference of 0.17%), Spanish American (58.9%, a difference of 0.19%), and Immigrants from Scotland (58.9%, a difference of 0.22%).
| Demographics | Rating | Rank | 2 or more Vehicles in Household |
| Luxembourgers | 99.9 /100 | #55 | Exceptional 59.1% |
| Chickasaw | 99.9 /100 | #56 | Exceptional 59.0% |
| Afghans | 99.9 /100 | #57 | Exceptional 59.0% |
| Immigrants | Scotland | 99.8 /100 | #58 | Exceptional 58.9% |
| Spanish Americans | 99.8 /100 | #59 | Exceptional 58.9% |
| French Canadians | 99.8 /100 | #60 | Exceptional 58.9% |
| Osage | 99.8 /100 | #61 | Exceptional 58.8% |
| Immigrants | Nonimmigrants | 99.8 /100 | #62 | Exceptional 58.8% |
| Mexican American Indians | 99.8 /100 | #63 | Exceptional 58.7% |
| Portuguese | 99.7 /100 | #64 | Exceptional 58.6% |
| Immigrants | Central America | 99.7 /100 | #65 | Exceptional 58.6% |
| Croatians | 99.7 /100 | #66 | Exceptional 58.6% |
| Laotians | 99.7 /100 | #67 | Exceptional 58.6% |
| Canadians | 99.7 /100 | #68 | Exceptional 58.6% |
| Pennsylvania Germans | 99.7 /100 | #69 | Exceptional 58.5% |