Immigrants from Zimbabwe vs Immigrants from Taiwan 2 or more Vehicles in Household
COMPARE
Immigrants from Zimbabwe
Immigrants from Taiwan
2 or more Vehicles in Household
2 or more Vehicles in Household Comparison
Immigrants from Zimbabwe
Immigrants from Taiwan
55.6%
2 OR MORE VEHICLES IN HOUSEHOLD
60.2/ 100
METRIC RATING
163rd/ 347
METRIC RANK
59.7%
2 OR MORE VEHICLES IN HOUSEHOLD
100.0/ 100
METRIC RATING
45th/ 347
METRIC RANK
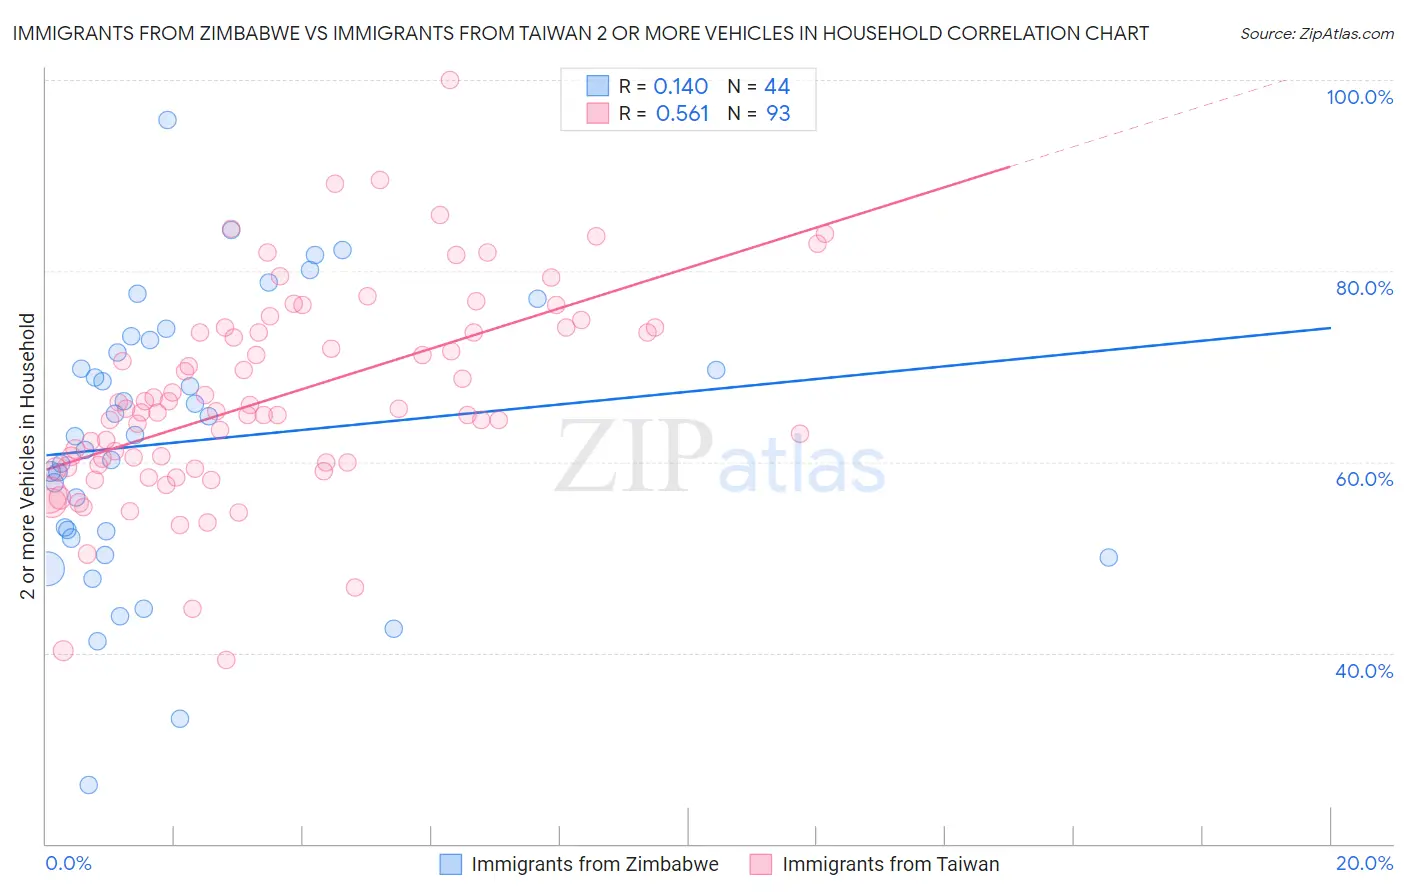
Immigrants from Zimbabwe vs Immigrants from Taiwan 2 or more Vehicles in Household Correlation Chart
The statistical analysis conducted on geographies consisting of 117,791,116 people shows a poor positive correlation between the proportion of Immigrants from Zimbabwe and percentage of households with 2 or more vehicles available in the United States with a correlation coefficient (R) of 0.140 and weighted average of 55.6%. Similarly, the statistical analysis conducted on geographies consisting of 298,141,678 people shows a substantial positive correlation between the proportion of Immigrants from Taiwan and percentage of households with 2 or more vehicles available in the United States with a correlation coefficient (R) of 0.561 and weighted average of 59.7%, a difference of 7.5%.
2 or more Vehicles in Household Correlation Summary
| Measurement | Immigrants from Zimbabwe | Immigrants from Taiwan |
| Minimum | 26.1% | 39.2% |
| Maximum | 95.8% | 100.0% |
| Range | 69.7% | 60.8% |
| Mean | 62.1% | 66.8% |
| Median | 62.8% | 65.3% |
| Interquartile 25% (IQ1) | 52.4% | 59.6% |
| Interquartile 75% (IQ3) | 72.1% | 73.8% |
| Interquartile Range (IQR) | 19.7% | 14.2% |
| Standard Deviation (Sample) | 14.4% | 10.8% |
| Standard Deviation (Population) | 14.2% | 10.7% |
Similar Demographics by 2 or more Vehicles in Household
Demographics Similar to Immigrants from Zimbabwe by 2 or more Vehicles in Household
In terms of 2 or more vehicles in household, the demographic groups most similar to Immigrants from Zimbabwe are Dutch West Indian (55.6%, a difference of 0.010%), German Russian (55.6%, a difference of 0.030%), Immigrants from El Salvador (55.6%, a difference of 0.030%), Colville (55.6%, a difference of 0.040%), and Immigrants from Sri Lanka (55.5%, a difference of 0.080%).
| Demographics | Rating | Rank | 2 or more Vehicles in Household |
| Immigrants | Lithuania | 70.4 /100 | #156 | Good 55.8% |
| Immigrants | Kuwait | 70.2 /100 | #157 | Good 55.8% |
| Tlingit-Haida | 68.5 /100 | #158 | Good 55.8% |
| Paiute | 68.0 /100 | #159 | Good 55.8% |
| Crow | 67.0 /100 | #160 | Good 55.7% |
| Colville | 61.1 /100 | #161 | Good 55.6% |
| German Russians | 60.9 /100 | #162 | Good 55.6% |
| Immigrants | Zimbabwe | 60.2 /100 | #163 | Good 55.6% |
| Dutch West Indians | 59.8 /100 | #164 | Average 55.6% |
| Immigrants | El Salvador | 59.4 /100 | #165 | Average 55.6% |
| Immigrants | Sri Lanka | 58.3 /100 | #166 | Average 55.5% |
| Kenyans | 58.1 /100 | #167 | Average 55.5% |
| French American Indians | 56.7 /100 | #168 | Average 55.5% |
| Immigrants | Austria | 56.3 /100 | #169 | Average 55.5% |
| Romanians | 55.8 /100 | #170 | Average 55.5% |
Demographics Similar to Immigrants from Taiwan by 2 or more Vehicles in Household
In terms of 2 or more vehicles in household, the demographic groups most similar to Immigrants from Taiwan are French (59.8%, a difference of 0.040%), Czechoslovakian (59.8%, a difference of 0.10%), Malaysian (59.8%, a difference of 0.18%), Northern European (59.9%, a difference of 0.19%), and Cherokee (59.9%, a difference of 0.21%).
| Demographics | Rating | Rank | 2 or more Vehicles in Household |
| Americans | 100.0 /100 | #38 | Exceptional 60.0% |
| British | 100.0 /100 | #39 | Exceptional 60.0% |
| Cherokee | 100.0 /100 | #40 | Exceptional 59.9% |
| Northern Europeans | 100.0 /100 | #41 | Exceptional 59.9% |
| Malaysians | 100.0 /100 | #42 | Exceptional 59.8% |
| Czechoslovakians | 100.0 /100 | #43 | Exceptional 59.8% |
| French | 100.0 /100 | #44 | Exceptional 59.8% |
| Immigrants | Taiwan | 100.0 /100 | #45 | Exceptional 59.7% |
| Immigrants | South Eastern Asia | 100.0 /100 | #46 | Exceptional 59.6% |
| Yaqui | 99.9 /100 | #47 | Exceptional 59.3% |
| Immigrants | India | 99.9 /100 | #48 | Exceptional 59.3% |
| Belgians | 99.9 /100 | #49 | Exceptional 59.3% |
| Choctaw | 99.9 /100 | #50 | Exceptional 59.3% |
| Spaniards | 99.9 /100 | #51 | Exceptional 59.2% |
| Immigrants | Laos | 99.9 /100 | #52 | Exceptional 59.2% |