Immigrants from Zimbabwe vs Bolivian 2 or more Vehicles in Household
COMPARE
Immigrants from Zimbabwe
Bolivian
2 or more Vehicles in Household
2 or more Vehicles in Household Comparison
Immigrants from Zimbabwe
Bolivians
55.6%
2 OR MORE VEHICLES IN HOUSEHOLD
60.2/ 100
METRIC RATING
163rd/ 347
METRIC RANK
58.3%
2 OR MORE VEHICLES IN HOUSEHOLD
99.6/ 100
METRIC RATING
73rd/ 347
METRIC RANK
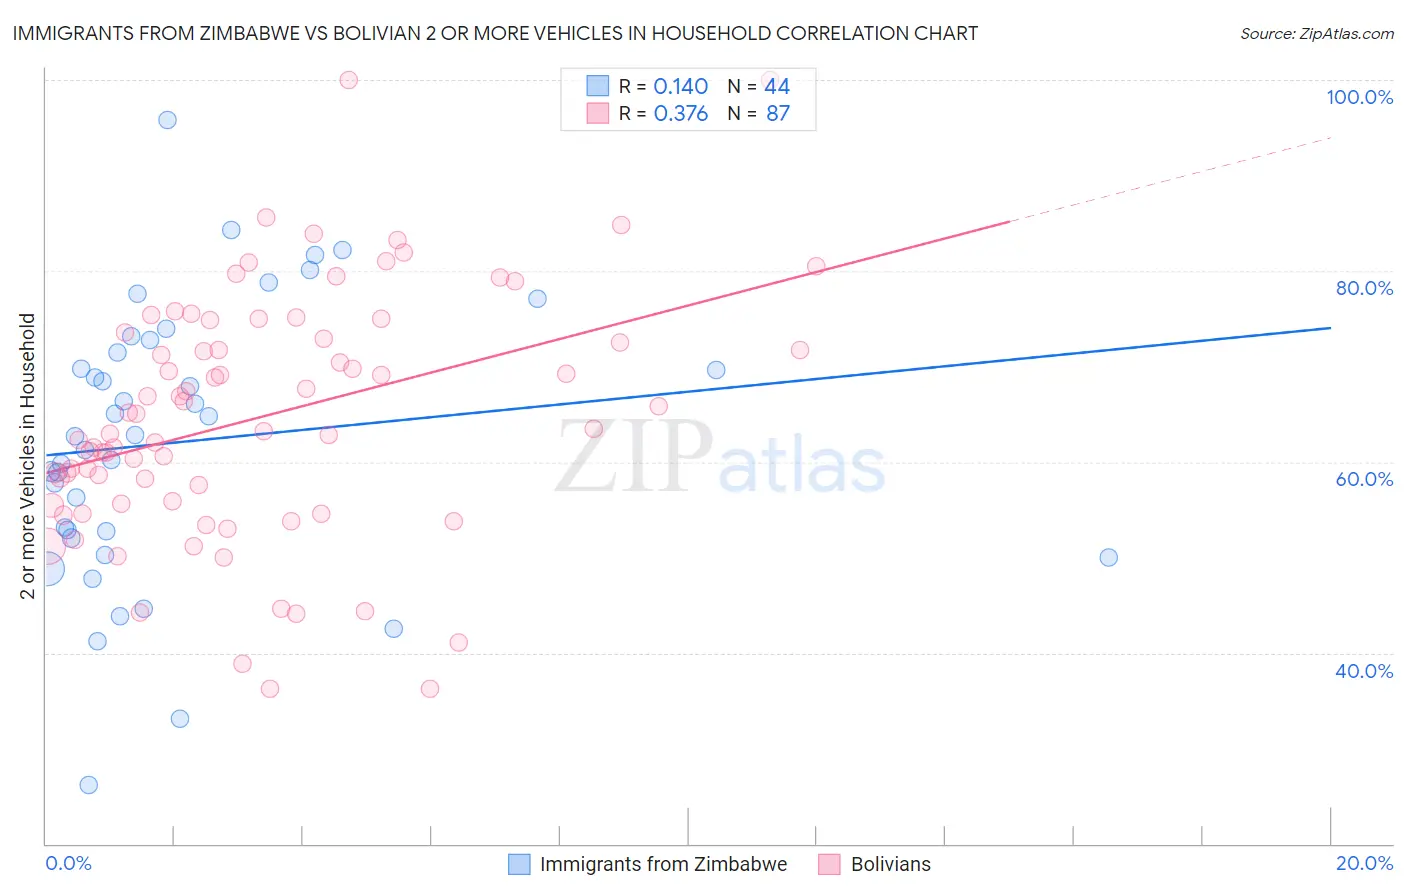
Immigrants from Zimbabwe vs Bolivian 2 or more Vehicles in Household Correlation Chart
The statistical analysis conducted on geographies consisting of 117,791,116 people shows a poor positive correlation between the proportion of Immigrants from Zimbabwe and percentage of households with 2 or more vehicles available in the United States with a correlation coefficient (R) of 0.140 and weighted average of 55.6%. Similarly, the statistical analysis conducted on geographies consisting of 184,629,947 people shows a mild positive correlation between the proportion of Bolivians and percentage of households with 2 or more vehicles available in the United States with a correlation coefficient (R) of 0.376 and weighted average of 58.3%, a difference of 5.0%.
2 or more Vehicles in Household Correlation Summary
| Measurement | Immigrants from Zimbabwe | Bolivian |
| Minimum | 26.1% | 36.2% |
| Maximum | 95.8% | 100.0% |
| Range | 69.7% | 63.8% |
| Mean | 62.1% | 64.7% |
| Median | 62.8% | 63.5% |
| Interquartile 25% (IQ1) | 52.4% | 55.7% |
| Interquartile 75% (IQ3) | 72.1% | 73.5% |
| Interquartile Range (IQR) | 19.7% | 17.9% |
| Standard Deviation (Sample) | 14.4% | 12.9% |
| Standard Deviation (Population) | 14.2% | 12.8% |
Similar Demographics by 2 or more Vehicles in Household
Demographics Similar to Immigrants from Zimbabwe by 2 or more Vehicles in Household
In terms of 2 or more vehicles in household, the demographic groups most similar to Immigrants from Zimbabwe are Dutch West Indian (55.6%, a difference of 0.010%), German Russian (55.6%, a difference of 0.030%), Immigrants from El Salvador (55.6%, a difference of 0.030%), Colville (55.6%, a difference of 0.040%), and Immigrants from Sri Lanka (55.5%, a difference of 0.080%).
| Demographics | Rating | Rank | 2 or more Vehicles in Household |
| Immigrants | Lithuania | 70.4 /100 | #156 | Good 55.8% |
| Immigrants | Kuwait | 70.2 /100 | #157 | Good 55.8% |
| Tlingit-Haida | 68.5 /100 | #158 | Good 55.8% |
| Paiute | 68.0 /100 | #159 | Good 55.8% |
| Crow | 67.0 /100 | #160 | Good 55.7% |
| Colville | 61.1 /100 | #161 | Good 55.6% |
| German Russians | 60.9 /100 | #162 | Good 55.6% |
| Immigrants | Zimbabwe | 60.2 /100 | #163 | Good 55.6% |
| Dutch West Indians | 59.8 /100 | #164 | Average 55.6% |
| Immigrants | El Salvador | 59.4 /100 | #165 | Average 55.6% |
| Immigrants | Sri Lanka | 58.3 /100 | #166 | Average 55.5% |
| Kenyans | 58.1 /100 | #167 | Average 55.5% |
| French American Indians | 56.7 /100 | #168 | Average 55.5% |
| Immigrants | Austria | 56.3 /100 | #169 | Average 55.5% |
| Romanians | 55.8 /100 | #170 | Average 55.5% |
Demographics Similar to Bolivians by 2 or more Vehicles in Household
In terms of 2 or more vehicles in household, the demographic groups most similar to Bolivians are Immigrants from Afghanistan (58.3%, a difference of 0.0%), Polish (58.3%, a difference of 0.080%), Austrian (58.4%, a difference of 0.12%), Creek (58.3%, a difference of 0.12%), and Slovene (58.3%, a difference of 0.12%).
| Demographics | Rating | Rank | 2 or more Vehicles in Household |
| Croatians | 99.7 /100 | #66 | Exceptional 58.6% |
| Laotians | 99.7 /100 | #67 | Exceptional 58.6% |
| Canadians | 99.7 /100 | #68 | Exceptional 58.6% |
| Pennsylvania Germans | 99.7 /100 | #69 | Exceptional 58.5% |
| Italians | 99.6 /100 | #70 | Exceptional 58.4% |
| Bangladeshis | 99.6 /100 | #71 | Exceptional 58.4% |
| Austrians | 99.6 /100 | #72 | Exceptional 58.4% |
| Bolivians | 99.6 /100 | #73 | Exceptional 58.3% |
| Immigrants | Afghanistan | 99.6 /100 | #74 | Exceptional 58.3% |
| Poles | 99.5 /100 | #75 | Exceptional 58.3% |
| Creek | 99.5 /100 | #76 | Exceptional 58.3% |
| Slovenes | 99.5 /100 | #77 | Exceptional 58.3% |
| Lithuanians | 99.5 /100 | #78 | Exceptional 58.2% |
| Delaware | 99.4 /100 | #79 | Exceptional 58.2% |
| Immigrants | England | 99.3 /100 | #80 | Exceptional 58.1% |