Comanche vs Immigrants from Eastern Africa 2 or more Vehicles in Household
COMPARE
Comanche
Immigrants from Eastern Africa
2 or more Vehicles in Household
2 or more Vehicles in Household Comparison
Comanche
Immigrants from Eastern Africa
56.5%
2 OR MORE VEHICLES IN HOUSEHOLD
88.4/ 100
METRIC RATING
133rd/ 347
METRIC RANK
53.7%
2 OR MORE VEHICLES IN HOUSEHOLD
5.1/ 100
METRIC RATING
226th/ 347
METRIC RANK
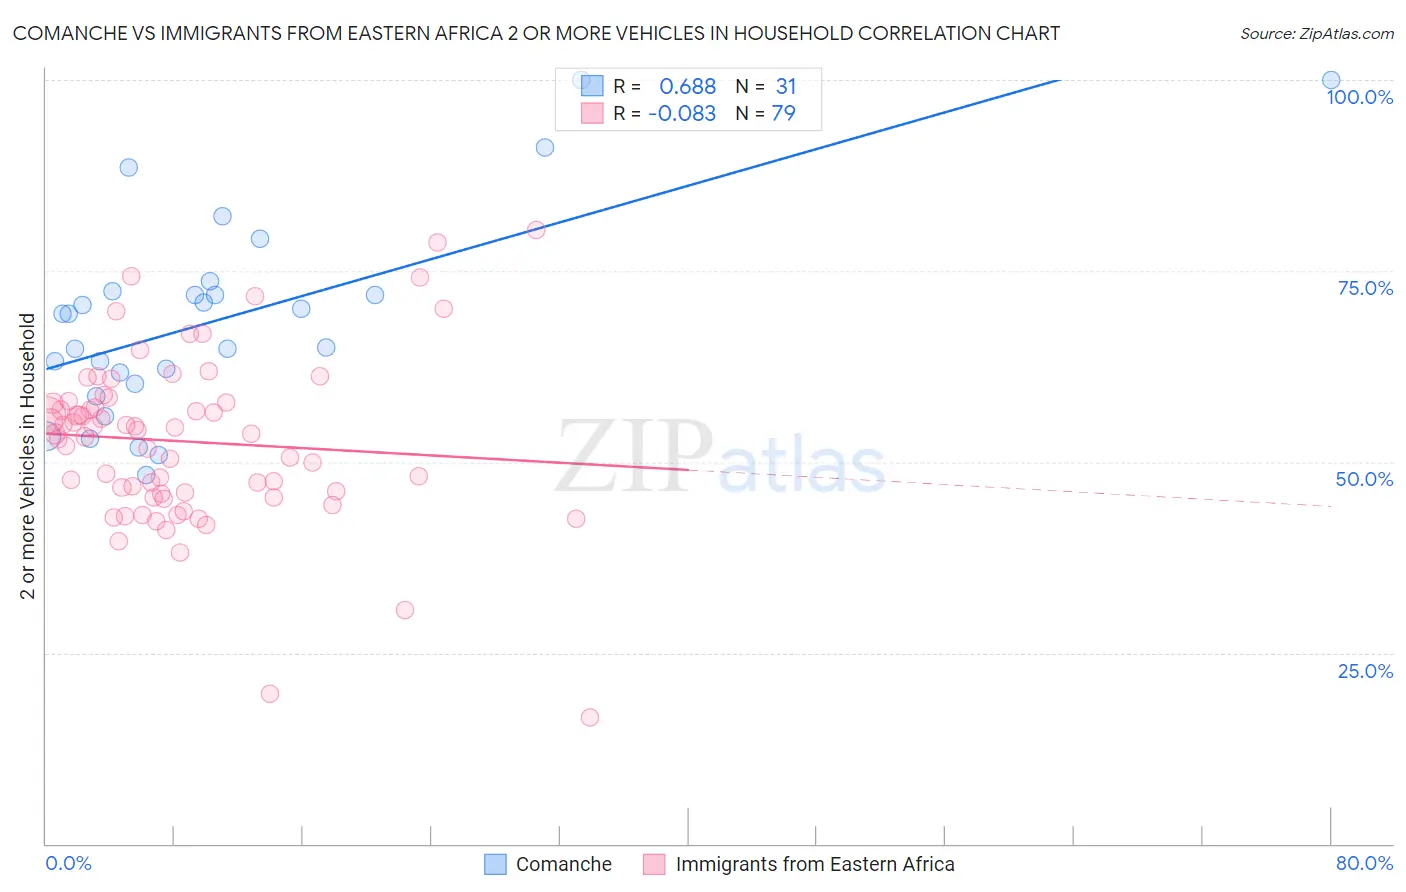
Comanche vs Immigrants from Eastern Africa 2 or more Vehicles in Household Correlation Chart
The statistical analysis conducted on geographies consisting of 109,768,112 people shows a significant positive correlation between the proportion of Comanche and percentage of households with 2 or more vehicles available in the United States with a correlation coefficient (R) of 0.688 and weighted average of 56.5%. Similarly, the statistical analysis conducted on geographies consisting of 354,928,878 people shows a slight negative correlation between the proportion of Immigrants from Eastern Africa and percentage of households with 2 or more vehicles available in the United States with a correlation coefficient (R) of -0.083 and weighted average of 53.7%, a difference of 5.1%.
2 or more Vehicles in Household Correlation Summary
| Measurement | Comanche | Immigrants from Eastern Africa |
| Minimum | 48.2% | 16.4% |
| Maximum | 100.0% | 80.4% |
| Range | 51.8% | 63.9% |
| Mean | 68.7% | 52.7% |
| Median | 69.4% | 53.7% |
| Interquartile 25% (IQ1) | 60.3% | 45.9% |
| Interquartile 75% (IQ3) | 72.4% | 57.8% |
| Interquartile Range (IQR) | 12.1% | 11.9% |
| Standard Deviation (Sample) | 13.2% | 11.1% |
| Standard Deviation (Population) | 13.0% | 11.0% |
Similar Demographics by 2 or more Vehicles in Household
Demographics Similar to Comanche by 2 or more Vehicles in Household
In terms of 2 or more vehicles in household, the demographic groups most similar to Comanche are Hungarian (56.5%, a difference of 0.070%), Bulgarian (56.5%, a difference of 0.14%), Immigrants from the Azores (56.4%, a difference of 0.16%), Blackfeet (56.4%, a difference of 0.16%), and Yugoslavian (56.6%, a difference of 0.17%).
| Demographics | Rating | Rank | 2 or more Vehicles in Household |
| Estonians | 90.9 /100 | #126 | Exceptional 56.6% |
| Immigrants | Thailand | 90.7 /100 | #127 | Exceptional 56.6% |
| Immigrants | South Central Asia | 90.5 /100 | #128 | Exceptional 56.6% |
| Ute | 90.4 /100 | #129 | Exceptional 56.6% |
| Yugoslavians | 90.0 /100 | #130 | Exceptional 56.6% |
| Bulgarians | 89.7 /100 | #131 | Excellent 56.5% |
| Hungarians | 89.1 /100 | #132 | Excellent 56.5% |
| Comanche | 88.4 /100 | #133 | Excellent 56.5% |
| Immigrants | Azores | 86.6 /100 | #134 | Excellent 56.4% |
| Blackfeet | 86.5 /100 | #135 | Excellent 56.4% |
| Immigrants | Asia | 86.0 /100 | #136 | Excellent 56.3% |
| Cubans | 84.8 /100 | #137 | Excellent 56.3% |
| Salvadorans | 84.7 /100 | #138 | Excellent 56.3% |
| Armenians | 84.3 /100 | #139 | Excellent 56.3% |
| Latvians | 83.6 /100 | #140 | Excellent 56.2% |
Demographics Similar to Immigrants from Eastern Africa by 2 or more Vehicles in Household
In terms of 2 or more vehicles in household, the demographic groups most similar to Immigrants from Eastern Africa are Immigrants from Egypt (53.8%, a difference of 0.020%), Brazilian (53.8%, a difference of 0.030%), Immigrants from Bosnia and Herzegovina (53.8%, a difference of 0.070%), Kiowa (53.9%, a difference of 0.20%), and Immigrants from Singapore (53.9%, a difference of 0.21%).
| Demographics | Rating | Rank | 2 or more Vehicles in Household |
| South American Indians | 6.5 /100 | #219 | Tragic 53.9% |
| Taiwanese | 6.3 /100 | #220 | Tragic 53.9% |
| Immigrants | Singapore | 6.3 /100 | #221 | Tragic 53.9% |
| Kiowa | 6.2 /100 | #222 | Tragic 53.9% |
| Immigrants | Bosnia and Herzegovina | 5.5 /100 | #223 | Tragic 53.8% |
| Brazilians | 5.3 /100 | #224 | Tragic 53.8% |
| Immigrants | Egypt | 5.2 /100 | #225 | Tragic 53.8% |
| Immigrants | Eastern Africa | 5.1 /100 | #226 | Tragic 53.7% |
| Sudanese | 4.1 /100 | #227 | Tragic 53.6% |
| Alaska Natives | 3.9 /100 | #228 | Tragic 53.6% |
| Immigrants | Turkey | 3.8 /100 | #229 | Tragic 53.6% |
| Immigrants | Nepal | 3.6 /100 | #230 | Tragic 53.5% |
| Panamanians | 3.4 /100 | #231 | Tragic 53.5% |
| Immigrants | Guatemala | 3.2 /100 | #232 | Tragic 53.5% |
| Ugandans | 3.2 /100 | #233 | Tragic 53.5% |