Comanche vs Chippewa 2 or more Vehicles in Household
COMPARE
Comanche
Chippewa
2 or more Vehicles in Household
2 or more Vehicles in Household Comparison
Comanche
Chippewa
56.5%
2 OR MORE VEHICLES IN HOUSEHOLD
88.4/ 100
METRIC RATING
133rd/ 347
METRIC RANK
57.2%
2 OR MORE VEHICLES IN HOUSEHOLD
96.6/ 100
METRIC RATING
115th/ 347
METRIC RANK
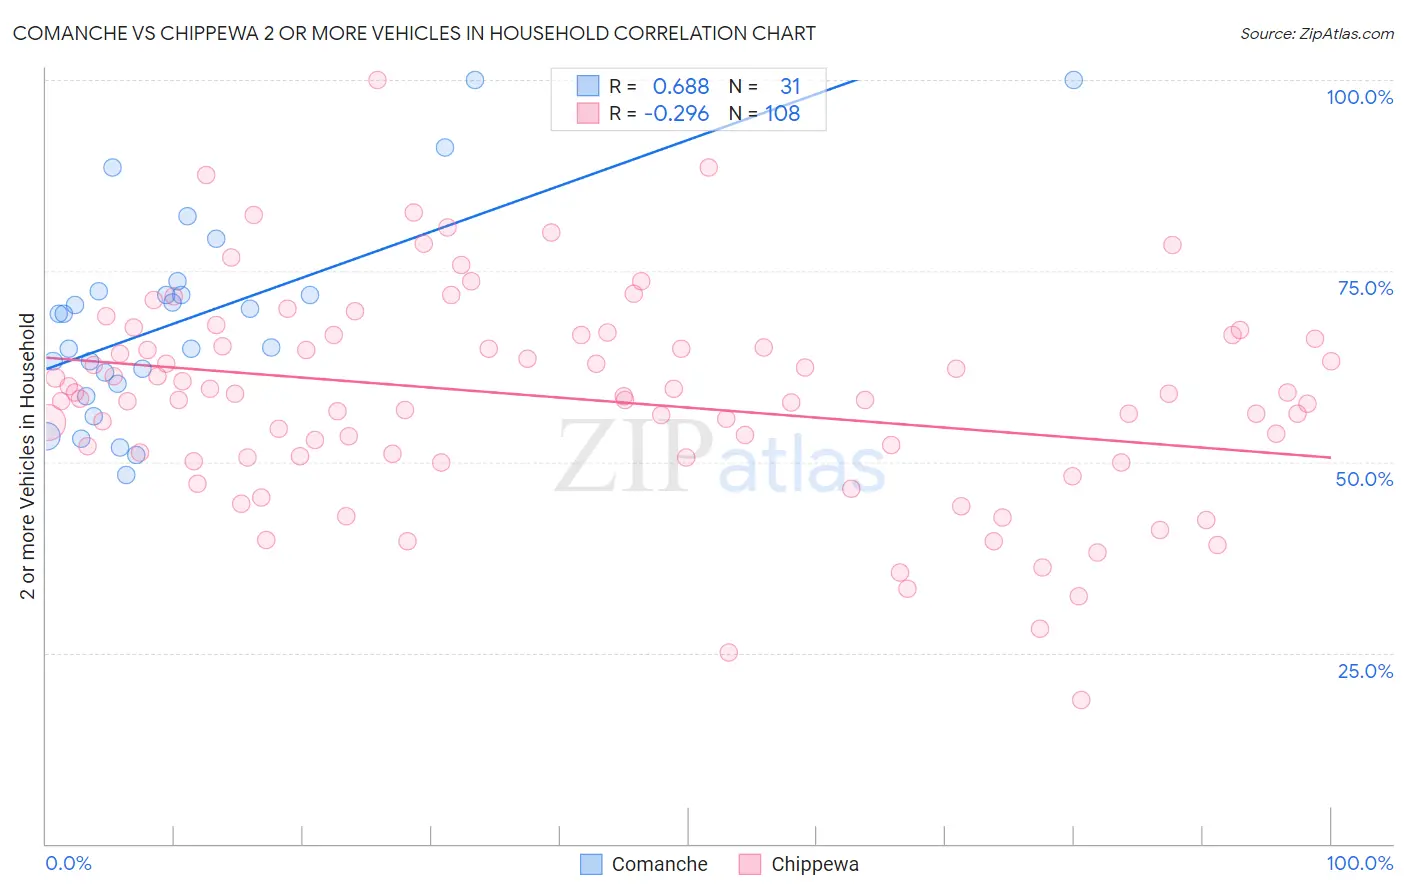
Comanche vs Chippewa 2 or more Vehicles in Household Correlation Chart
The statistical analysis conducted on geographies consisting of 109,768,112 people shows a significant positive correlation between the proportion of Comanche and percentage of households with 2 or more vehicles available in the United States with a correlation coefficient (R) of 0.688 and weighted average of 56.5%. Similarly, the statistical analysis conducted on geographies consisting of 215,015,237 people shows a weak negative correlation between the proportion of Chippewa and percentage of households with 2 or more vehicles available in the United States with a correlation coefficient (R) of -0.296 and weighted average of 57.2%, a difference of 1.3%.
2 or more Vehicles in Household Correlation Summary
| Measurement | Comanche | Chippewa |
| Minimum | 48.2% | 18.9% |
| Maximum | 100.0% | 100.0% |
| Range | 51.8% | 81.1% |
| Mean | 68.7% | 58.3% |
| Median | 69.4% | 58.5% |
| Interquartile 25% (IQ1) | 60.3% | 50.7% |
| Interquartile 75% (IQ3) | 72.4% | 66.4% |
| Interquartile Range (IQR) | 12.1% | 15.7% |
| Standard Deviation (Sample) | 13.2% | 13.7% |
| Standard Deviation (Population) | 13.0% | 13.7% |
Demographics Similar to Comanche and Chippewa by 2 or more Vehicles in Household
In terms of 2 or more vehicles in household, the demographic groups most similar to Comanche are Hungarian (56.5%, a difference of 0.070%), Bulgarian (56.5%, a difference of 0.14%), Immigrants from the Azores (56.4%, a difference of 0.16%), Yugoslavian (56.6%, a difference of 0.17%), and Ute (56.6%, a difference of 0.21%). Similarly, the demographic groups most similar to Chippewa are Immigrants from Jordan (57.2%, a difference of 0.010%), Immigrants from Lebanon (57.2%, a difference of 0.050%), Iraqi (57.1%, a difference of 0.20%), Asian (57.0%, a difference of 0.37%), and Native/Alaskan (57.0%, a difference of 0.40%).
| Demographics | Rating | Rank | 2 or more Vehicles in Household |
| Immigrants | Lebanon | 96.8 /100 | #114 | Exceptional 57.2% |
| Chippewa | 96.6 /100 | #115 | Exceptional 57.2% |
| Immigrants | Jordan | 96.6 /100 | #116 | Exceptional 57.2% |
| Iraqis | 95.8 /100 | #117 | Exceptional 57.1% |
| Asians | 95.1 /100 | #118 | Exceptional 57.0% |
| Natives/Alaskans | 95.0 /100 | #119 | Exceptional 57.0% |
| Costa Ricans | 94.7 /100 | #120 | Exceptional 56.9% |
| Sioux | 93.8 /100 | #121 | Exceptional 56.8% |
| Immigrants | South Africa | 92.5 /100 | #122 | Exceptional 56.7% |
| Australians | 91.8 /100 | #123 | Exceptional 56.7% |
| New Zealanders | 91.8 /100 | #124 | Exceptional 56.7% |
| Tsimshian | 91.6 /100 | #125 | Exceptional 56.7% |
| Estonians | 90.9 /100 | #126 | Exceptional 56.6% |
| Immigrants | Thailand | 90.7 /100 | #127 | Exceptional 56.6% |
| Immigrants | South Central Asia | 90.5 /100 | #128 | Exceptional 56.6% |
| Ute | 90.4 /100 | #129 | Exceptional 56.6% |
| Yugoslavians | 90.0 /100 | #130 | Exceptional 56.6% |
| Bulgarians | 89.7 /100 | #131 | Excellent 56.5% |
| Hungarians | 89.1 /100 | #132 | Excellent 56.5% |
| Comanche | 88.4 /100 | #133 | Excellent 56.5% |
| Immigrants | Azores | 86.6 /100 | #134 | Excellent 56.4% |