Comanche vs Immigrants 2 or more Vehicles in Household
COMPARE
Comanche
Immigrants
2 or more Vehicles in Household
2 or more Vehicles in Household Comparison
Comanche
Immigrants
56.5%
2 OR MORE VEHICLES IN HOUSEHOLD
88.4/ 100
METRIC RATING
133rd/ 347
METRIC RANK
54.7%
2 OR MORE VEHICLES IN HOUSEHOLD
25.0/ 100
METRIC RATING
191st/ 347
METRIC RANK
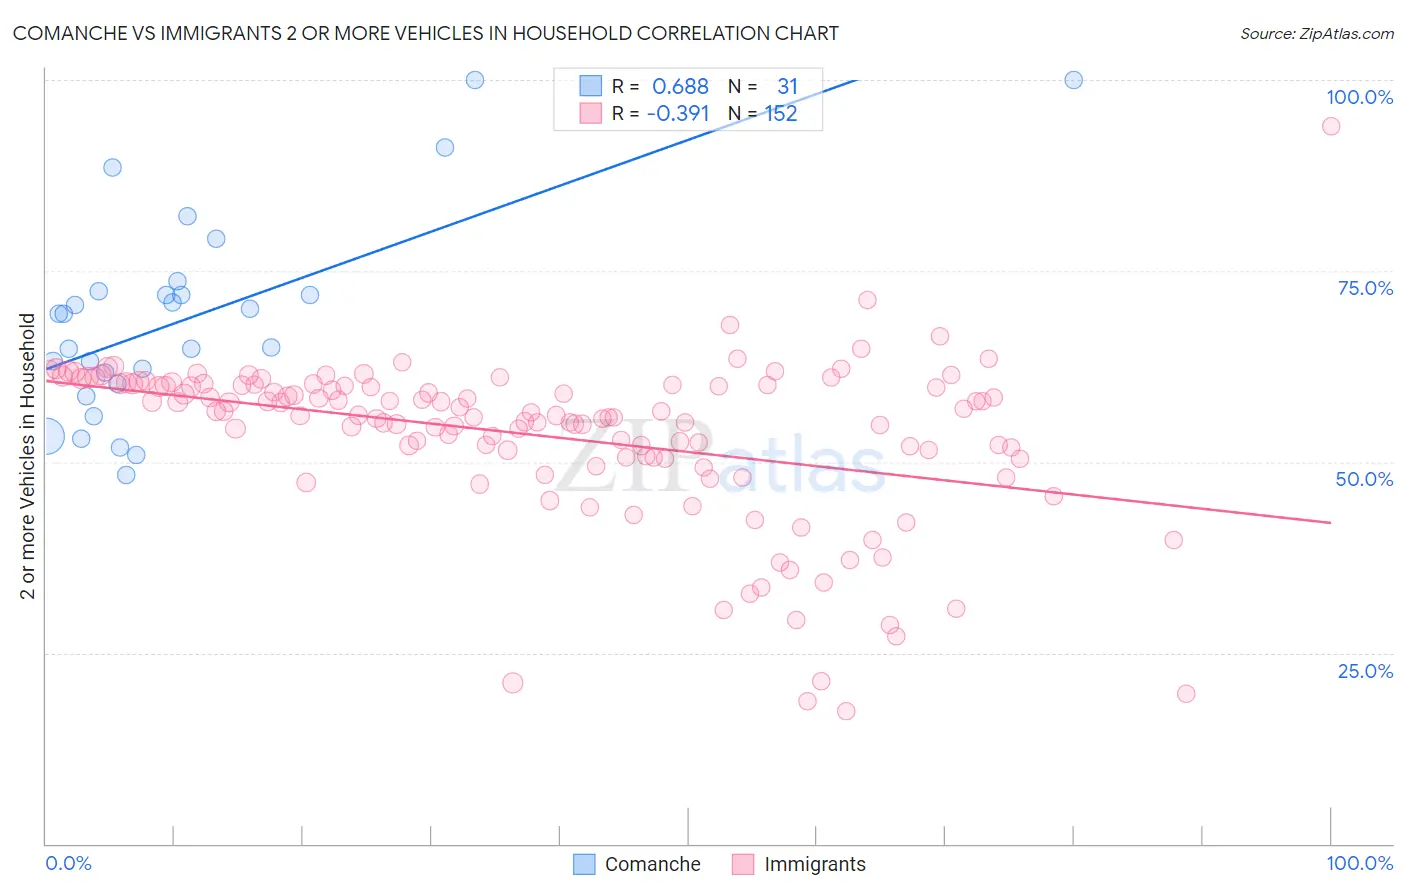
Comanche vs Immigrants 2 or more Vehicles in Household Correlation Chart
The statistical analysis conducted on geographies consisting of 109,768,112 people shows a significant positive correlation between the proportion of Comanche and percentage of households with 2 or more vehicles available in the United States with a correlation coefficient (R) of 0.688 and weighted average of 56.5%. Similarly, the statistical analysis conducted on geographies consisting of 577,129,923 people shows a mild negative correlation between the proportion of Immigrants and percentage of households with 2 or more vehicles available in the United States with a correlation coefficient (R) of -0.391 and weighted average of 54.7%, a difference of 3.1%.
2 or more Vehicles in Household Correlation Summary
| Measurement | Comanche | Immigrants |
| Minimum | 48.2% | 17.3% |
| Maximum | 100.0% | 94.0% |
| Range | 51.8% | 76.6% |
| Mean | 68.7% | 53.4% |
| Median | 69.4% | 56.3% |
| Interquartile 25% (IQ1) | 60.3% | 50.6% |
| Interquartile 75% (IQ3) | 72.4% | 60.1% |
| Interquartile Range (IQR) | 12.1% | 9.5% |
| Standard Deviation (Sample) | 13.2% | 10.9% |
| Standard Deviation (Population) | 13.0% | 10.9% |
Similar Demographics by 2 or more Vehicles in Household
Demographics Similar to Comanche by 2 or more Vehicles in Household
In terms of 2 or more vehicles in household, the demographic groups most similar to Comanche are Hungarian (56.5%, a difference of 0.070%), Bulgarian (56.5%, a difference of 0.14%), Immigrants from the Azores (56.4%, a difference of 0.16%), Blackfeet (56.4%, a difference of 0.16%), and Yugoslavian (56.6%, a difference of 0.17%).
| Demographics | Rating | Rank | 2 or more Vehicles in Household |
| Estonians | 90.9 /100 | #126 | Exceptional 56.6% |
| Immigrants | Thailand | 90.7 /100 | #127 | Exceptional 56.6% |
| Immigrants | South Central Asia | 90.5 /100 | #128 | Exceptional 56.6% |
| Ute | 90.4 /100 | #129 | Exceptional 56.6% |
| Yugoslavians | 90.0 /100 | #130 | Exceptional 56.6% |
| Bulgarians | 89.7 /100 | #131 | Excellent 56.5% |
| Hungarians | 89.1 /100 | #132 | Excellent 56.5% |
| Comanche | 88.4 /100 | #133 | Excellent 56.5% |
| Immigrants | Azores | 86.6 /100 | #134 | Excellent 56.4% |
| Blackfeet | 86.5 /100 | #135 | Excellent 56.4% |
| Immigrants | Asia | 86.0 /100 | #136 | Excellent 56.3% |
| Cubans | 84.8 /100 | #137 | Excellent 56.3% |
| Salvadorans | 84.7 /100 | #138 | Excellent 56.3% |
| Armenians | 84.3 /100 | #139 | Excellent 56.3% |
| Latvians | 83.6 /100 | #140 | Excellent 56.2% |
Demographics Similar to Immigrants by 2 or more Vehicles in Household
In terms of 2 or more vehicles in household, the demographic groups most similar to Immigrants are Immigrants from Romania (54.7%, a difference of 0.060%), Russian (54.8%, a difference of 0.070%), Immigrants from Japan (54.7%, a difference of 0.090%), Central American (54.7%, a difference of 0.11%), and Eastern European (54.8%, a difference of 0.13%).
| Demographics | Rating | Rank | 2 or more Vehicles in Household |
| Apache | 36.7 /100 | #184 | Fair 55.1% |
| Arabs | 35.9 /100 | #185 | Fair 55.0% |
| Peruvians | 33.7 /100 | #186 | Fair 55.0% |
| Immigrants | Uganda | 33.4 /100 | #187 | Fair 55.0% |
| Marshallese | 30.5 /100 | #188 | Fair 54.9% |
| Eastern Europeans | 27.5 /100 | #189 | Fair 54.8% |
| Russians | 26.3 /100 | #190 | Fair 54.8% |
| Immigrants | Immigrants | 25.0 /100 | #191 | Fair 54.7% |
| Immigrants | Romania | 23.8 /100 | #192 | Fair 54.7% |
| Immigrants | Japan | 23.4 /100 | #193 | Fair 54.7% |
| Central Americans | 23.0 /100 | #194 | Fair 54.7% |
| Iroquois | 22.6 /100 | #195 | Fair 54.7% |
| Immigrants | Poland | 19.3 /100 | #196 | Poor 54.6% |
| Argentineans | 17.5 /100 | #197 | Poor 54.5% |
| Carpatho Rusyns | 16.2 /100 | #198 | Poor 54.4% |