Zip Codes with the Most Immigrants from Southern Europe in El Paso, TX

RELATED REPORTS & OPTIONS

Southern Europe
Population
Families and Households
Female Fertility
Female Fertility (Unmarried)
Race (Community Size)
Race (Percentage)
Ancestry (Community Size)
AfghanAfricanAmericanApacheArabArgentineanArmenianAustrianBarbadianBasqueBelgianBelizeanBhutaneseBlackfeetBolivianBrazilianBritishBurmeseCajunCanadianCentral AmericanCentral American IndianCherokeeCheyenneChickasawChileanChippewaChoctawColombianComancheCosta RicanCreeCreekCroatianCubanCzechCzechoslovakianDanishDominicanDutchEastern EuropeanEcuadorianEgyptianEnglishEthiopianEuropeanFilipinoFinnishFrenchFrench CanadianGermanGerman RussianGhanaianGreekGuamanian / ChamorroGuatemalanHaitianHonduranHopiHungarianIndian (Asian)IndonesianInupiatIranianIrishIroquoisItalianJamaicanJapaneseJordanianKoreanLaotianLebaneseLithuanianLumbeeLuxembourgerMexicanMexican American IndianMongolianMoroccanNative HawaiianNavajoNicaraguanNigerianNorthern EuropeanNorwegianOttawaPakistaniPanamanianPeruvianPimaPolishPortuguesePotawatomiPuebloPuerto RicanRomanianRussianSalvadoranSamoanScandinavianScotch-IrishScottishSenegaleseSiouxSlovakSloveneSouth AmericanSpaniardSpanishSpanish AmericanSpanish American IndianSri LankanSubsaharan AfricanSwedishSwissSyrianThaiTohono O'OdhamTonganTurkishUkrainianVenezuelanWelshWest IndianYaquiYugoslavian
Ancestry (Percentage)
AfghanAfricanAmericanApacheArabArgentineanArmenianAustrianBarbadianBasqueBelgianBelizeanBhutaneseBlackfeetBolivianBrazilianBritishBurmeseCajunCanadianCentral AmericanCentral American IndianCherokeeCheyenneChickasawChileanChippewaChoctawColombianComancheCosta RicanCreeCreekCroatianCubanCzechCzechoslovakianDanishDominicanDutchEastern EuropeanEcuadorianEgyptianEnglishEthiopianEuropeanFilipinoFinnishFrenchFrench CanadianGermanGerman RussianGhanaianGreekGuamanian / ChamorroGuatemalanHaitianHonduranHopiHungarianIndian (Asian)IndonesianInupiatIranianIrishIroquoisItalianJamaicanJapaneseJordanianKoreanLaotianLebaneseLithuanianLumbeeLuxembourgerMexicanMexican American IndianMongolianMoroccanNative HawaiianNavajoNicaraguanNigerianNorthern EuropeanNorwegianOttawaPakistaniPanamanianPeruvianPimaPolishPortuguesePotawatomiPuebloPuerto RicanRomanianRussianSalvadoranSamoanScandinavianScotch-IrishScottishSenegaleseSiouxSlovakSloveneSouth AmericanSpaniardSpanishSpanish AmericanSpanish American IndianSri LankanSubsaharan AfricanSwedishSwissSyrianThaiTohono O'OdhamTonganTurkishUkrainianVenezuelanWelshWest IndianYaquiYugoslavian
Immigrant Origin (Total)
Immigrant Origin (Percentage)
Income
Income (Families)
Income (Households)
Poverty
Poverty (Families)
Unemployment
Employment Occupations
Employment Industries
Employer Class
Commute Time
Commute Means
School Enrollment
Education by Degree Field
Occupancy
Finances
Physical Characteristics
El Paso
Compare Zip Codes
Comparison Subject

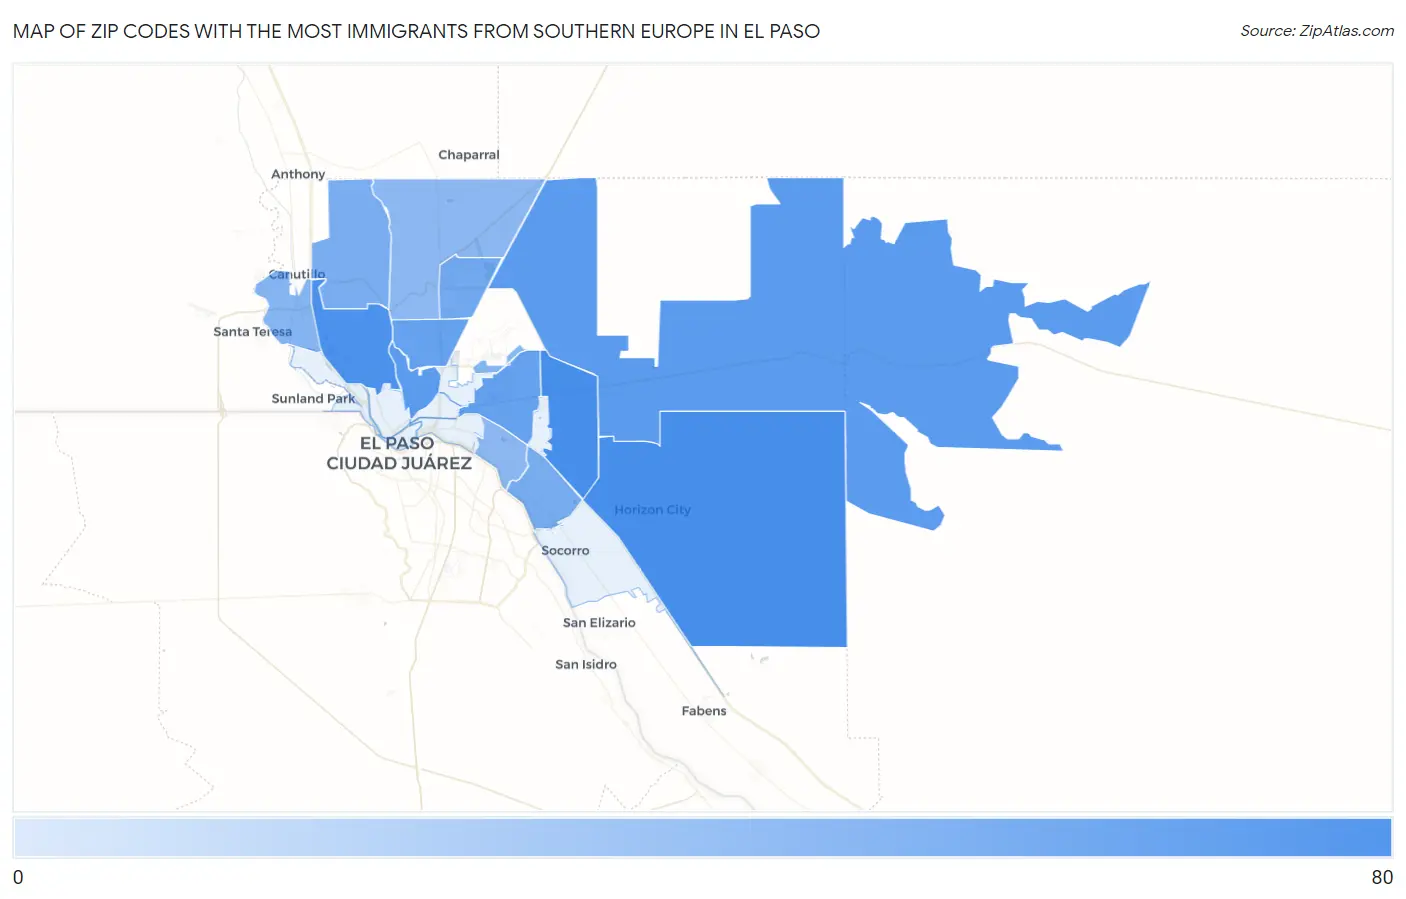
Map of Zip Codes with the Most Immigrants from Southern Europe in El Paso

0
80
Zip Codes with the Most Immigrants from Southern Europe in El Paso Map

Zip Codes with the Most Immigrants from Southern Europe in El Paso, TX

Zip Code Southern Europe vs State vs National
1.799286822,897(0.30%)#100728,588(0.01%)#2,613
2.799366622,897(0.29%)#103728,588(0.01%)#2,675
3.799126022,897(0.26%)#113728,588(0.01%)#2,877
4.799303822,897(0.17%)#176728,588(0.01%)#3,945
5.799383722,897(0.16%)#180728,588(0.01%)#3,982
6.799252922,897(0.13%)#213728,588(0.00%)#4,555
7.799042822,897(0.12%)#219728,588(0.00%)#4,657
8.799241922,897(0.08%)#275728,588(0.00%)#5,503
9.799071722,897(0.07%)#287728,588(0.00%)#5,748
10.799111522,897(0.07%)#310728,588(0.00%)#6,102
11.799321122,897(0.05%)#354728,588(0.00%)#6,639
12.799081022,897(0.04%)#371728,588(0.00%)#6,940
13.79915922,897(0.04%)#376728,588(0.00%)#6,998
14.79934922,897(0.04%)#382728,588(0.00%)#7,017

Common Questions

What are the Top 10 Zip Codes with the Most Immigrants from Southern Europe in El Paso, TX?
Top 10 Zip Codes with the Most Immigrants from Southern Europe in El Paso, TX are:
#1
68
#2
66
#3
60
#4
38
#5
37
#6
29
#7
28
#8
19
#9
17
#10
15
What zip code has the Most Immigrants from Southern Europe in El Paso, TX?
79928 has the Most Immigrants from Southern Europe in El Paso, TX with 68.
What is the Total Immigrants from Southern Europe in El Paso, TX?
Total Immigrants from Southern Europe in El Paso is 333.
What is the Total Immigrants from Southern Europe in Texas?
Total Immigrants from Southern Europe in Texas is 22,897.
What is the Total Immigrants from Southern Europe in the United States?
Total Immigrants from Southern Europe in the United States is 728,588.