Zip Codes with the Highest Percentage of Population Taking Taxi / Cab to Work in El Paso, TX
RELATED REPORTS & OPTIONS
Taxi / Cab
El Paso
Compare Zip Codes
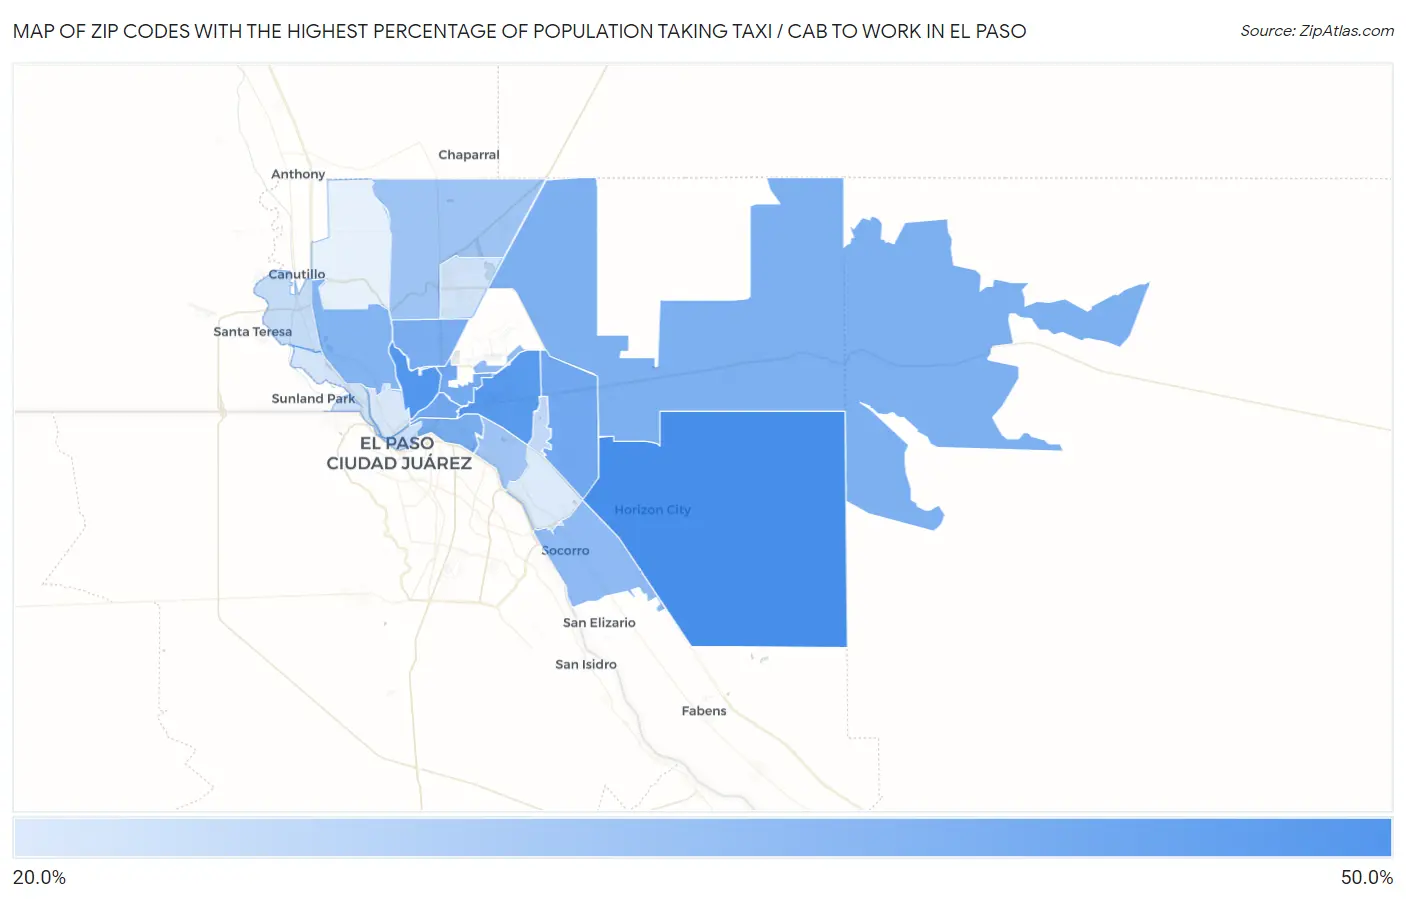
Map of Zip Codes with the Highest Percentage of Population Taking Taxi / Cab to Work in El Paso
24.9%
49.3%
Zip Codes with the Highest Percentage of Population Taking Taxi / Cab to Work in El Paso, TX
| Zip Code | % Take Taxi / Cab | vs State | vs National | |
| 1. | 79928 | 49.3% | 36.9%(+12.4)#178 | 38.2%(+11.1)#3,159 |
| 2. | 79930 | 47.2% | 36.9%(+10.3)#225 | 38.2%(+9.00)#3,911 |
| 3. | 79925 | 46.4% | 36.9%(+9.50)#239 | 38.2%(+8.20)#4,163 |
| 4. | 79936 | 42.2% | 36.9%(+5.30)#334 | 38.2%(+4.00)#5,646 |
| 5. | 79903 | 42.0% | 36.9%(+5.10)#346 | 38.2%(+3.80)#5,736 |
| 6. | 79906 | 41.8% | 36.9%(+4.90)#353 | 38.2%(+3.60)#5,822 |
| 7. | 79905 | 40.9% | 36.9%(+4.00)#377 | 38.2%(+2.70)#6,201 |
| 8. | 79904 | 40.4% | 36.9%(+3.50)#397 | 38.2%(+2.20)#6,421 |
| 9. | 79938 | 40.0% | 36.9%(+3.10)#406 | 38.2%(+1.80)#6,600 |
| 10. | 79912 | 39.2% | 36.9%(+2.30)#433 | 38.2%(+1.00)#6,966 |
| 11. | 79927 | 37.0% | 36.9%(+0.100)#496 | 38.2%(-1.20)#7,935 |
| 12. | 79908 | 36.9% | 36.9%(=0.000)#500 | 38.2%(-1.30)#8,012 |
| 13. | 79934 | 34.4% | 36.9%(-2.50)#566 | 38.2%(-3.80)#9,181 |
| 14. | 79915 | 34.1% | 36.9%(-2.80)#578 | 38.2%(-4.10)#9,306 |
| 15. | 79935 | 29.4% | 36.9%(-7.50)#701 | 38.2%(-8.80)#11,154 |
| 16. | 79932 | 28.4% | 36.9%(-8.50)#728 | 38.2%(-9.80)#11,456 |
| 17. | 79901 | 27.3% | 36.9%(-9.60)#750 | 38.2%(-10.9)#11,760 |
| 18. | 79922 | 26.8% | 36.9%(-10.1)#764 | 38.2%(-11.4)#11,879 |
| 19. | 79924 | 26.6% | 36.9%(-10.3)#767 | 38.2%(-11.6)#11,924 |
| 20. | 79902 | 25.7% | 36.9%(-11.2)#789 | 38.2%(-12.5)#12,097 |
| 21. | 79907 | 24.9% | 36.9%(-12.0)#807 | 38.2%(-13.3)#12,233 |
1
Common Questions
What are the Top 10 Zip Codes with the Highest Percentage of Population Taking Taxi / Cab to Work in El Paso, TX?
Top 10 Zip Codes with the Highest Percentage of Population Taking Taxi / Cab to Work in El Paso, TX are:
What zip code has the Highest Percentage of Population Taking Taxi / Cab to Work in El Paso, TX?
79928 has the Highest Percentage of Population Taking Taxi / Cab to Work in El Paso, TX with 49.3%.
What is the Percentage of Population Taking Taxi / Cab to Work in El Paso, TX?
Percentage of Population Taking Taxi / Cab to Work in El Paso is 33.5%.
What is the Percentage of Population Taking Taxi / Cab to Work in Texas?
Percentage of Population Taking Taxi / Cab to Work in Texas is 36.9%.
What is the Percentage of Population Taking Taxi / Cab to Work in the United States?
Percentage of Population Taking Taxi / Cab to Work in the United States is 38.2%.