Zip Codes with the Highest Percentage of Households with Income Above $100,000 in El Paso, TX
RELATED REPORTS & OPTIONS
Household Income | $100k+
El Paso
Compare Zip Codes
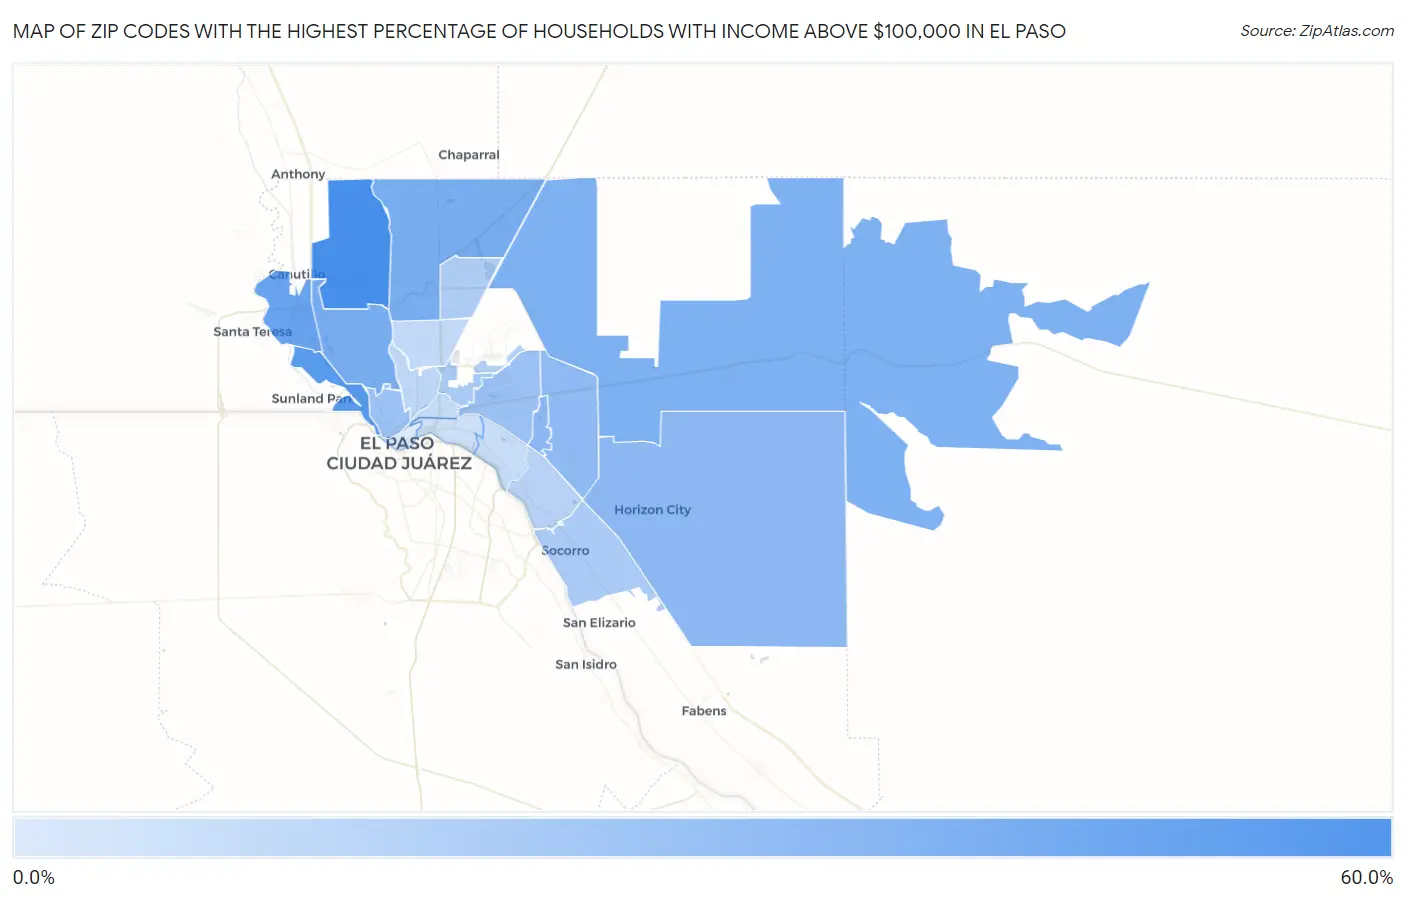
Map of Zip Codes with the Highest Percentage of Households with Income Above $100,000 in El Paso
2.5%
55.1%
Zip Codes with the Highest Percentage of Households with Income Above $100,000 in El Paso, TX
| Zip Code | Households with Income > $100k | vs State | vs National | |
| 1. | 79911 | 55.1% | 36.2%(+18.9)#174 | 37.3%(+17.8)#3,435 |
| 2. | 79922 | 48.5% | 36.2%(+12.3)#273 | 37.3%(+11.2)#5,325 |
| 3. | 79932 | 41.6% | 36.2%(+5.40)#441 | 37.3%(+4.30)#8,072 |
| 4. | 79934 | 35.9% | 36.2%(-0.300)#620 | 37.3%(-1.40)#11,191 |
| 5. | 79912 | 35.7% | 36.2%(-0.500)#631 | 37.3%(-1.60)#11,314 |
| 6. | 79938 | 32.8% | 36.2%(-3.40)#748 | 37.3%(-4.50)#13,252 |
| 7. | 79935 | 28.4% | 36.2%(-7.80)#946 | 37.3%(-8.90)#16,782 |
| 8. | 79928 | 28.2% | 36.2%(-8.00)#959 | 37.3%(-9.10)#16,929 |
| 9. | 79936 | 27.6% | 36.2%(-8.60)#989 | 37.3%(-9.70)#17,450 |
| 10. | 79925 | 23.6% | 36.2%(-12.6)#1,202 | 37.3%(-13.7)#21,006 |
| 11. | 79902 | 22.8% | 36.2%(-13.4)#1,254 | 37.3%(-14.5)#21,735 |
| 12. | 79906 | 18.7% | 36.2%(-17.5)#1,454 | 37.3%(-18.6)#25,057 |
| 13. | 79927 | 18.3% | 36.2%(-17.9)#1,467 | 37.3%(-19.0)#25,328 |
| 14. | 79924 | 16.3% | 36.2%(-19.9)#1,566 | 37.3%(-21.0)#26,698 |
| 15. | 79908 | 15.2% | 36.2%(-21.0)#1,611 | 37.3%(-22.1)#27,421 |
| 16. | 79907 | 13.7% | 36.2%(-22.5)#1,661 | 37.3%(-23.6)#28,247 |
| 17. | 79930 | 11.8% | 36.2%(-24.4)#1,707 | 37.3%(-25.5)#29,105 |
| 18. | 79904 | 11.0% | 36.2%(-25.2)#1,721 | 37.3%(-26.3)#29,447 |
| 19. | 79903 | 9.2% | 36.2%(-27.0)#1,758 | 37.3%(-28.1)#30,084 |
| 20. | 79915 | 8.3% | 36.2%(-27.9)#1,775 | 37.3%(-29.0)#30,343 |
| 21. | 79905 | 6.9% | 36.2%(-29.3)#1,789 | 37.3%(-30.4)#30,679 |
| 22. | 79901 | 2.5% | 36.2%(-33.7)#1,816 | 37.3%(-34.8)#31,383 |
1
Common Questions
What are the Top 10 Zip Codes with the Highest Percentage of Households with Income Above $100,000 in El Paso, TX?
Top 10 Zip Codes with the Highest Percentage of Households with Income Above $100,000 in El Paso, TX are:
What zip code has the Highest Percentage of Households with Income Above $100,000 in El Paso, TX?
79911 has the Highest Percentage of Households with Income Above $100,000 in El Paso, TX with 55.1%.
What is the Percentage of Households with Income Above $100,000 in El Paso, TX?
Percentage of Households with Income Above $100,000 in El Paso is 24.4%.
What is the Percentage of Households with Income Above $100,000 in Texas?
Percentage of Households with Income Above $100,000 in Texas is 36.2%.
What is the Percentage of Households with Income Above $100,000 in the United States?
Percentage of Households with Income Above $100,000 in the United States is 37.3%.