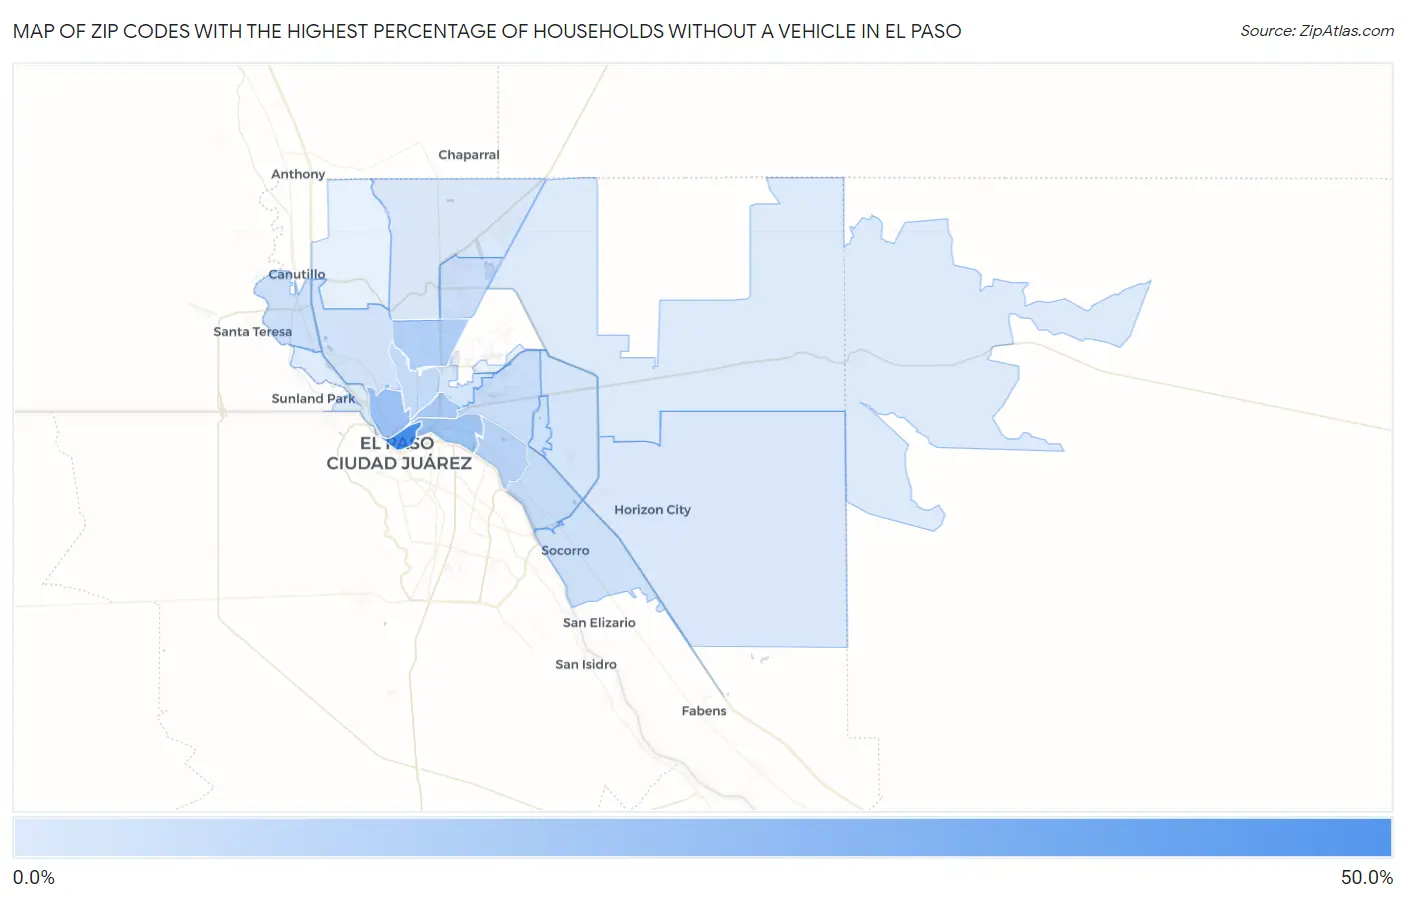
Zip Codes with the Highest Percentage of Households Without a Vehicle in El Paso, TX
RELATED REPORTS & OPTIONS
Households without a Cars
El Paso
Compare Zip Codes
Map of Zip Codes with the Highest Percentage of Households Without a Vehicle in El Paso
1.5%
44.8%

Zip Codes with the Highest Percentage of Households Without a Vehicle in El Paso, TX
| Zip Code | Housholds Without a Car | vs State | vs National | |
| 1. | 79901 | 44.8% | 5.3%(+39.5)#5 | 8.3%(+36.5)#404 |
| 2. | 79902 | 18.3% | 5.3%(+13.0)#44 | 8.3%(+10.00)#1,736 |
| 3. | 79905 | 17.5% | 5.3%(+12.2)#55 | 8.3%(+9.20)#1,860 |
| 4. | 79903 | 15.7% | 5.3%(+10.4)#73 | 8.3%(+7.40)#2,216 |
| 5. | 79904 | 12.9% | 5.3%(+7.60)#122 | 8.3%(+4.60)#3,132 |
| 6. | 79915 | 10.7% | 5.3%(+5.40)#196 | 8.3%(+2.40)#4,304 |
| 7. | 79930 | 8.0% | 5.3%(+2.70)#340 | 8.3%(-0.300)#6,921 |
| 8. | 79907 | 7.3% | 5.3%(+2.00)#390 | 8.3%(-1.00)#8,017 |
| 9. | 79925 | 6.5% | 5.3%(+1.20)#469 | 8.3%(-1.80)#9,366 |
| 10. | 79924 | 6.2% | 5.3%(+0.900)#501 | 8.3%(-2.10)#9,968 |
| 11. | 79932 | 5.3% | 5.3%(=0.000)#617 | 8.3%(-3.00)#12,100 |
| 12. | 79935 | 5.0% | 5.3%(-0.300)#666 | 8.3%(-3.30)#12,891 |
| 13. | 79927 | 4.7% | 5.3%(-0.600)#720 | 8.3%(-3.60)#13,630 |
| 14. | 79912 | 4.5% | 5.3%(-0.800)#755 | 8.3%(-3.80)#14,161 |
| 15. | 79906 | 3.6% | 5.3%(-1.70)#941 | 8.3%(-4.70)#17,109 |
| 16. | 79936 | 3.5% | 5.3%(-1.80)#946 | 8.3%(-4.80)#17,277 |
| 17. | 79934 | 2.4% | 5.3%(-2.90)#1,192 | 8.3%(-5.90)#21,059 |
| 18. | 79928 | 1.8% | 5.3%(-3.50)#1,320 | 8.3%(-6.50)#23,087 |
| 19. | 79922 | 1.6% | 5.3%(-3.70)#1,368 | 8.3%(-6.70)#23,843 |
| 20. | 79938 | 1.5% | 5.3%(-3.80)#1,378 | 8.3%(-6.80)#24,073 |
1
Common Questions
What are the Top 10 Zip Codes with the Highest Percentage of Households Without a Vehicle in El Paso, TX?
Top 10 Zip Codes with the Highest Percentage of Households Without a Vehicle in El Paso, TX are:
What zip code has the Highest Percentage of Households Without a Vehicle in El Paso, TX?
79901 has the Highest Percentage of Households Without a Vehicle in El Paso, TX with 44.8%.
What is the Percentage of Households Without a Vehicle in El Paso, TX?
Percentage of Households Without a Vehicle in El Paso is 7.2%.
What is the Percentage of Households Without a Vehicle in Texas?
Percentage of Households Without a Vehicle in Texas is 5.3%.
What is the Percentage of Households Without a Vehicle in the United States?
Percentage of Households Without a Vehicle in the United States is 8.3%.