Zip Codes with the Highest Percentage of Population Employed in Arts, Media & Entertainment in El Paso, TX
RELATED REPORTS & OPTIONS
Arts, Media & Entertainment
El Paso
Compare Zip Codes
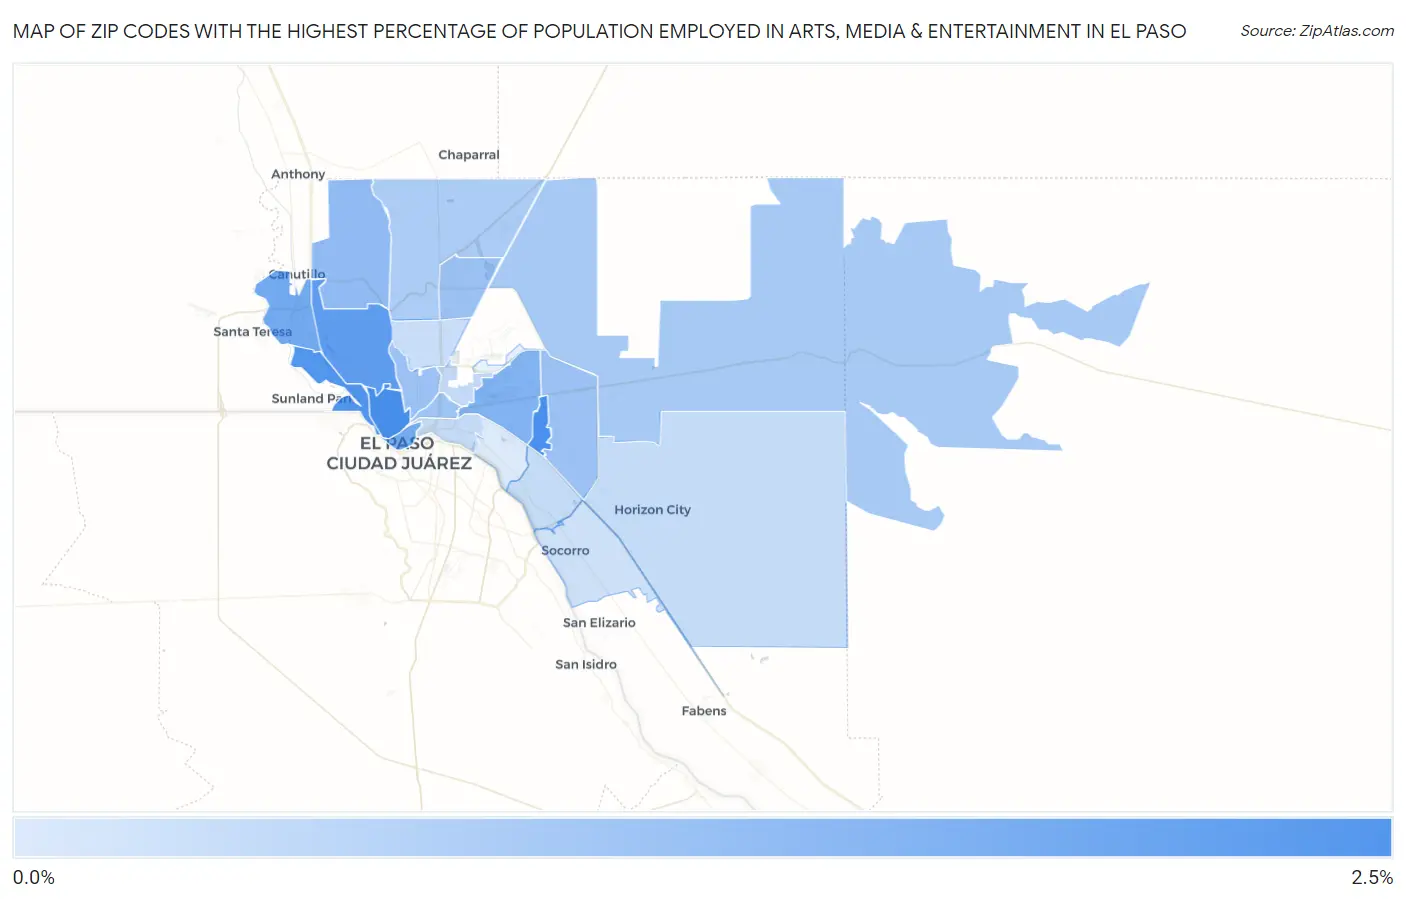
Map of Zip Codes with the Highest Percentage of Population Employed in Arts, Media & Entertainment in El Paso
0.21%
2.3%
Zip Codes with the Highest Percentage of Population Employed in Arts, Media & Entertainment in El Paso, TX
| Zip Code | % Employed | vs State | vs National | |
| 1. | 79902 | 2.3% | 1.7%(+0.669)#277 | 2.1%(+0.264)#6,271 |
| 2. | 79935 | 2.3% | 1.7%(+0.631)#290 | 2.1%(+0.226)#6,431 |
| 3. | 79922 | 2.2% | 1.7%(+0.507)#323 | 2.1%(+0.102)#6,986 |
| 4. | 79912 | 2.0% | 1.7%(+0.335)#360 | 2.1%(-0.070)#7,858 |
| 5. | 79932 | 1.7% | 1.7%(+0.047)#469 | 2.1%(-0.358)#9,593 |
| 6. | 79901 | 1.7% | 1.7%(+0.011)#486 | 2.1%(-0.394)#9,869 |
| 7. | 79925 | 1.5% | 1.7%(-0.137)#562 | 2.1%(-0.542)#10,855 |
| 8. | 79911 | 1.3% | 1.7%(-0.371)#661 | 2.1%(-0.776)#12,575 |
| 9. | 79930 | 1.1% | 1.7%(-0.529)#737 | 2.1%(-0.934)#13,771 |
| 10. | 79936 | 1.1% | 1.7%(-0.535)#742 | 2.1%(-0.940)#13,821 |
| 11. | 79924 | 1.1% | 1.7%(-0.549)#750 | 2.1%(-0.954)#13,951 |
| 12. | 79903 | 1.1% | 1.7%(-0.579)#762 | 2.1%(-0.984)#14,181 |
| 13. | 79938 | 0.96% | 1.7%(-0.694)#827 | 2.1%(-1.10)#15,123 |
| 14. | 79934 | 0.88% | 1.7%(-0.774)#875 | 2.1%(-1.18)#15,805 |
| 15. | 79906 | 0.58% | 1.7%(-1.07)#1,022 | 2.1%(-1.48)#18,175 |
| 16. | 79905 | 0.57% | 1.7%(-1.08)#1,027 | 2.1%(-1.49)#18,271 |
| 17. | 79907 | 0.54% | 1.7%(-1.11)#1,045 | 2.1%(-1.52)#18,510 |
| 18. | 79928 | 0.54% | 1.7%(-1.12)#1,046 | 2.1%(-1.52)#18,545 |
| 19. | 79904 | 0.51% | 1.7%(-1.14)#1,058 | 2.1%(-1.55)#18,745 |
| 20. | 79927 | 0.42% | 1.7%(-1.24)#1,104 | 2.1%(-1.64)#19,523 |
| 21. | 79915 | 0.21% | 1.7%(-1.44)#1,196 | 2.1%(-1.85)#20,888 |
1
Common Questions
What are the Top 10 Zip Codes with the Highest Percentage of Population Employed in Arts, Media & Entertainment in El Paso, TX?
Top 10 Zip Codes with the Highest Percentage of Population Employed in Arts, Media & Entertainment in El Paso, TX are:
What zip code has the Highest Percentage of Population Employed in Arts, Media & Entertainment in El Paso, TX?
79902 has the Highest Percentage of Population Employed in Arts, Media & Entertainment in El Paso, TX with 2.3%.
What is the Percentage of Population Employed in Arts, Media & Entertainment in El Paso, TX?
Percentage of Population Employed in Arts, Media & Entertainment in El Paso is 1.2%.
What is the Percentage of Population Employed in Arts, Media & Entertainment in Texas?
Percentage of Population Employed in Arts, Media & Entertainment in Texas is 1.7%.
What is the Percentage of Population Employed in Arts, Media & Entertainment in the United States?
Percentage of Population Employed in Arts, Media & Entertainment in the United States is 2.1%.