Zip Codes with the Highest Percentage of Hawaiian / Pacific Population in El Paso, TX
RELATED REPORTS & OPTIONS
Hawaiian / Pacific
El Paso
Compare Zip Codes
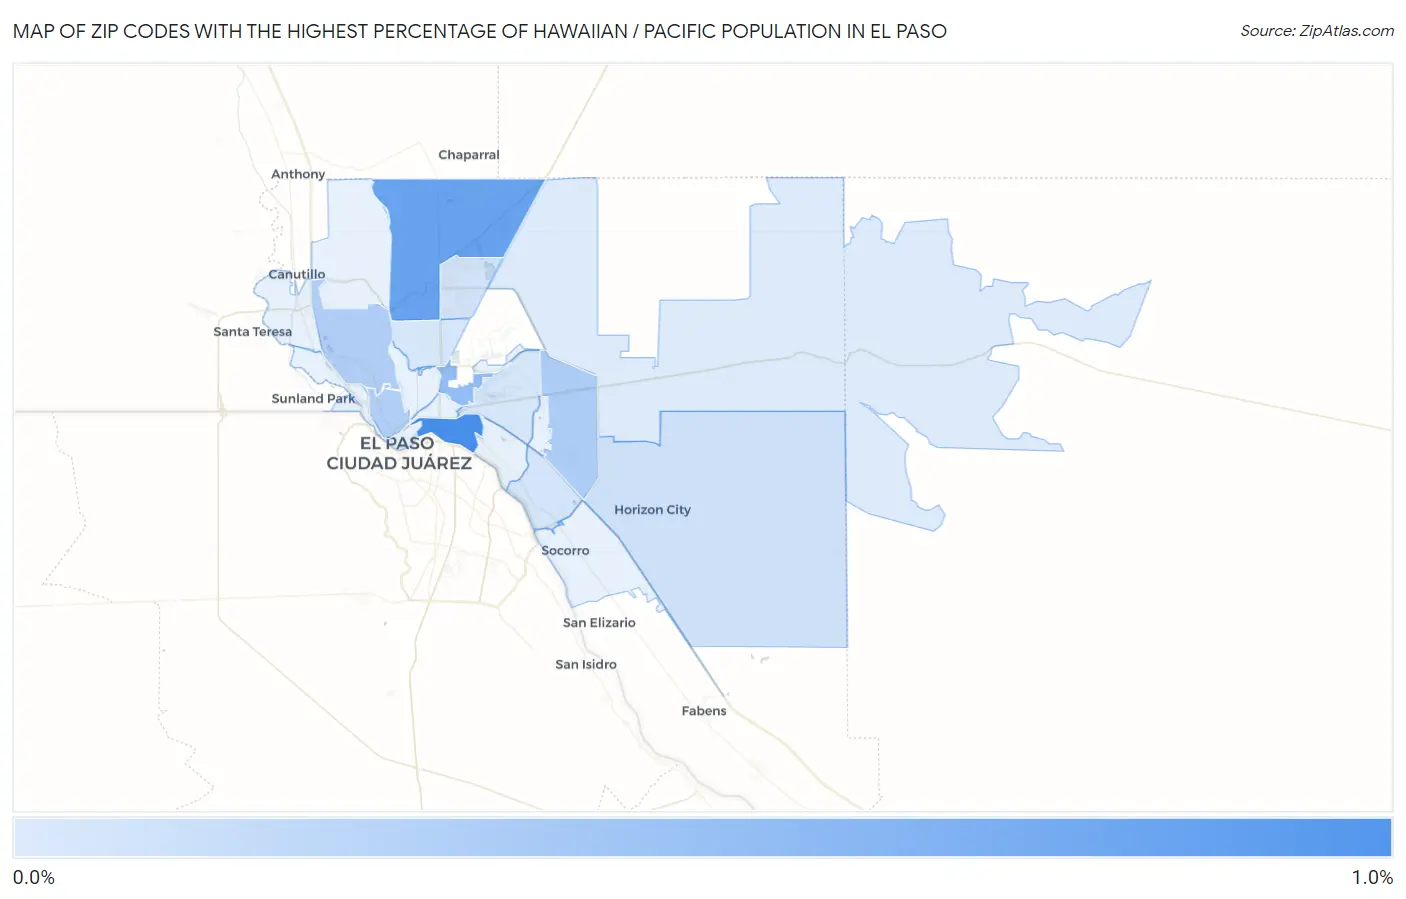
Map of Zip Codes with the Highest Percentage of Hawaiian / Pacific Population in El Paso
0.029%
0.92%
Zip Codes with the Highest Percentage of Hawaiian / Pacific Population in El Paso, TX
| Zip Code | Hawaiian / Pacific | vs State | vs National | |
| 1. | 79905 | 0.92% | 0.094%(+0.824)#37 | 0.19%(+0.728)#791 |
| 2. | 79934 | 0.73% | 0.094%(+0.635)#46 | 0.19%(+0.540)#1,015 |
| 3. | 79906 | 0.47% | 0.094%(+0.375)#81 | 0.19%(+0.280)#1,503 |
| 4. | 79936 | 0.31% | 0.094%(+0.221)#112 | 0.19%(+0.126)#2,046 |
| 5. | 79912 | 0.30% | 0.094%(+0.202)#121 | 0.19%(+0.107)#2,155 |
| 6. | 79902 | 0.29% | 0.094%(+0.200)#122 | 0.19%(+0.104)#2,163 |
| 7. | 79928 | 0.10% | 0.094%(+0.011)#255 | 0.19%(-0.084)#3,956 |
| 8. | 79924 | 0.10% | 0.094%(+0.010)#258 | 0.19%(-0.085)#3,967 |
| 9. | 79907 | 0.077% | 0.094%(-0.016)#295 | 0.19%(-0.111)#4,469 |
| 10. | 79904 | 0.073% | 0.094%(-0.021)#301 | 0.19%(-0.116)#4,574 |
| 11. | 79925 | 0.072% | 0.094%(-0.021)#304 | 0.19%(-0.116)#4,584 |
| 12. | 79938 | 0.029% | 0.094%(-0.064)#399 | 0.19%(-0.159)#5,673 |
1
Common Questions
What are the Top 10 Zip Codes with the Highest Percentage of Hawaiian / Pacific Population in El Paso, TX?
Top 10 Zip Codes with the Highest Percentage of Hawaiian / Pacific Population in El Paso, TX are:
What zip code has the Highest Percentage of Hawaiian / Pacific Population in El Paso, TX?
79905 has the Highest Percentage of Hawaiian / Pacific Population in El Paso, TX with 0.92%.
What is the Percentage of Hawaiian / Pacific Population in El Paso, TX?
Percentage of Hawaiian / Pacific Population in El Paso is 0.18%.
What is the Percentage of Hawaiian / Pacific Population in Texas?
Percentage of Hawaiian / Pacific Population in Texas is 0.094%.
What is the Percentage of Hawaiian / Pacific Population in the United States?
Percentage of Hawaiian / Pacific Population in the United States is 0.19%.