Zip Codes with the Highest Percentage of Guamanian / Chamorro Population in El Paso, TX
RELATED REPORTS & OPTIONS
Guamanian / Chamorro
El Paso
Compare Zip Codes
Map of Zip Codes with the Highest Percentage of Guamanian / Chamorro Population in El Paso
0.029%
0.65%
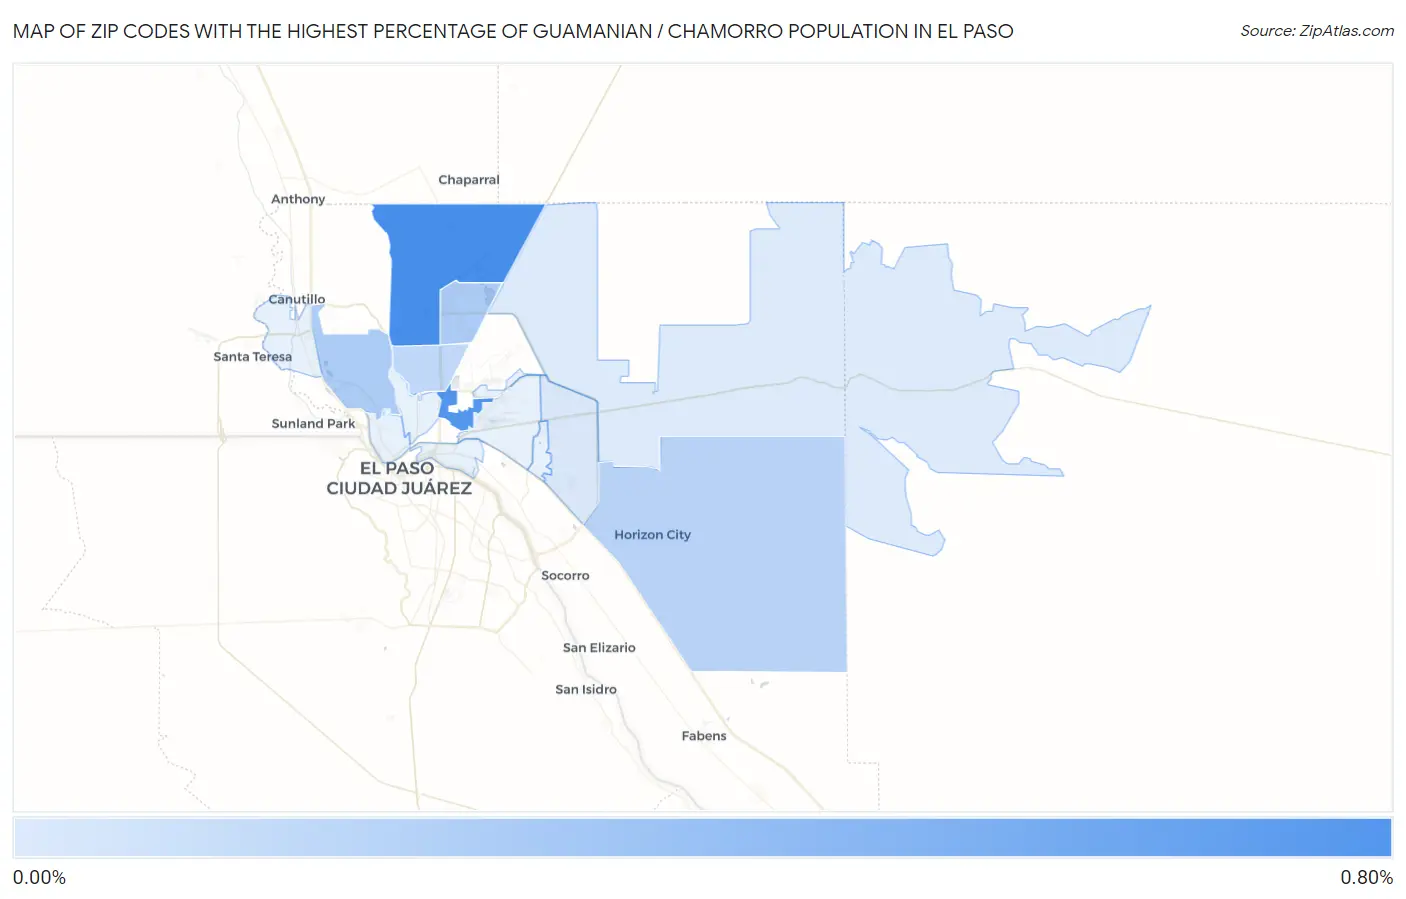
Zip Codes with the Highest Percentage of Guamanian / Chamorro Population in El Paso, TX
| Zip Code | Guamanian / Chamorro | vs State | vs National | |
| 1. | 79934 | 0.65% | 0.051% (+0.595)#22 | 0.047% (+0.600)#298 |
| 2. | 79906 | 0.60% | 0.051% (+0.552)#27 | 0.047% (+0.556)#334 |
| 3. | 79912 | 0.23% | 0.051% (+0.179)#76 | 0.047% (+0.184)#914 |
| 4. | 79924 | 0.23% | 0.051% (+0.177)#77 | 0.047% (+0.181)#923 |
| 5. | 79928 | 0.18% | 0.051% (+0.128)#95 | 0.047% (+0.132)#1,148 |
| 6. | 79904 | 0.15% | 0.051% (+0.101)#106 | 0.047% (+0.105)#1,285 |
| 7. | 79936 | 0.048% | 0.051% (-0.002)#194 | 0.047% (+0.002)#2,273 |
| 8. | 79938 | 0.029% | 0.051% (-0.021)#223 | 0.047% (-0.017)#2,635 |
1
Common Questions
What are the Top 10 Zip Codes with the Highest Percentage of Guamanian / Chamorro Population in El Paso, TX?
Top 10 Zip Codes with the Highest Percentage of Guamanian / Chamorro Population in El Paso, TX are:
What zip code has the Highest Percentage of Guamanian / Chamorro Population in El Paso, TX?
79934 has the Highest Percentage of Guamanian / Chamorro Population in El Paso, TX with 0.65%.
What is the Percentage of Guamanian / Chamorro Population in El Paso, TX?
Percentage of Guamanian / Chamorro Population in El Paso is 0.089%.
What is the Percentage of Guamanian / Chamorro Population in Texas?
Percentage of Guamanian / Chamorro Population in Texas is 0.051%.
What is the Percentage of Guamanian / Chamorro Population in the United States?
Percentage of Guamanian / Chamorro Population in the United States is 0.047%.