Zip Codes with the Fewest Births per 1,000 Women Below Poverty Level in El Paso, TX
RELATED REPORTS & OPTIONS
Lowest Birth Rate | Below Poverty
El Paso
Compare Zip Codes
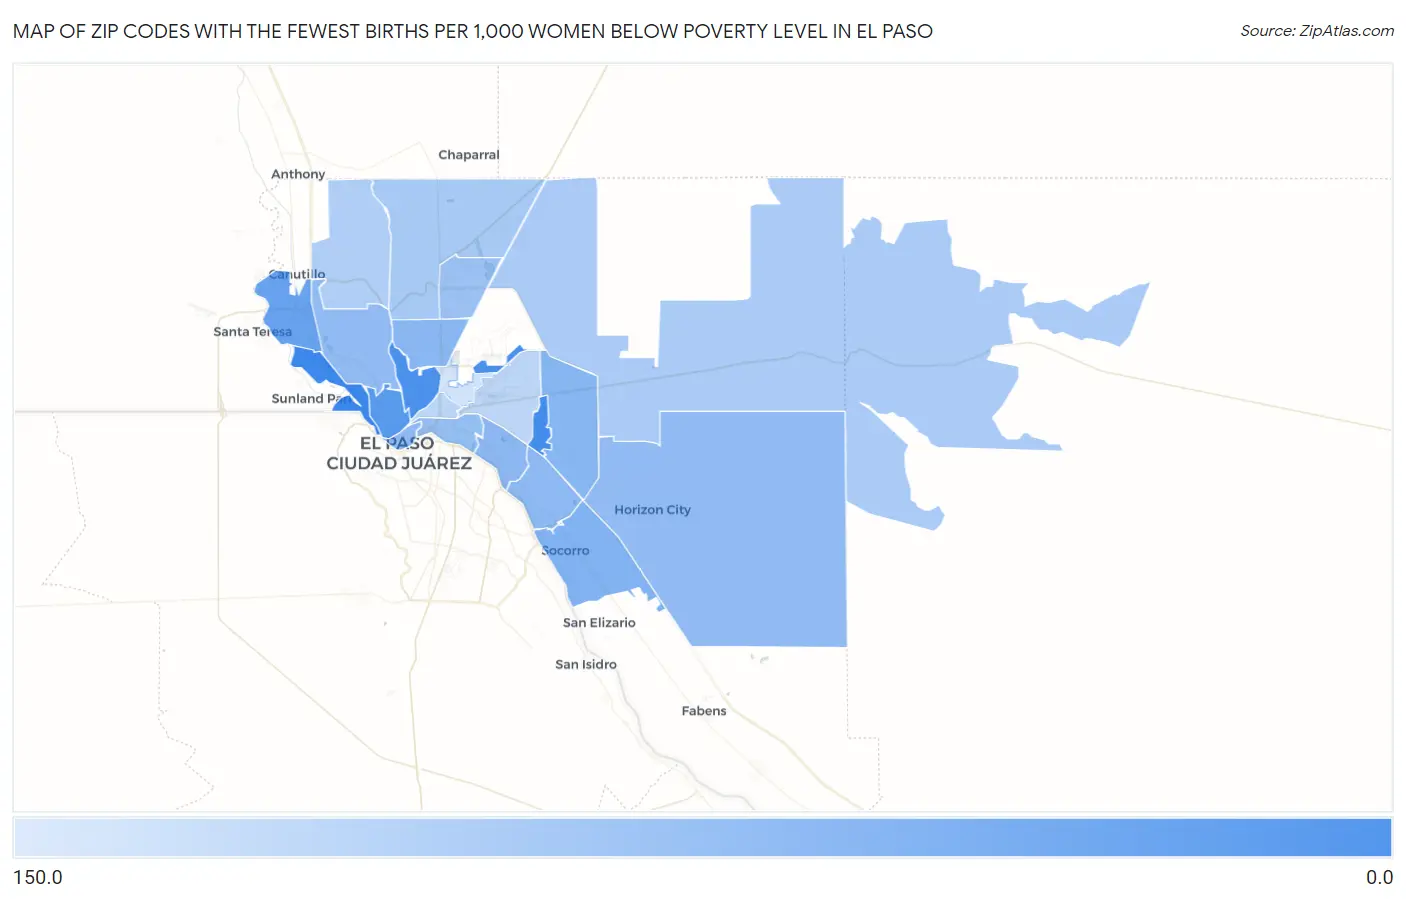
Map of Zip Codes with the Fewest Births per 1,000 Women Below Poverty Level in El Paso
132.0
23.0
Zip Codes with the Fewest Births per 1,000 Women Below Poverty Level in El Paso, TX
| Zip Code | Births / 1,000 Women | vs State | vs National | |
| 1. | 79922 | 23.0 | 57.0(-34.0)#141 | 53.0(-30.0)#3,013 |
| 2. | 79935 | 26.0 | 57.0(-31.0)#173 | 53.0(-27.0)#3,723 |
| 3. | 79930 | 28.0 | 57.0(-29.0)#200 | 53.0(-25.0)#4,242 |
| 4. | 79908 | 28.0 | 57.0(-29.0)#213 | 53.0(-25.0)#4,339 |
| 5. | 79902 | 33.0 | 57.0(-24.0)#267 | 53.0(-20.0)#5,701 |
| 6. | 79932 | 39.0 | 57.0(-18.0)#385 | 53.0(-14.0)#7,658 |
| 7. | 79927 | 52.0 | 57.0(-5.00)#659 | 53.0(-1.000)#12,197 |
| 8. | 79936 | 57.0 | 57.0(=0.000)#754 | 53.0(+4.00)#13,741 |
| 9. | 79904 | 58.0 | 57.0(+1.000)#787 | 53.0(+5.00)#14,125 |
| 10. | 79915 | 60.0 | 57.0(+3.00)#842 | 53.0(+7.00)#14,704 |
| 11. | 79907 | 61.0 | 57.0(+4.00)#860 | 53.0(+8.00)#14,968 |
| 12. | 79928 | 63.0 | 57.0(+6.00)#903 | 53.0(+10.00)#15,485 |
| 13. | 79912 | 63.0 | 57.0(+6.00)#904 | 53.0(+10.00)#15,487 |
| 14. | 79901 | 63.0 | 57.0(+6.00)#920 | 53.0(+10.00)#15,657 |
| 15. | 79905 | 66.0 | 57.0(+9.00)#965 | 53.0(+13.0)#16,416 |
| 16. | 79924 | 72.0 | 57.0(+15.0)#1,038 | 53.0(+19.0)#17,698 |
| 17. | 79934 | 81.0 | 57.0(+24.0)#1,148 | 53.0(+28.0)#19,345 |
| 18. | 79938 | 84.0 | 57.0(+27.0)#1,165 | 53.0(+31.0)#19,765 |
| 19. | 79911 | 90.0 | 57.0(+33.0)#1,209 | 53.0(+37.0)#20,531 |
| 20. | 79903 | 100.0 | 57.0(+43.0)#1,268 | 53.0(+47.0)#21,435 |
| 21. | 79925 | 105.0 | 57.0(+48.0)#1,293 | 53.0(+52.0)#21,813 |
| 22. | 79906 | 132.0 | 57.0(+75.0)#1,388 | 53.0(+79.0)#23,171 |
1
Common Questions
What are the Top 10 Zip Codes with the Fewest Births per 1,000 Women Below Poverty Level in El Paso, TX?
Top 10 Zip Codes with the Fewest Births per 1,000 Women Below Poverty Level in El Paso, TX are:
What zip code has the Fewest Births per 1,000 Women Below Poverty Level in El Paso, TX?
79922 has the Fewest Births per 1,000 Women Below Poverty Level in El Paso, TX with 23.0.
What is the Number of Births per 1,000 Women Below Poverty Level in El Paso, TX?
Number of Births per 1,000 Women Below Poverty Level in El Paso is 63.0.
What is the Number of Births per 1,000 Women Below Poverty Level in Texas?
Number of Births per 1,000 Women Below Poverty Level in Texas is 57.0.
What is the Number of Births per 1,000 Women Below Poverty Level in the United States?
Number of Births per 1,000 Women Below Poverty Level in the United States is 53.0.