Zip Codes with the Highest Percentage of Not-for-profit Organizations in El Paso, TX

RELATED REPORTS & OPTIONS

Not-for-profit Organizations
Population
Families and Households
Female Fertility
Female Fertility (Unmarried)
Race (Community Size)
Race (Percentage)
Ancestry (Community Size)
AfghanAfricanAmericanApacheArabArgentineanArmenianAustrianBarbadianBasqueBelgianBelizeanBhutaneseBlackfeetBolivianBrazilianBritishBurmeseCajunCanadianCentral AmericanCentral American IndianCherokeeCheyenneChickasawChileanChippewaChoctawColombianComancheCosta RicanCreeCreekCroatianCubanCzechCzechoslovakianDanishDominicanDutchEastern EuropeanEcuadorianEgyptianEnglishEthiopianEuropeanFilipinoFinnishFrenchFrench CanadianGermanGerman RussianGhanaianGreekGuamanian / ChamorroGuatemalanHaitianHonduranHopiHungarianIndian (Asian)IndonesianInupiatIranianIrishIroquoisItalianJamaicanJapaneseJordanianKoreanLaotianLebaneseLithuanianLumbeeLuxembourgerMexicanMexican American IndianMongolianMoroccanNative HawaiianNavajoNicaraguanNigerianNorthern EuropeanNorwegianOttawaPakistaniPanamanianPeruvianPimaPolishPortuguesePotawatomiPuebloPuerto RicanRomanianRussianSalvadoranSamoanScandinavianScotch-IrishScottishSenegaleseSiouxSlovakSloveneSouth AmericanSpaniardSpanishSpanish AmericanSpanish American IndianSri LankanSubsaharan AfricanSwedishSwissSyrianThaiTohono O'OdhamTonganTurkishUkrainianVenezuelanWelshWest IndianYaquiYugoslavian
Ancestry (Percentage)
AfghanAfricanAmericanApacheArabArgentineanArmenianAustrianBarbadianBasqueBelgianBelizeanBhutaneseBlackfeetBolivianBrazilianBritishBurmeseCajunCanadianCentral AmericanCentral American IndianCherokeeCheyenneChickasawChileanChippewaChoctawColombianComancheCosta RicanCreeCreekCroatianCubanCzechCzechoslovakianDanishDominicanDutchEastern EuropeanEcuadorianEgyptianEnglishEthiopianEuropeanFilipinoFinnishFrenchFrench CanadianGermanGerman RussianGhanaianGreekGuamanian / ChamorroGuatemalanHaitianHonduranHopiHungarianIndian (Asian)IndonesianInupiatIranianIrishIroquoisItalianJamaicanJapaneseJordanianKoreanLaotianLebaneseLithuanianLumbeeLuxembourgerMexicanMexican American IndianMongolianMoroccanNative HawaiianNavajoNicaraguanNigerianNorthern EuropeanNorwegianOttawaPakistaniPanamanianPeruvianPimaPolishPortuguesePotawatomiPuebloPuerto RicanRomanianRussianSalvadoranSamoanScandinavianScotch-IrishScottishSenegaleseSiouxSlovakSloveneSouth AmericanSpaniardSpanishSpanish AmericanSpanish American IndianSri LankanSubsaharan AfricanSwedishSwissSyrianThaiTohono O'OdhamTonganTurkishUkrainianVenezuelanWelshWest IndianYaquiYugoslavian
Immigrant Origin (Total)
Immigrant Origin (Percentage)
Income
Income (Families)
Income (Households)
Poverty
Poverty (Families)
Unemployment
Employment Occupations
Employment Industries
Employer Class
Commute Time
Commute Means
School Enrollment
Education by Degree Field
Occupancy
Finances
Physical Characteristics
El Paso
Compare Zip Codes
Comparison Subject

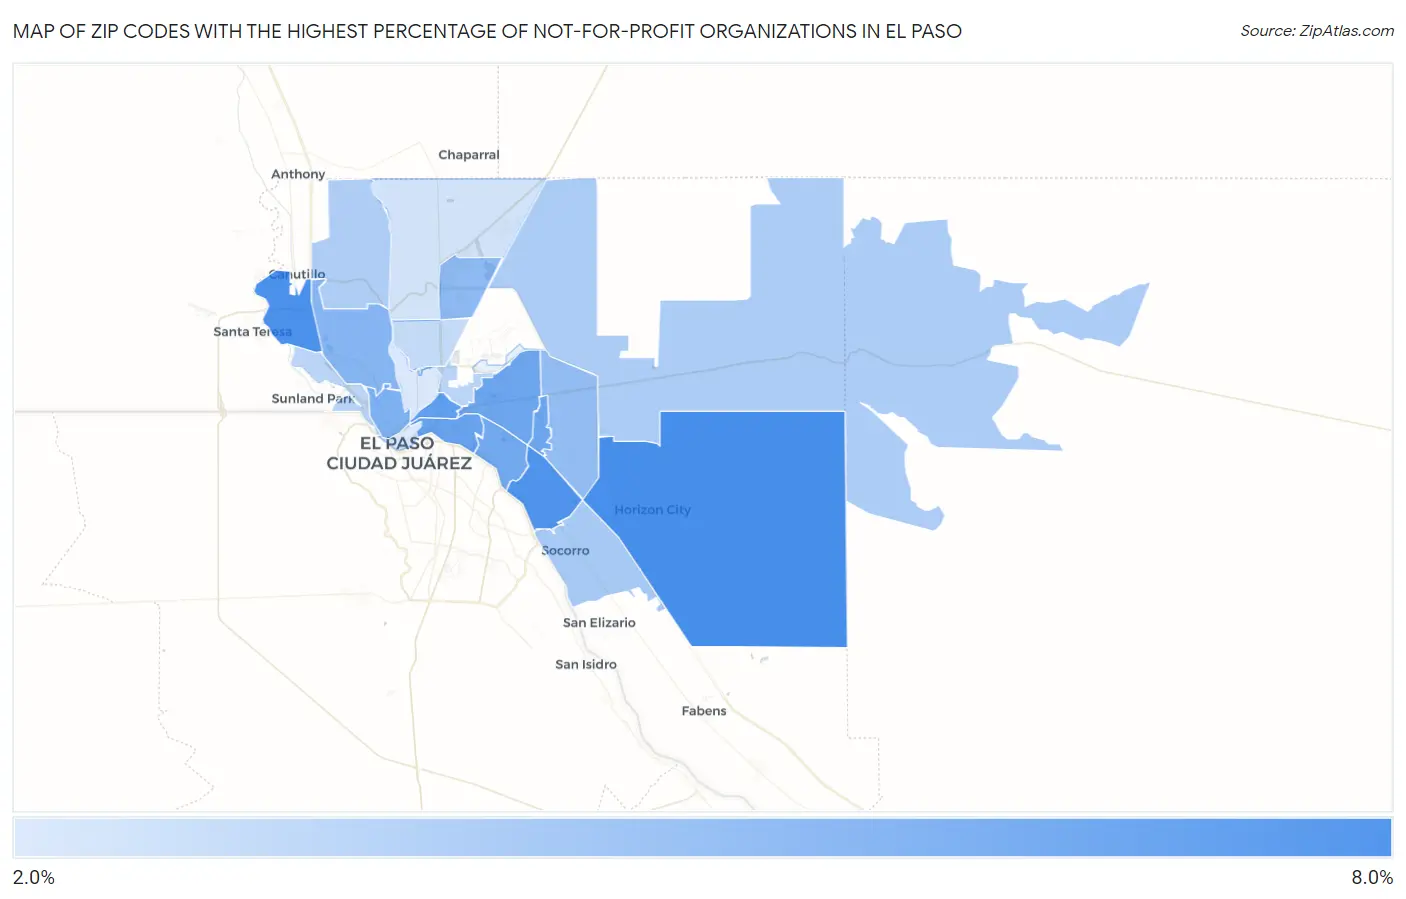
Map of Zip Codes with the Highest Percentage of Not-for-profit Organizations in El Paso

0.0%
8.0%
Zip Codes with the Highest Percentage of Not-for-profit Organizations in El Paso Map

Zip Codes with the Highest Percentage of Not-for-profit Organizations in El Paso, TX

Zip Code % Employed in Not-for-profit vs State vs National
1.799287.4%5.8%(+1.67)#3888.4%(-1.01)#15,282
2.799327.3%5.8%(+1.57)#4128.4%(-1.12)#15,601
3.799077.1%5.8%(+1.39)#4478.4%(-1.30)#16,132
4.799036.7%5.8%(+0.906)#5278.4%(-1.78)#17,583
5.799056.5%5.8%(+0.714)#5588.4%(-1.97)#18,102
6.799256.2%5.8%(+0.488)#6108.4%(-2.20)#18,785
7.799356.2%5.8%(+0.467)#6148.4%(-2.22)#18,830
8.799156.1%5.8%(+0.357)#6328.4%(-2.33)#19,129
9.799025.8%5.8%(+0.014)#6958.4%(-2.67)#20,125
10.799125.6%5.8%(-0.173)#7428.4%(-2.86)#20,696
11.799245.3%5.8%(-0.441)#8108.4%(-3.13)#21,456
12.799365.2%5.8%(-0.576)#8438.4%(-3.26)#21,850
13.799274.5%5.8%(-1.23)#9938.4%(-3.91)#23,472
14.799384.4%5.8%(-1.34)#1,0278.4%(-4.03)#23,758
15.799114.4%5.8%(-1.40)#1,0438.4%(-4.08)#23,881
16.799064.0%5.8%(-1.76)#1,1478.4%(-4.45)#24,700
17.799224.0%5.8%(-1.76)#1,1498.4%(-4.45)#24,703
18.799043.7%5.8%(-2.01)#1,2048.4%(-4.70)#25,246
19.799343.3%5.8%(-2.45)#1,3048.4%(-5.13)#26,087
20.799303.0%5.8%(-2.74)#1,3548.4%(-5.42)#26,593
21.799013.0%5.8%(-2.77)#1,3608.4%(-5.46)#26,644

Common Questions

What are the Top 10 Zip Codes with the Highest Percentage of Not-for-profit Organizations in El Paso, TX?
Top 10 Zip Codes with the Highest Percentage of Not-for-profit Organizations in El Paso, TX are:
#1
7.4%
#2
7.3%
#3
7.1%
#4
6.7%
#5
6.5%
#6
6.2%
#7
6.2%
#8
6.1%
#9
5.8%
#10
5.6%
What zip code has the Highest Percentage of Not-for-profit Organizations in El Paso, TX?
79928 has the Highest Percentage of Not-for-profit Organizations in El Paso, TX with 7.4%.
What is the Percentage of Not-for-profit Organizations in El Paso, TX?
Percentage of Not-for-profit Organizations in El Paso is 5.4%.
What is the Percentage of Not-for-profit Organizations in Texas?
Percentage of Not-for-profit Organizations in Texas is 5.8%.
What is the Percentage of Not-for-profit Organizations in the United States?
Percentage of Not-for-profit Organizations in the United States is 8.4%.