Zip Codes with the Highest Percentage of Self-Employed / Incorporated in El Paso, TX

RELATED REPORTS & OPTIONS

Self-Employed / Incorporated
Population
Families and Households
Female Fertility
Female Fertility (Unmarried)
Race (Community Size)
Race (Percentage)
Ancestry (Community Size)
AfghanAfricanAmericanApacheArabArgentineanArmenianAustrianBarbadianBasqueBelgianBelizeanBhutaneseBlackfeetBolivianBrazilianBritishBurmeseCajunCanadianCentral AmericanCentral American IndianCherokeeCheyenneChickasawChileanChippewaChoctawColombianComancheCosta RicanCreeCreekCroatianCubanCzechCzechoslovakianDanishDominicanDutchEastern EuropeanEcuadorianEgyptianEnglishEthiopianEuropeanFilipinoFinnishFrenchFrench CanadianGermanGerman RussianGhanaianGreekGuamanian / ChamorroGuatemalanHaitianHonduranHopiHungarianIndian (Asian)IndonesianInupiatIranianIrishIroquoisItalianJamaicanJapaneseJordanianKoreanLaotianLebaneseLithuanianLumbeeLuxembourgerMexicanMexican American IndianMongolianMoroccanNative HawaiianNavajoNicaraguanNigerianNorthern EuropeanNorwegianOttawaPakistaniPanamanianPeruvianPimaPolishPortuguesePotawatomiPuebloPuerto RicanRomanianRussianSalvadoranSamoanScandinavianScotch-IrishScottishSenegaleseSiouxSlovakSloveneSouth AmericanSpaniardSpanishSpanish AmericanSpanish American IndianSri LankanSubsaharan AfricanSwedishSwissSyrianThaiTohono O'OdhamTonganTurkishUkrainianVenezuelanWelshWest IndianYaquiYugoslavian
Ancestry (Percentage)
AfghanAfricanAmericanApacheArabArgentineanArmenianAustrianBarbadianBasqueBelgianBelizeanBhutaneseBlackfeetBolivianBrazilianBritishBurmeseCajunCanadianCentral AmericanCentral American IndianCherokeeCheyenneChickasawChileanChippewaChoctawColombianComancheCosta RicanCreeCreekCroatianCubanCzechCzechoslovakianDanishDominicanDutchEastern EuropeanEcuadorianEgyptianEnglishEthiopianEuropeanFilipinoFinnishFrenchFrench CanadianGermanGerman RussianGhanaianGreekGuamanian / ChamorroGuatemalanHaitianHonduranHopiHungarianIndian (Asian)IndonesianInupiatIranianIrishIroquoisItalianJamaicanJapaneseJordanianKoreanLaotianLebaneseLithuanianLumbeeLuxembourgerMexicanMexican American IndianMongolianMoroccanNative HawaiianNavajoNicaraguanNigerianNorthern EuropeanNorwegianOttawaPakistaniPanamanianPeruvianPimaPolishPortuguesePotawatomiPuebloPuerto RicanRomanianRussianSalvadoranSamoanScandinavianScotch-IrishScottishSenegaleseSiouxSlovakSloveneSouth AmericanSpaniardSpanishSpanish AmericanSpanish American IndianSri LankanSubsaharan AfricanSwedishSwissSyrianThaiTohono O'OdhamTonganTurkishUkrainianVenezuelanWelshWest IndianYaquiYugoslavian
Immigrant Origin (Total)
Immigrant Origin (Percentage)
Income
Income (Families)
Income (Households)
Poverty
Poverty (Families)
Unemployment
Employment Occupations
Employment Industries
Employer Class
Commute Time
Commute Means
School Enrollment
Education by Degree Field
Occupancy
Finances
Physical Characteristics
El Paso
Compare Zip Codes
Comparison Subject

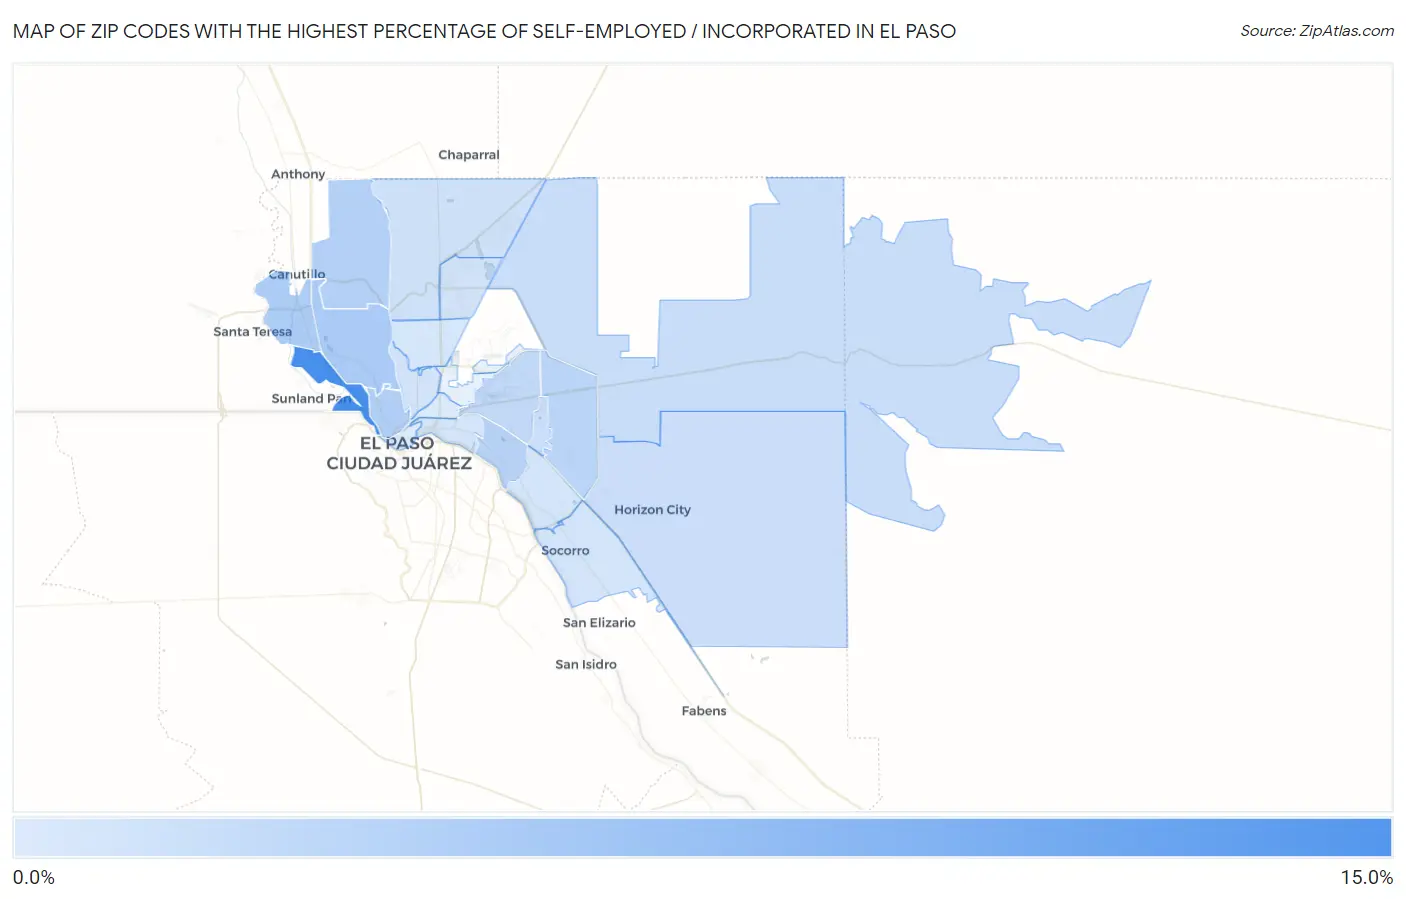
Map of Zip Codes with the Highest Percentage of Self-Employed / Incorporated in El Paso

0.0%
15.0%
Zip Codes with the Highest Percentage of Self-Employed / Incorporated in El Paso Map

Zip Codes with the Highest Percentage of Self-Employed / Incorporated in El Paso, TX

Zip Code % Self-Employed / Incorporated vs State vs National
1.7992212.5%3.4%(+9.14)#503.8%(+8.69)#1,435
2.799124.6%3.4%(+1.22)#4313.8%(+0.770)#9,814
3.799324.4%3.4%(+0.991)#4763.8%(+0.542)#10,591
4.799024.1%3.4%(+0.684)#5373.8%(+0.235)#11,719
5.799113.7%3.4%(+0.339)#6113.8%(-0.110)#13,151
6.799153.5%3.4%(+0.082)#6793.8%(-0.367)#14,247
7.799363.3%3.4%(-0.040)#7123.8%(-0.489)#14,826
8.799252.8%3.4%(-0.617)#9003.8%(-1.07)#17,611
9.799382.3%3.4%(-1.10)#1,0543.8%(-1.55)#20,009
10.799282.1%3.4%(-1.27)#1,1113.8%(-1.72)#20,874
11.799351.9%3.4%(-1.43)#1,1643.8%(-1.88)#21,673
12.799341.7%3.4%(-1.68)#1,2343.8%(-2.13)#22,724
13.799241.6%3.4%(-1.81)#1,2853.8%(-2.26)#23,266
14.799301.4%3.4%(-1.93)#1,3223.8%(-2.38)#23,699
15.799271.4%3.4%(-1.98)#1,3403.8%(-2.42)#23,908
16.799071.3%3.4%(-2.03)#1,3523.8%(-2.48)#24,109
17.799051.3%3.4%(-2.11)#1,3743.8%(-2.56)#24,410
18.799041.2%3.4%(-2.19)#1,3933.8%(-2.64)#24,718
19.799010.65%3.4%(-2.72)#1,5013.8%(-3.17)#26,197
20.799030.62%3.4%(-2.74)#1,5053.8%(-3.19)#26,243

Common Questions

What are the Top 10 Zip Codes with the Highest Percentage of Self-Employed / Incorporated in El Paso, TX?
Top 10 Zip Codes with the Highest Percentage of Self-Employed / Incorporated in El Paso, TX are:
#1
12.5%
#2
4.6%
#3
4.4%
#4
4.1%
#5
3.7%
#6
3.5%
#7
3.3%
#8
2.8%
#9
2.3%
#10
2.1%
What zip code has the Highest Percentage of Self-Employed / Incorporated in El Paso, TX?
79922 has the Highest Percentage of Self-Employed / Incorporated in El Paso, TX with 12.5%.
What is the Percentage of Self-Employed / Incorporated in El Paso, TX?
Percentage of Self-Employed / Incorporated in El Paso is 2.7%.
What is the Percentage of Self-Employed / Incorporated in Texas?
Percentage of Self-Employed / Incorporated in Texas is 3.4%.
What is the Percentage of Self-Employed / Incorporated in the United States?
Percentage of Self-Employed / Incorporated in the United States is 3.8%.