Zip Codes with the Highest Percentage of Population Employed in Legal Services & Support in El Paso, TX
RELATED REPORTS & OPTIONS
Legal Services & Support
El Paso
Compare Zip Codes
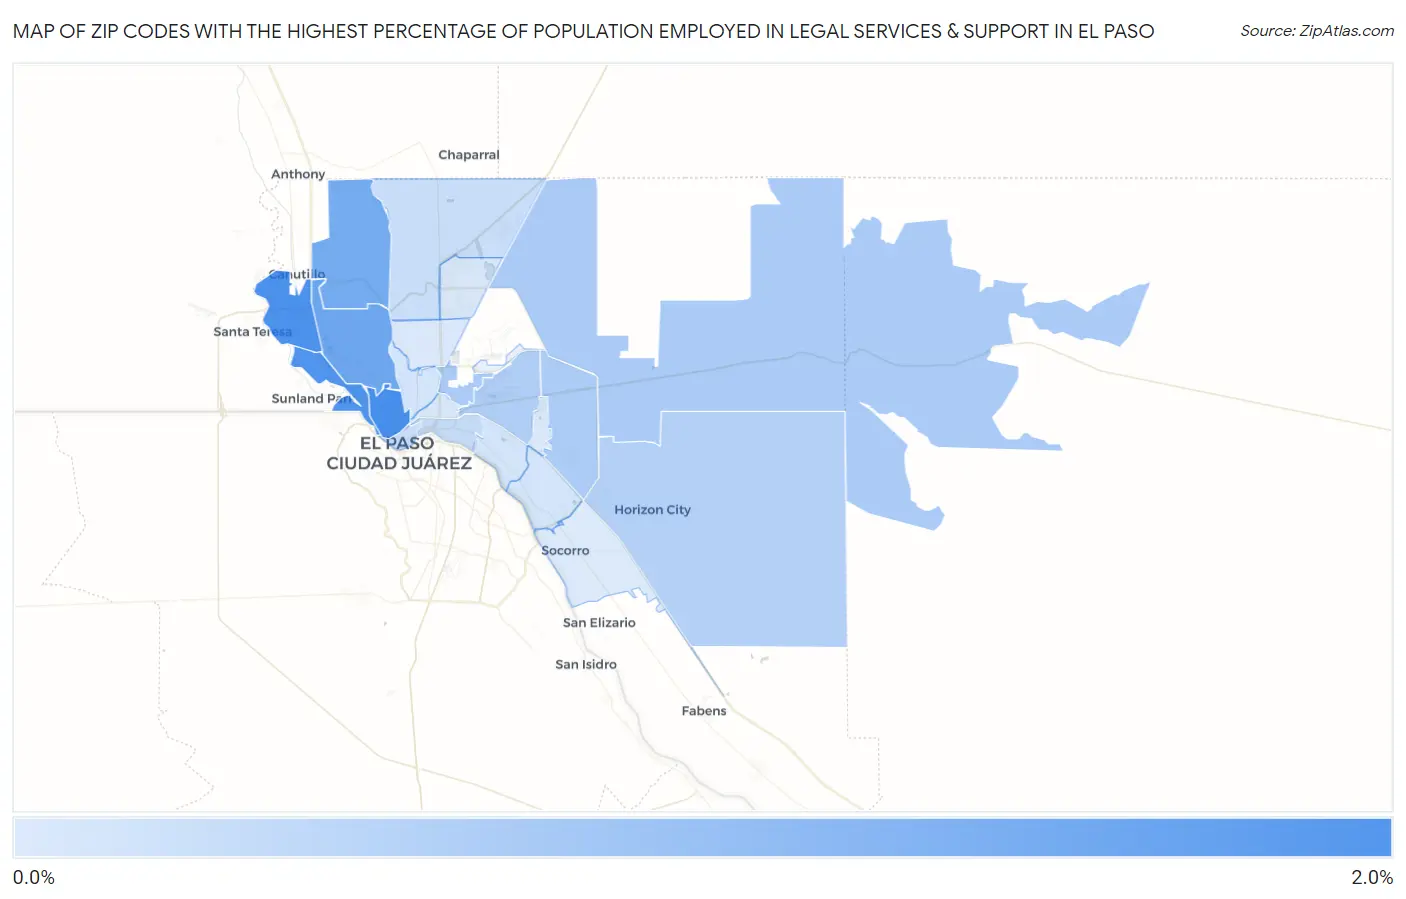
Map of Zip Codes with the Highest Percentage of Population Employed in Legal Services & Support in El Paso
0.12%
1.9%
Zip Codes with the Highest Percentage of Population Employed in Legal Services & Support in El Paso, TX
| Zip Code | % Employed | vs State | vs National | |
| 1. | 79902 | 1.9% | 1.0%(+0.879)#199 | 1.2%(+0.703)#3,757 |
| 2. | 79932 | 1.8% | 1.0%(+0.812)#215 | 1.2%(+0.636)#3,948 |
| 3. | 79922 | 1.8% | 1.0%(+0.764)#220 | 1.2%(+0.588)#4,072 |
| 4. | 79912 | 1.4% | 1.0%(+0.425)#285 | 1.2%(+0.249)#5,322 |
| 5. | 79911 | 1.3% | 1.0%(+0.327)#314 | 1.2%(+0.151)#5,761 |
| 6. | 79938 | 0.72% | 1.0%(-0.291)#582 | 1.2%(-0.467)#10,232 |
| 7. | 79906 | 0.70% | 1.0%(-0.307)#596 | 1.2%(-0.483)#10,394 |
| 8. | 79936 | 0.69% | 1.0%(-0.320)#611 | 1.2%(-0.495)#10,516 |
| 9. | 79925 | 0.64% | 1.0%(-0.365)#645 | 1.2%(-0.540)#11,004 |
| 10. | 79928 | 0.61% | 1.0%(-0.400)#675 | 1.2%(-0.576)#11,369 |
| 11. | 79905 | 0.41% | 1.0%(-0.603)#838 | 1.2%(-0.779)#13,789 |
| 12. | 79901 | 0.36% | 1.0%(-0.651)#880 | 1.2%(-0.827)#14,370 |
| 13. | 79934 | 0.35% | 1.0%(-0.662)#889 | 1.2%(-0.838)#14,502 |
| 14. | 79907 | 0.24% | 1.0%(-0.771)#971 | 1.2%(-0.947)#15,796 |
| 15. | 79915 | 0.22% | 1.0%(-0.789)#986 | 1.2%(-0.965)#15,991 |
| 16. | 79930 | 0.21% | 1.0%(-0.796)#991 | 1.2%(-0.972)#16,069 |
| 17. | 79924 | 0.18% | 1.0%(-0.829)#1,013 | 1.2%(-1.00)#16,401 |
| 18. | 79935 | 0.16% | 1.0%(-0.844)#1,023 | 1.2%(-1.02)#16,547 |
| 19. | 79903 | 0.16% | 1.0%(-0.850)#1,025 | 1.2%(-1.03)#16,611 |
| 20. | 79904 | 0.15% | 1.0%(-0.858)#1,030 | 1.2%(-1.03)#16,690 |
| 21. | 79927 | 0.12% | 1.0%(-0.892)#1,058 | 1.2%(-1.07)#16,992 |
1
Common Questions
What are the Top 10 Zip Codes with the Highest Percentage of Population Employed in Legal Services & Support in El Paso, TX?
Top 10 Zip Codes with the Highest Percentage of Population Employed in Legal Services & Support in El Paso, TX are:
What zip code has the Highest Percentage of Population Employed in Legal Services & Support in El Paso, TX?
79902 has the Highest Percentage of Population Employed in Legal Services & Support in El Paso, TX with 1.9%.
What is the Percentage of Population Employed in Legal Services & Support in El Paso, TX?
Percentage of Population Employed in Legal Services & Support in El Paso is 0.69%.
What is the Percentage of Population Employed in Legal Services & Support in Texas?
Percentage of Population Employed in Legal Services & Support in Texas is 1.0%.
What is the Percentage of Population Employed in Legal Services & Support in the United States?
Percentage of Population Employed in Legal Services & Support in the United States is 1.2%.